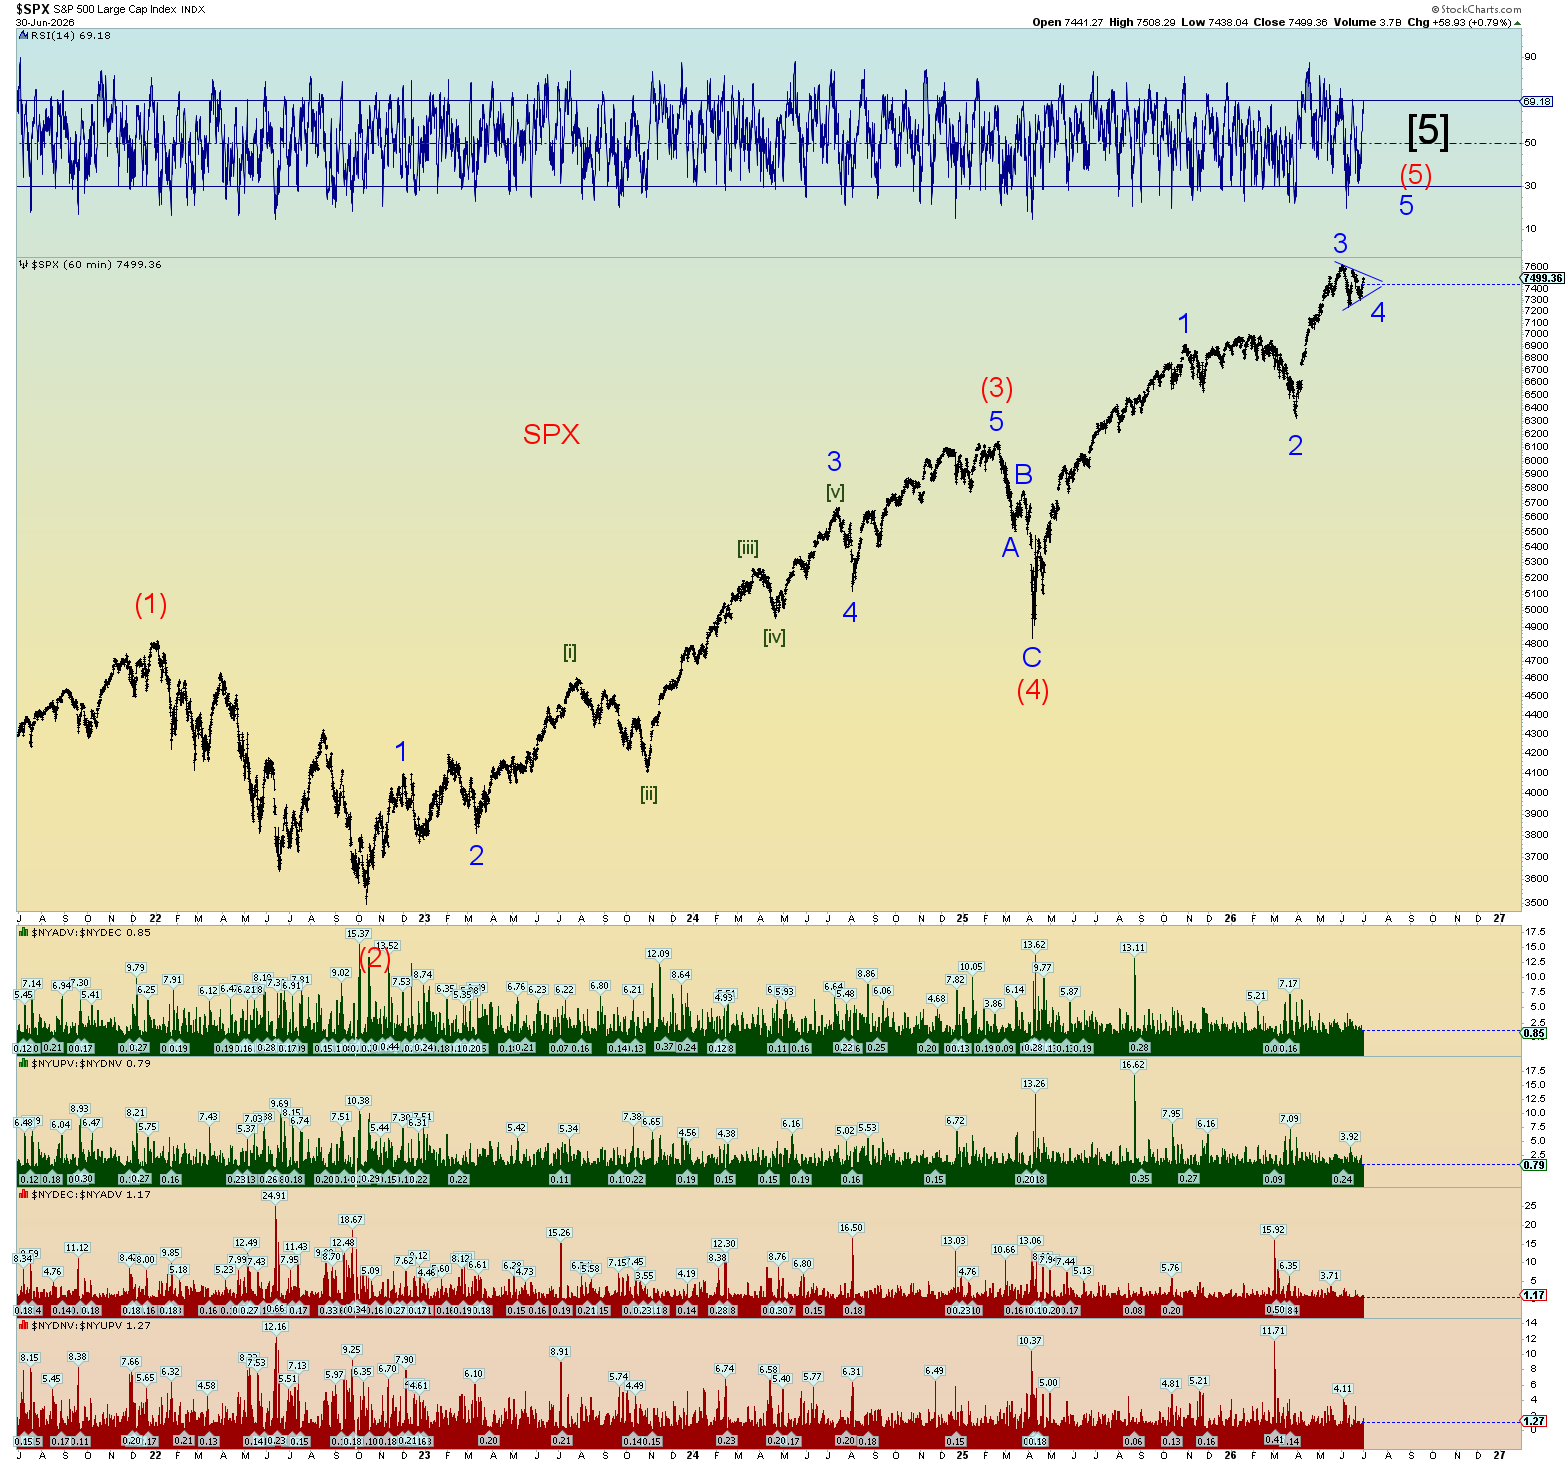
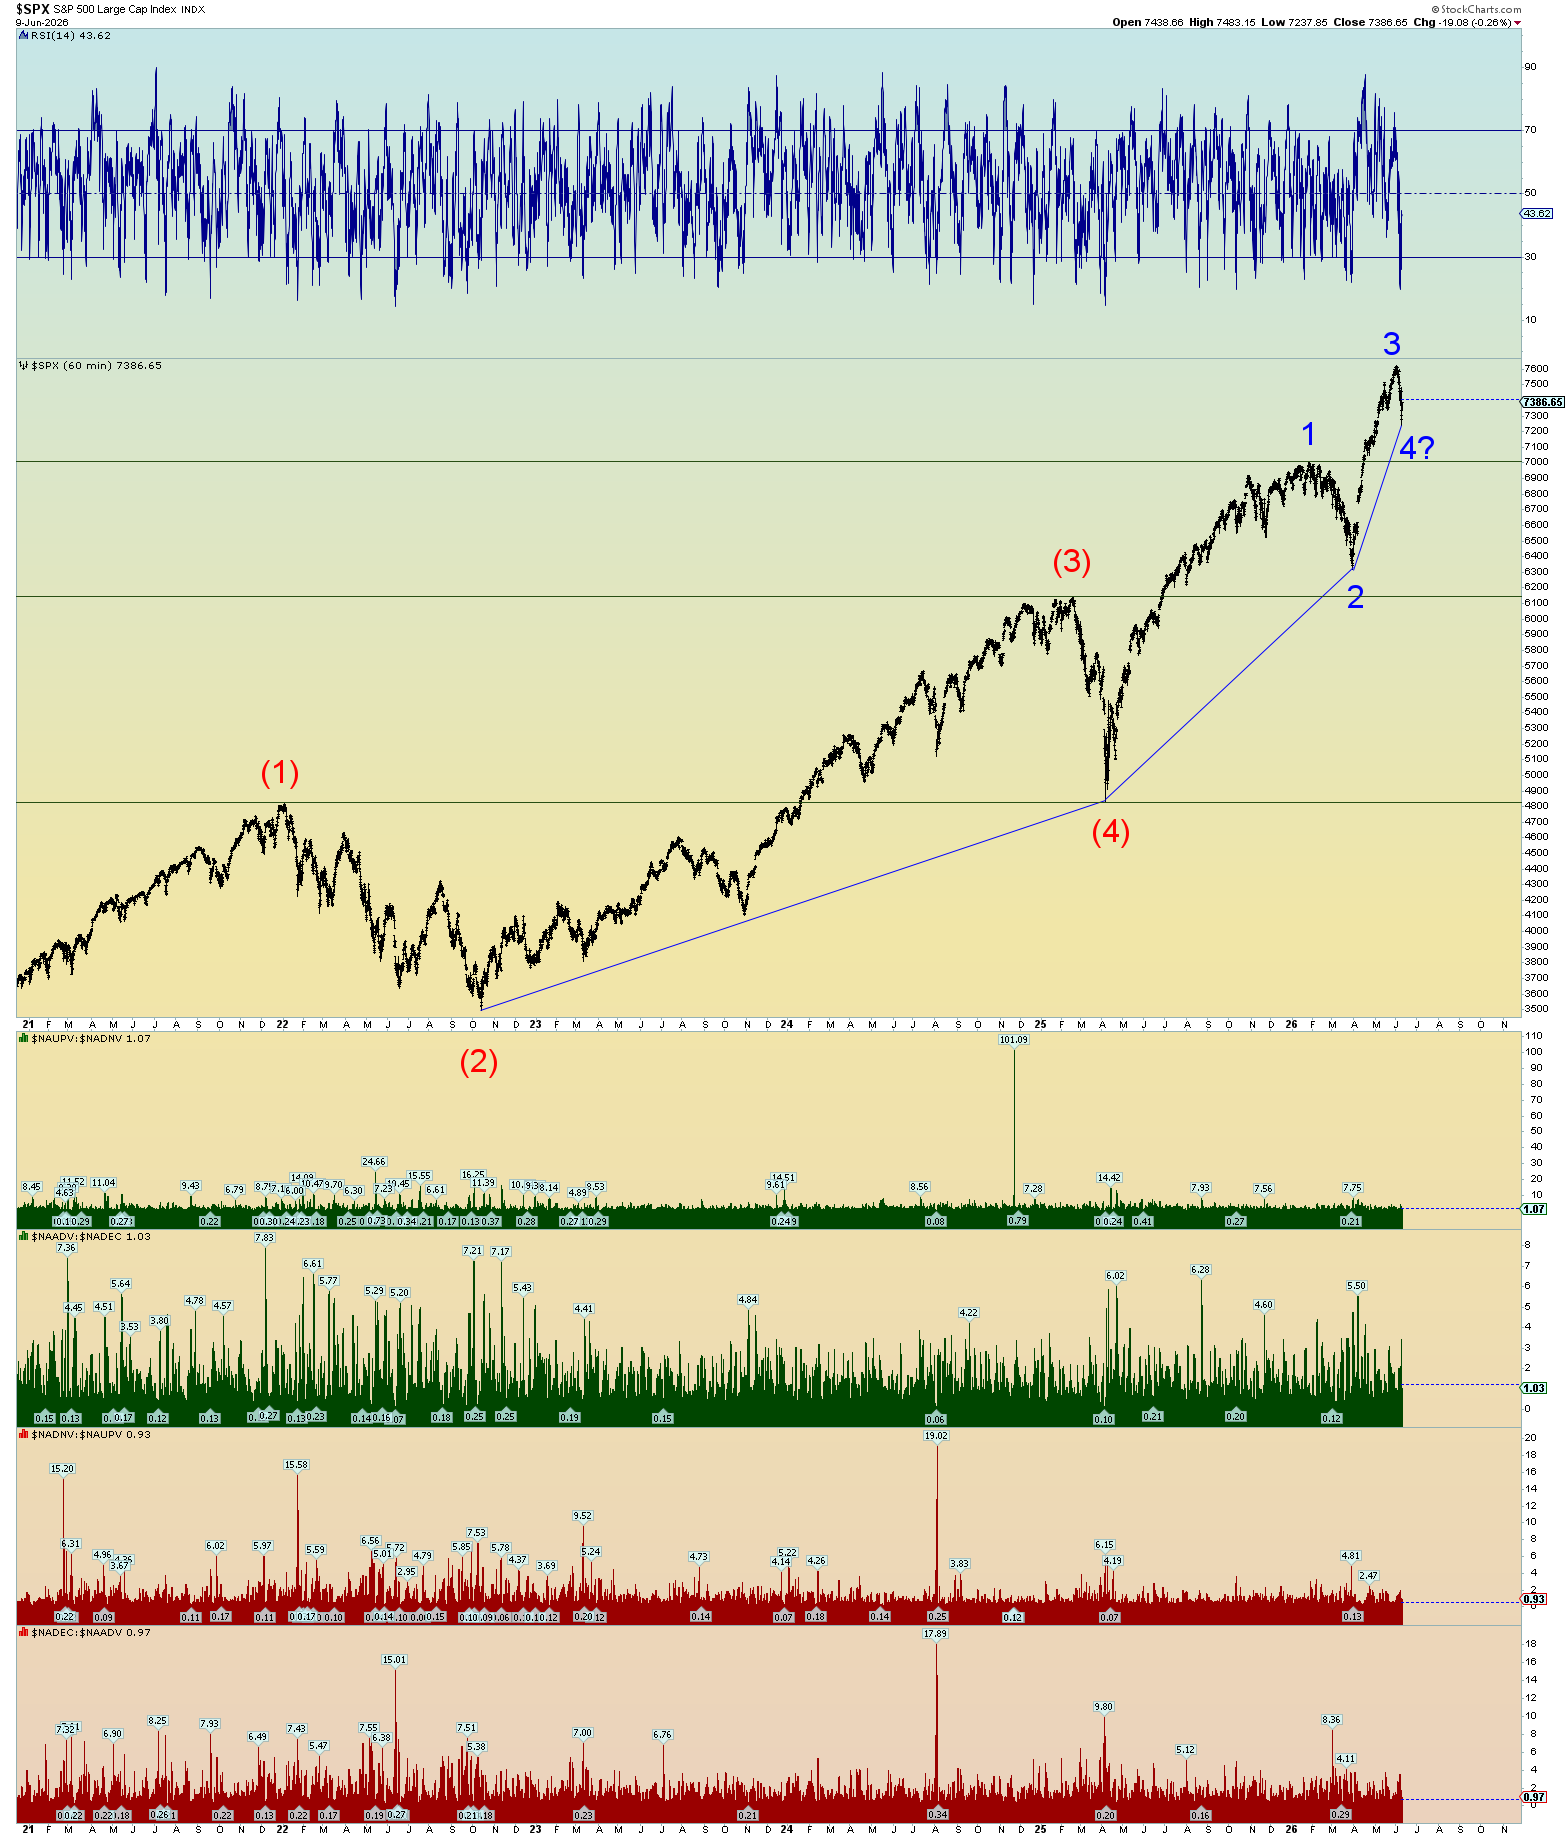
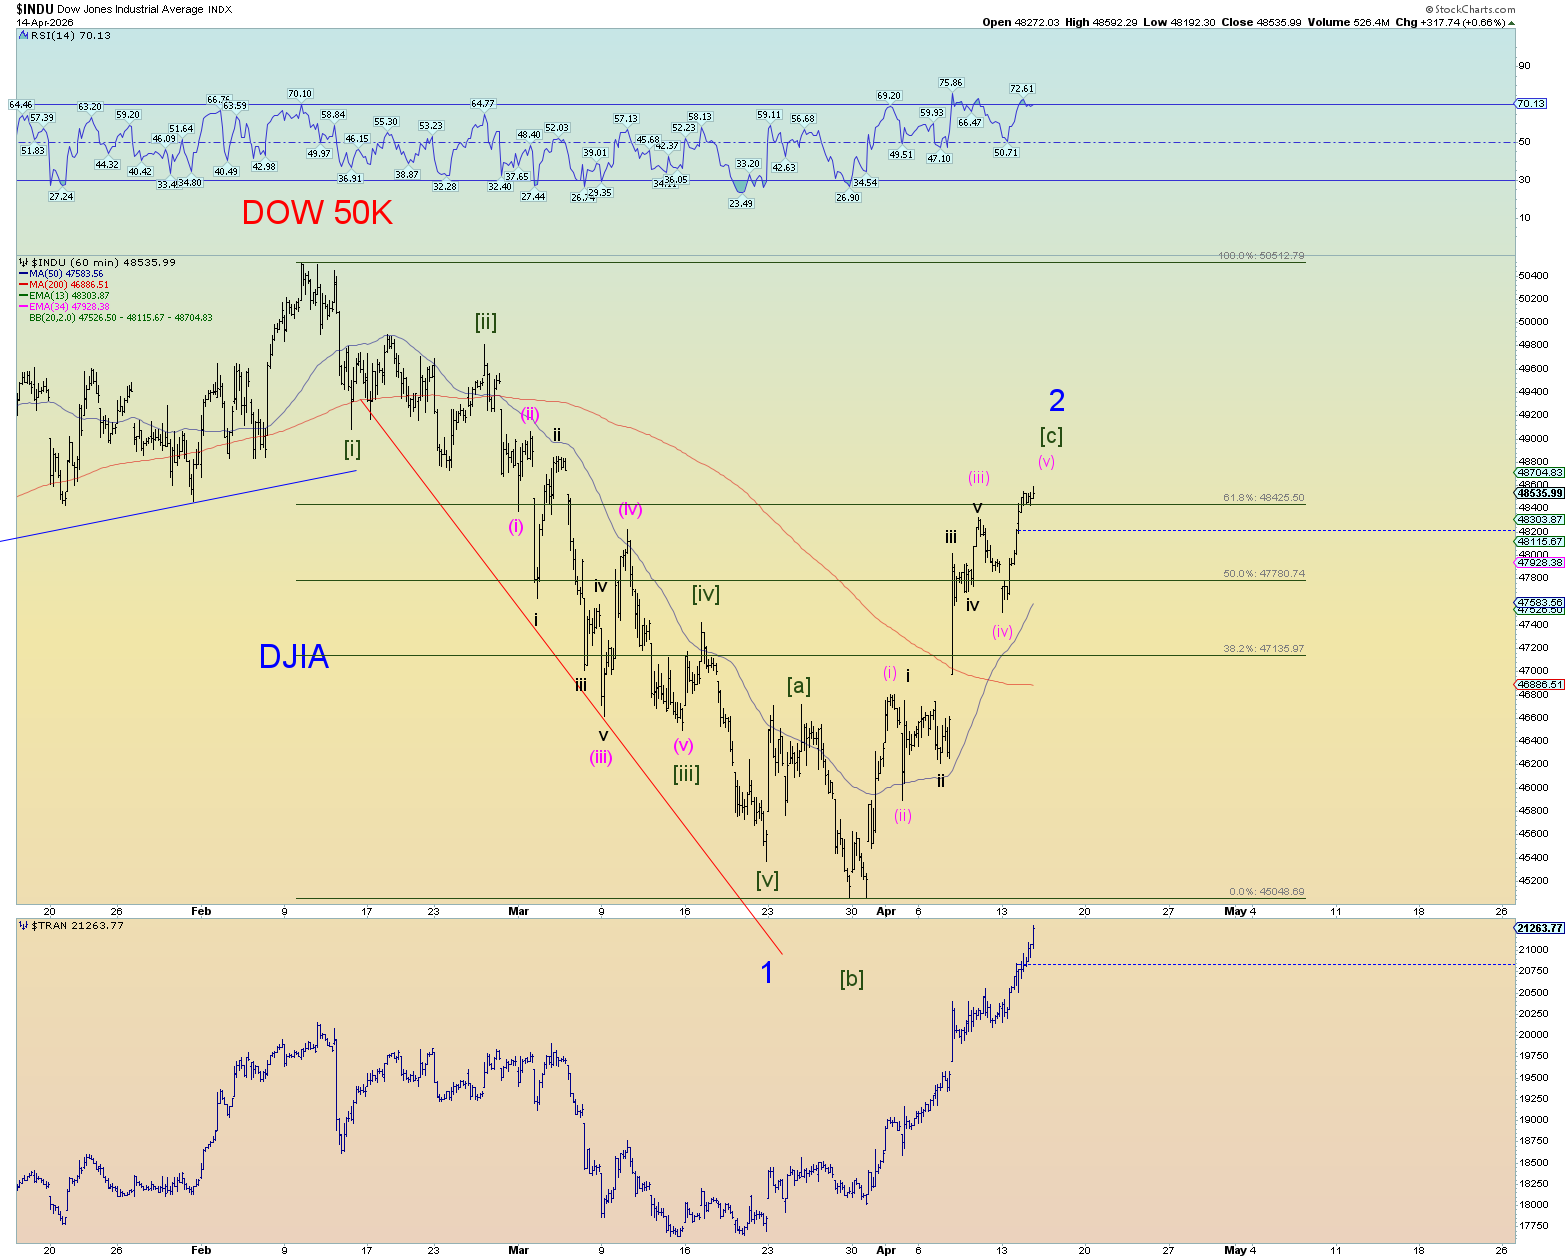
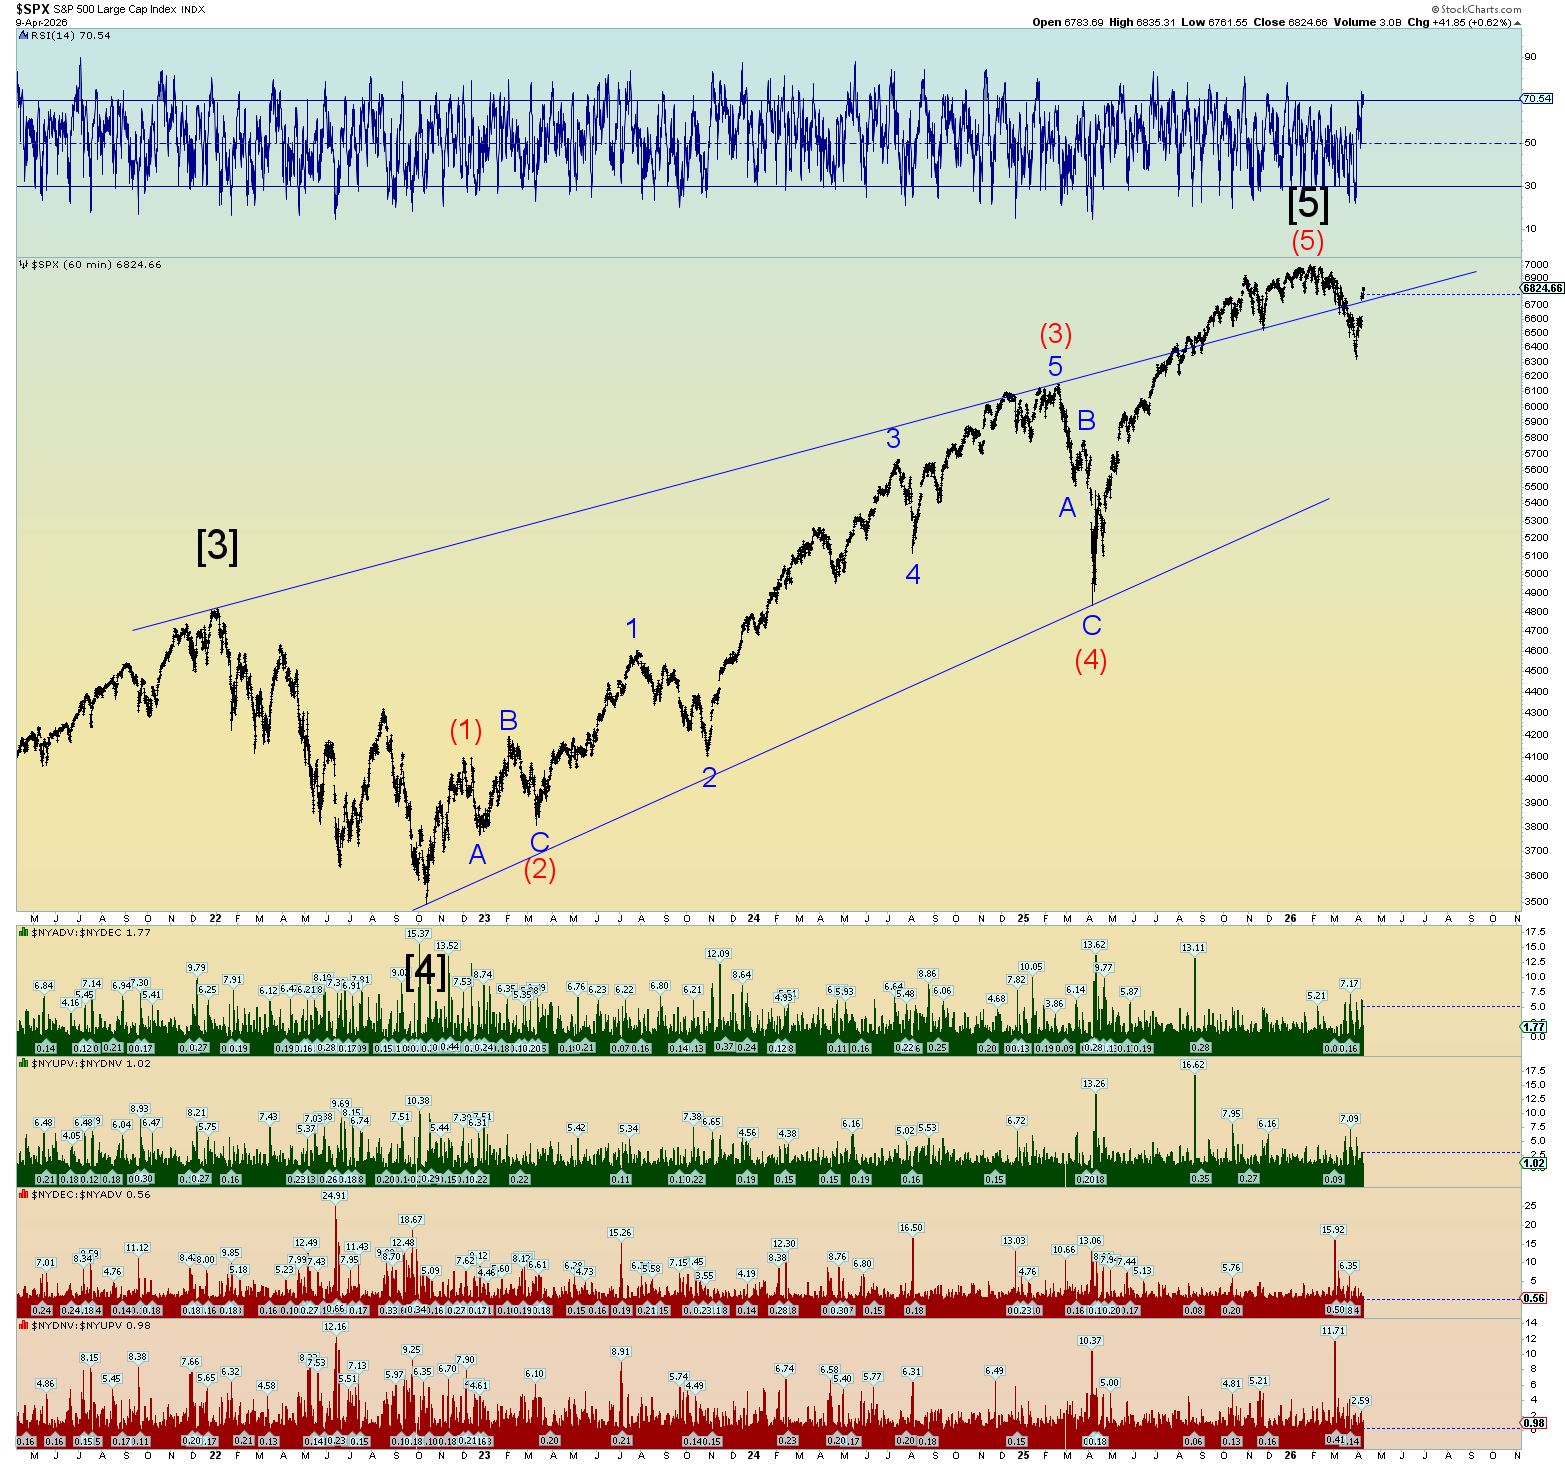
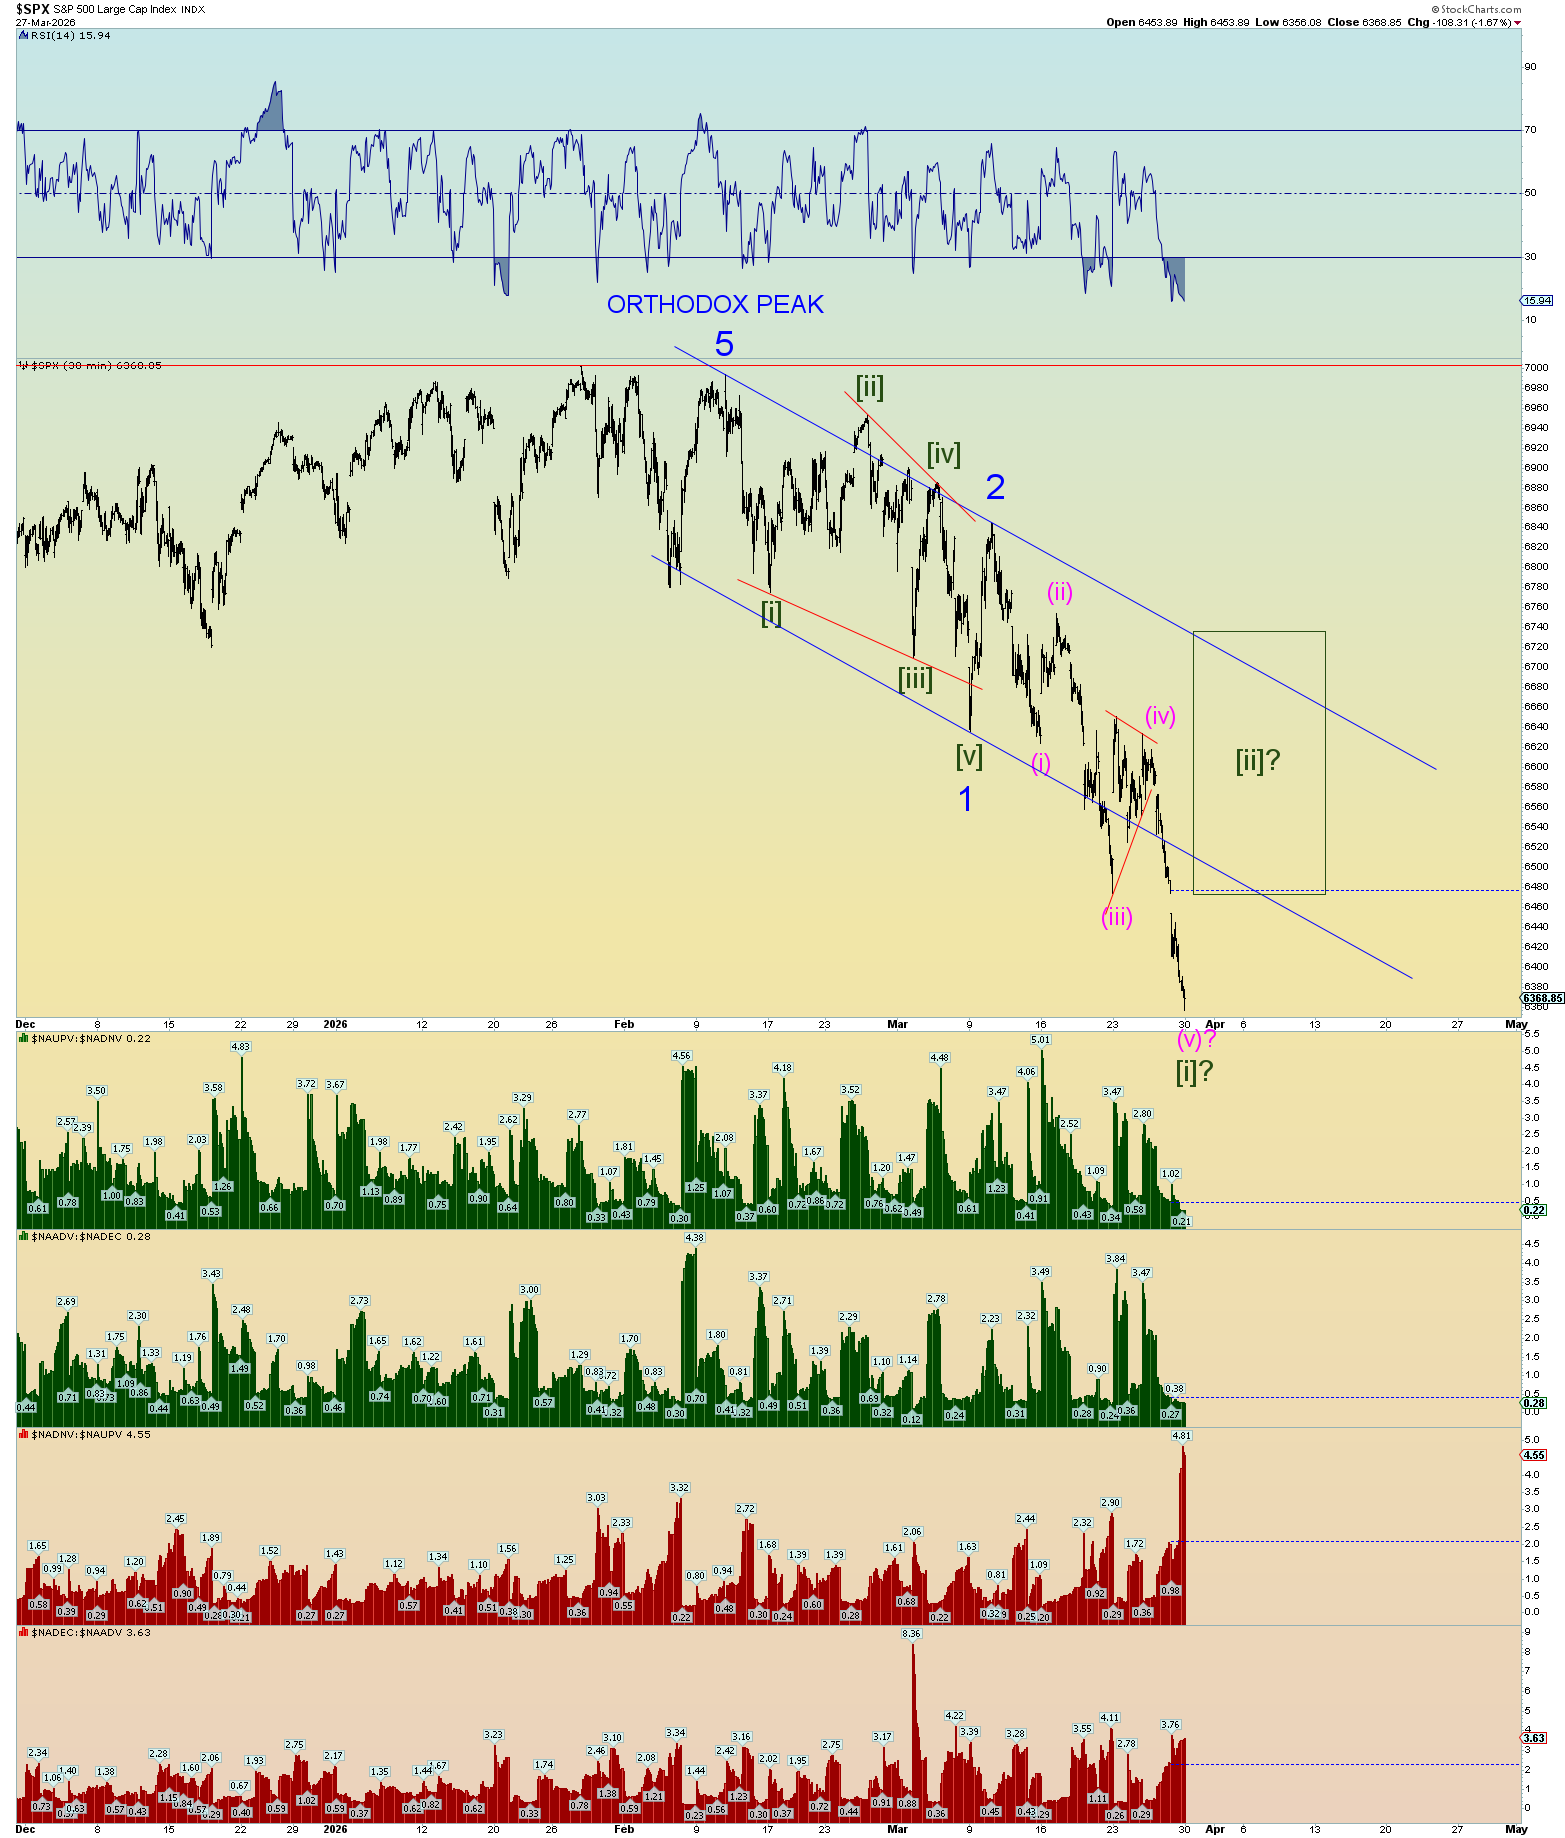
It’s been a few weeks since the last update, but to be honest, I was just being patient in that a predicted triangle pattern was probably playing out. And now we have nearly reached its end. It’s an obvious ascending triangle so the fact that many can recognize this pattern could actually doom it to failure.
Regardless, Minor wave 4 need not be a triangle as it could morph into a more complex corrective pattern continuing to move sideways overall. In the last update, it was noted that, technically speaking, Minor 4 could drop all the way to SPX 7100 and still be valid since it would not have overlapped wave 1’s price range. But yeah, a drop that far would be harder to recover because the market overall is showing extreme signs of bubble behavior and things are being stretched beyond belief. A final burst up here from a triangle would do the wave structure complete justice.
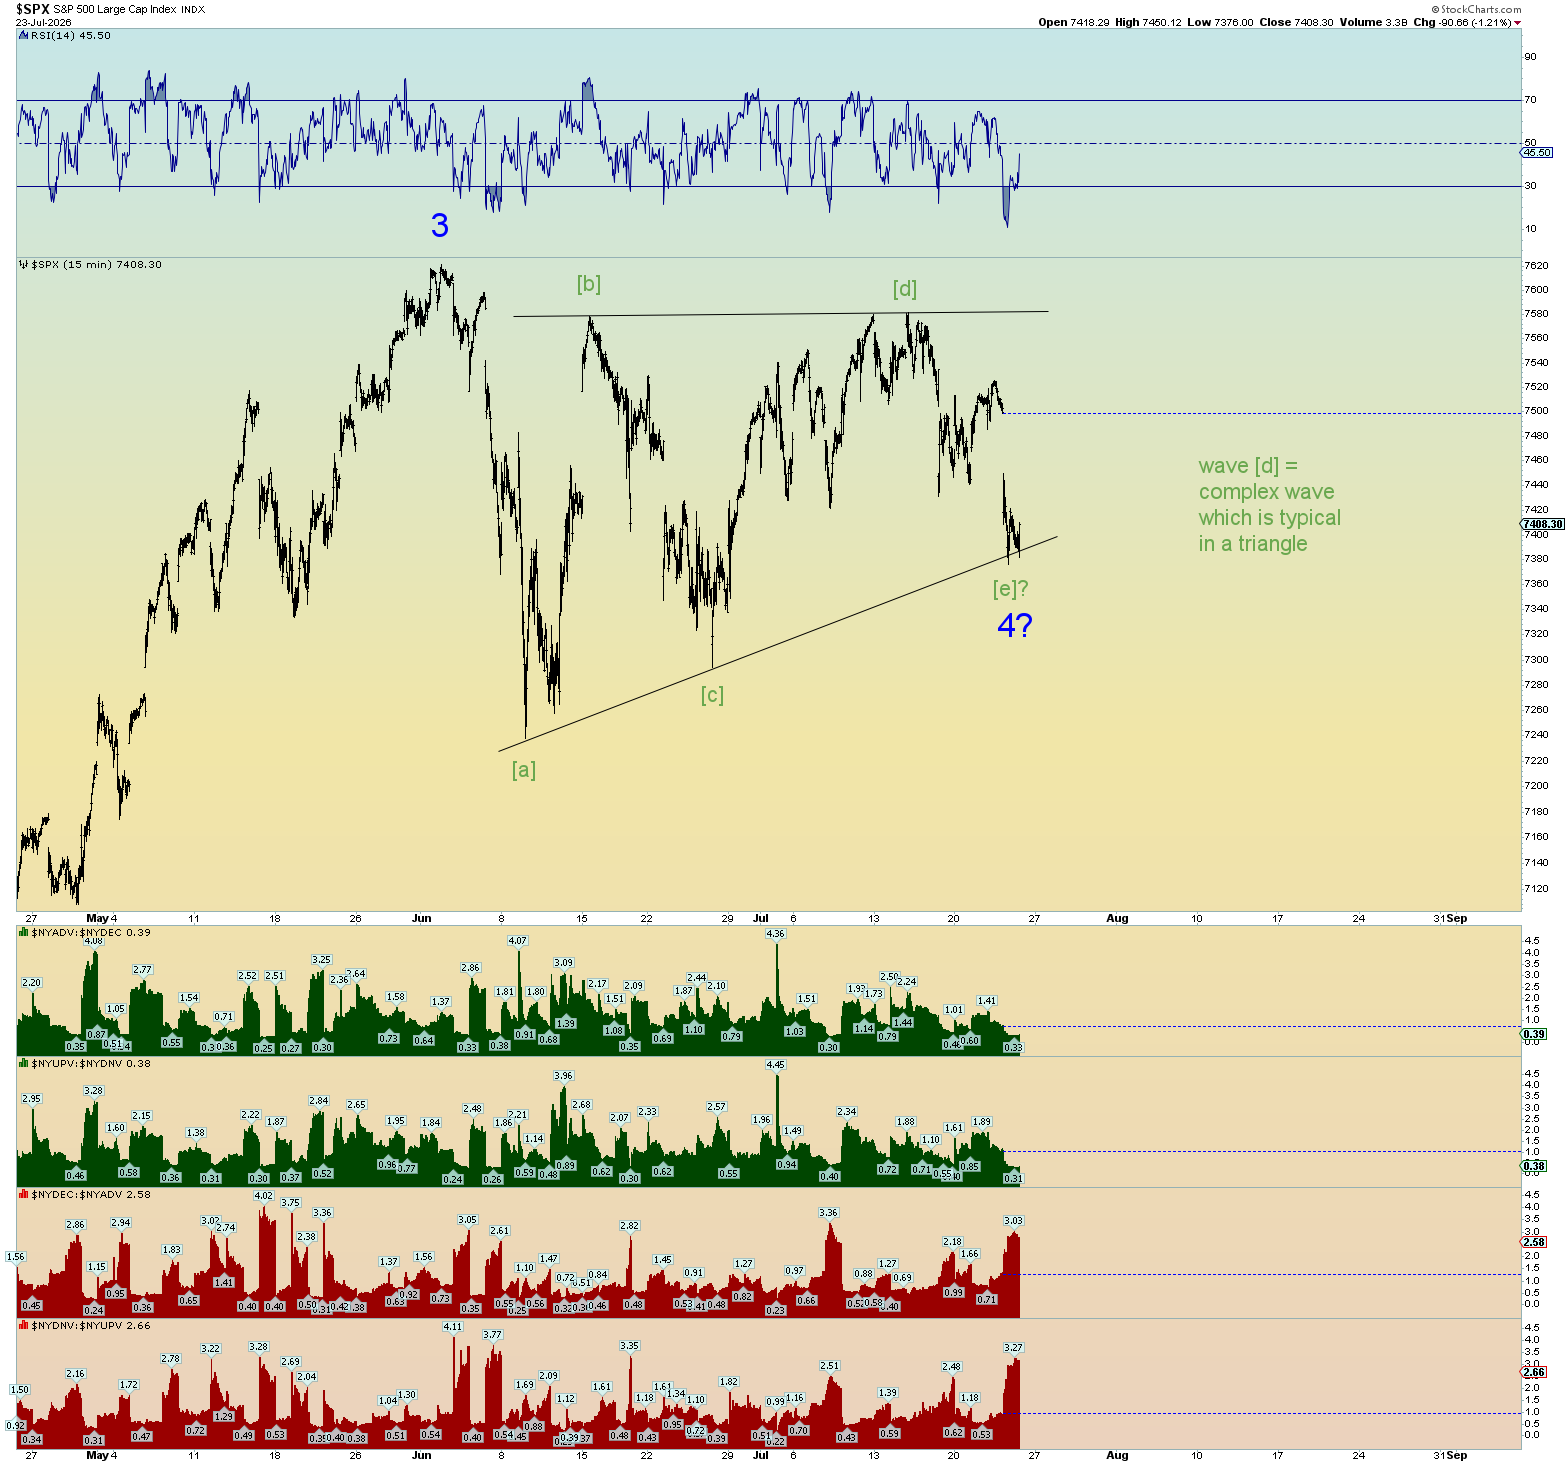
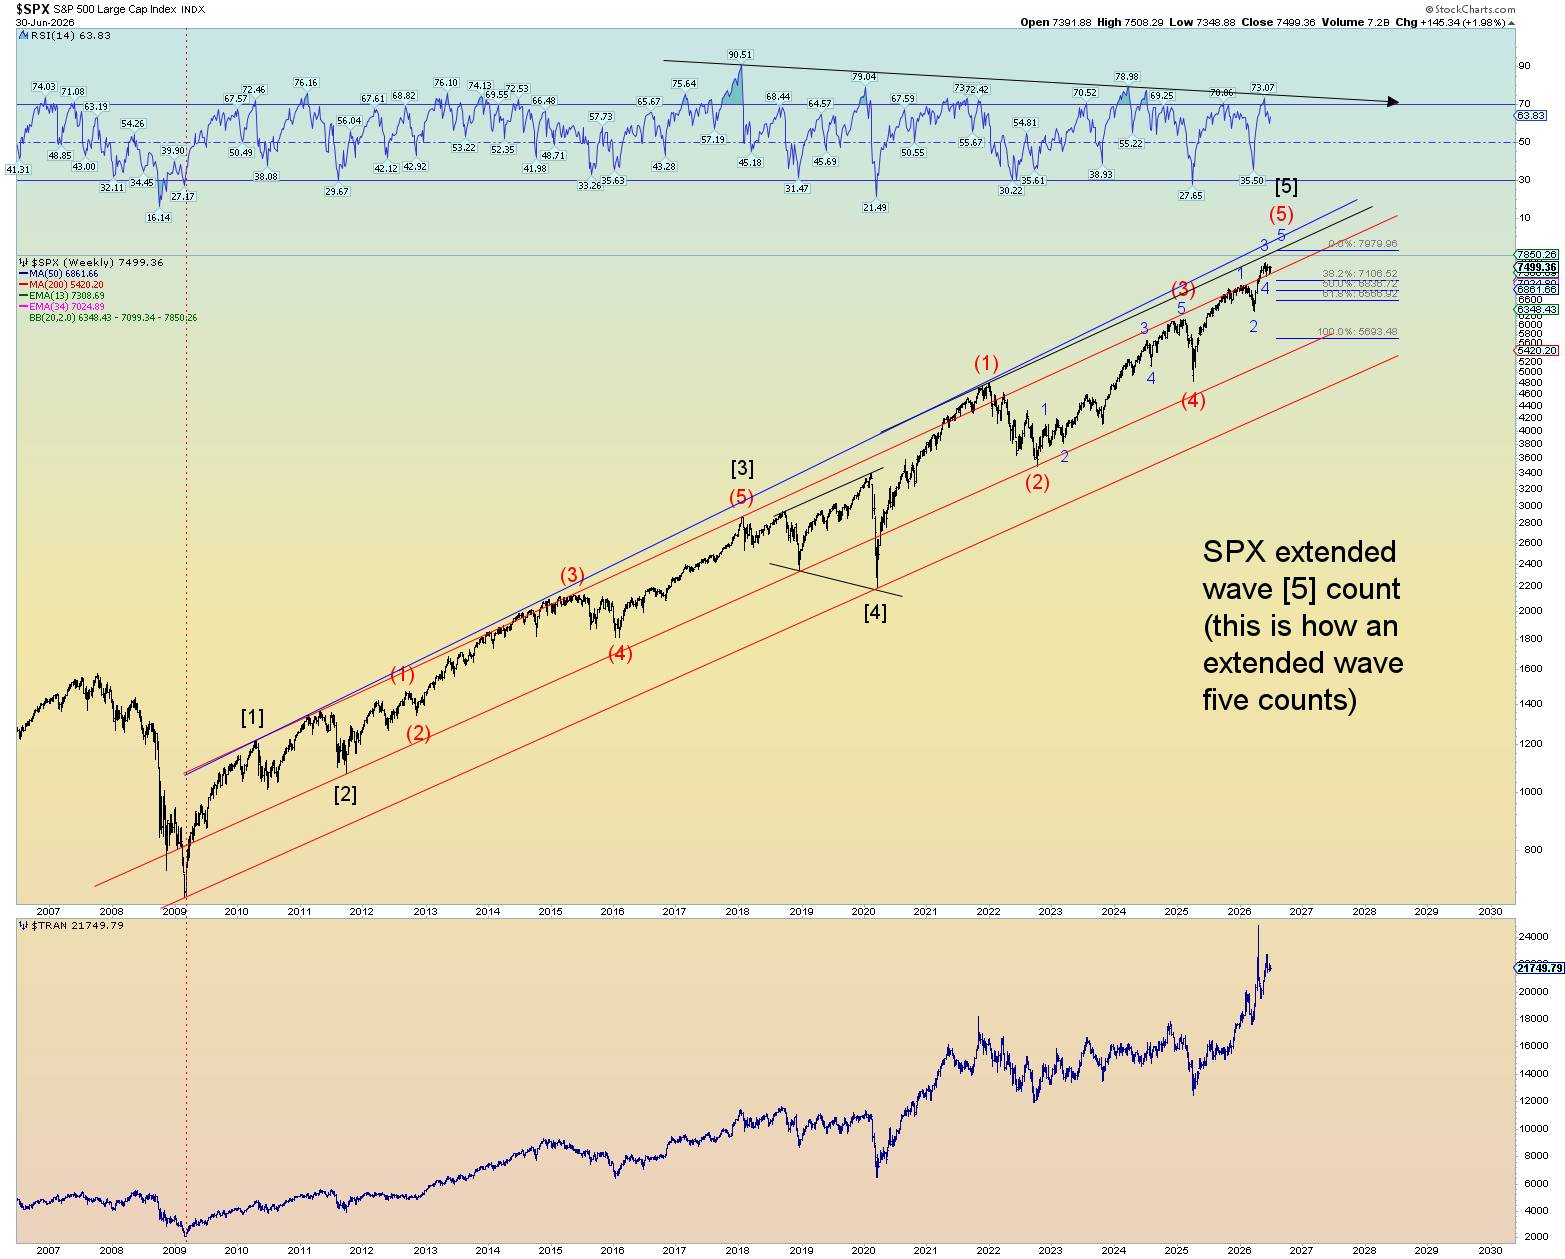
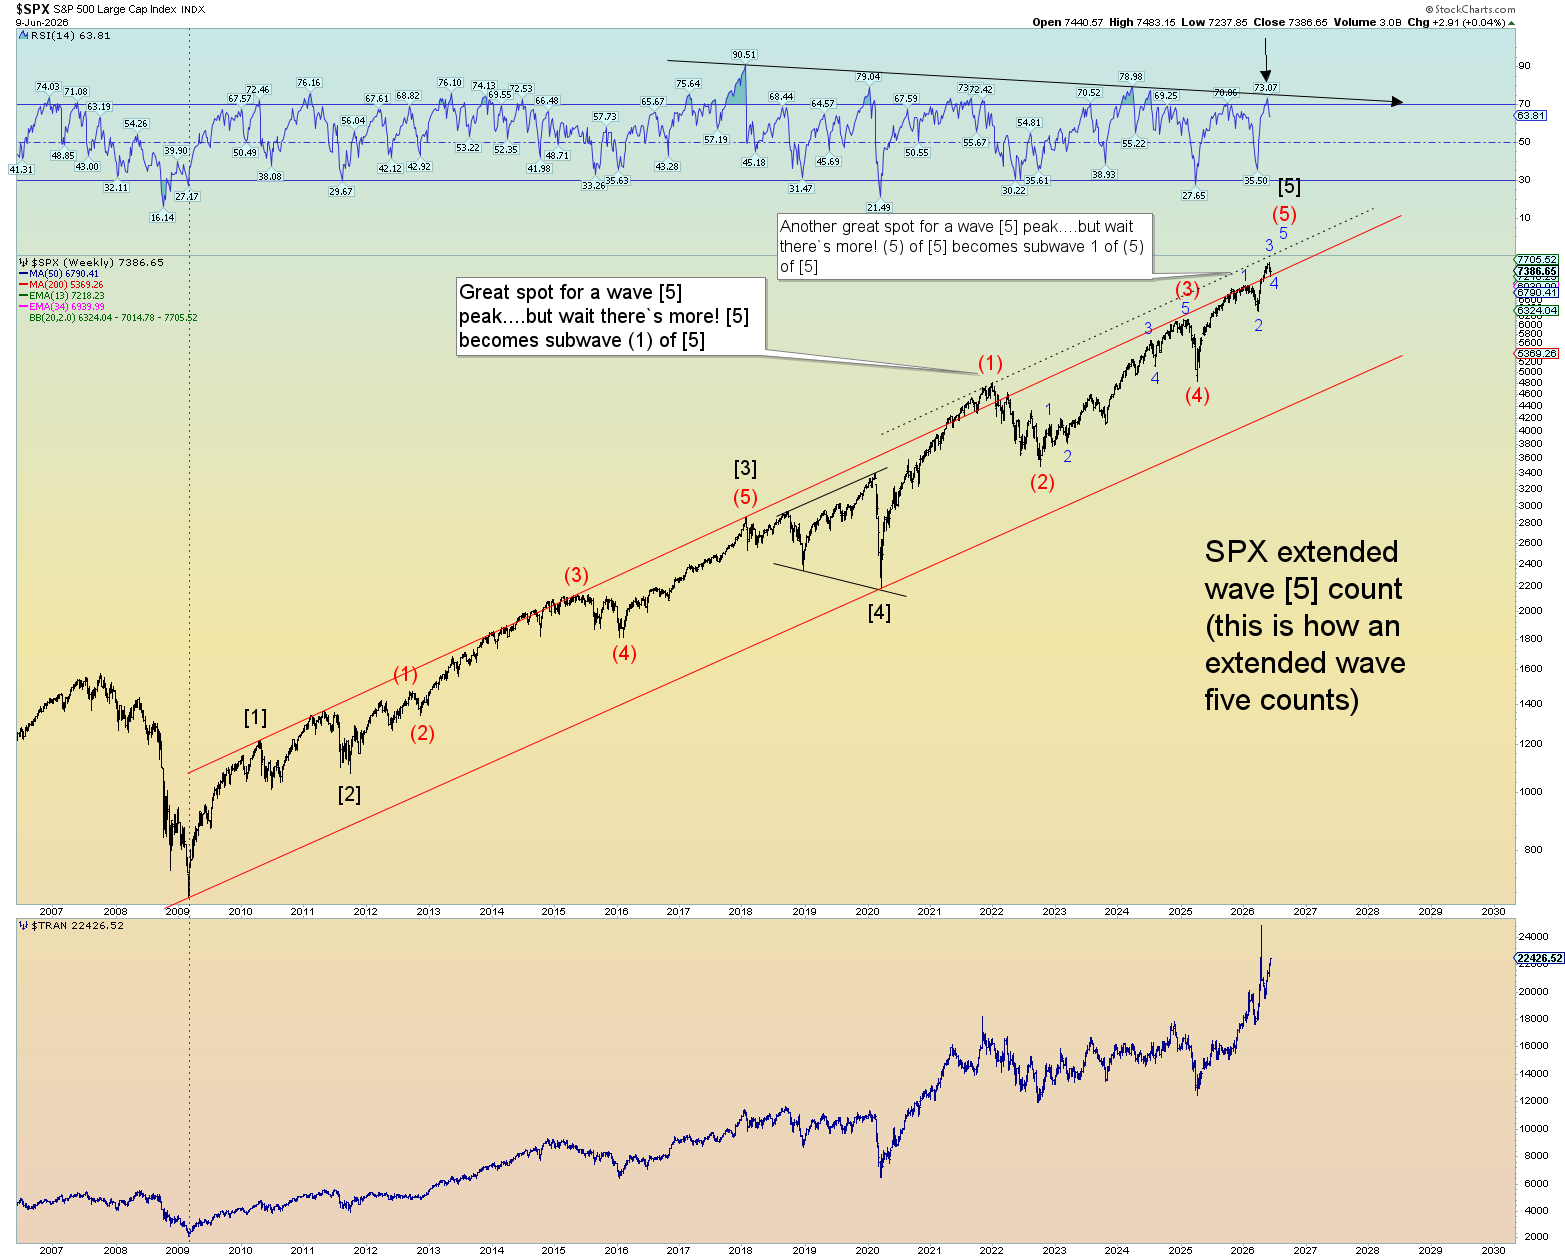
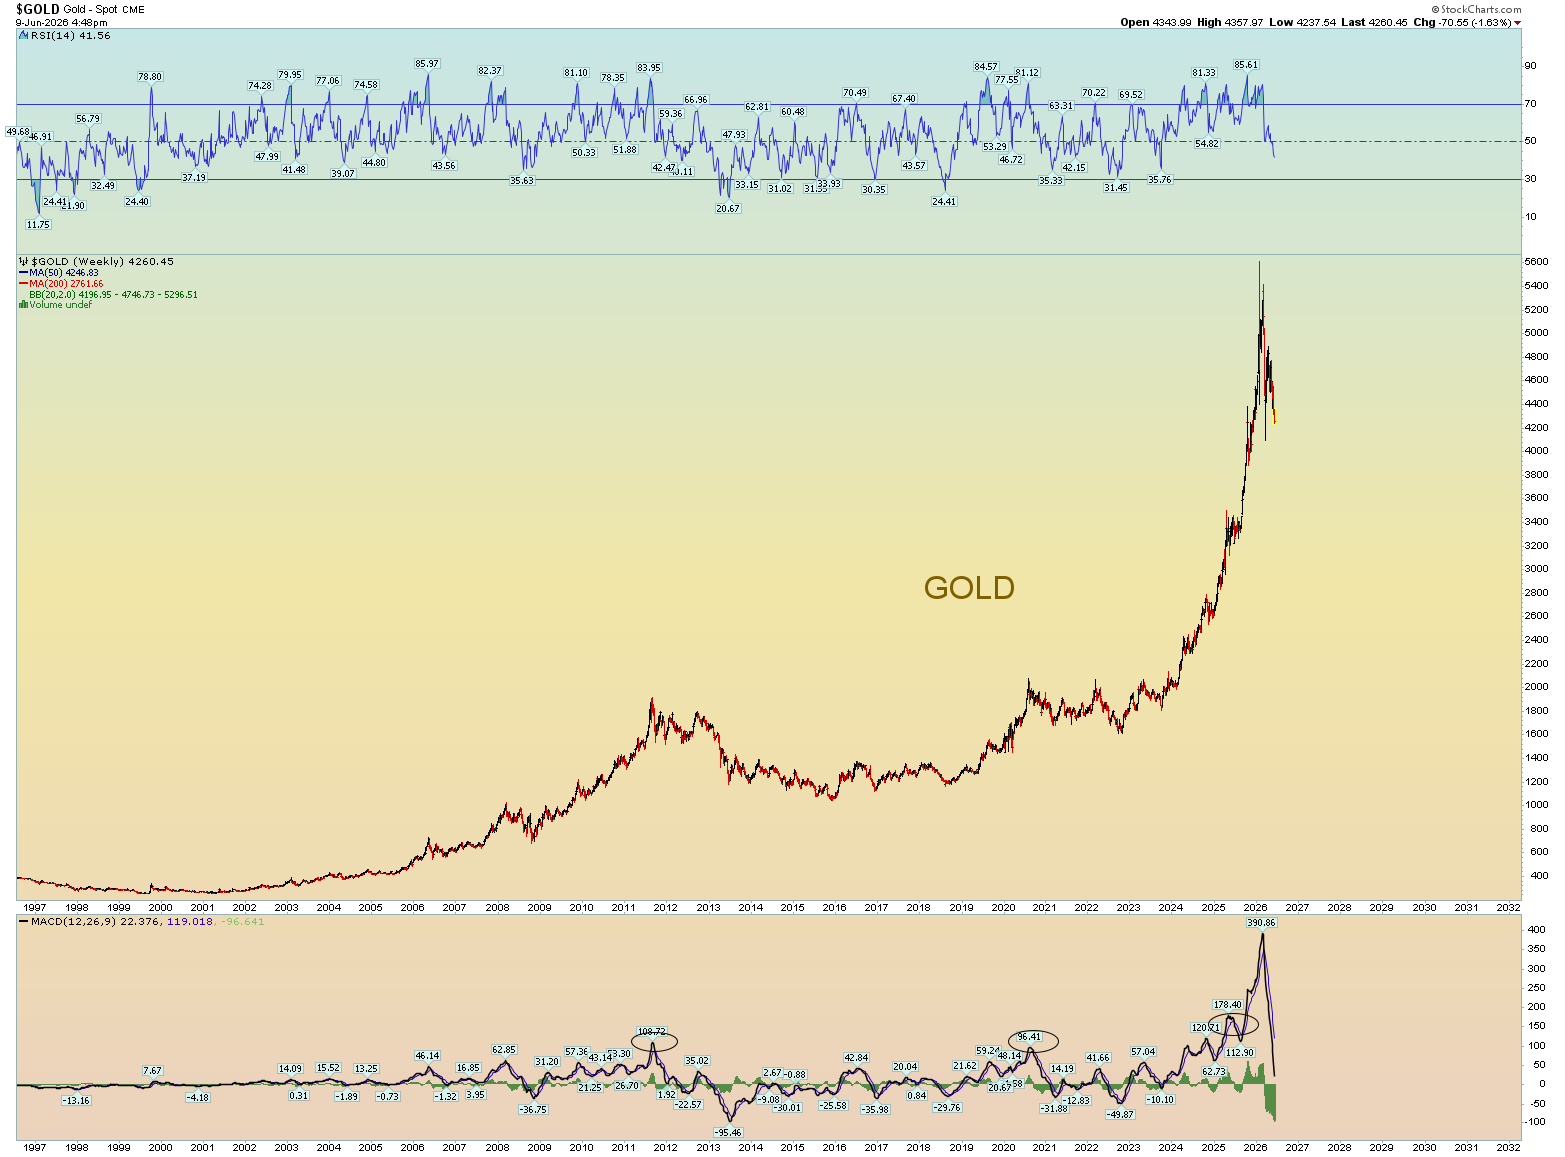
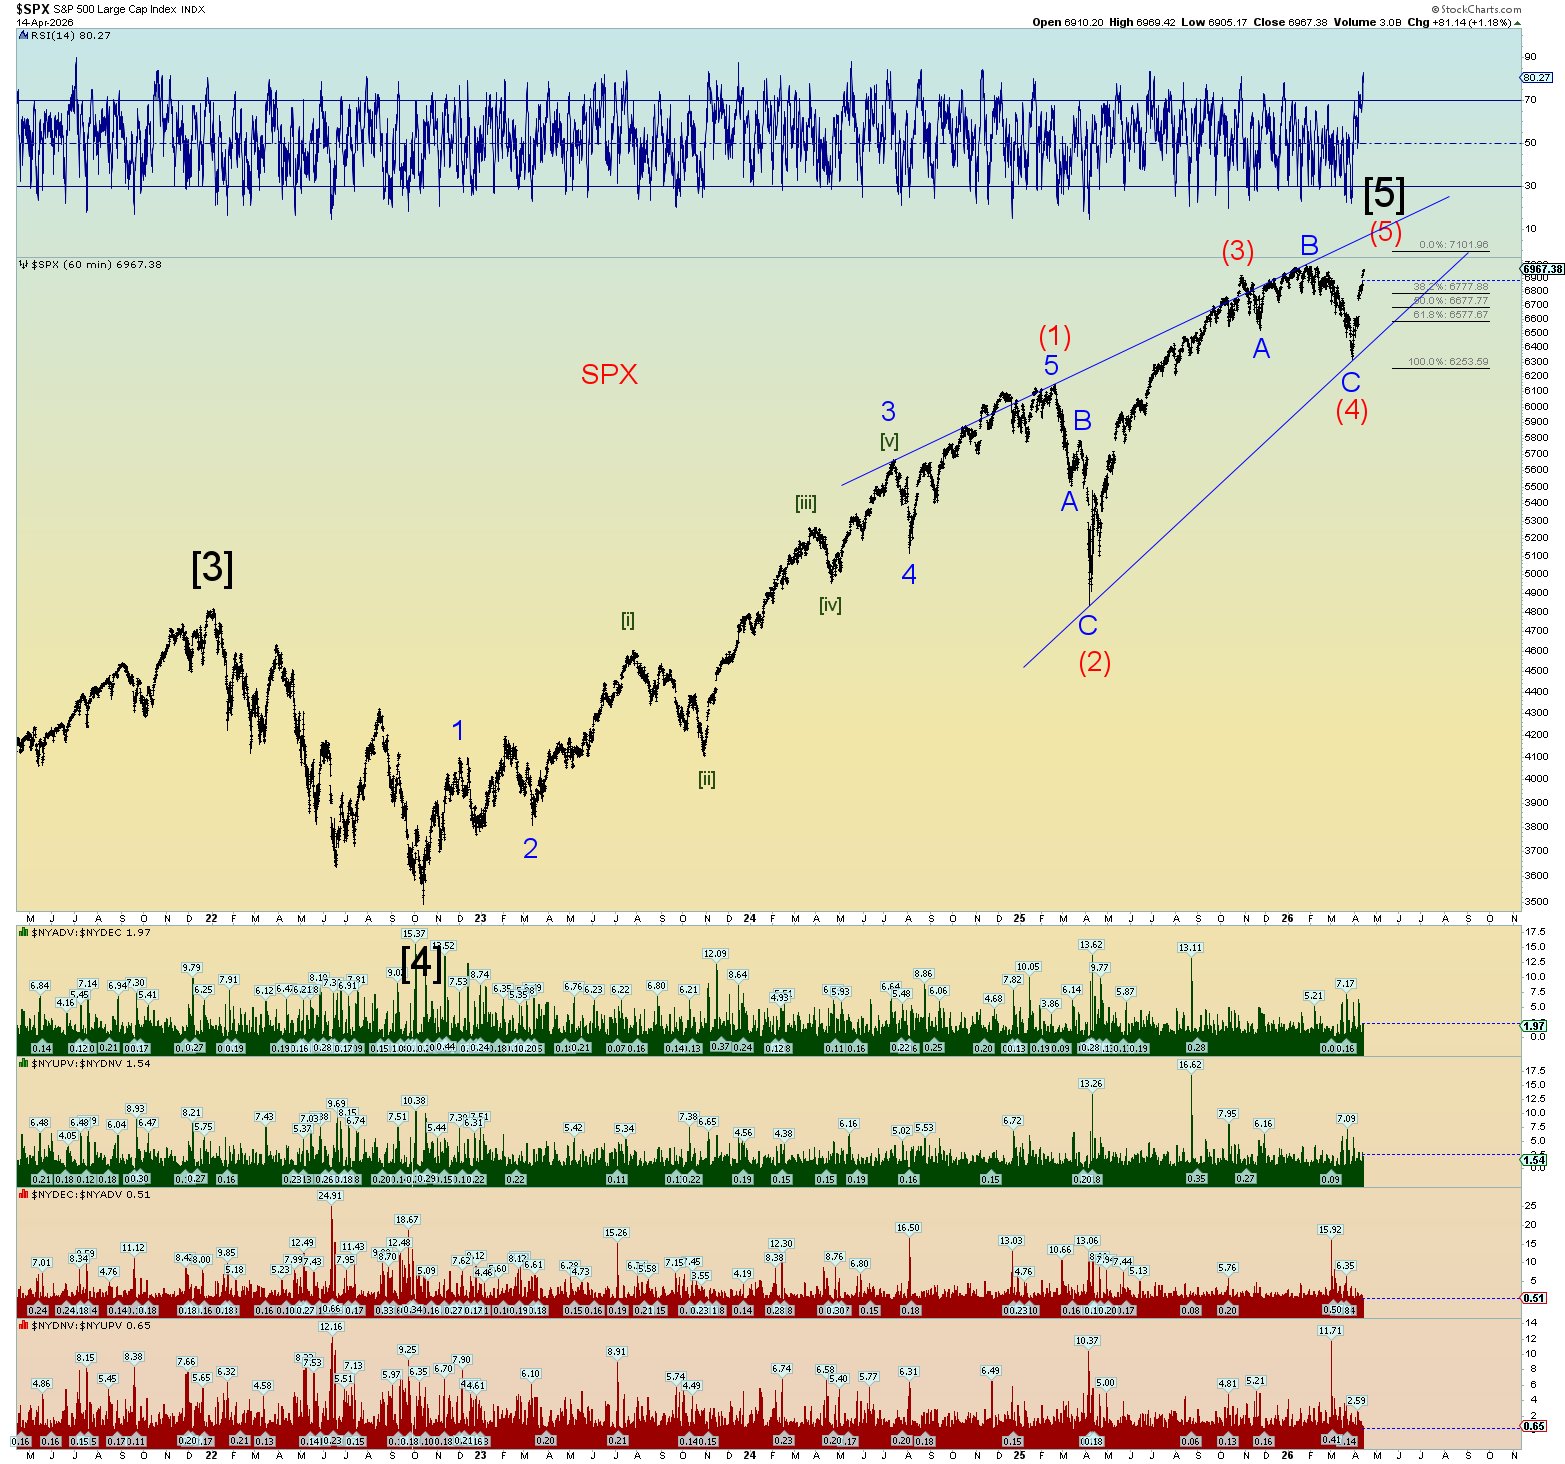
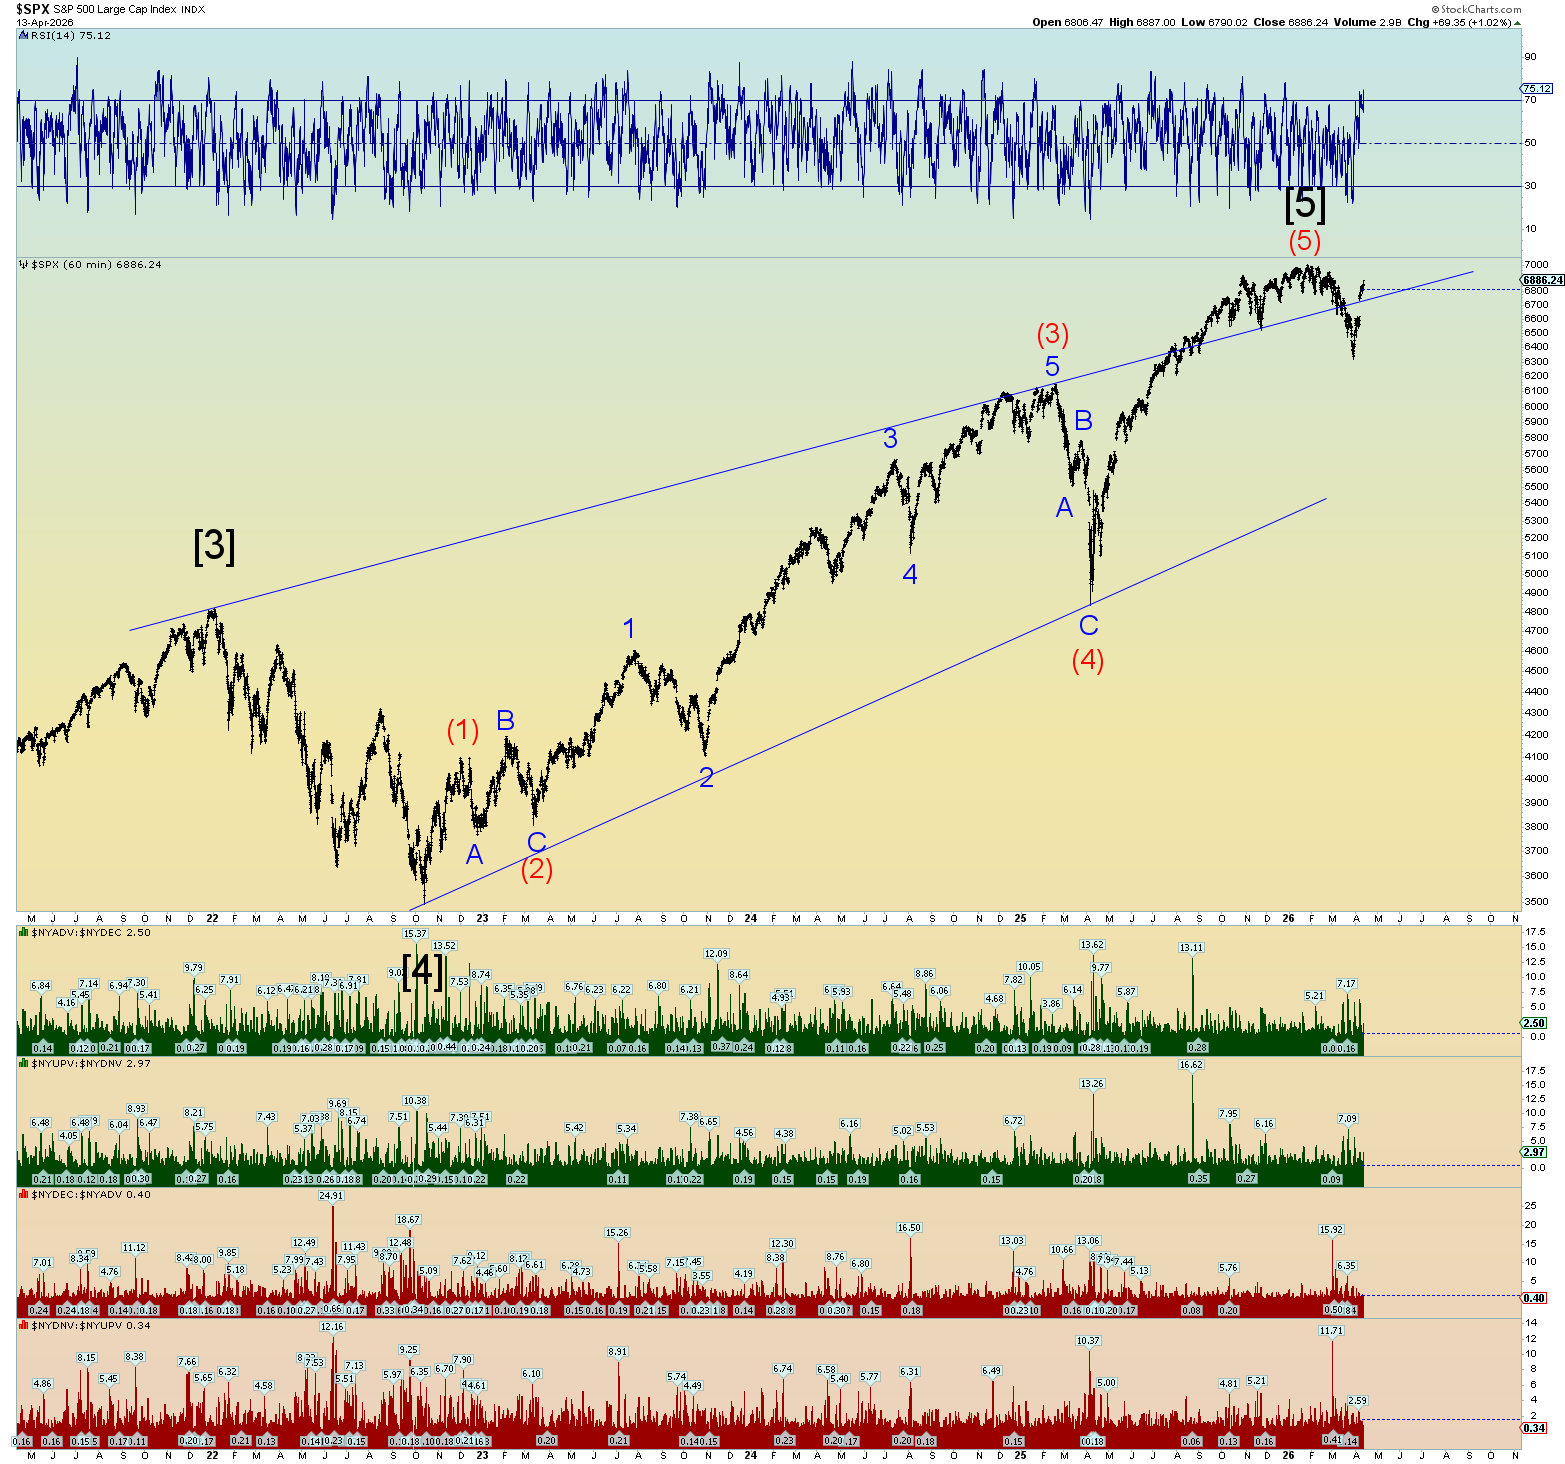
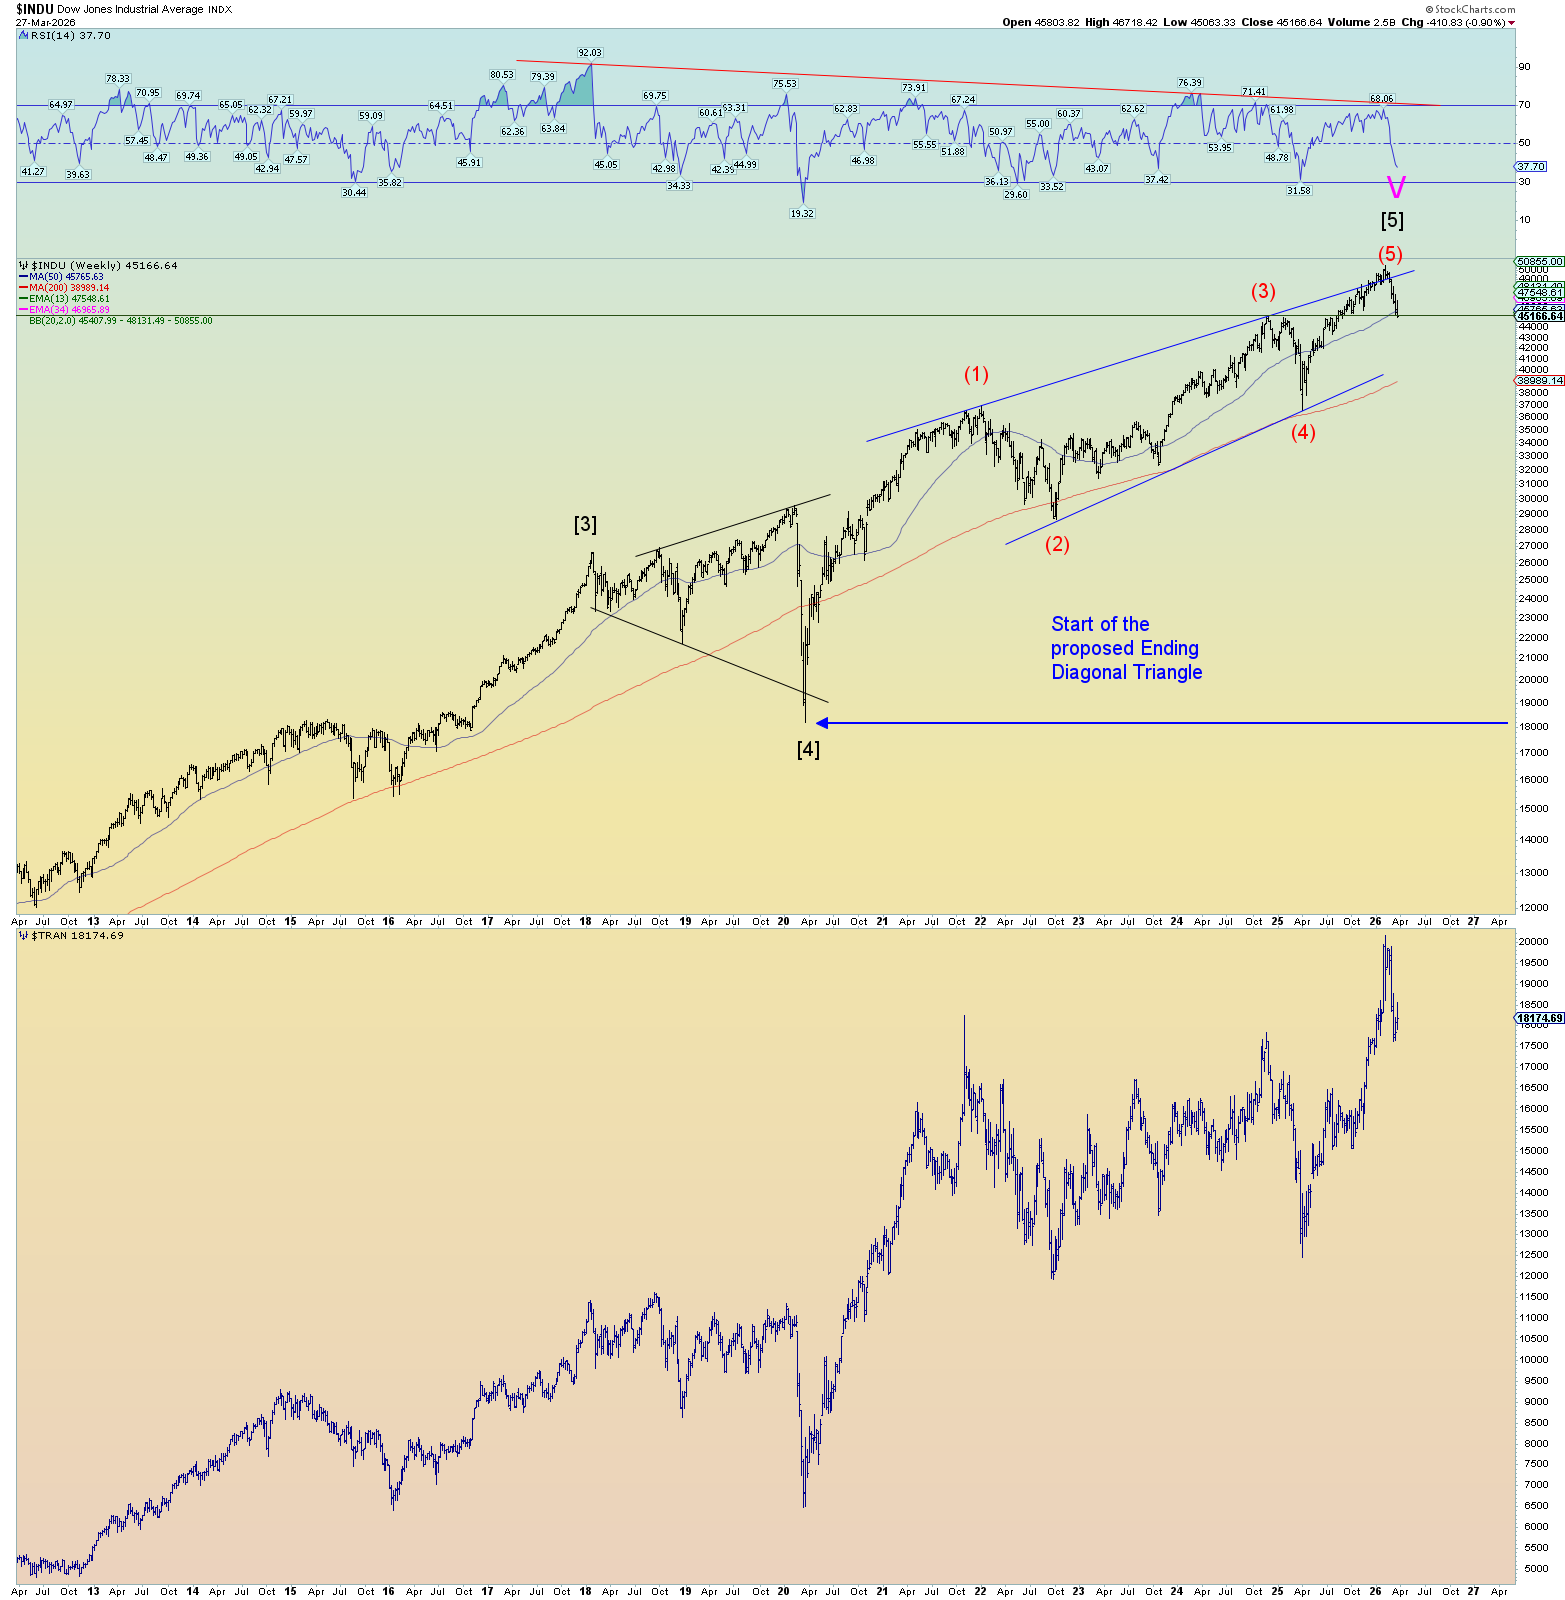
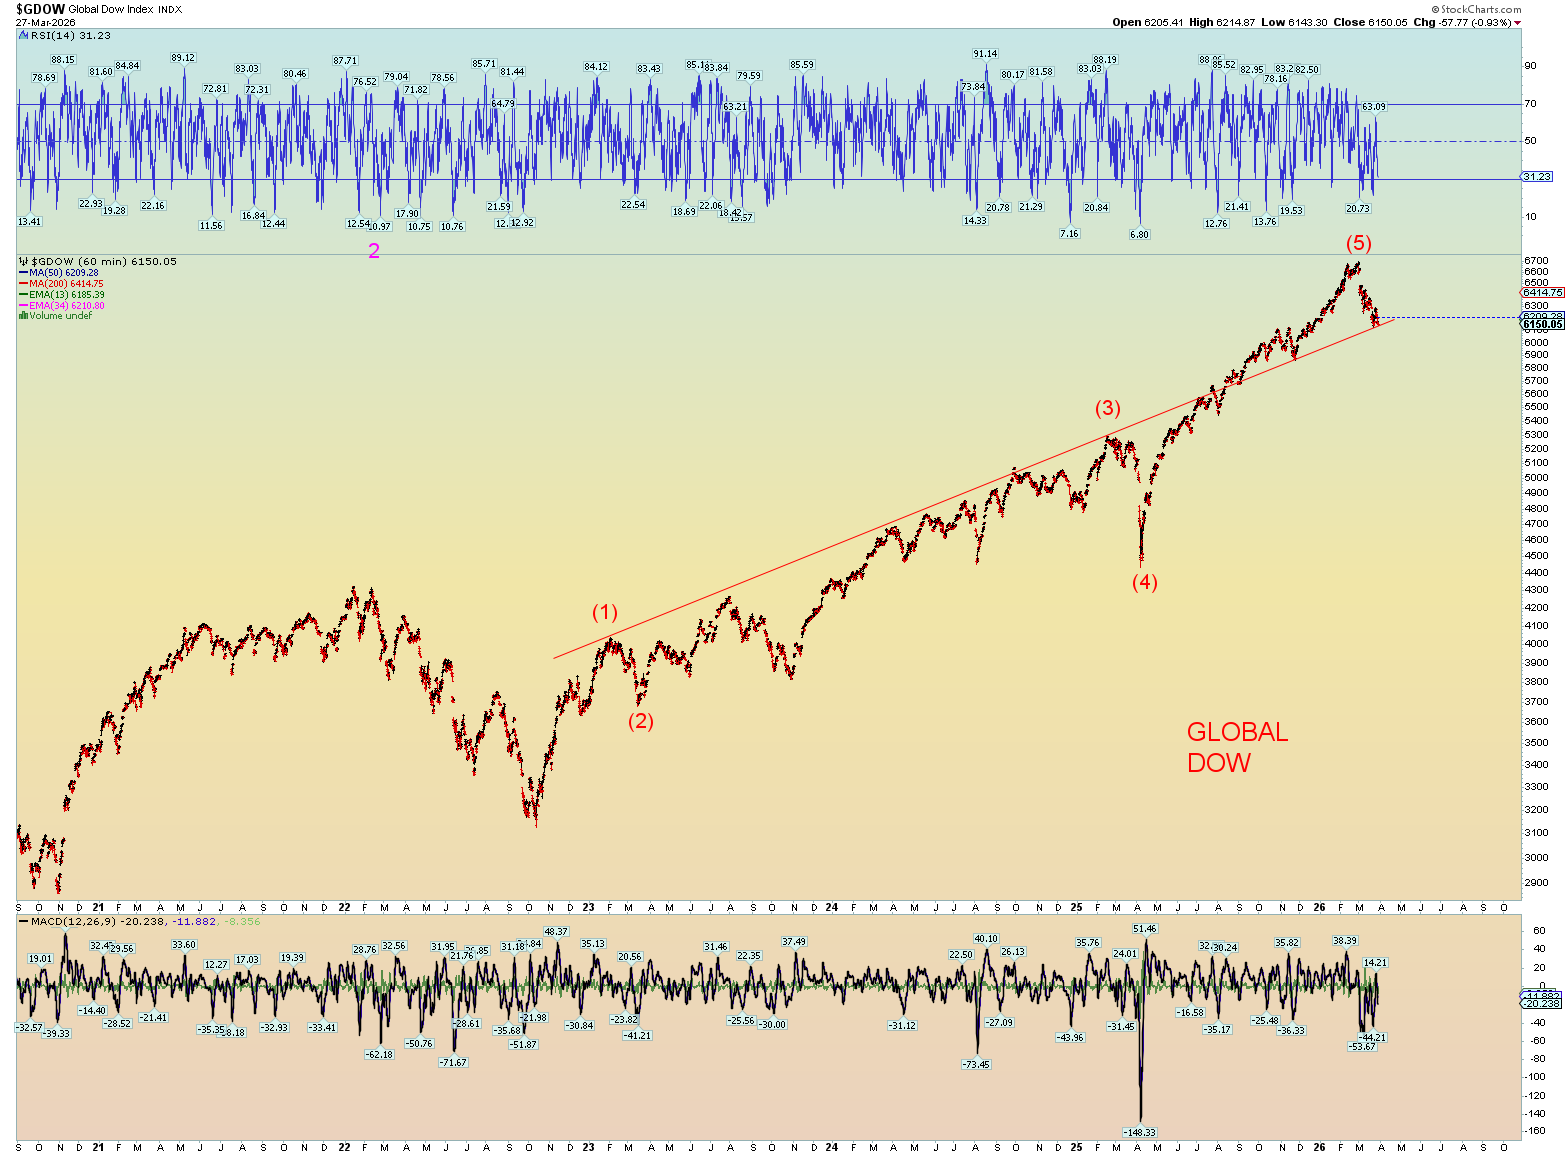
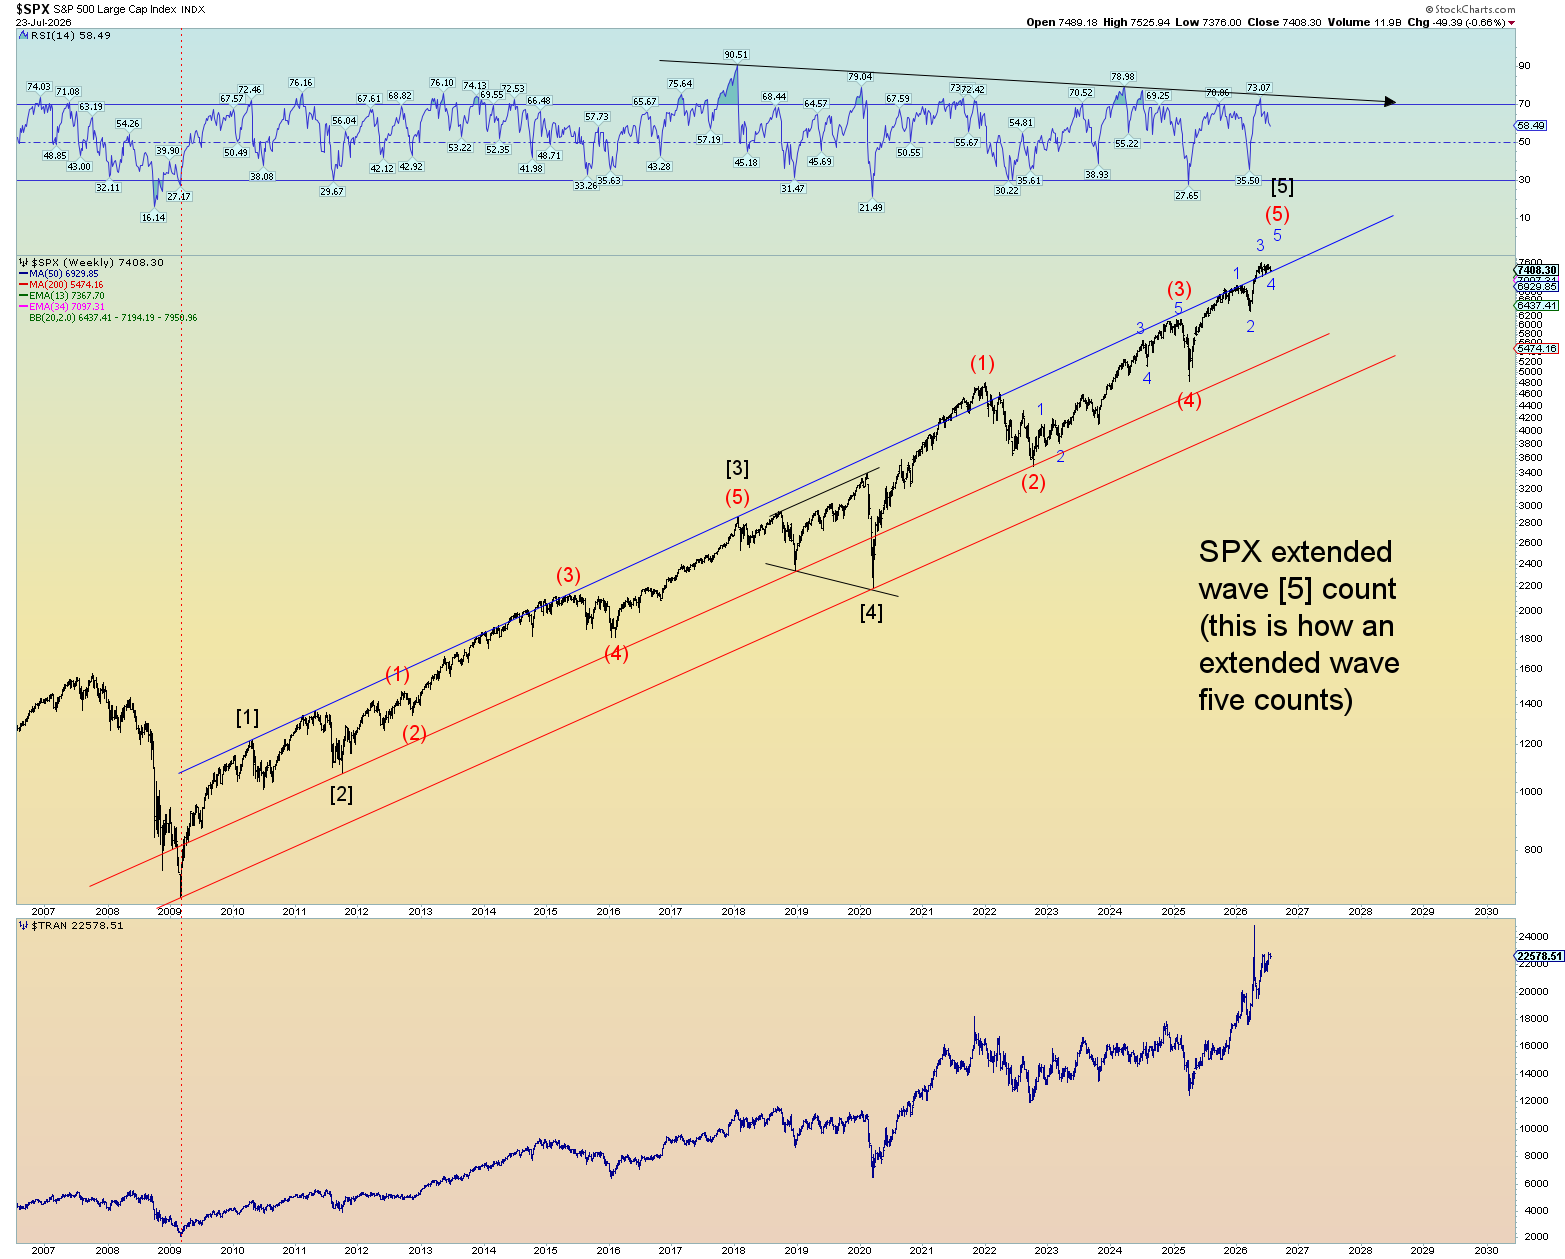
Take note that a very long term trendline (blue upper channel) is being “hugged” above.

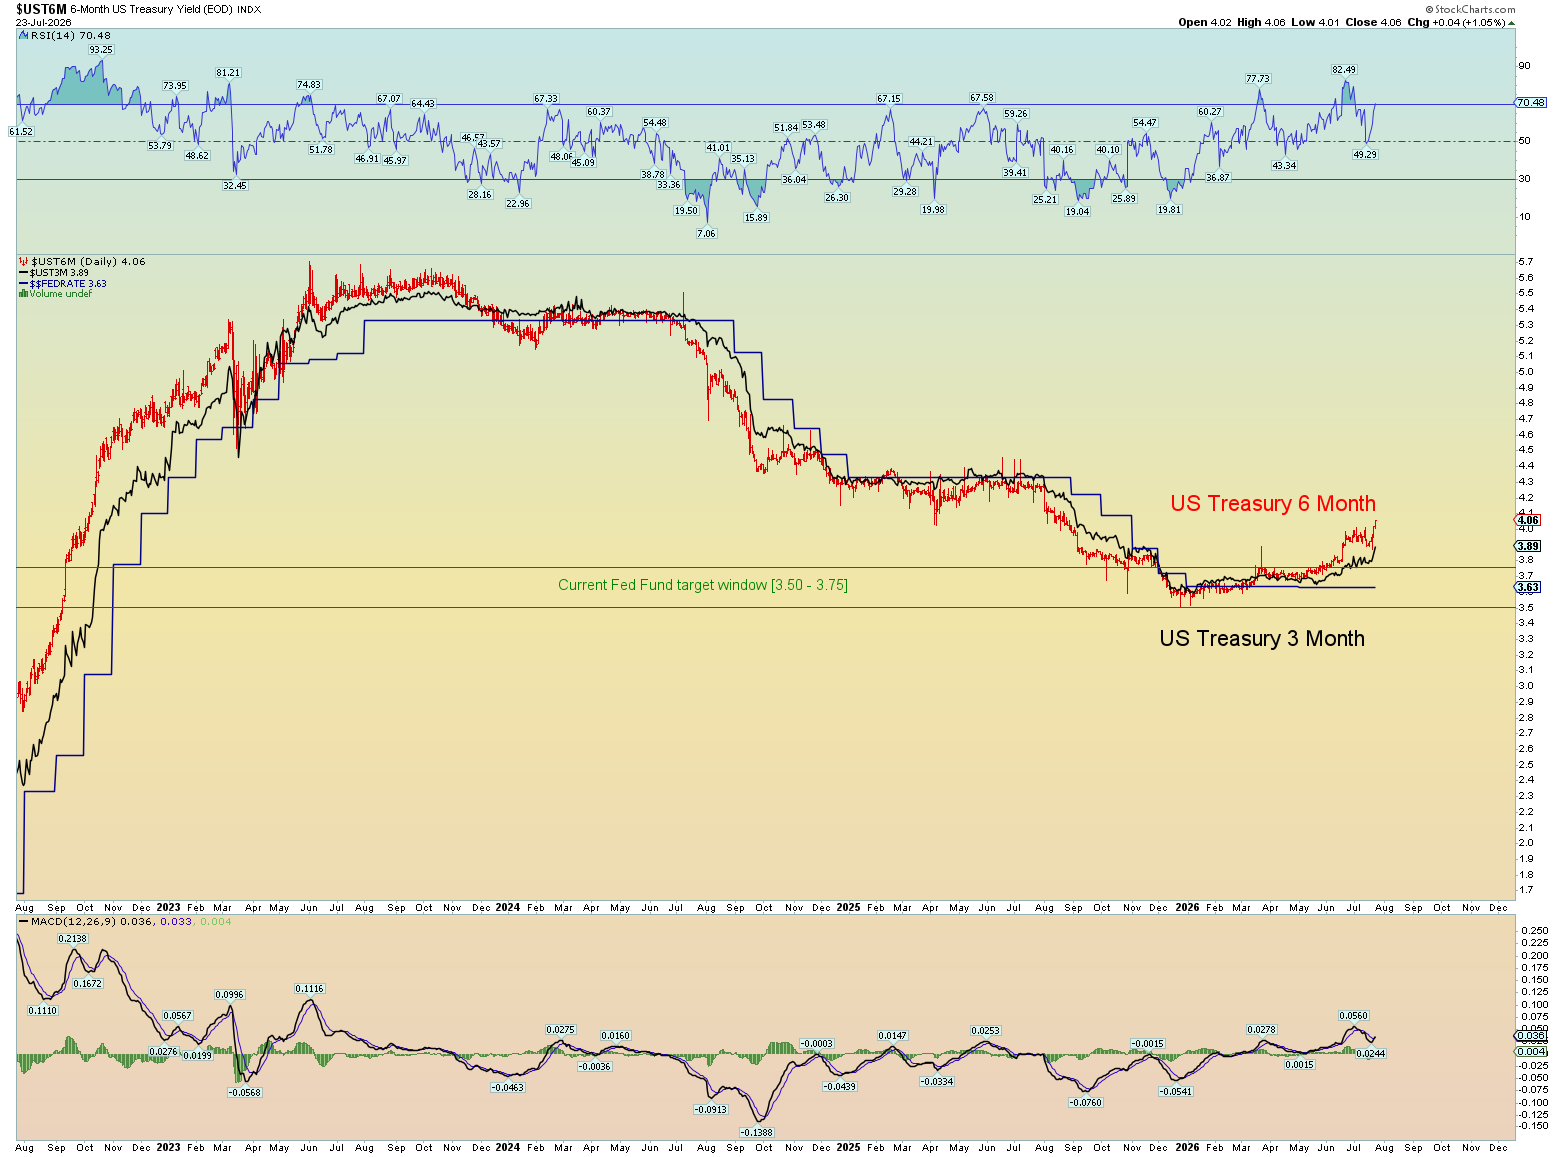
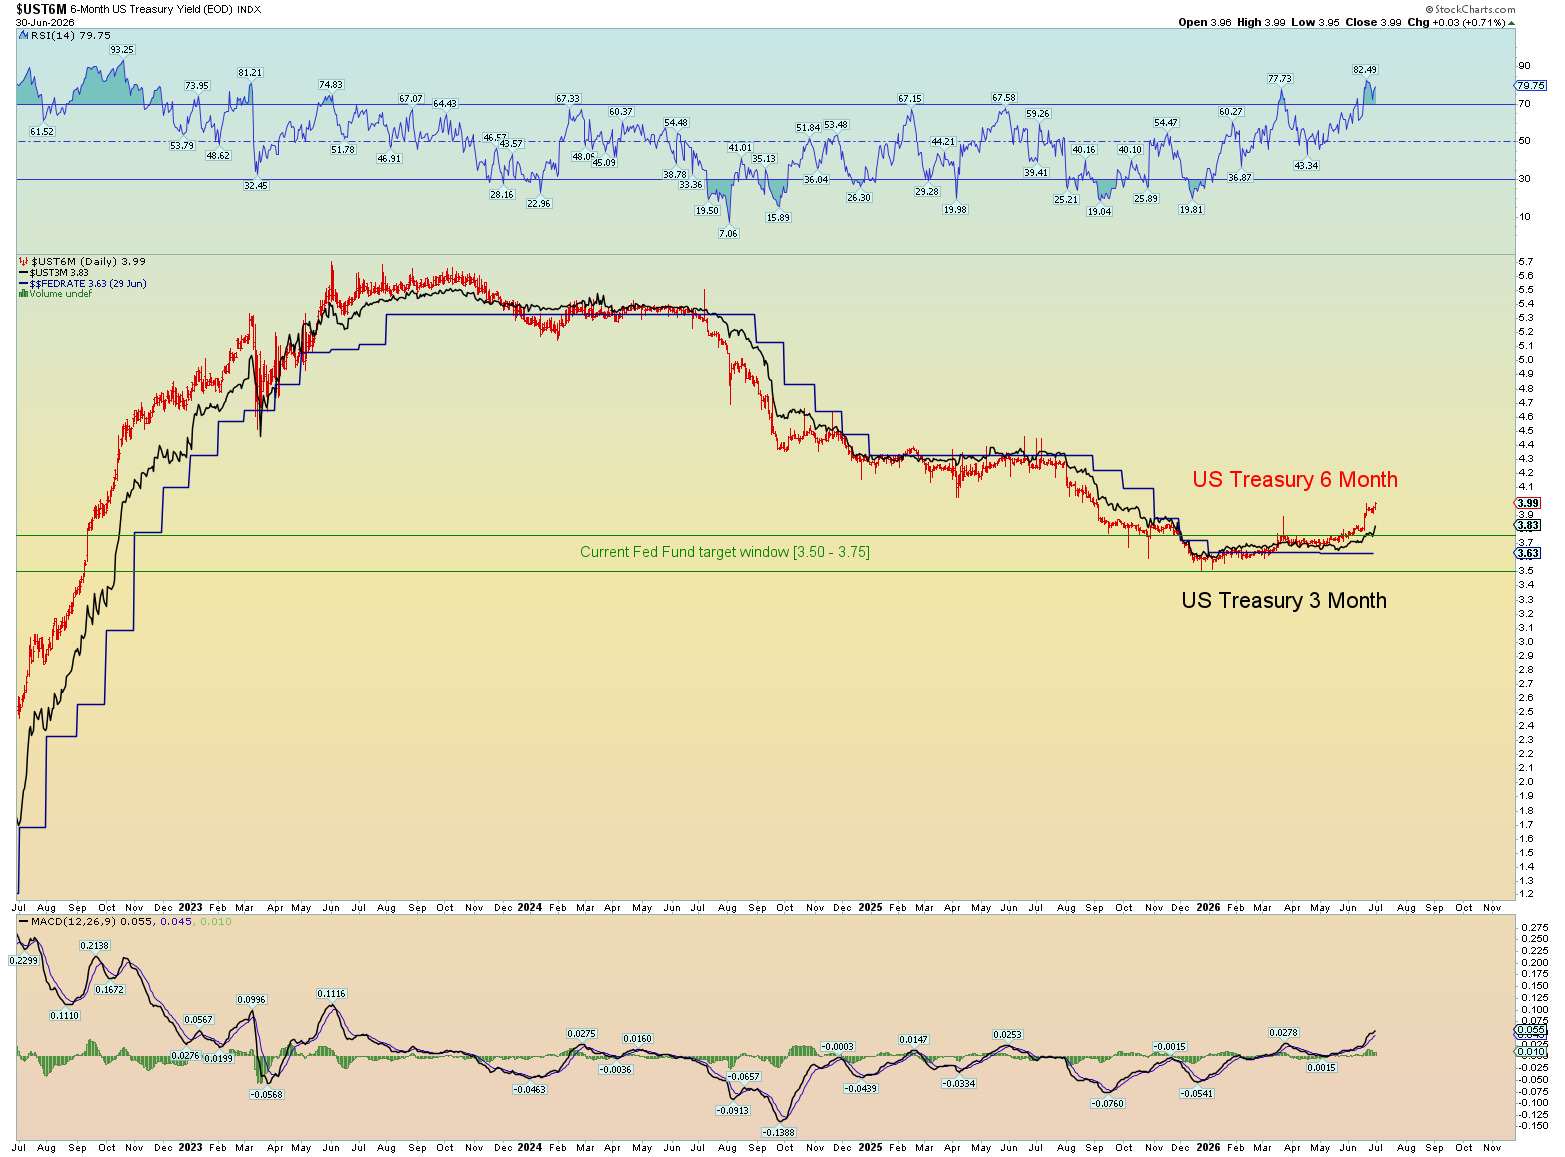
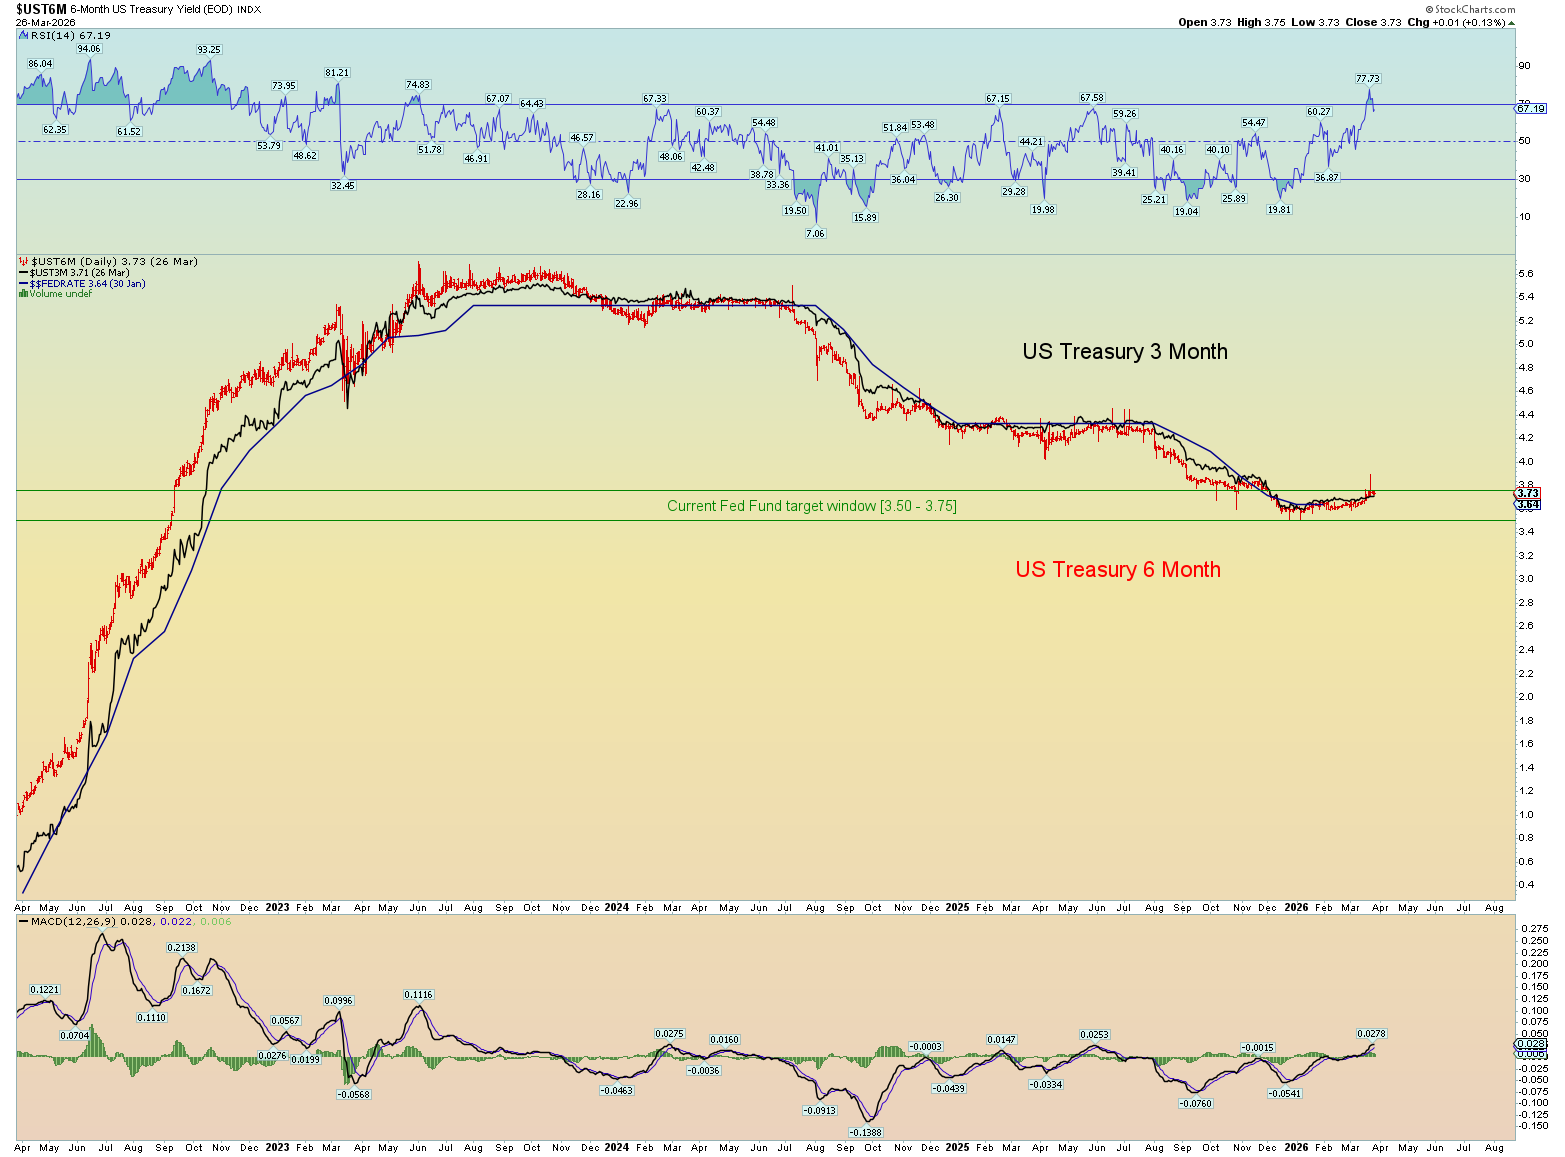
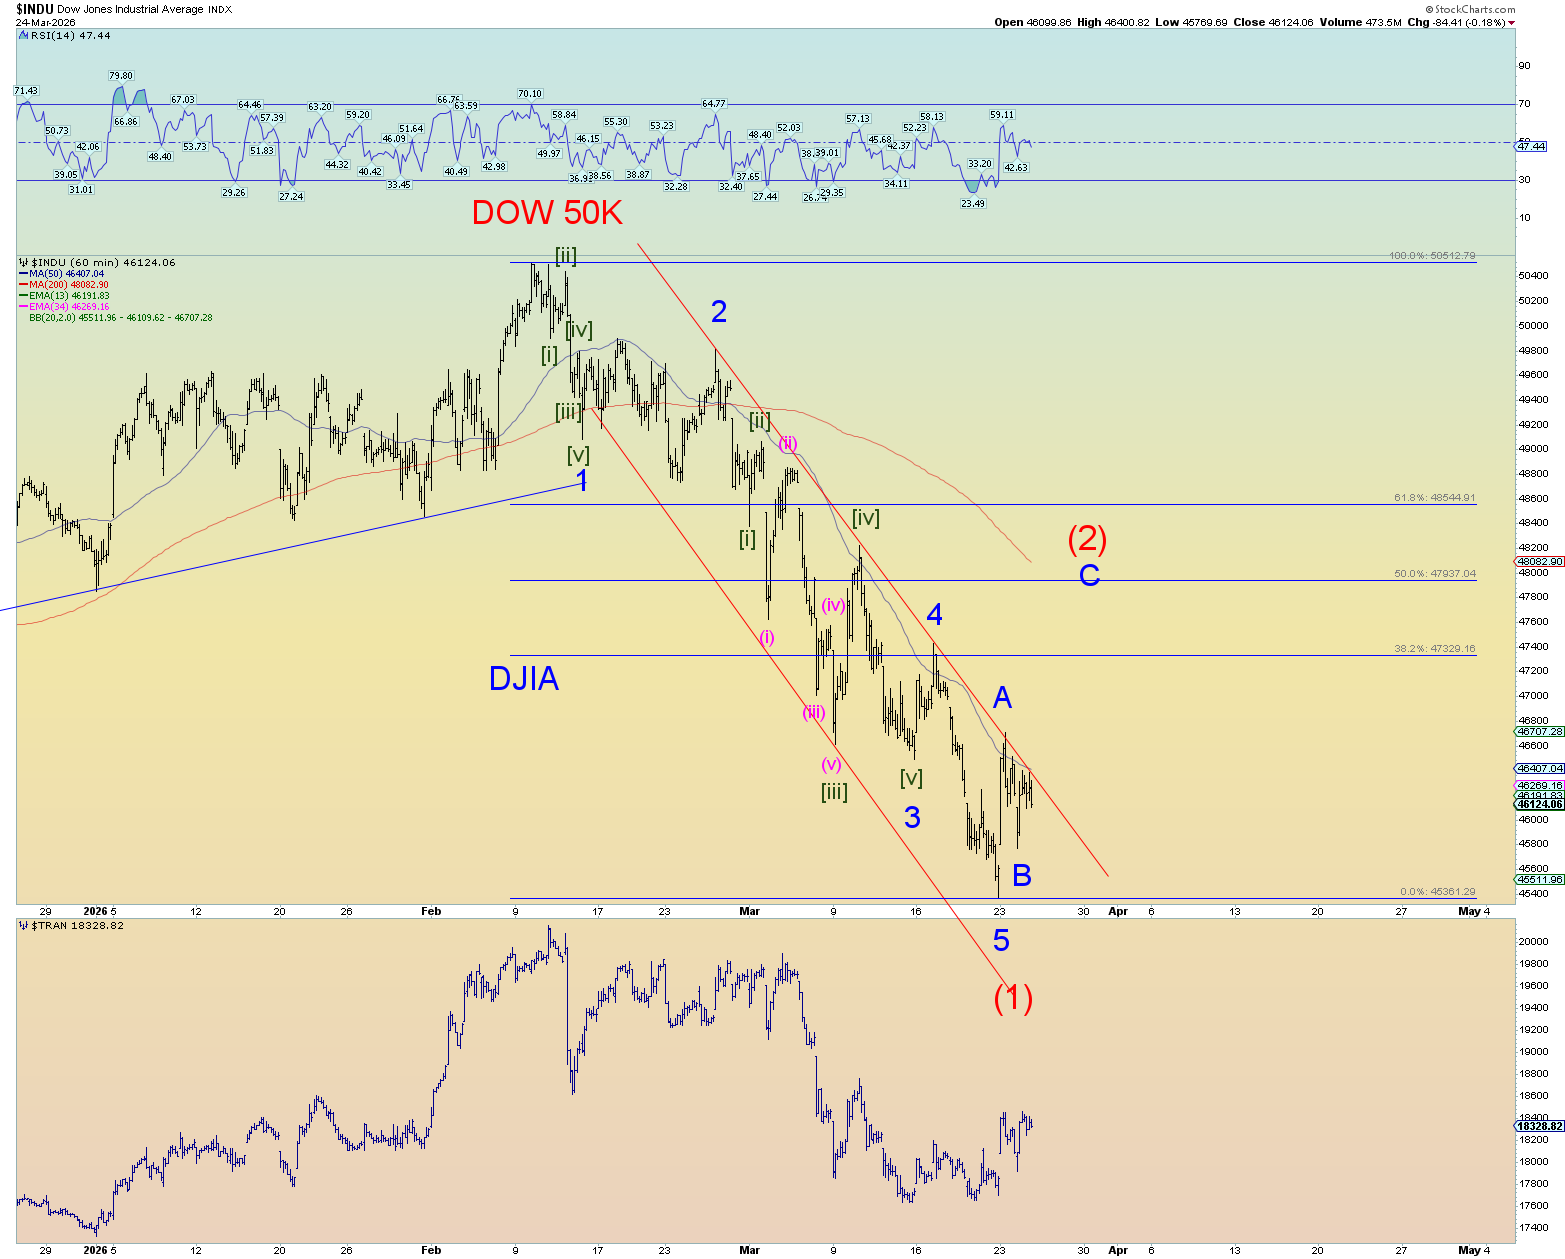
They are going to have to raise short term rates because the market is signaling that they must.