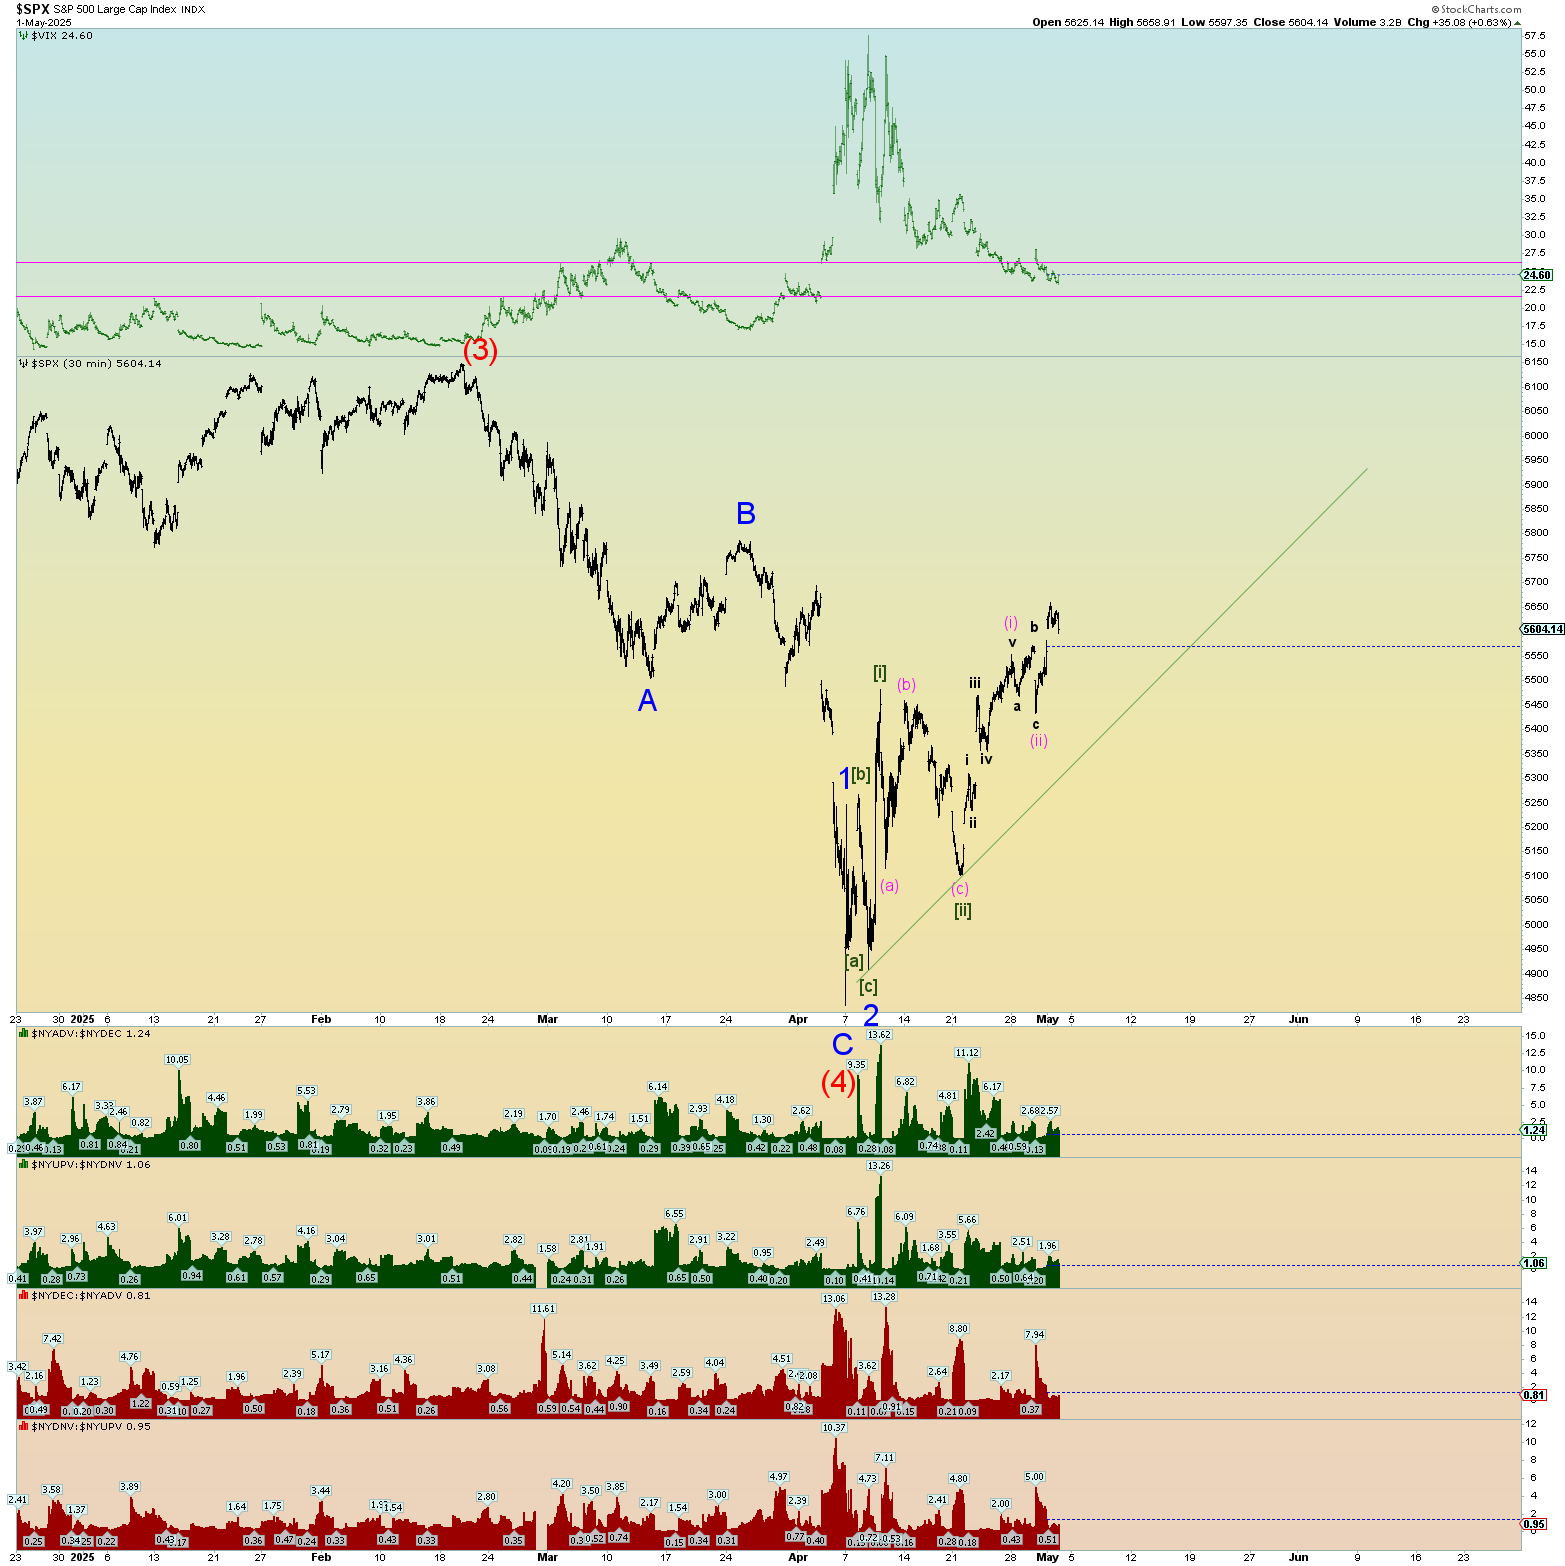
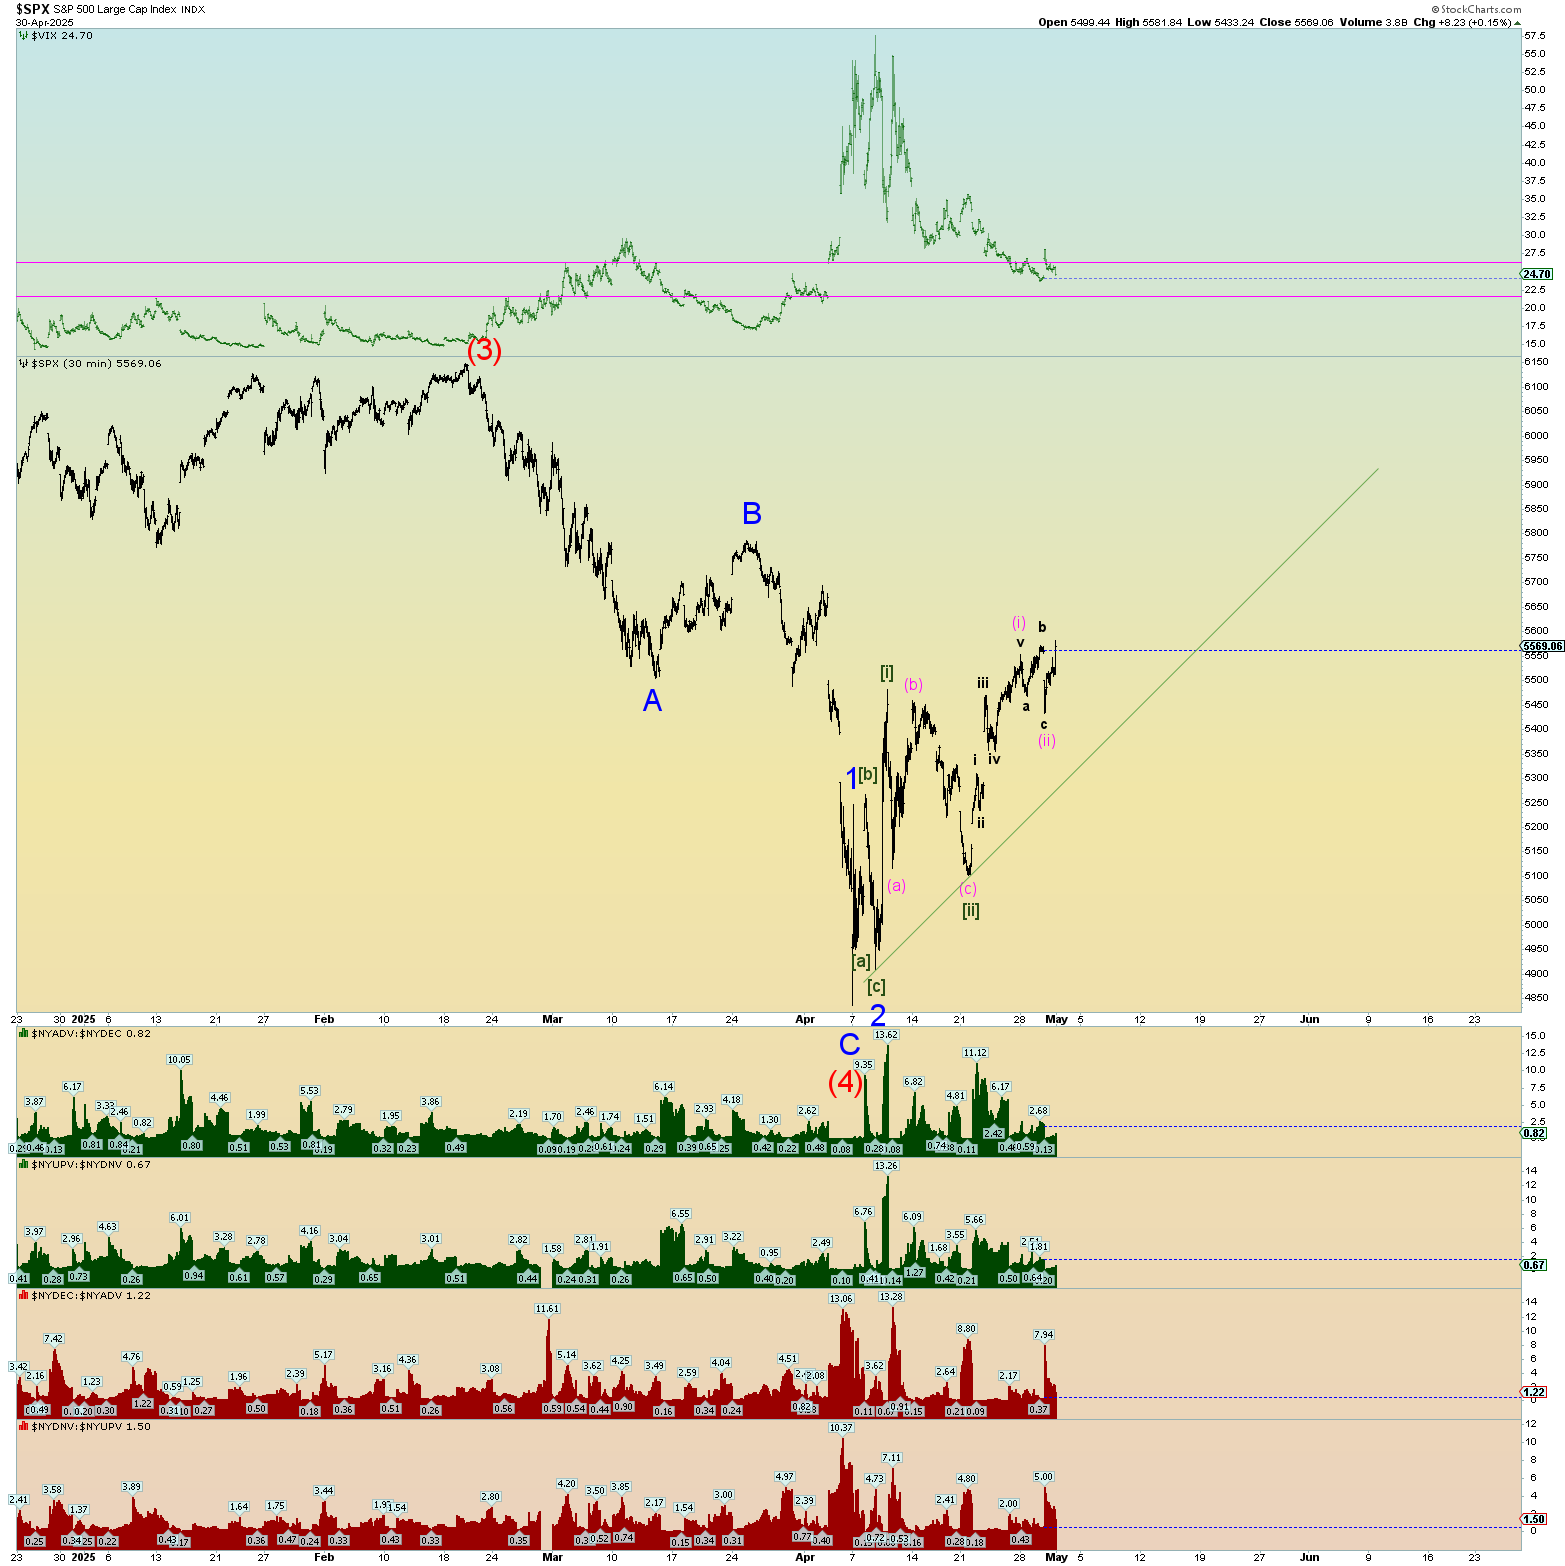
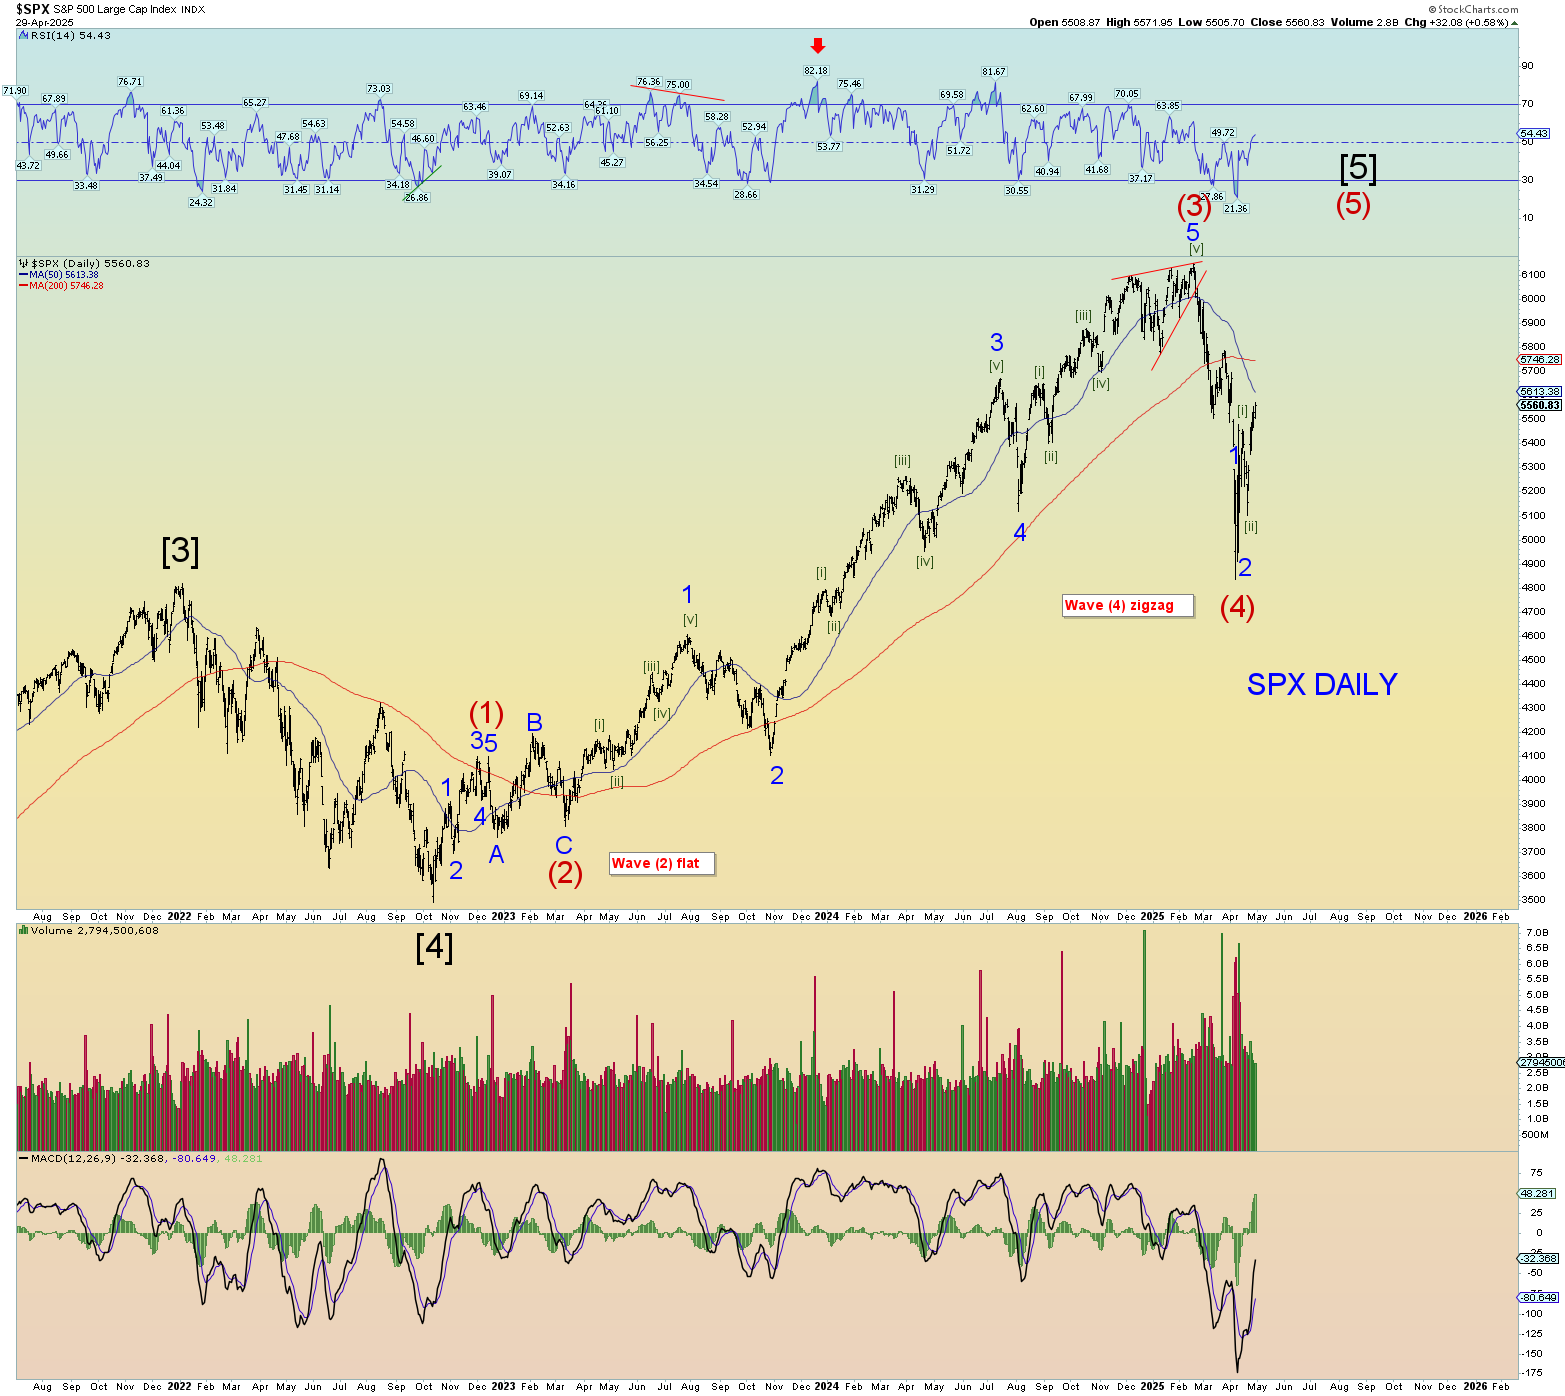
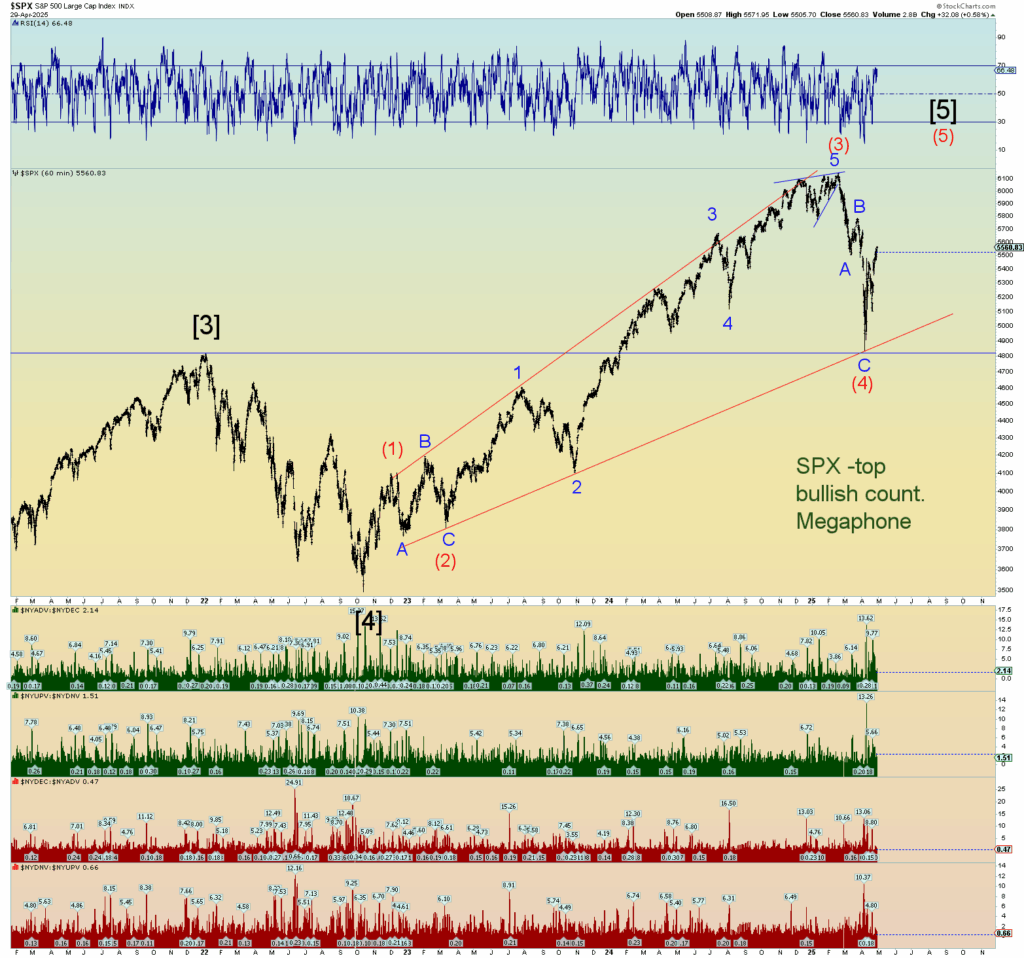
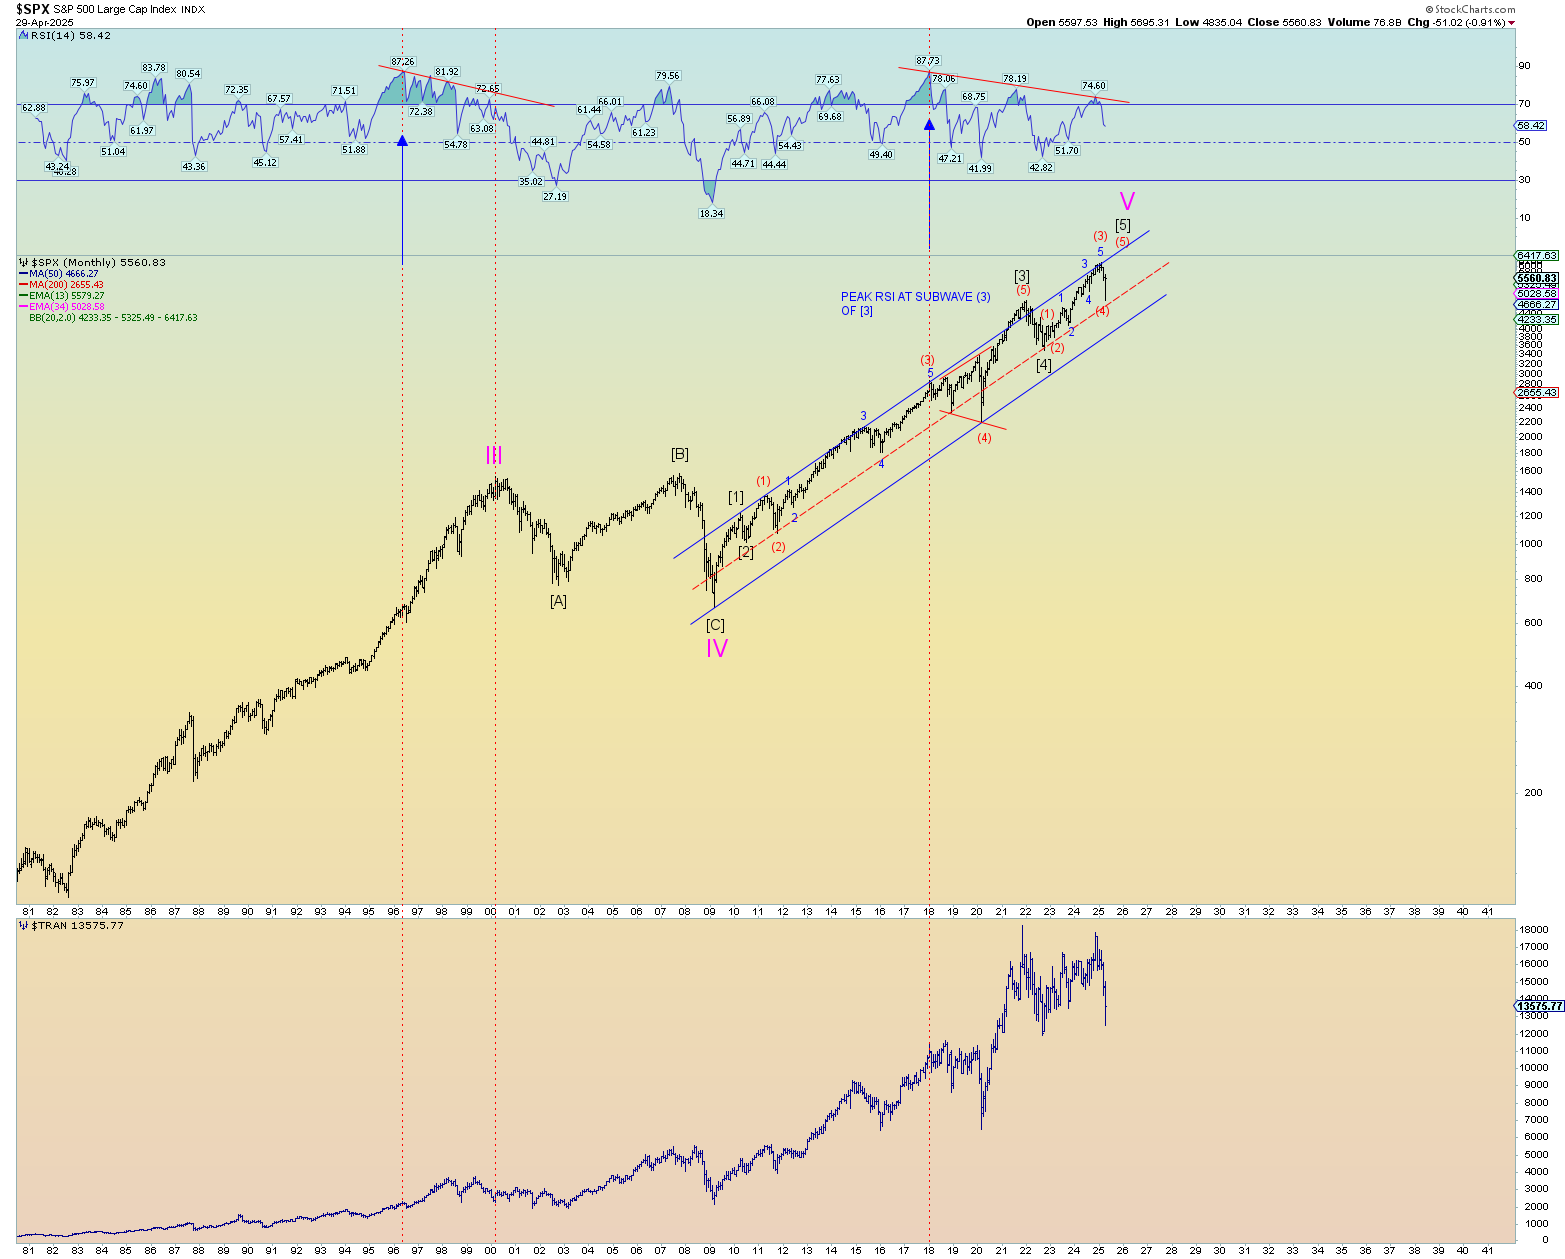
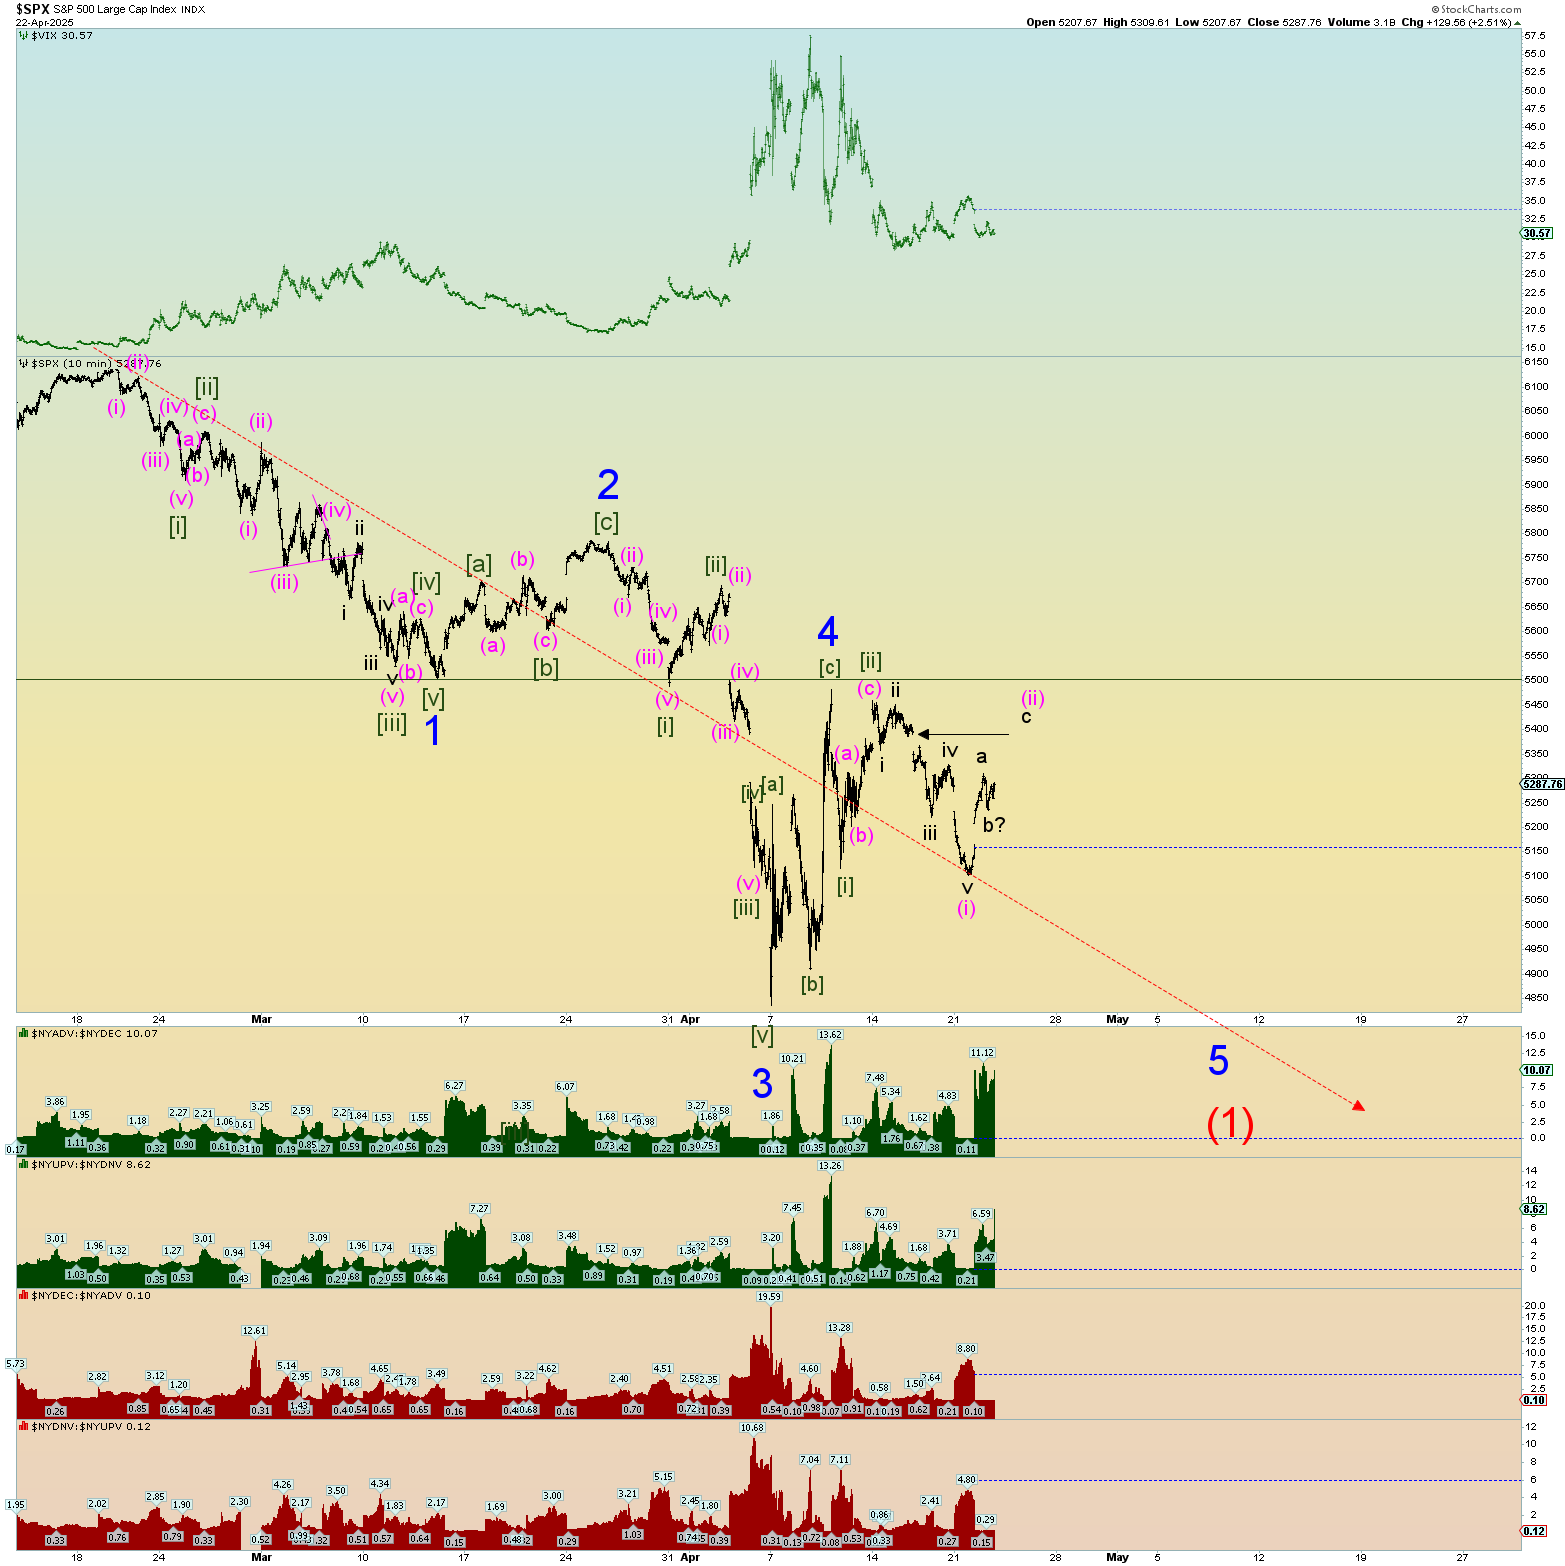
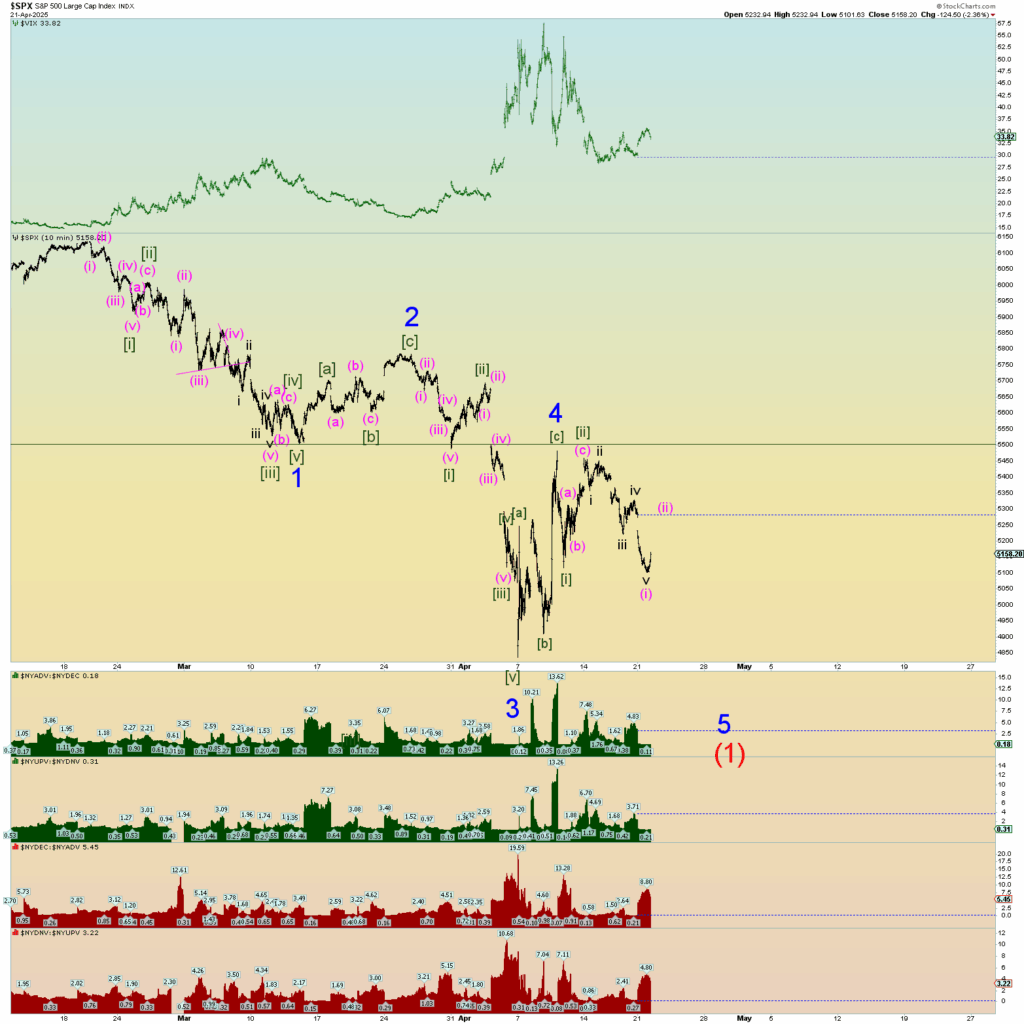
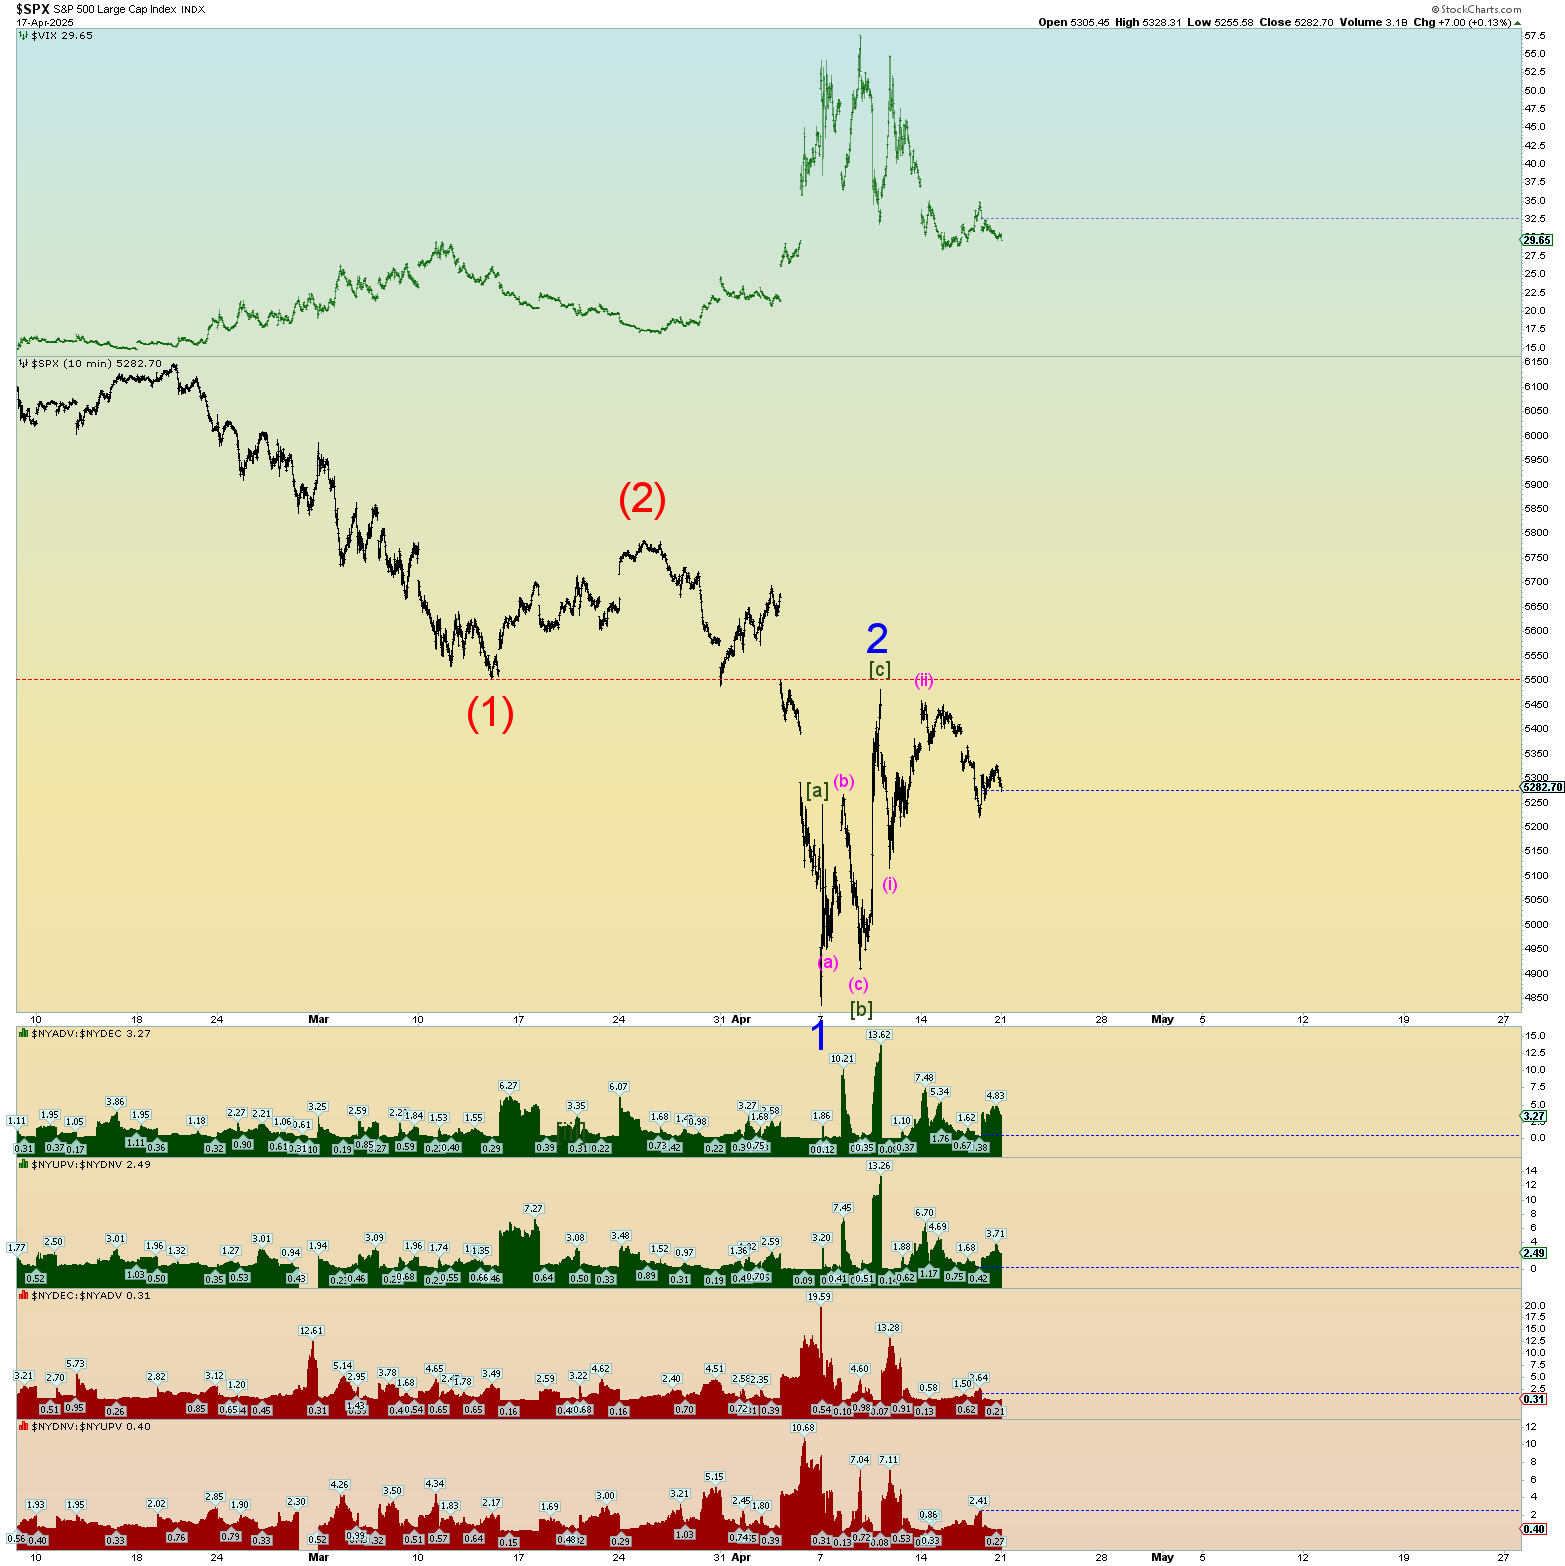
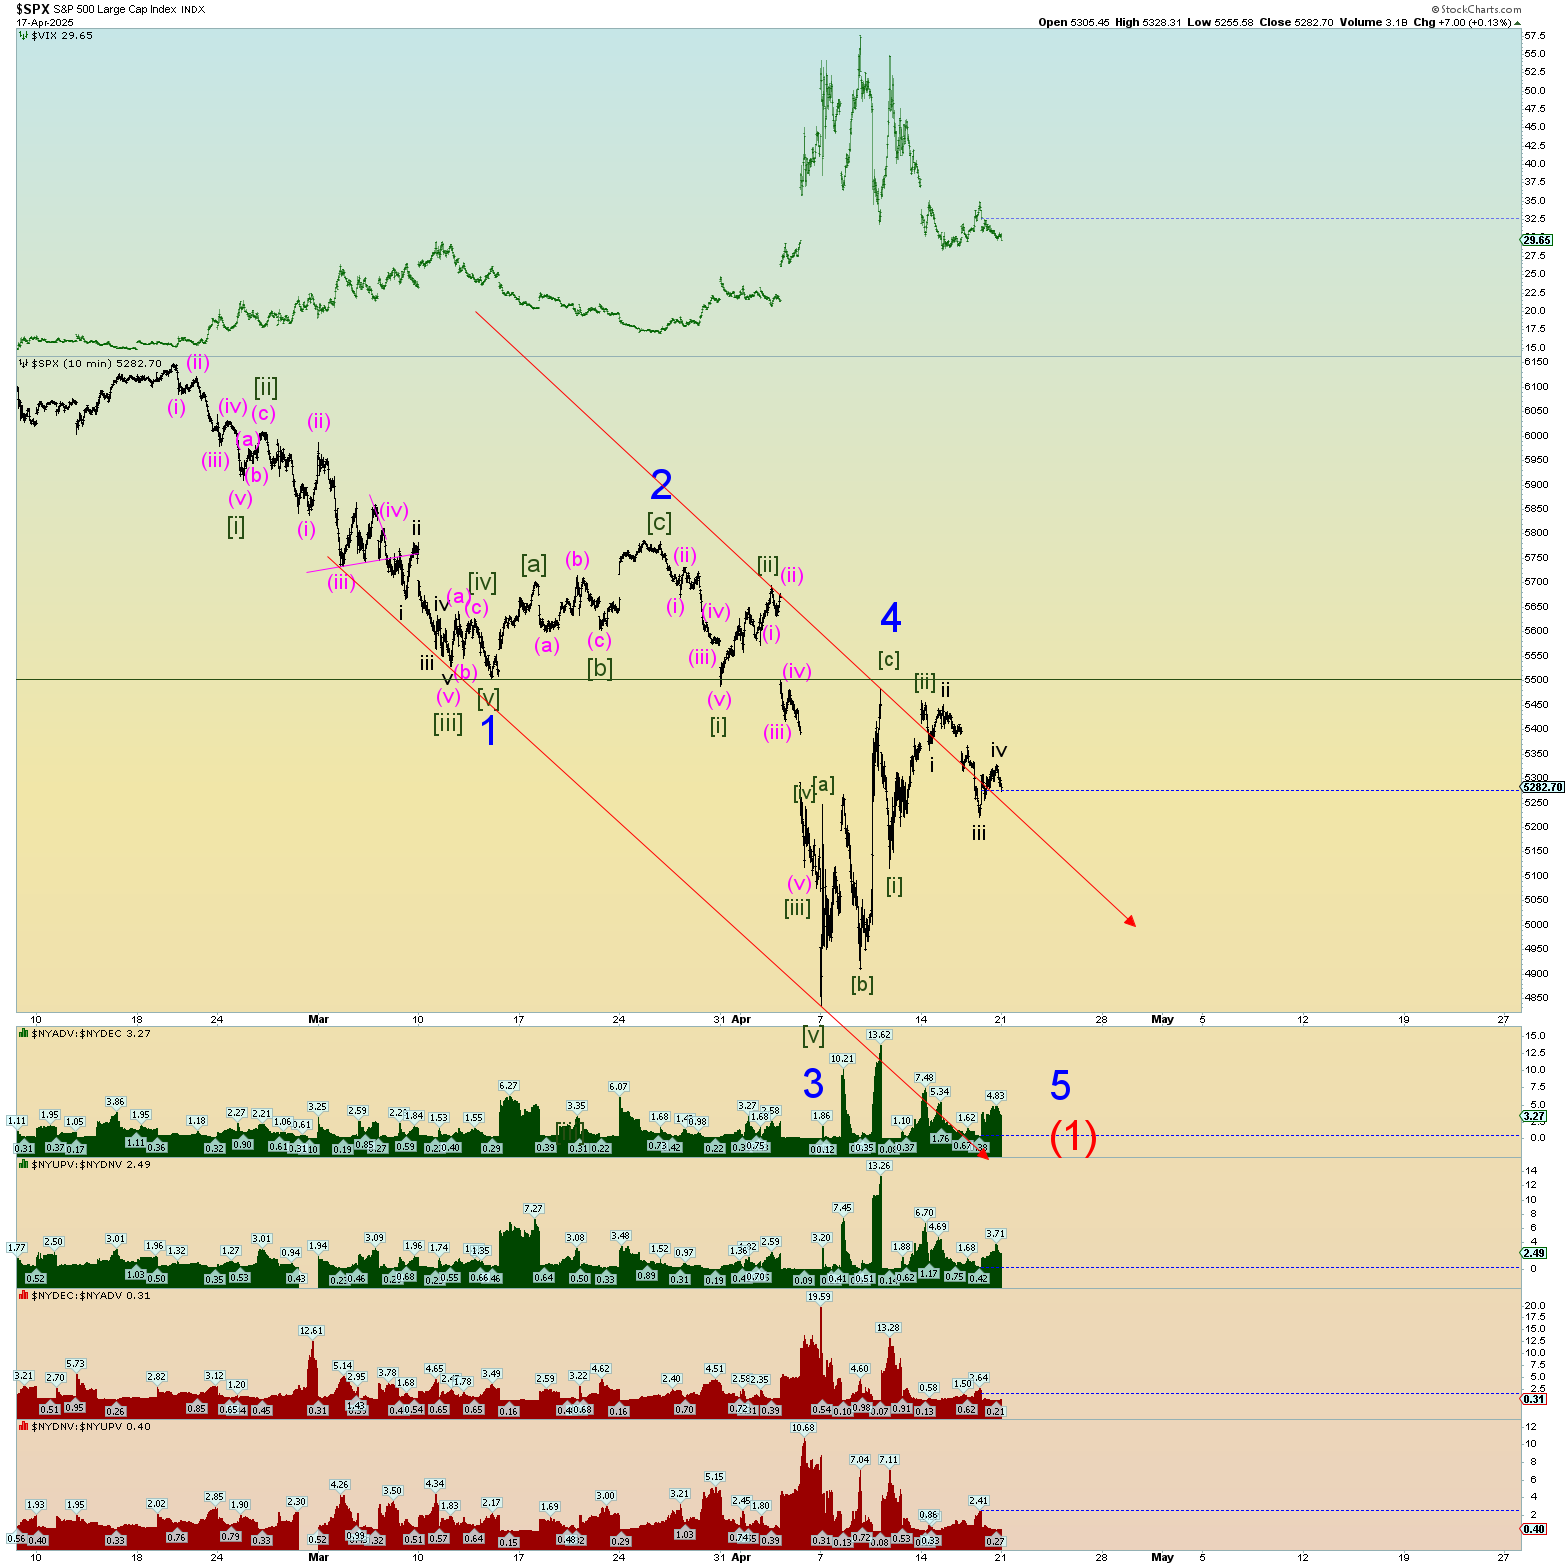
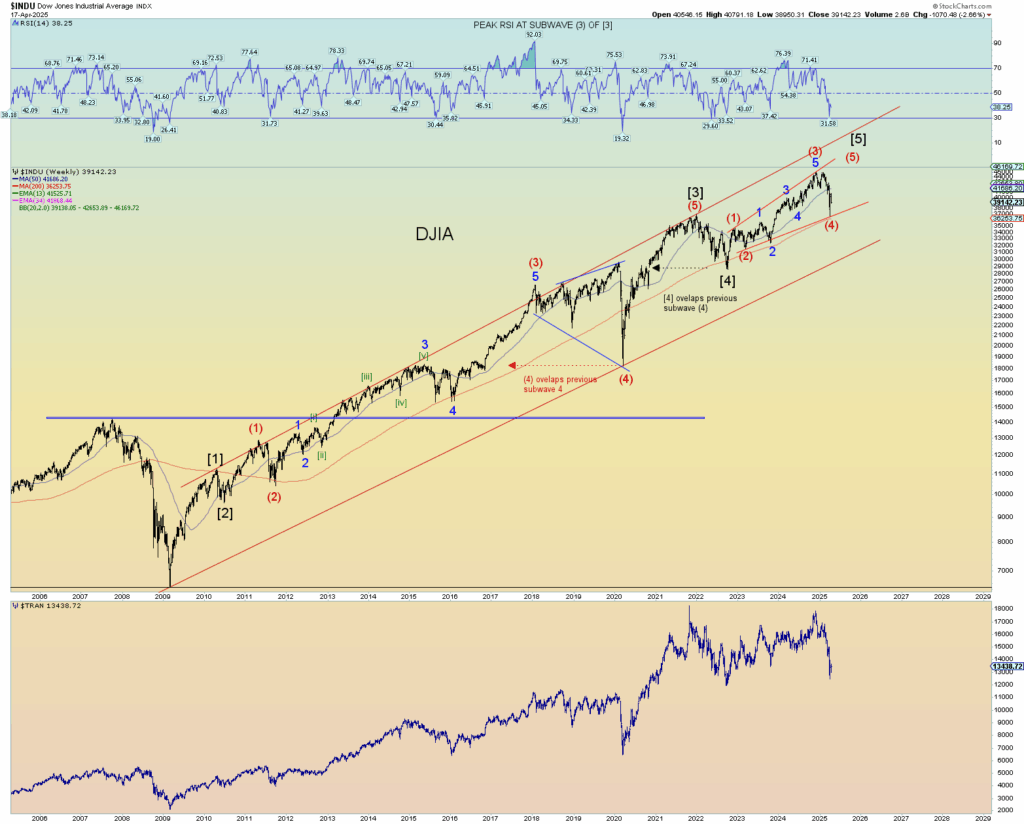
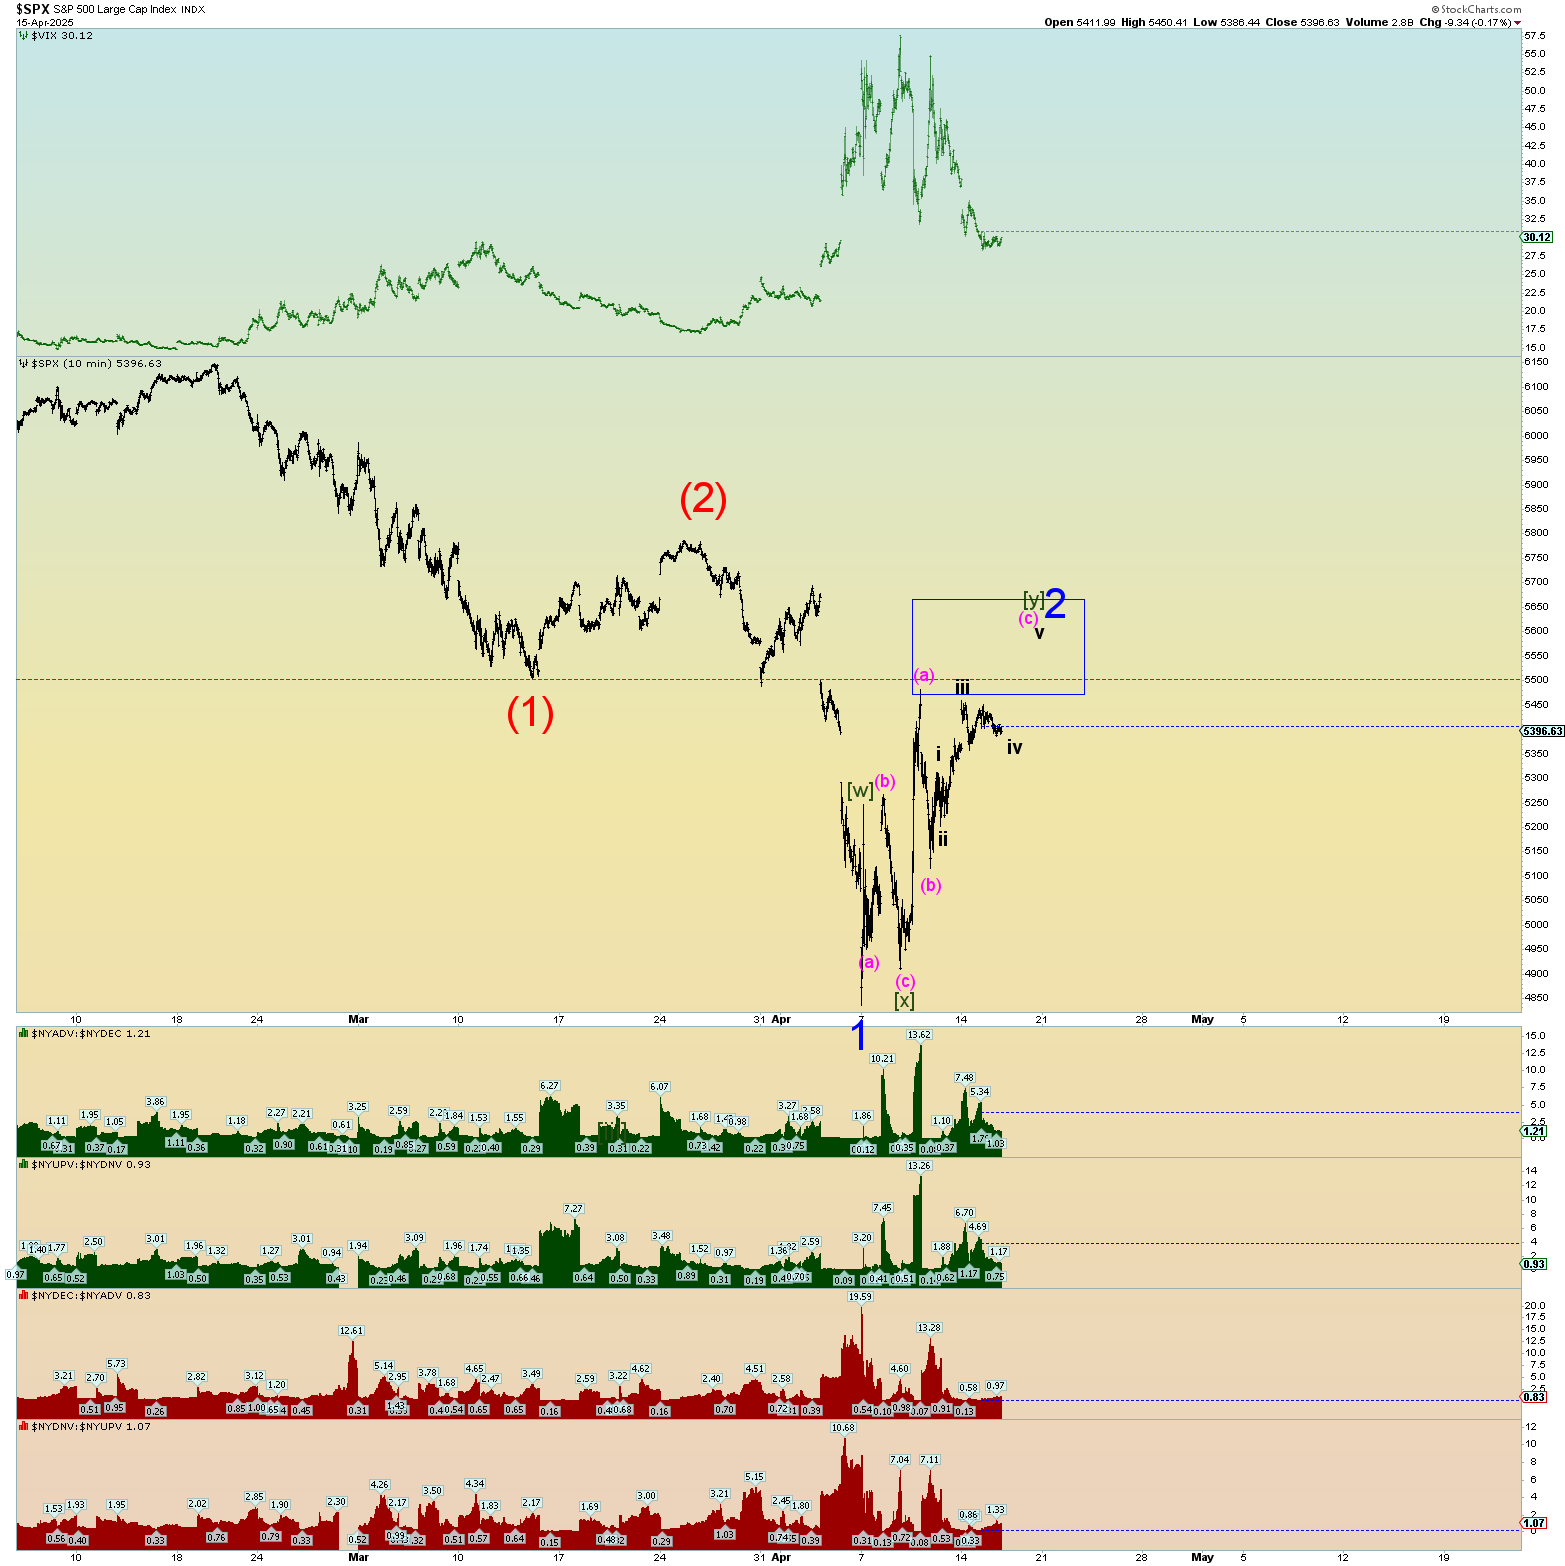
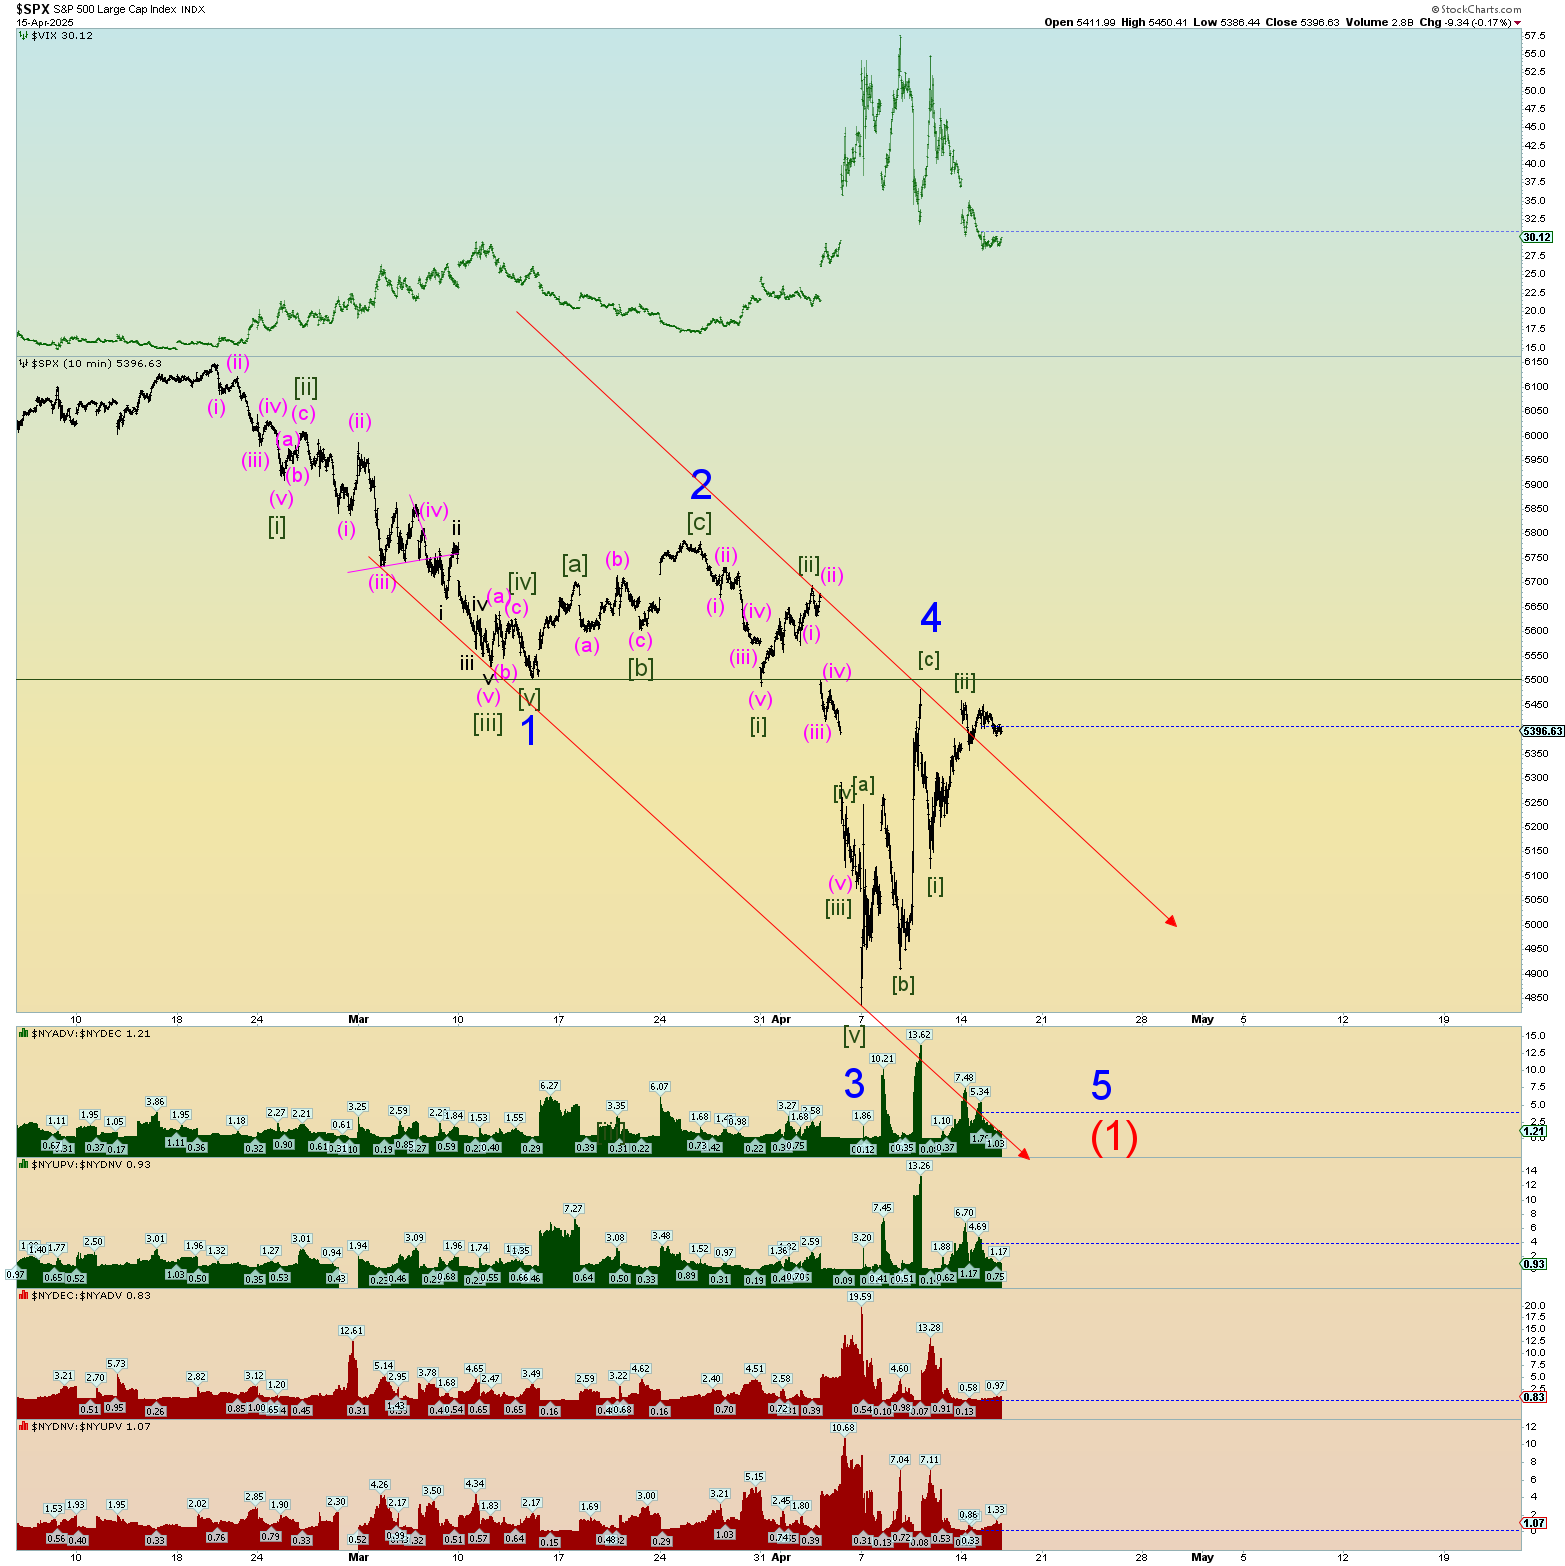
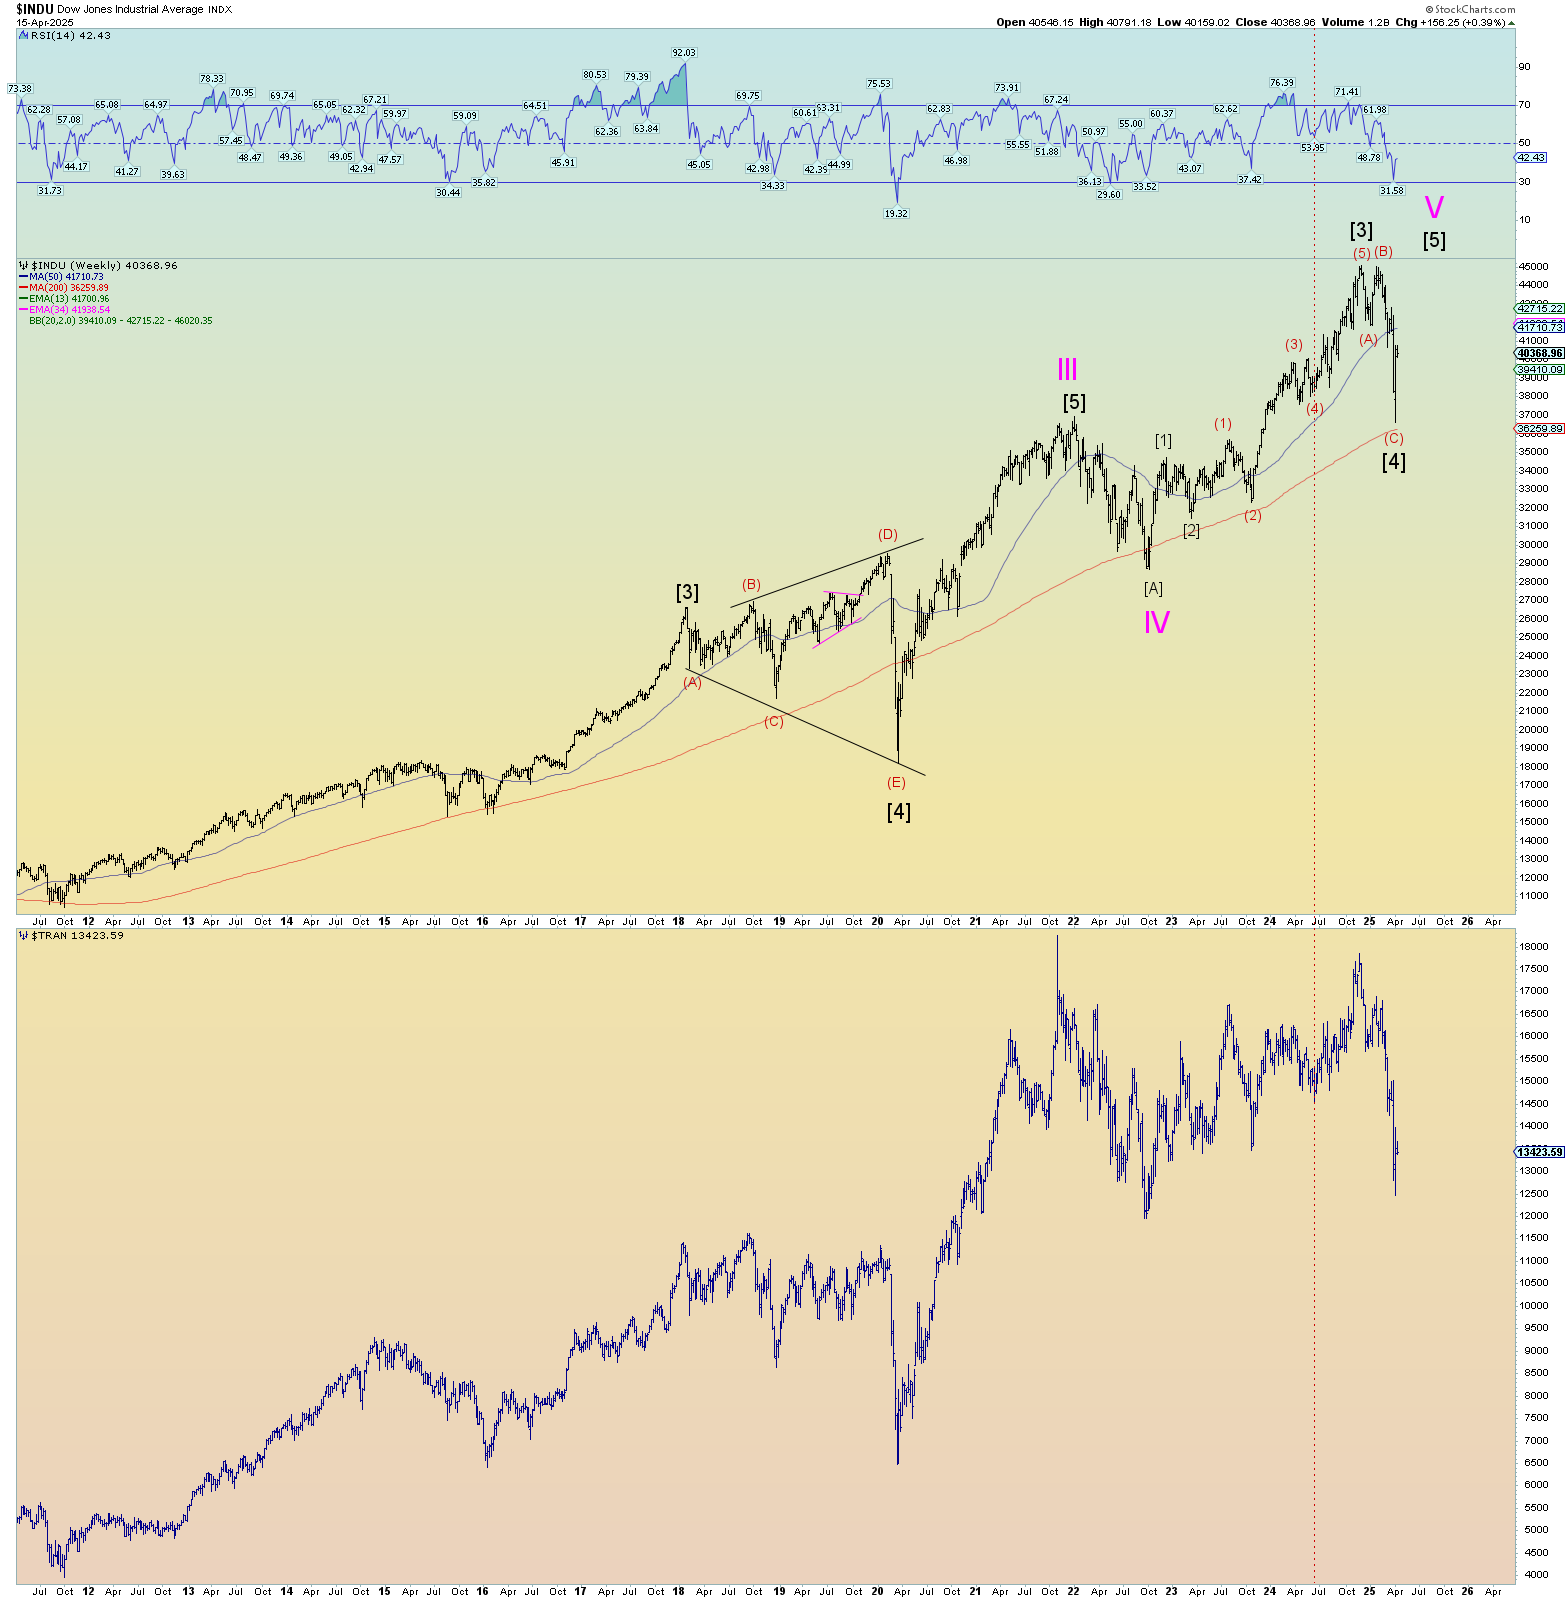
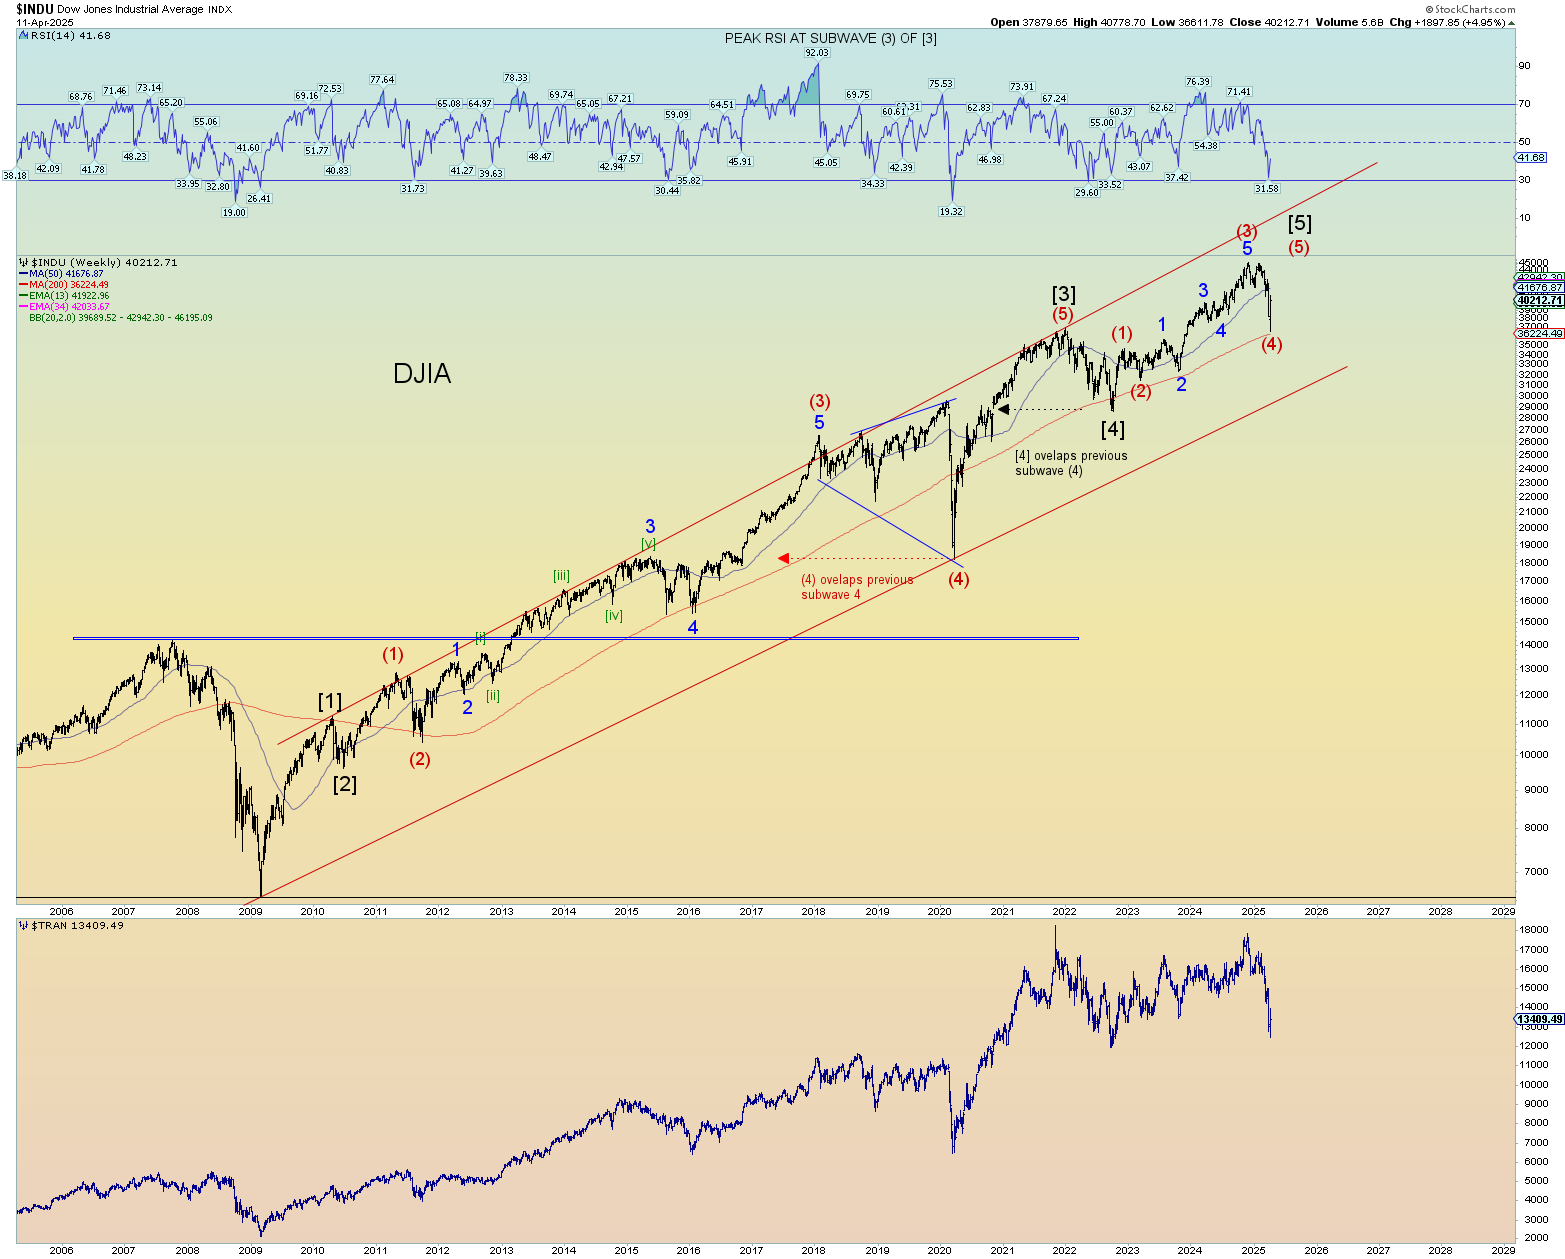
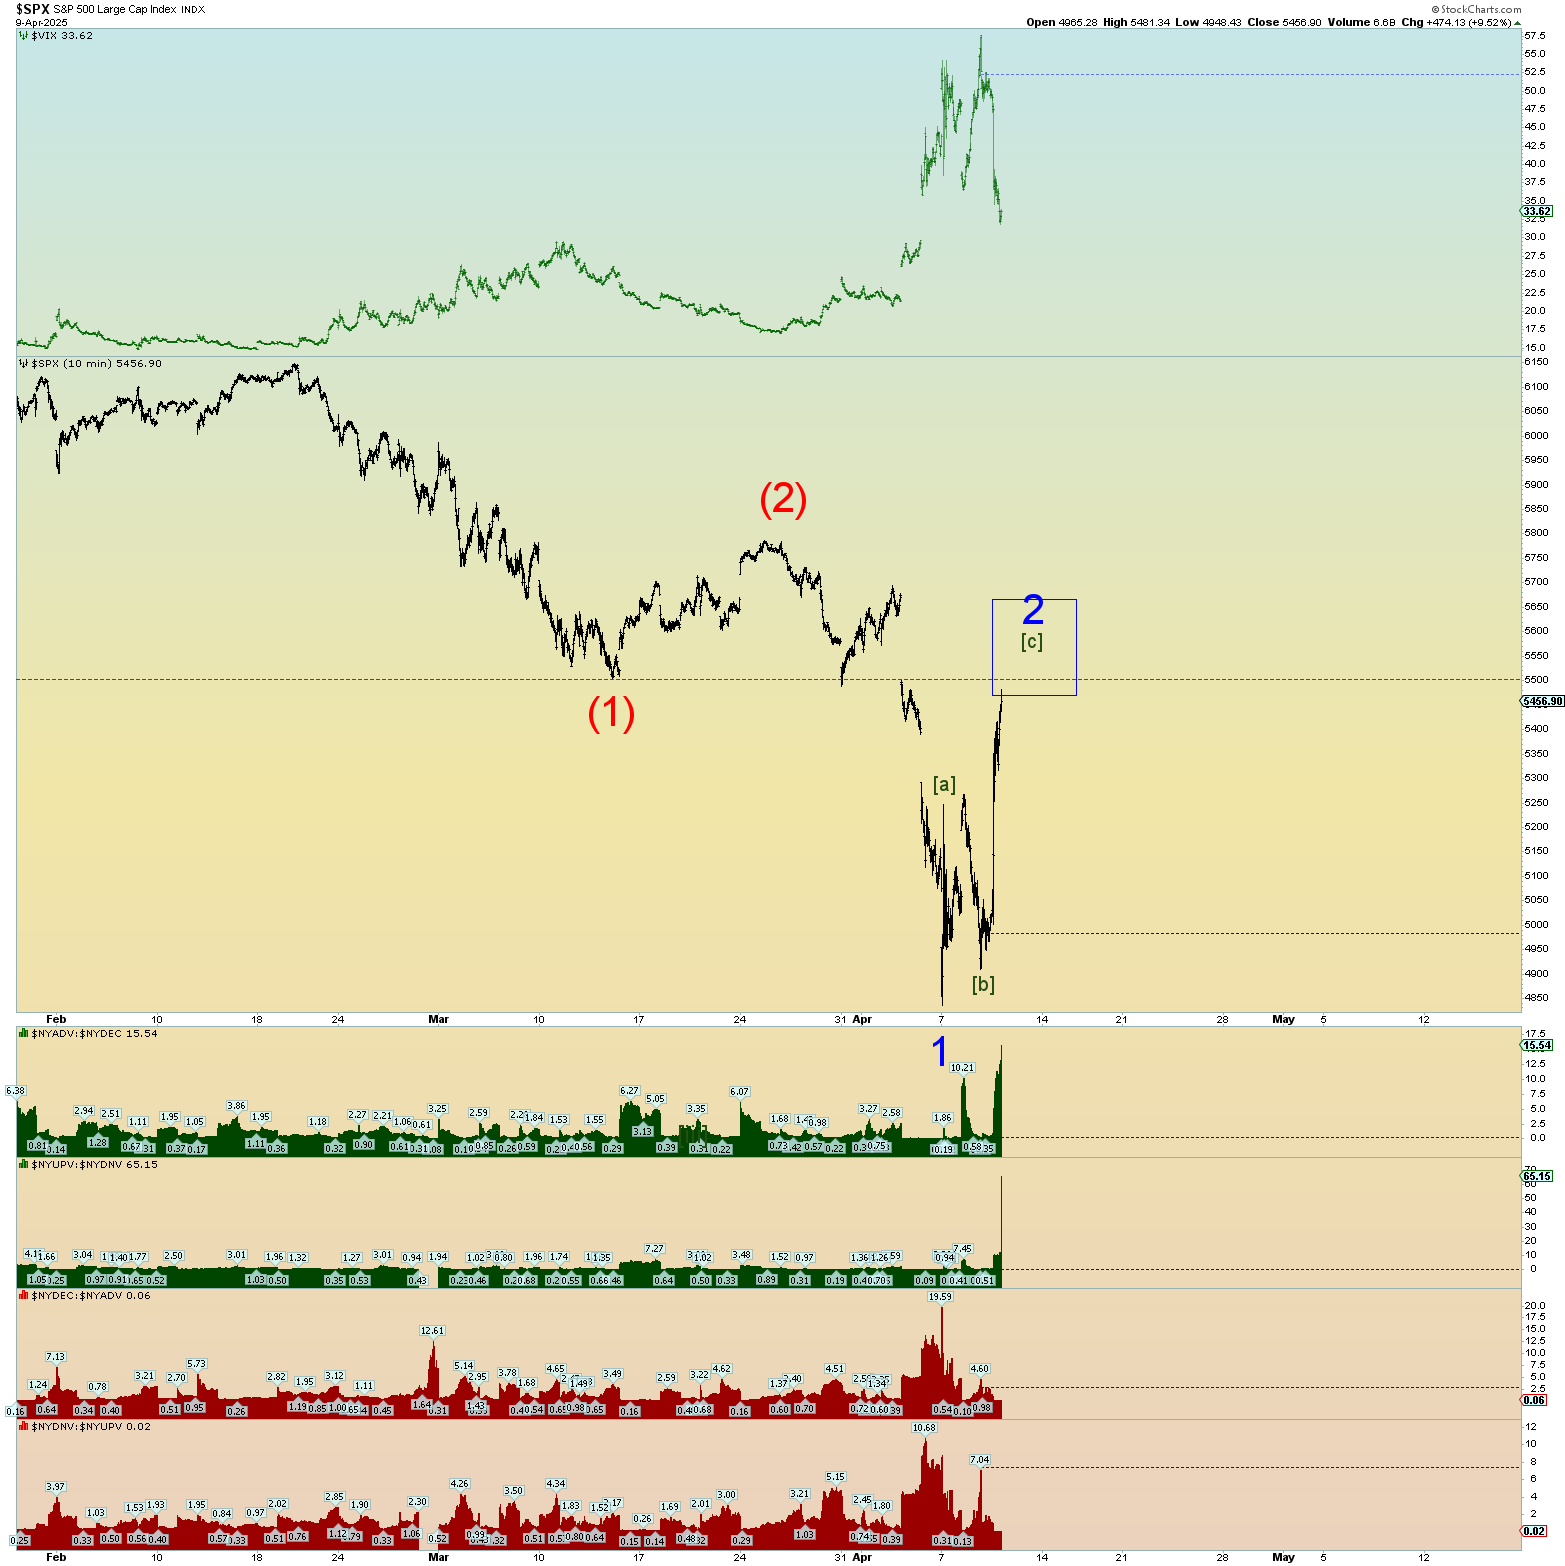
Just a few quick charts from the point of view of the bulls again which is the preferred count based on the overall “three” from all-time peak to spike low, the series of “one-twos” off the spike low, and the rare Zweig Breadth thrust event. The market closed above 5600 which can be said to be bullish along with 8 straight positive up days for the SPX which is very rare.
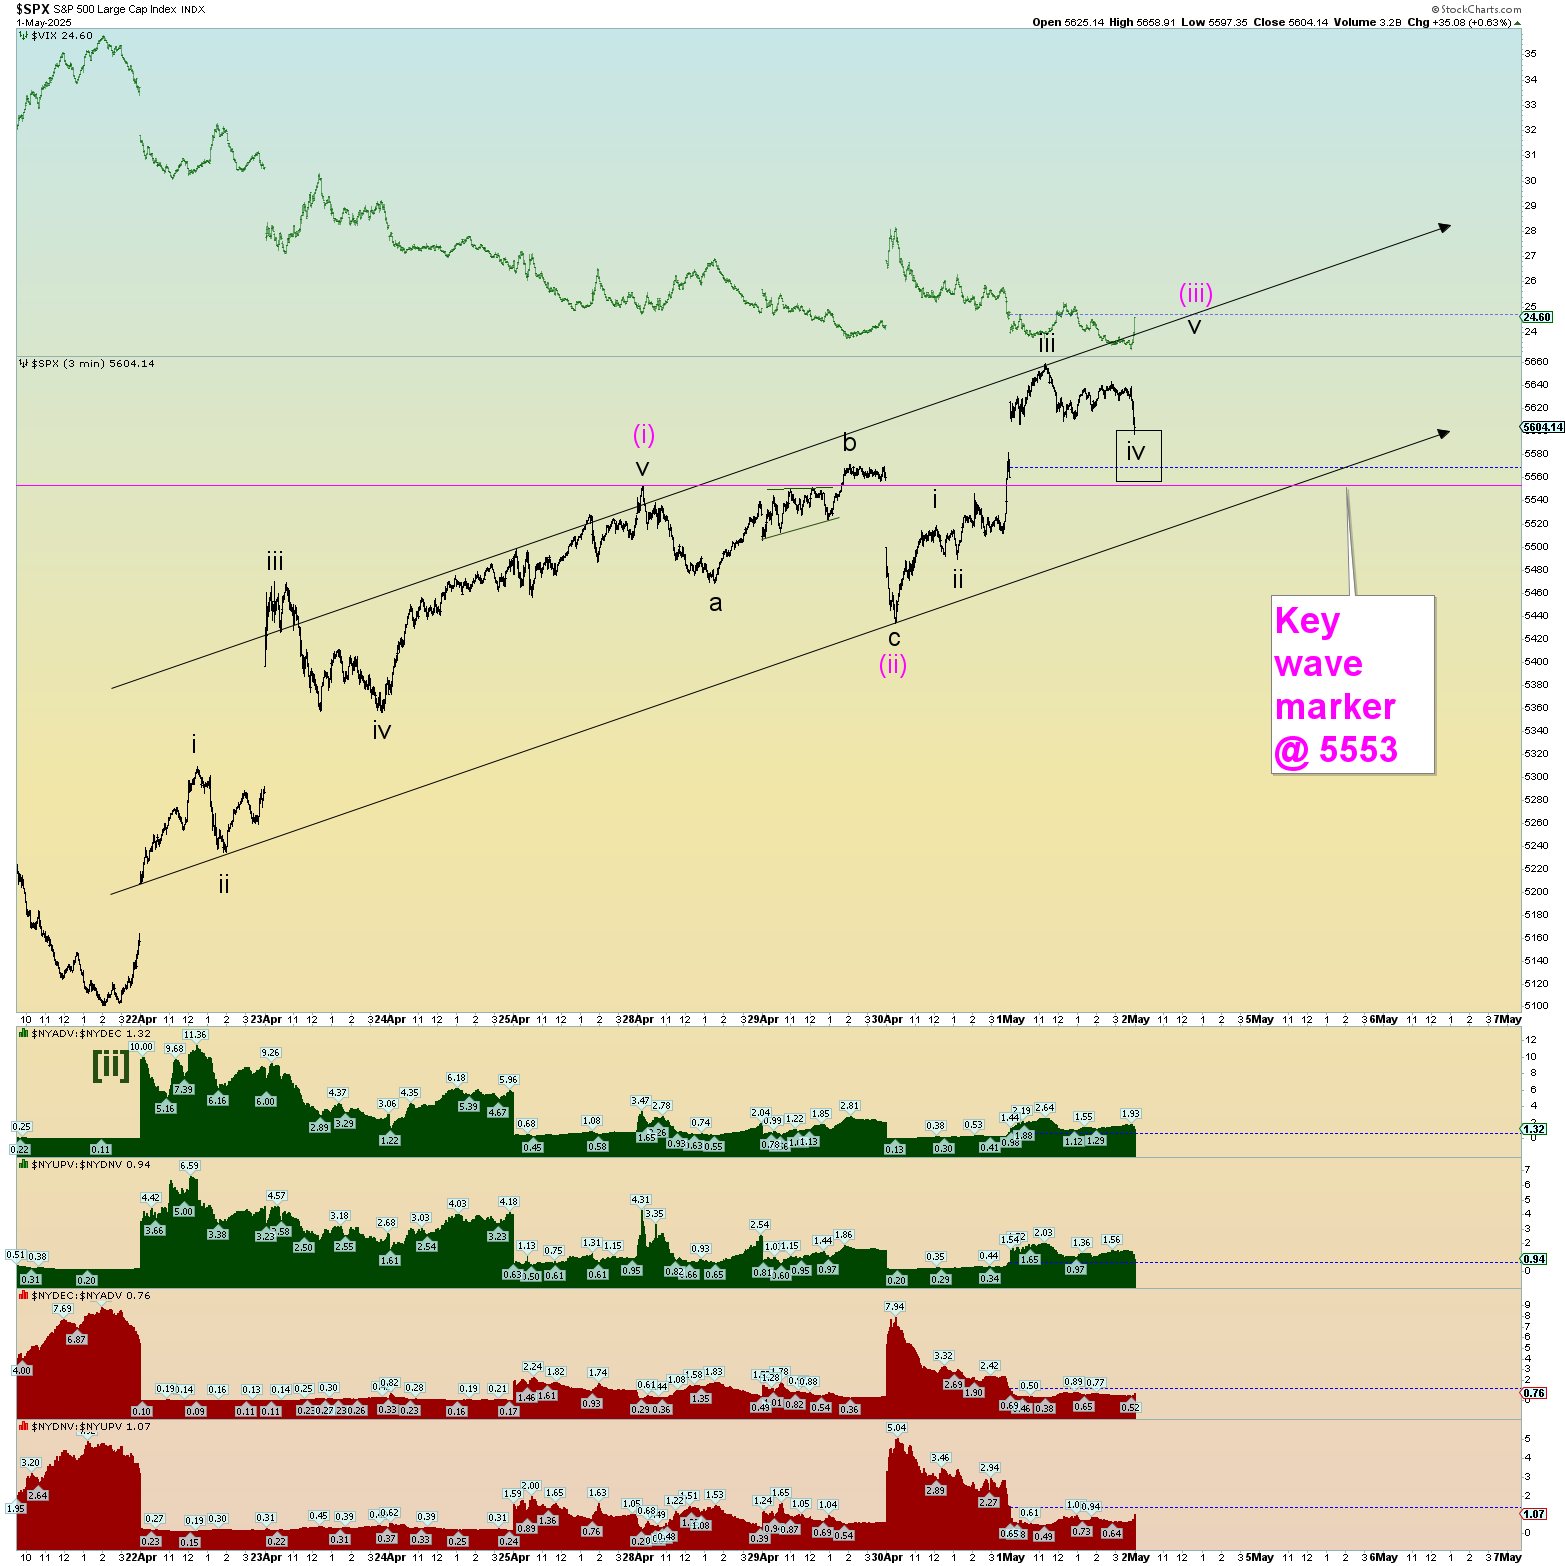
But there is a key wave marker perhaps in SPX 5553 or so. If prices fall below this, then everything will have to be reevaluated.
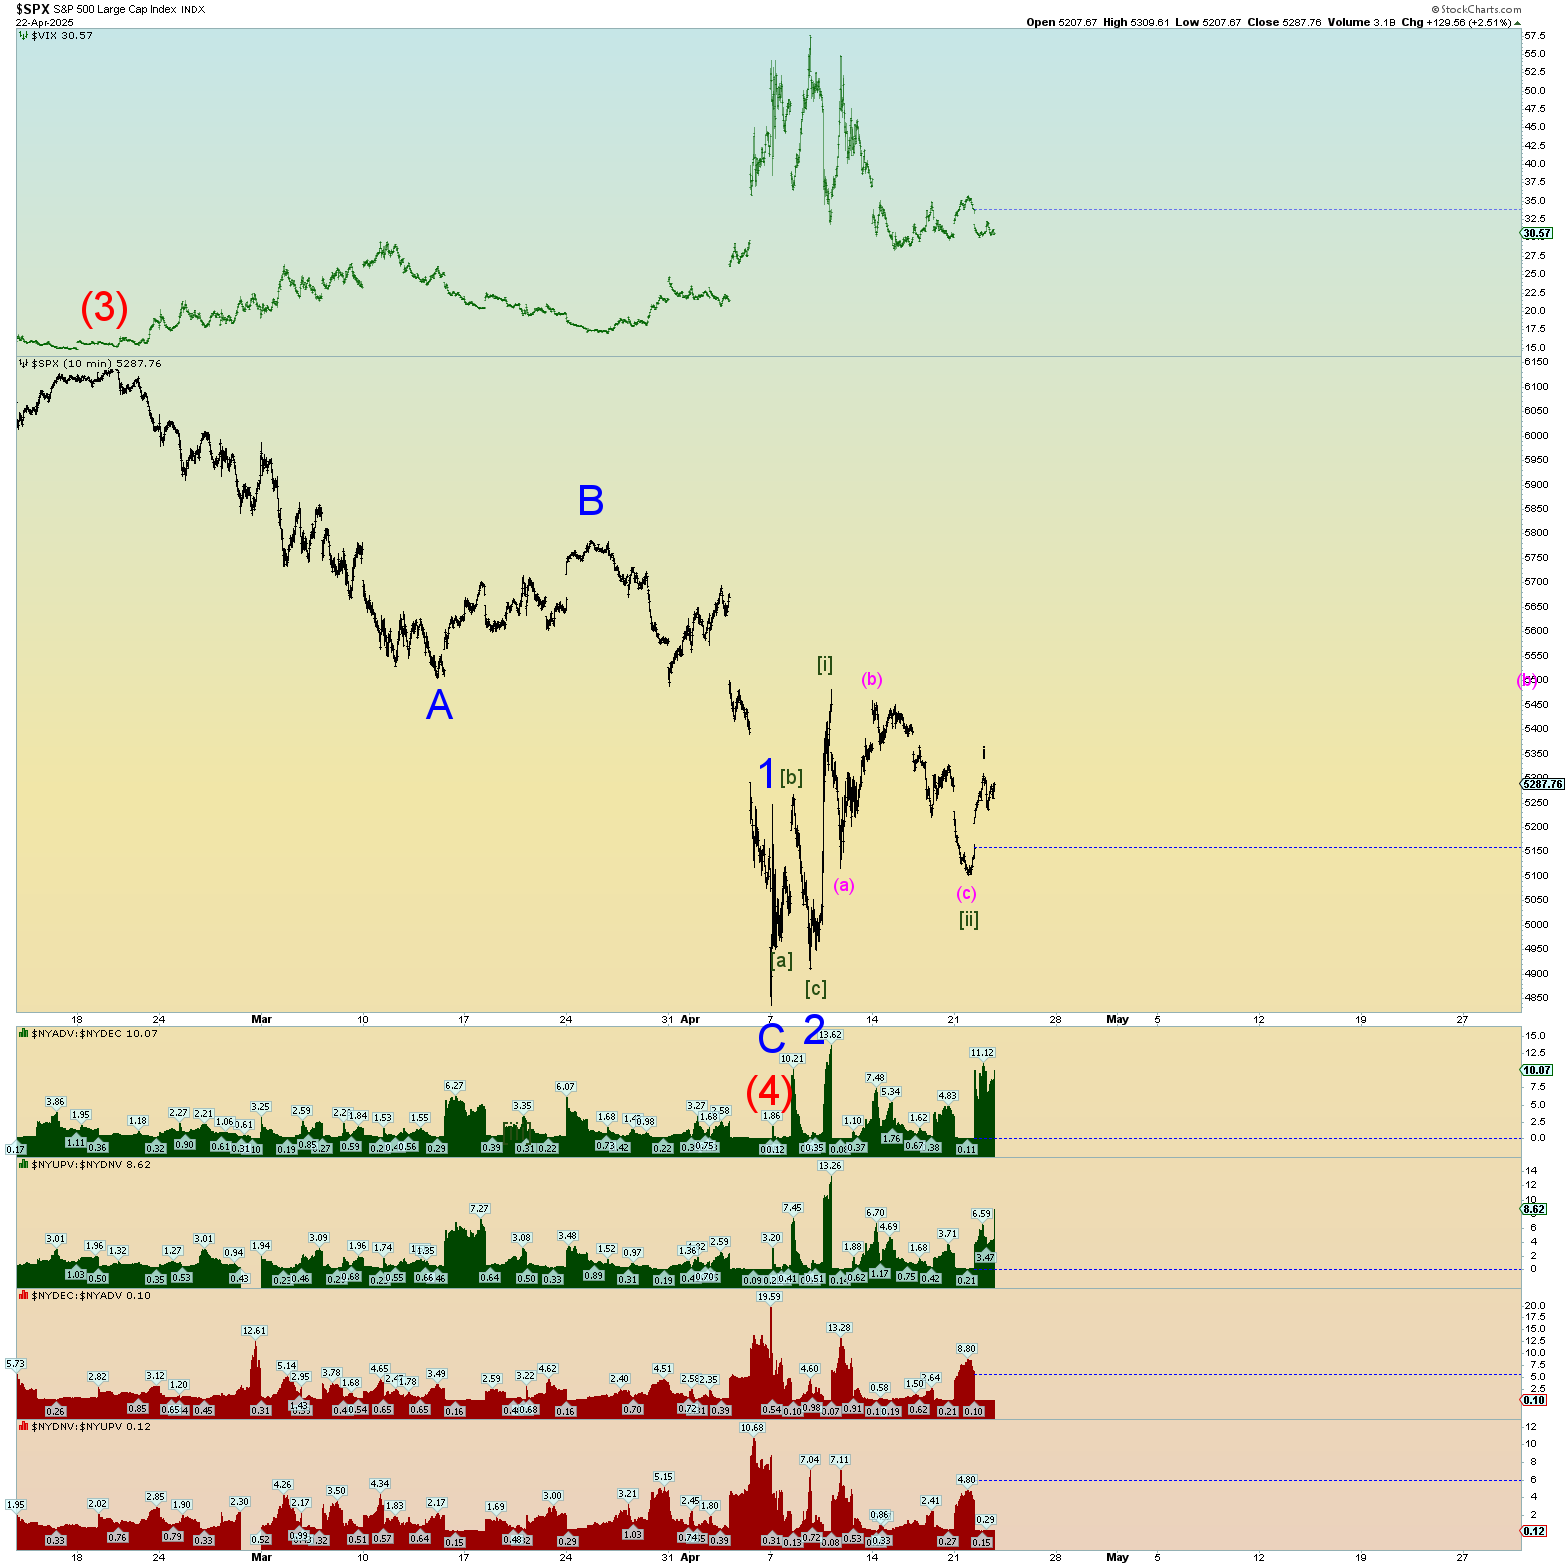
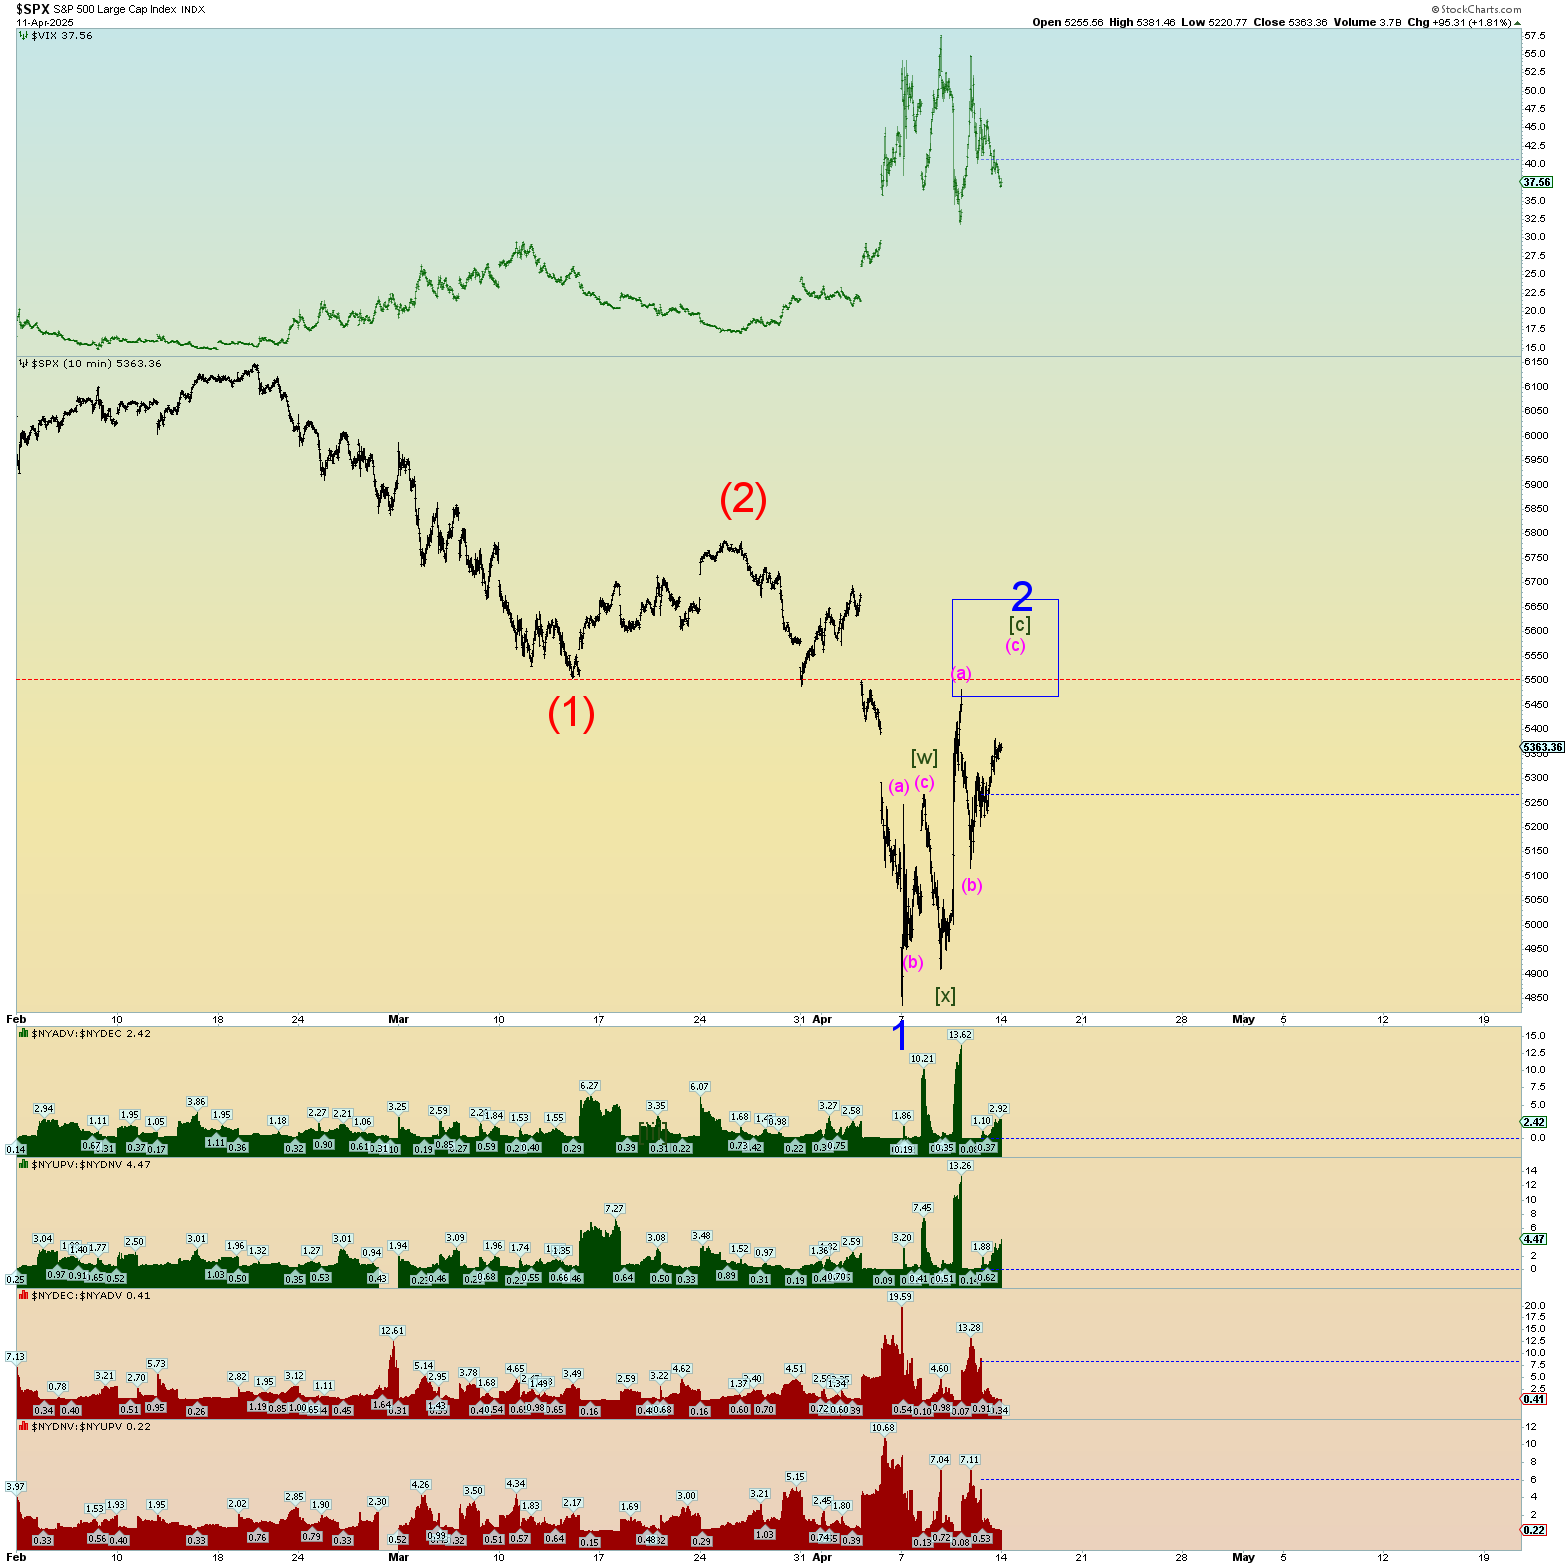
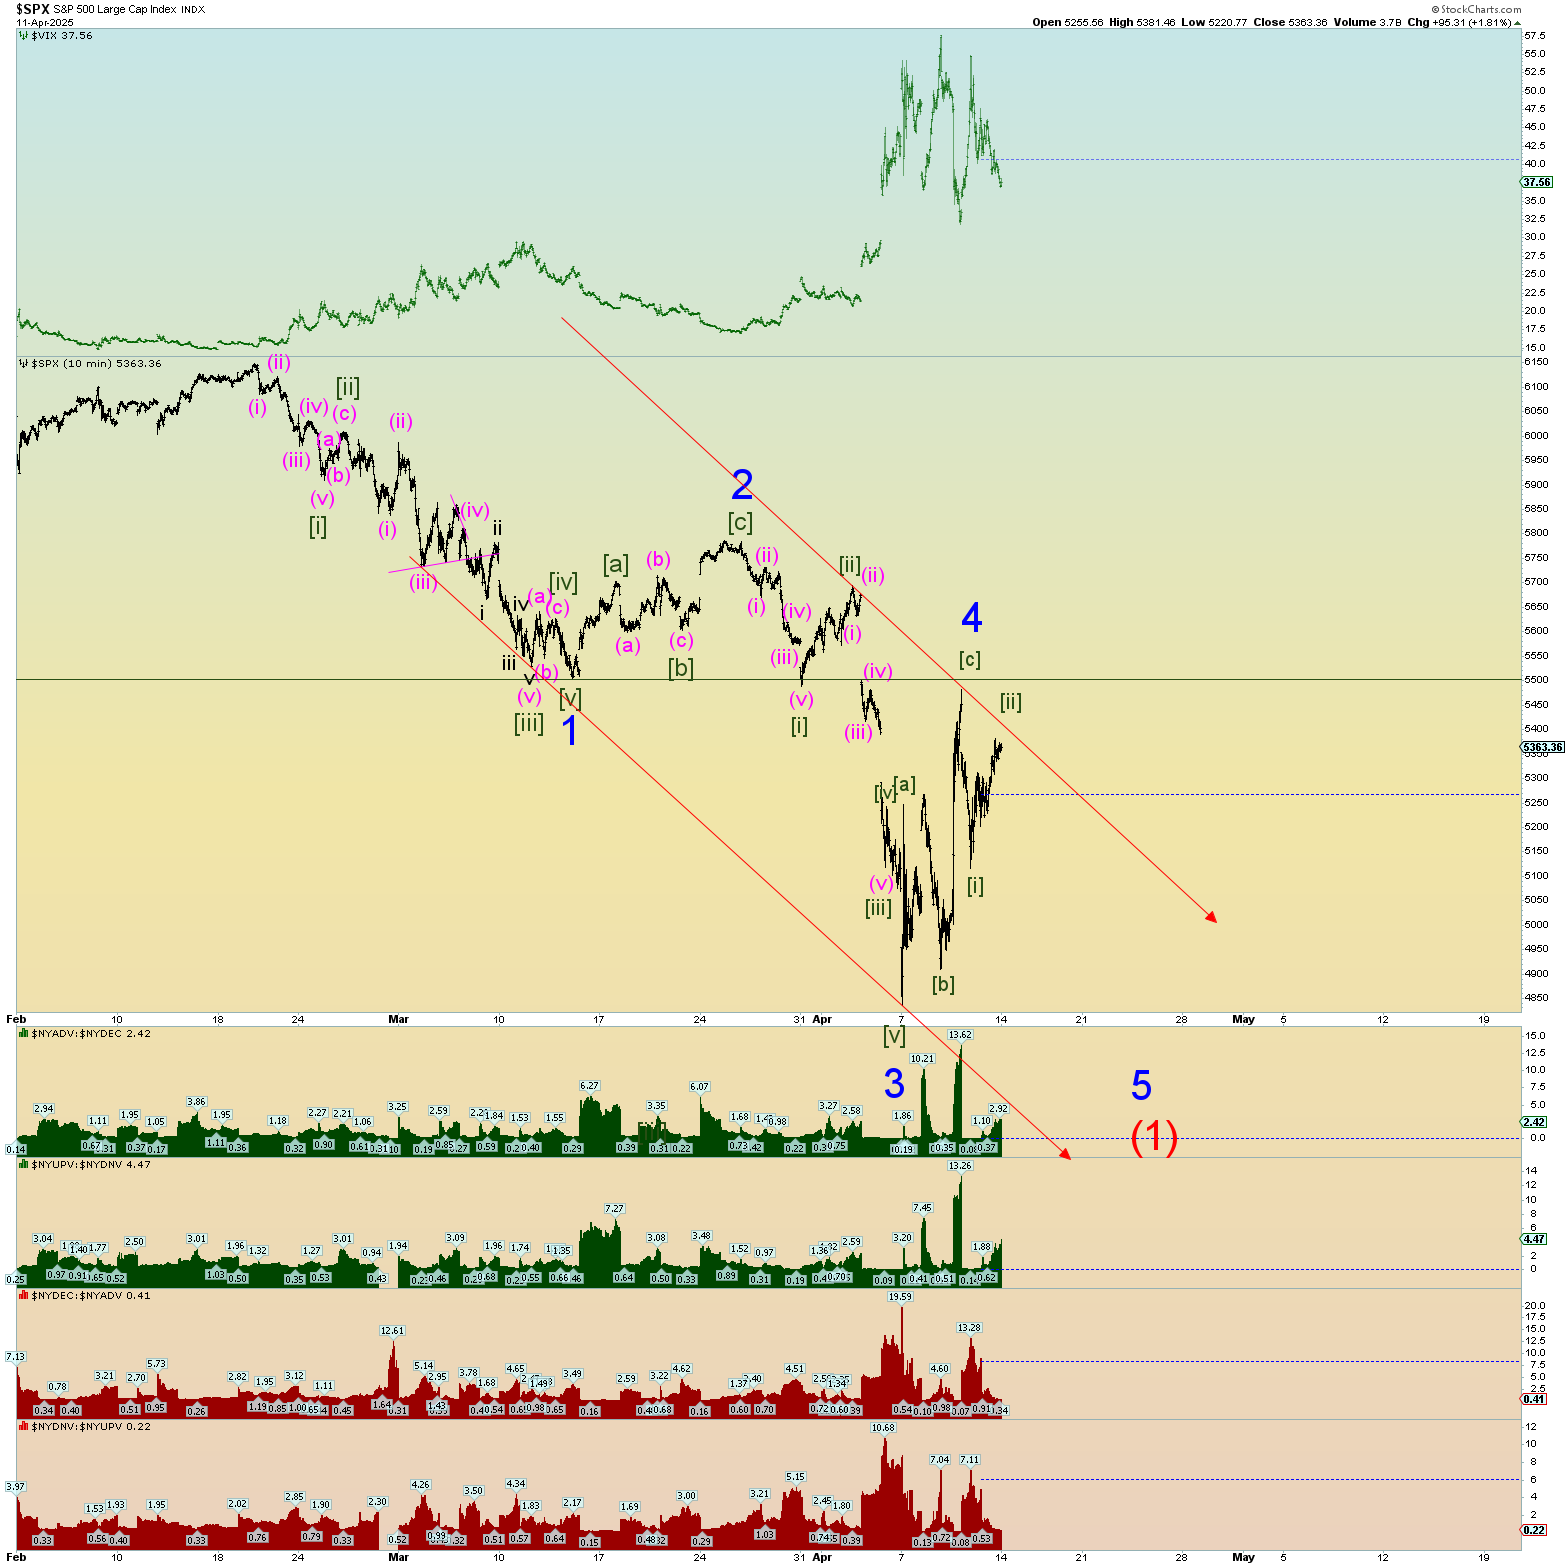
Just one proposed squiggle chart. Obviously, there is room to operate a bit. A Minute [iii] of 3 up channel to be followed may be emerging. Perhaps it is too steep, we’ll adjust if need be.
The bullish count which seems to be winning out, has the market about to experience “upside surprise” or the middle of a wave (iii) of [iii] of 3 of (5) up. “Thrid of a third” up.
Like I said in yesterday’s post, for the bears to regain control, they need to induce a very sharp selloff that gains downward momentum and breaks things again. They gave it their best shot today and as soon as I seen today’s gap down early low and the price action for the next 20 minutes or so, I labeled this chart as such, and it held up all day.
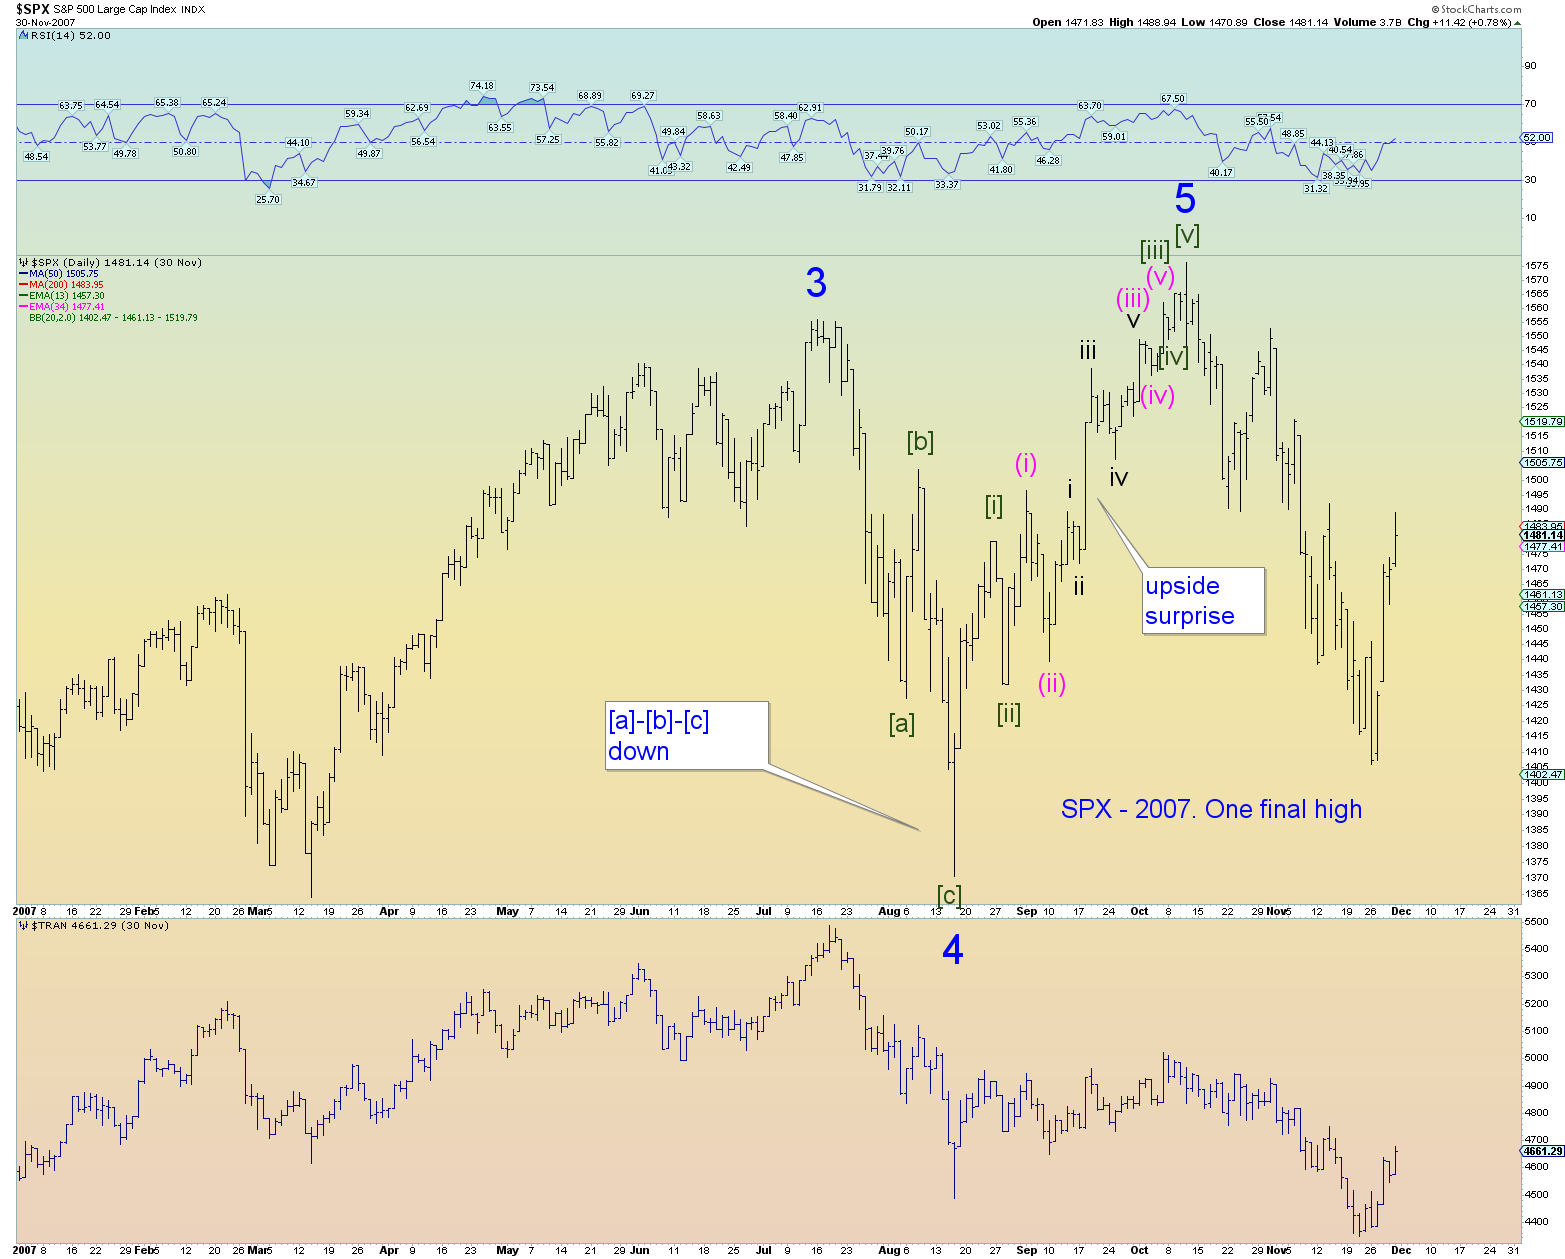
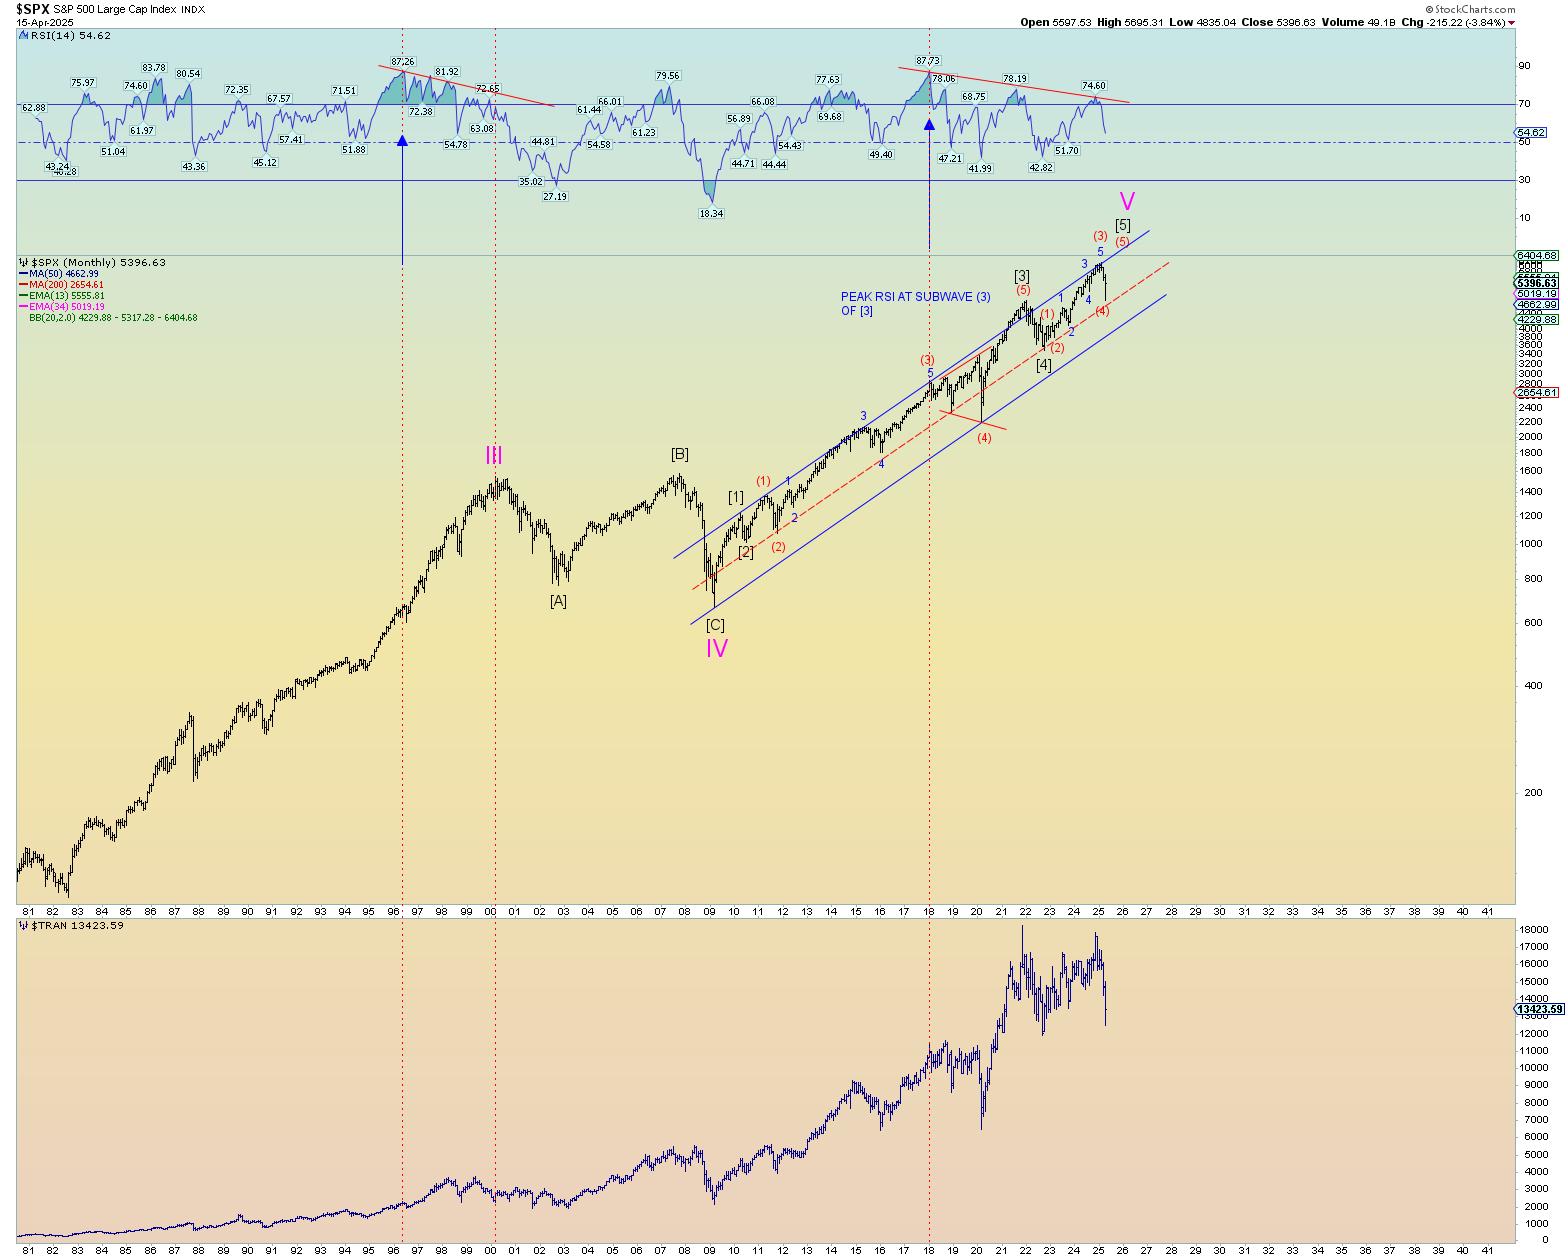
The setup today reminds me perhaps of what happened in 2007’s major market October peak. We had a sharp [a]-[b]-[c] down – a 12% drop, spike bottom – and then a series of very large [i]-[ii], (i)-(ii) and i -ii up. (Obviously 2007’s waves are labeled one degree lower). Then came upside surprise and then a quick series of wave “fours” which finished the pattern.
The path back to the top, despite being 1 wave degree lower was fairly quickly. About exactly 2 months. If we extrapolate that the same thing is happening today, by about July 4th we should be close or have already topped. Again, this is just a quick wag based on comparing 2007 to today at 1 degree wave higher.
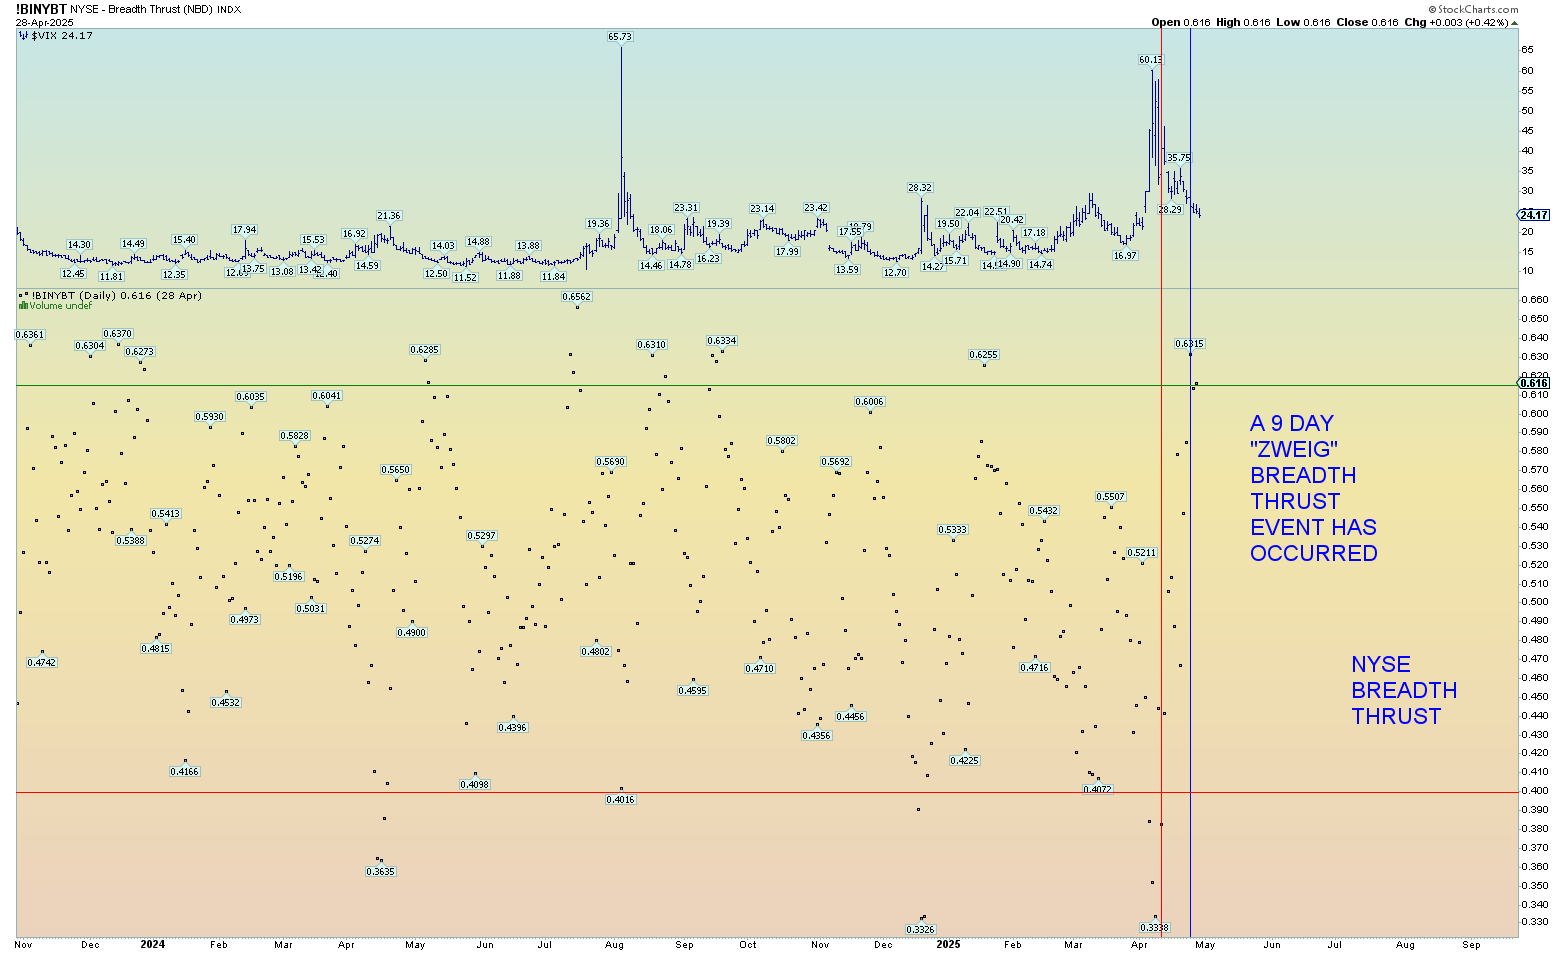
The New York Stock Exchange experienced a very fast and rare “Zweig” breadth thrust event. Within 9 days, the breadth went from well beneath .40 to above .615 indicating an abnormal “thrust” event appetite for stocks and a fairly reliable indicator that a new all-time high will eventually occur. A thrust event of this magnitude almost always indicates much higher prices are coming, at least a challenge to all-time highs. The VIX seems to be steadying down, and the massive intraday moves have subsided as a result. In other words, a slow steady grind for the SPX and INDU back toward all-time highs would likely take 2-5 months (from its recent low). A summer of “climbing the [media-induced] wall of worry”.
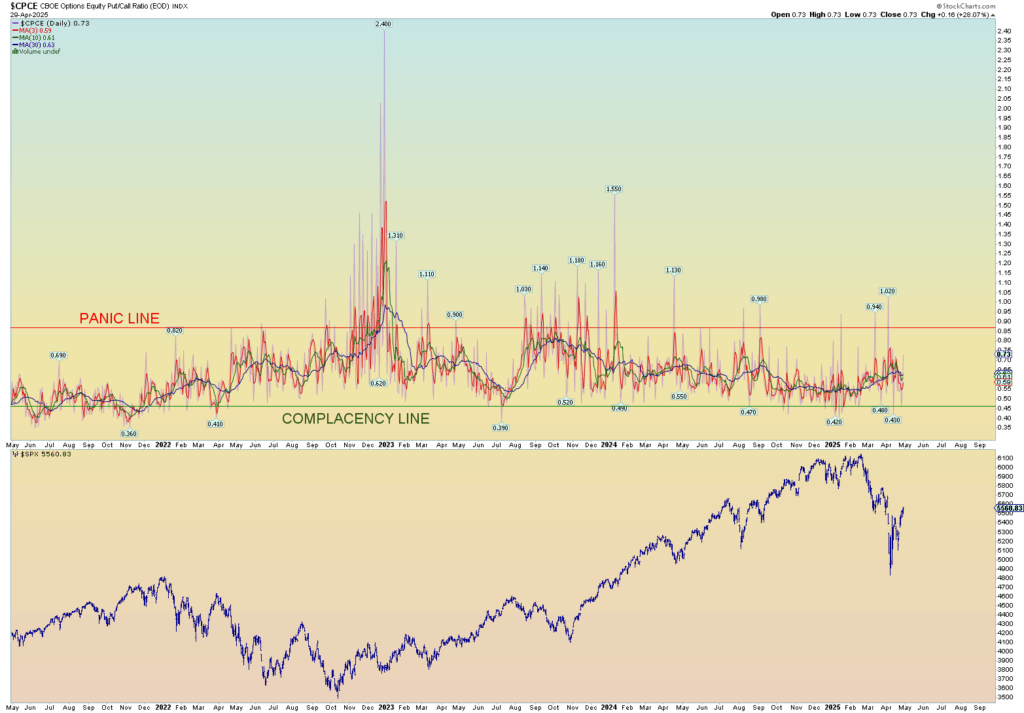
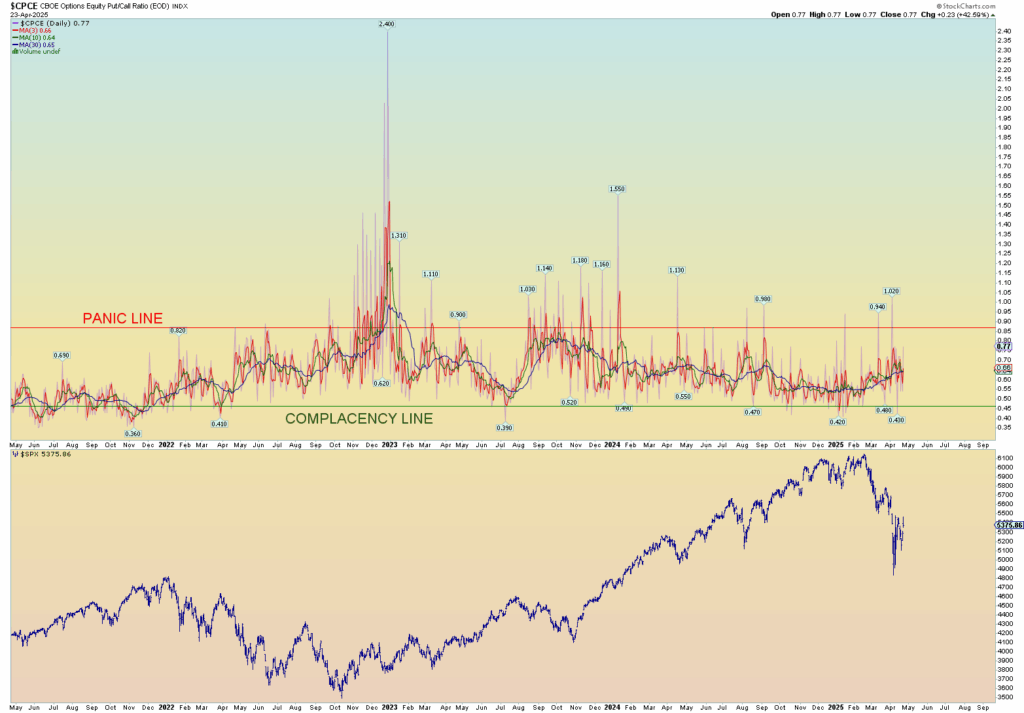
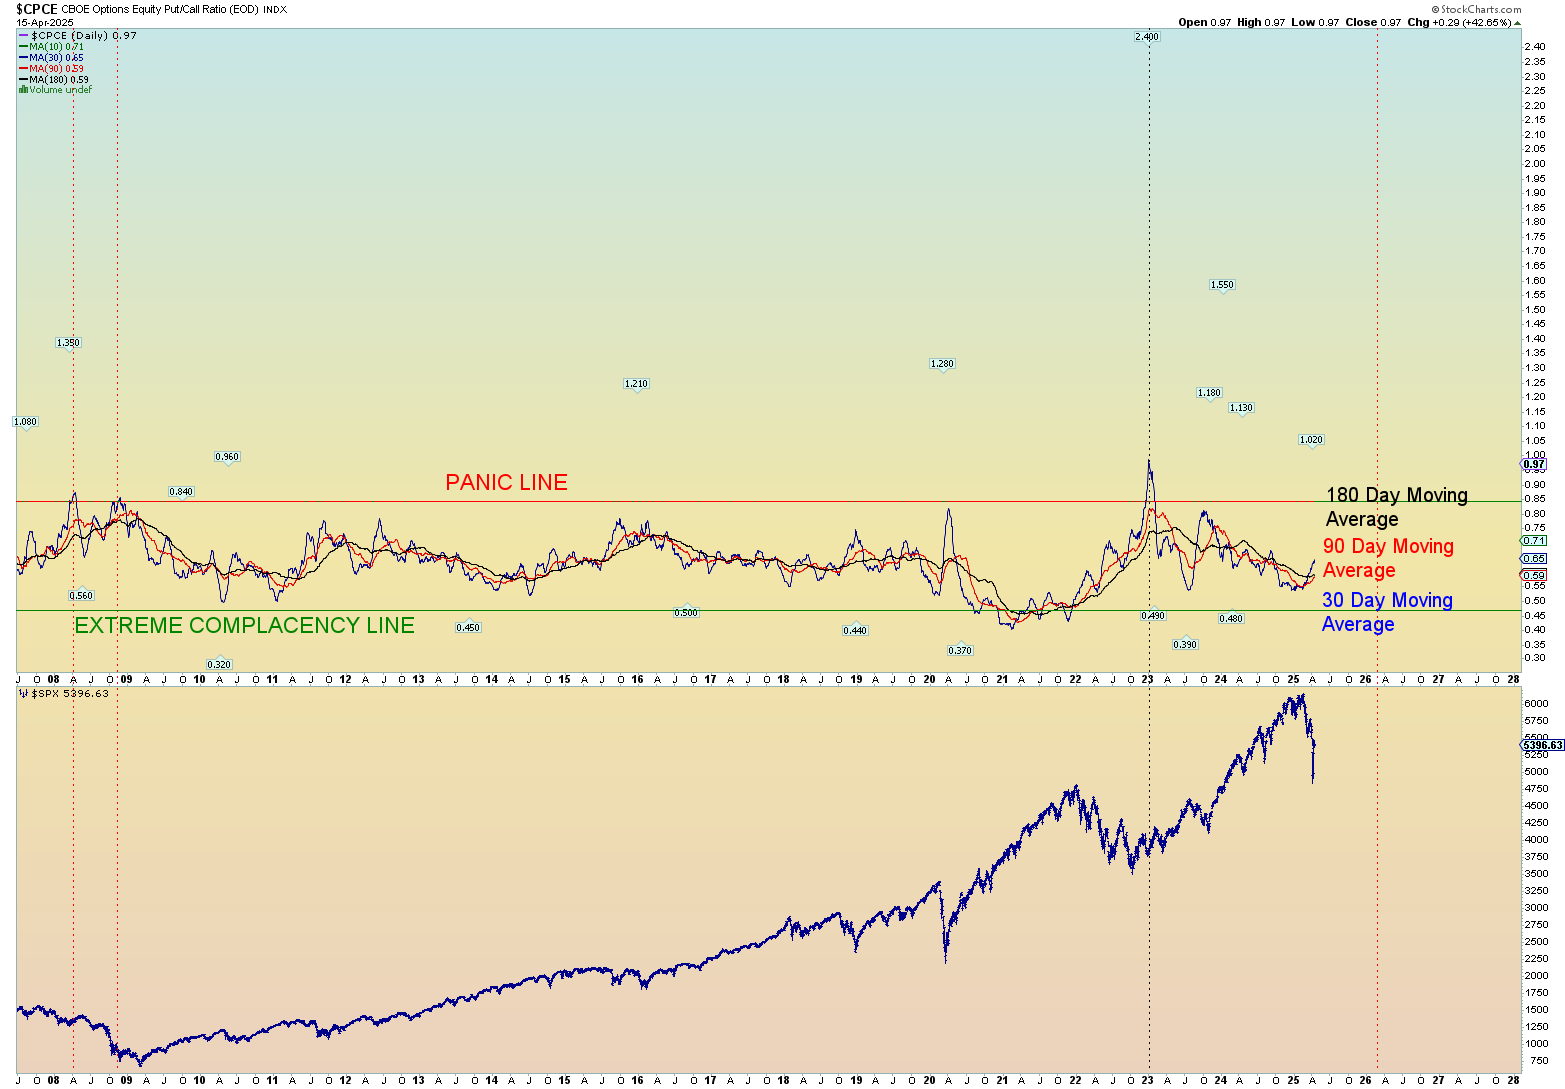
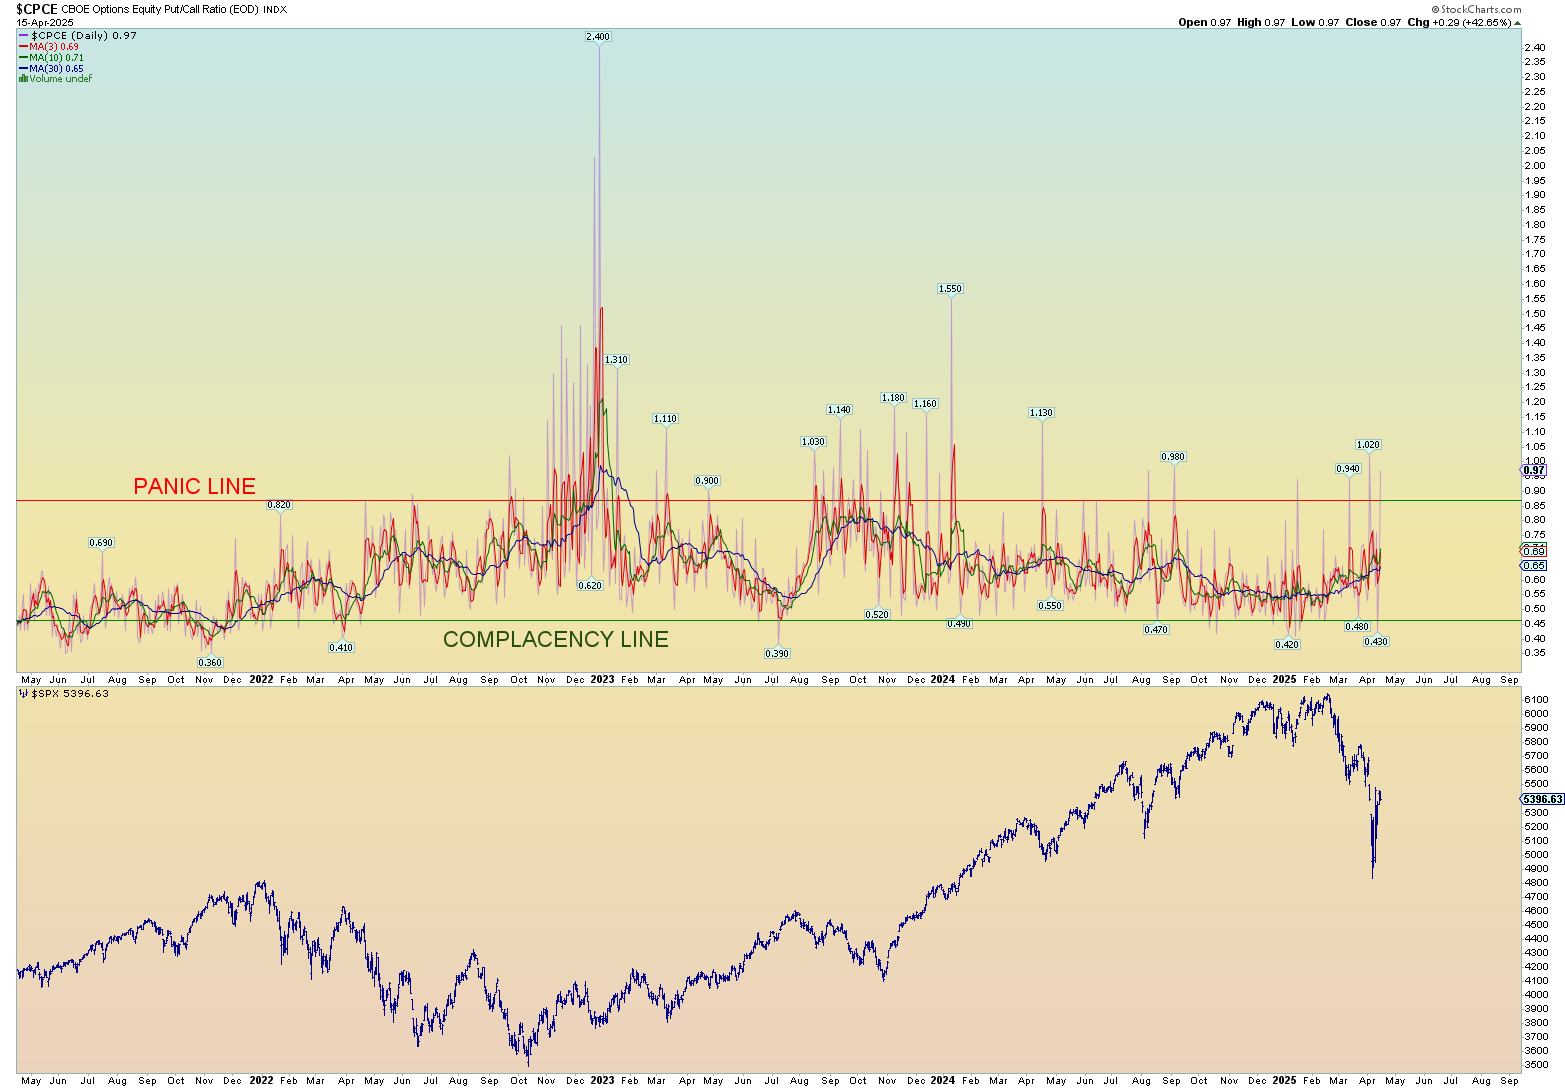
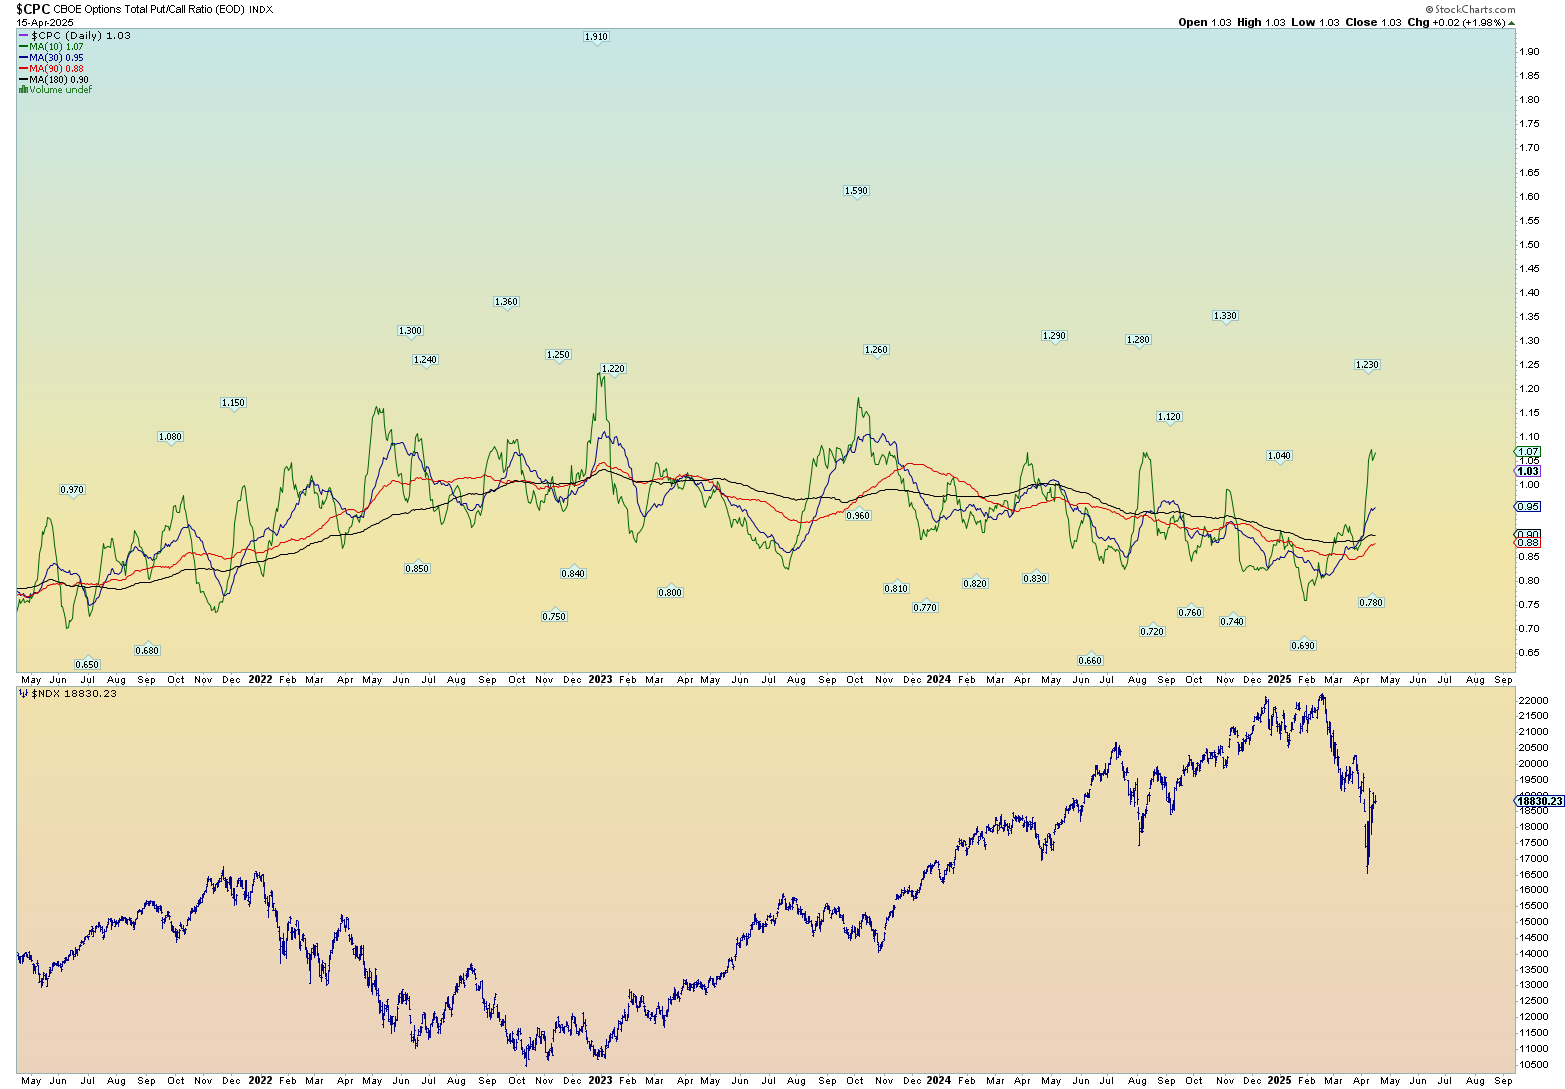
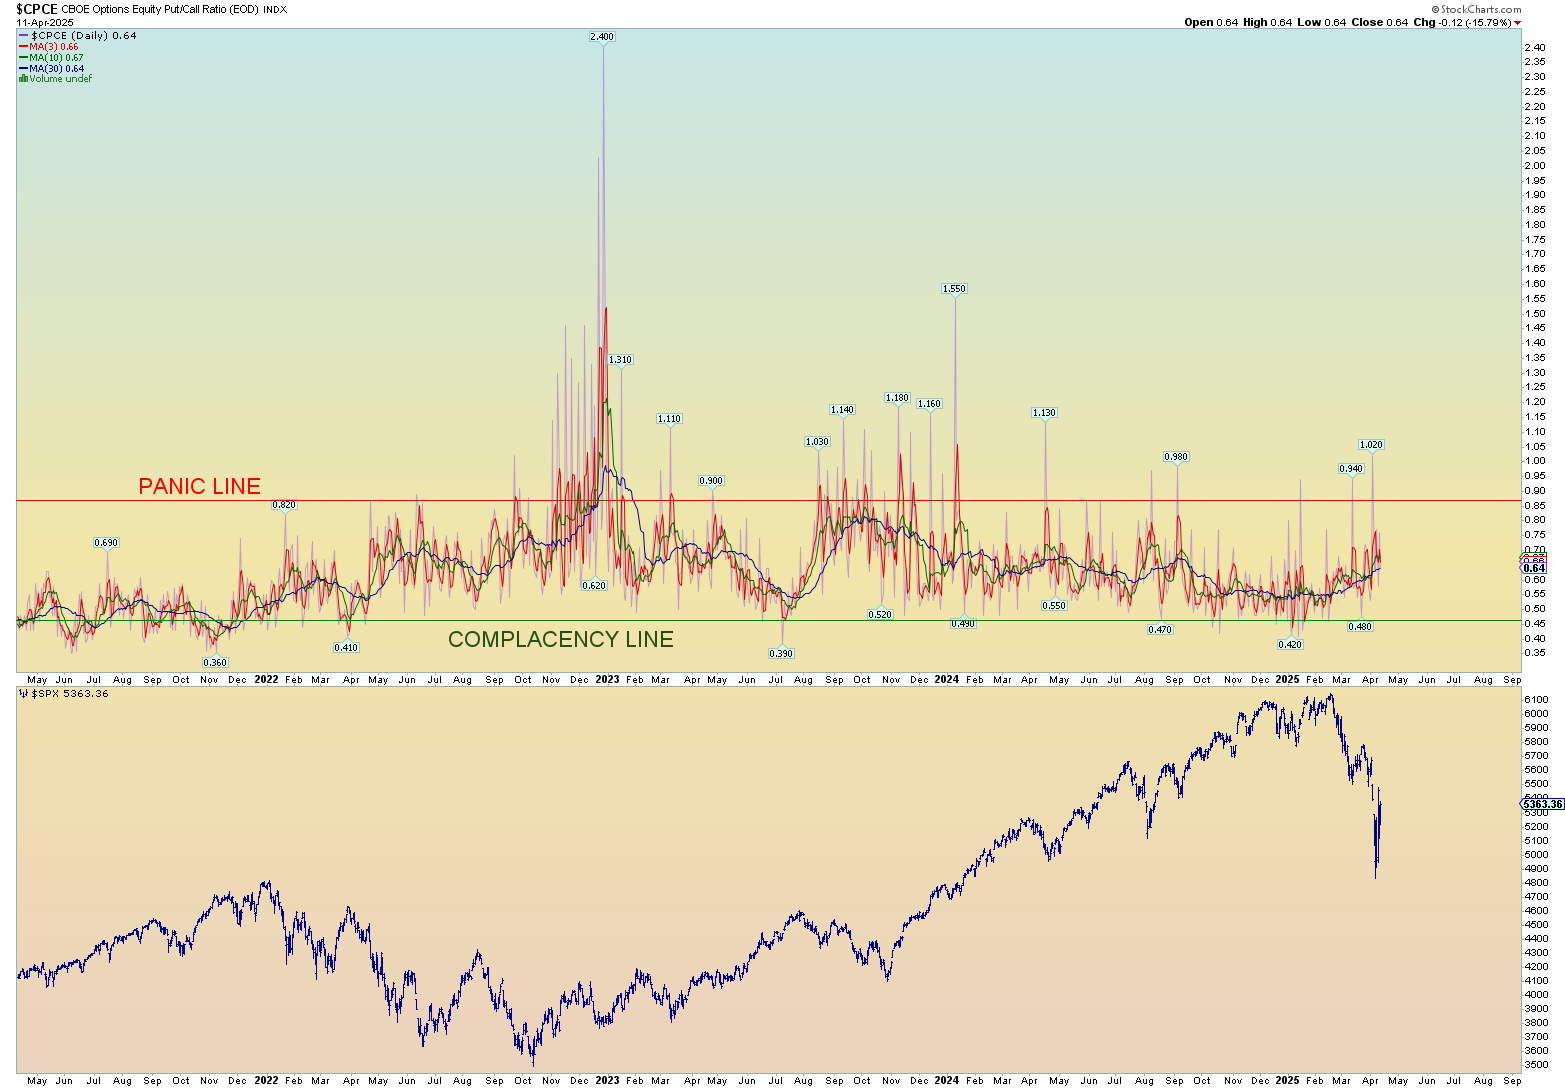
Again, I assumed the CPCE would indicate “panic” at some stage in this correction, but it has not. Despite the media wanting to be super bearish and hate Trump and his administration and want to take him down by constant gloom and doom, the underlying truth is that true market panic was just not there. Yes, it was reflected in the elevated VIX (which is very sensitive in these extremely leveraged markets), yet the underlying CPCE put/call ratio barely got excited. Seems more of a technical washout event meant to shake out weak hands to load up on cheaper prices.
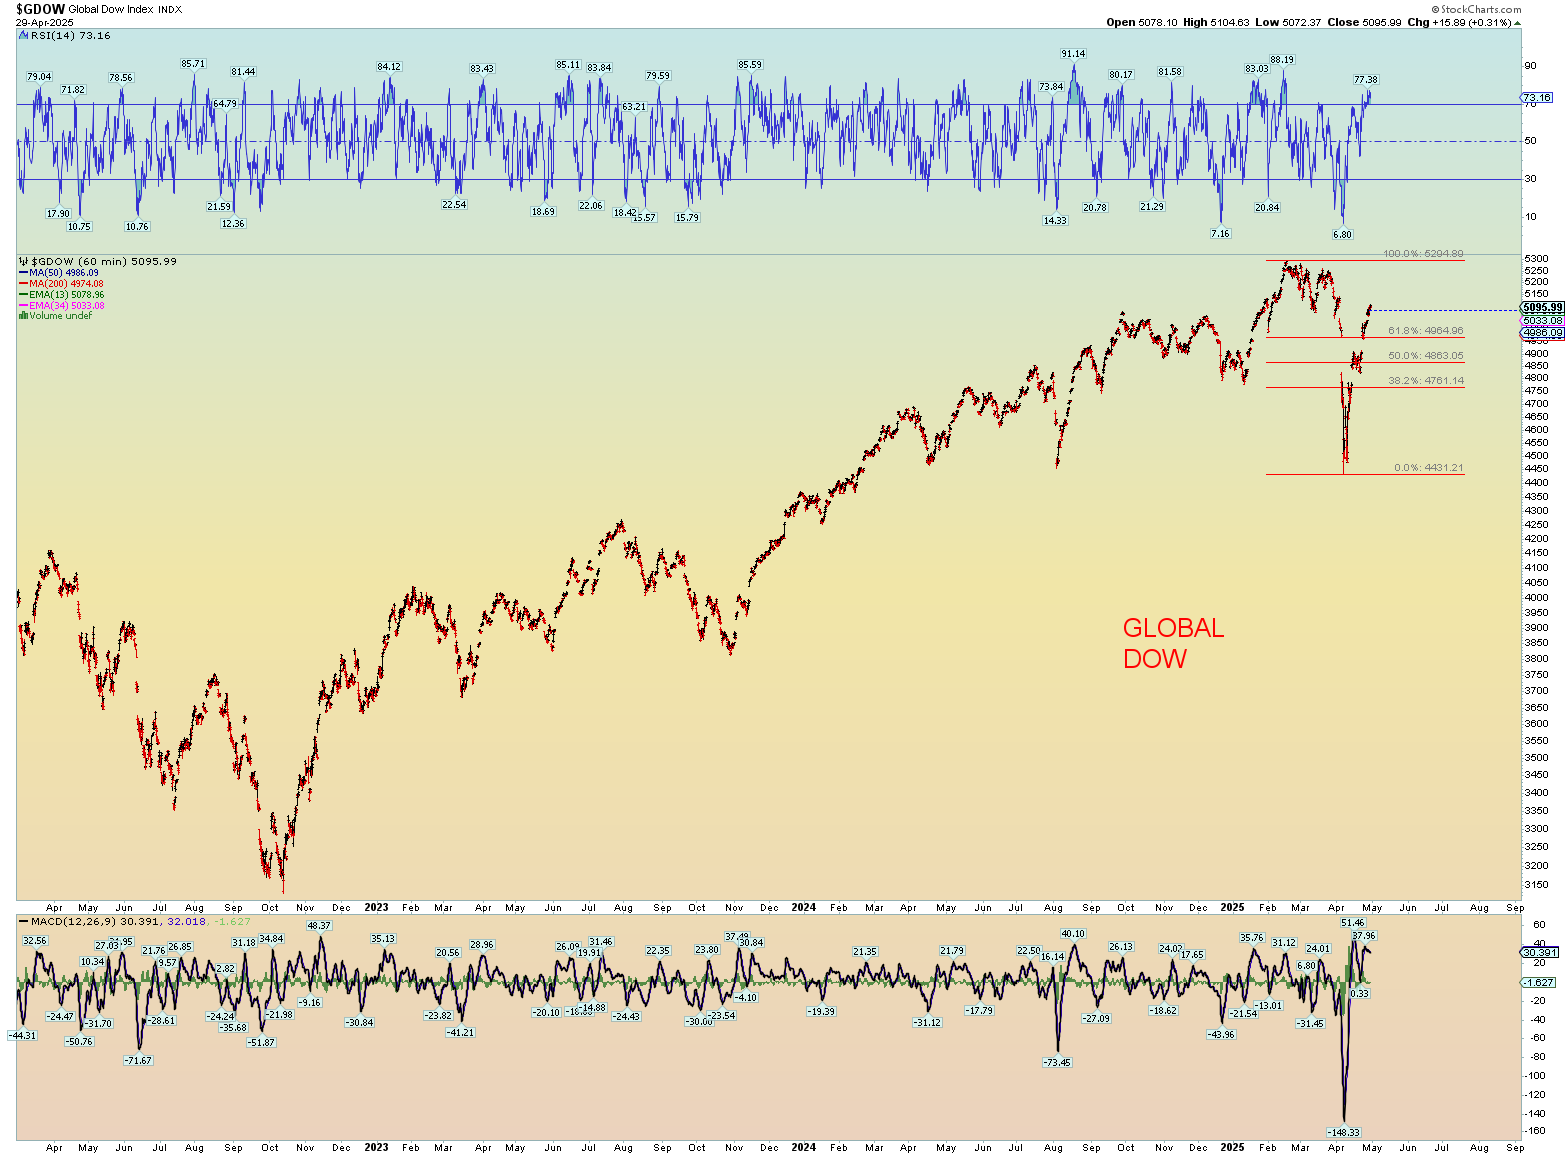
The Global Dow has recovered quite a bit.
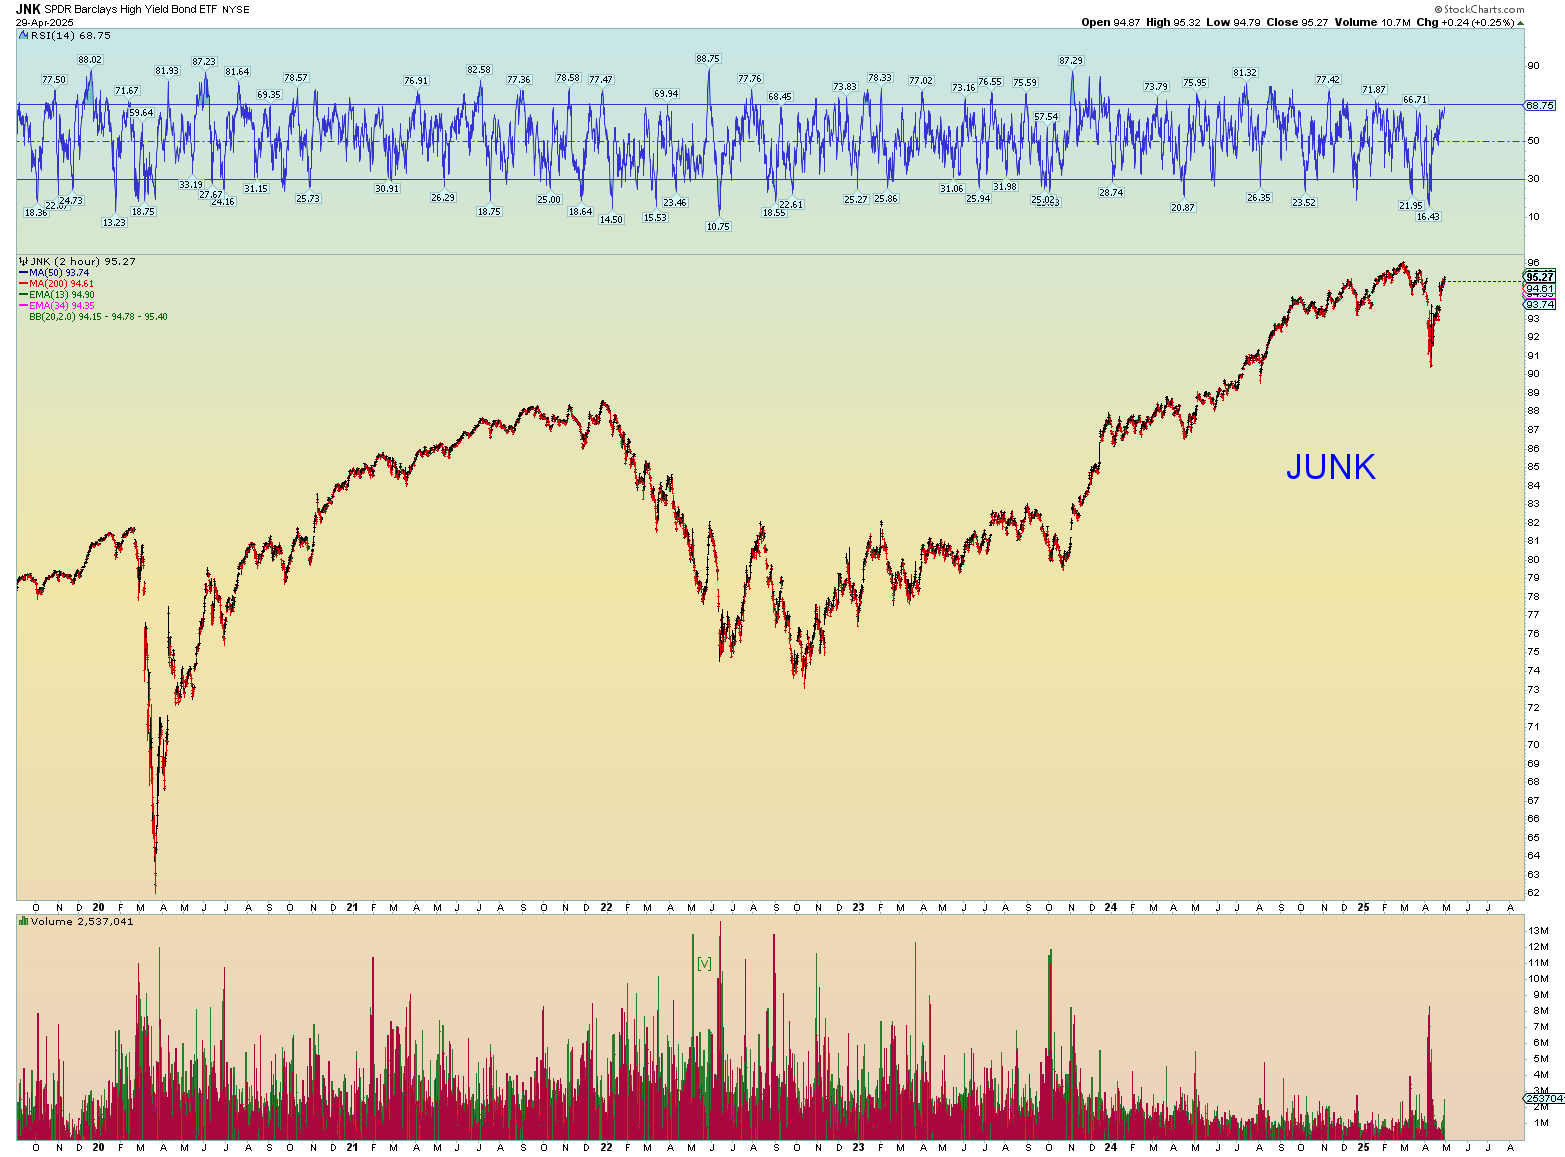
JUNK debt is being gorged upon still.
THE COUNTS – FIRST, THE BULLISH
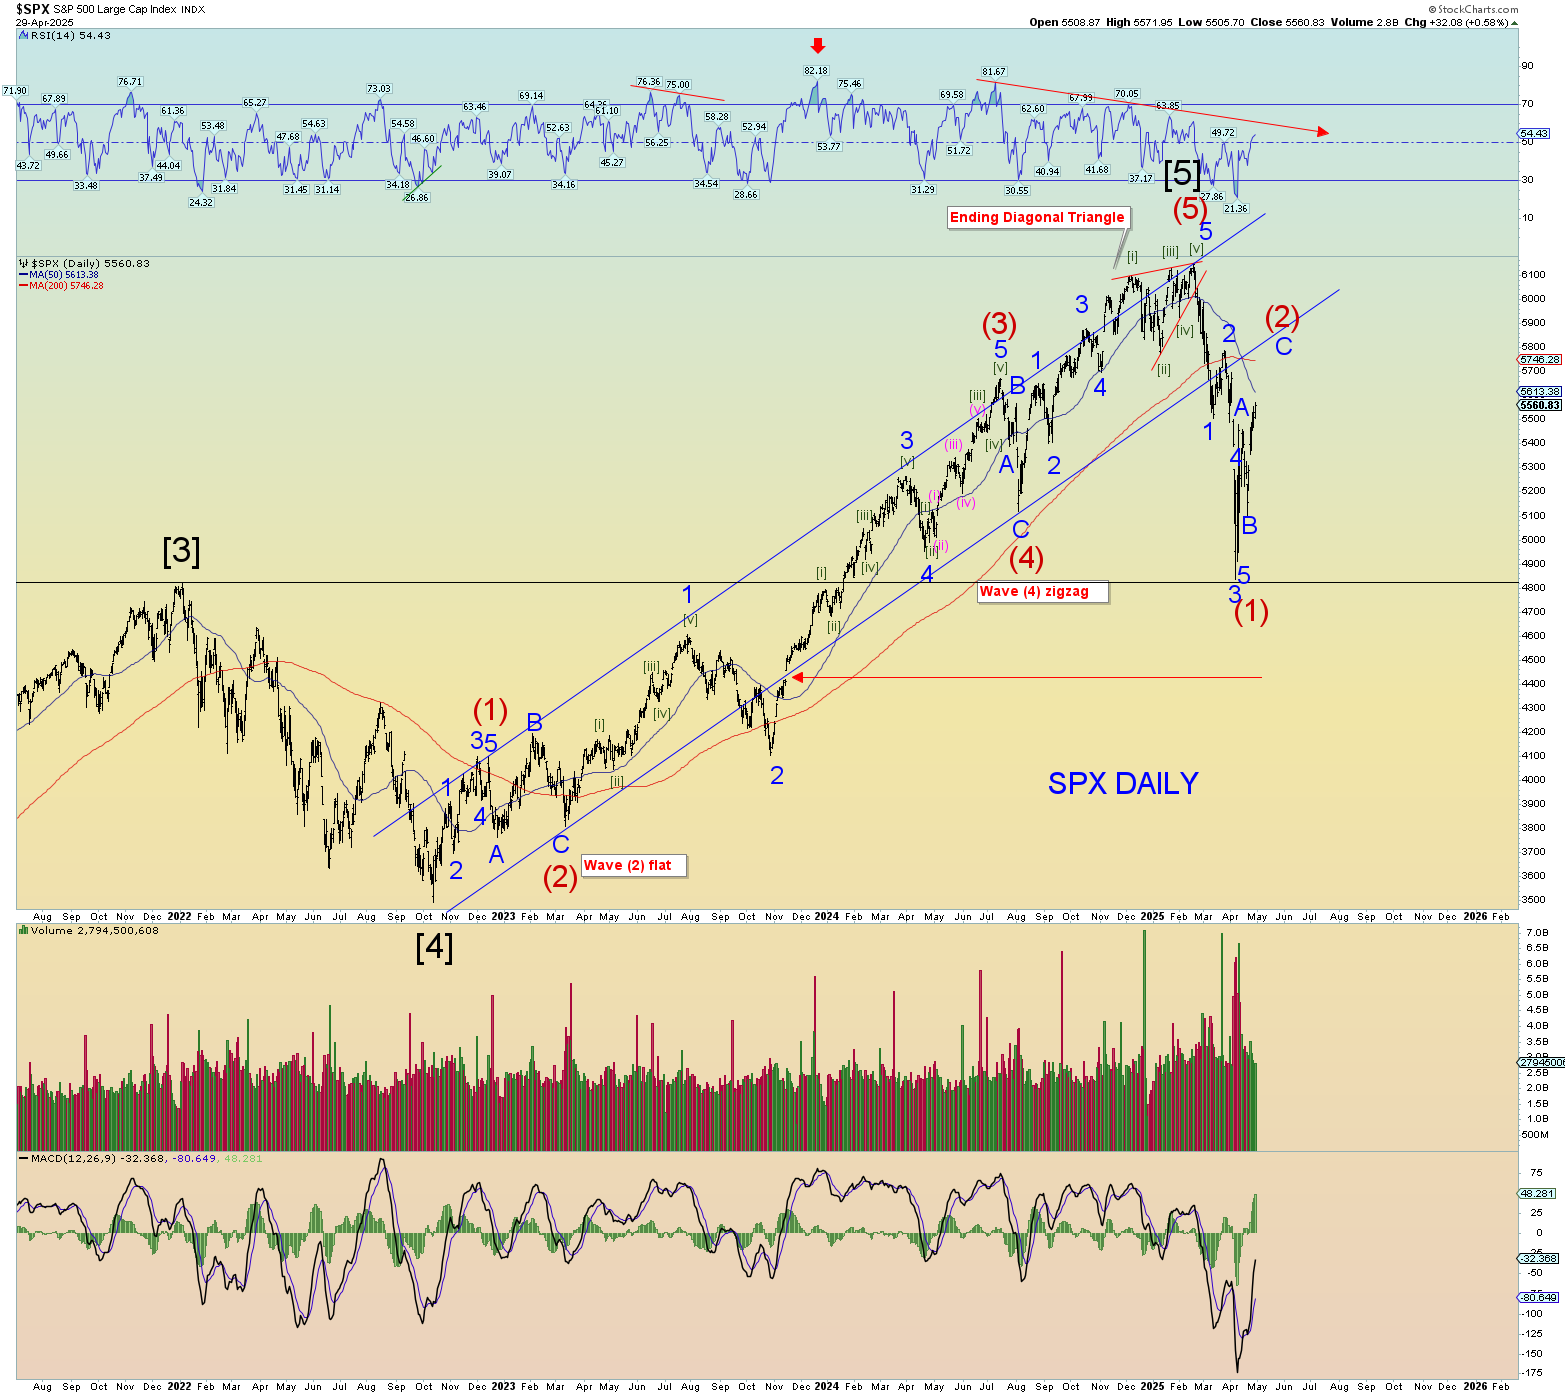
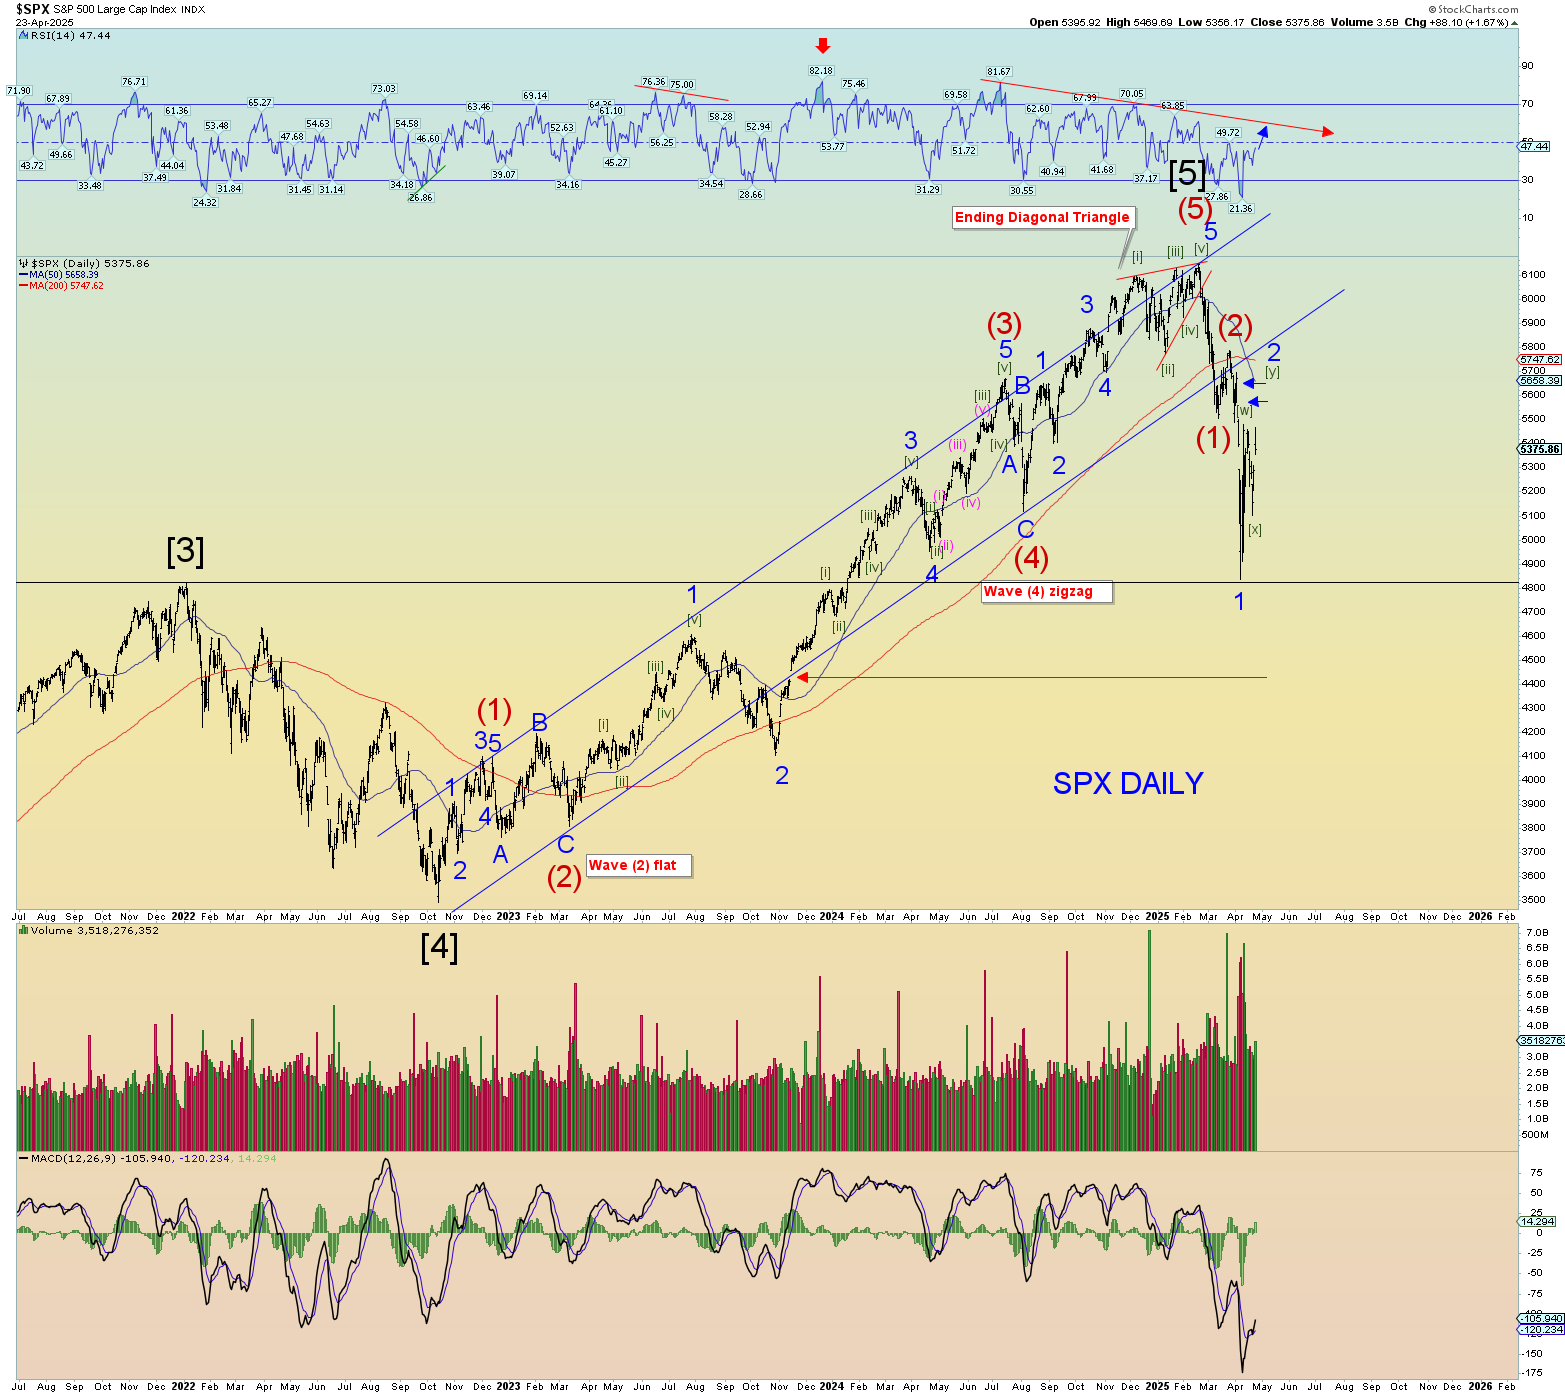
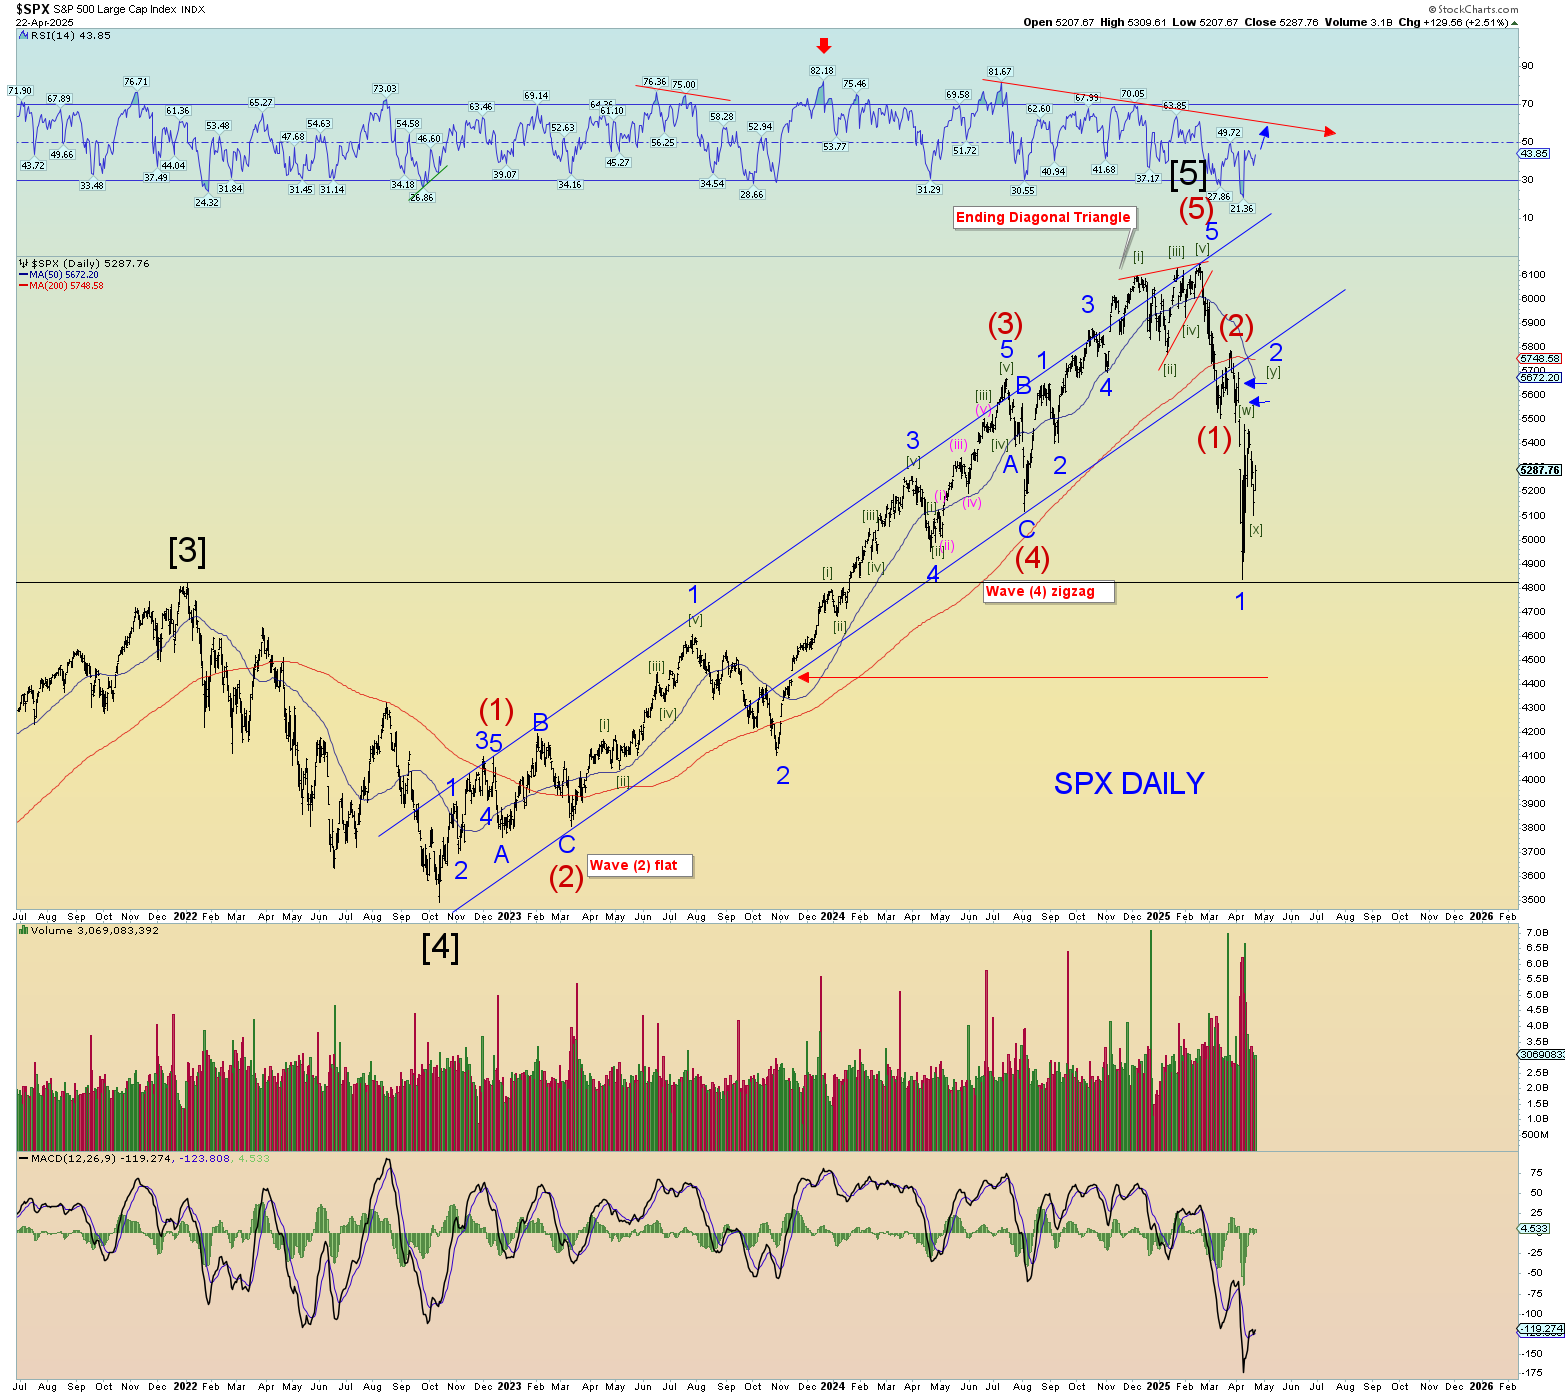
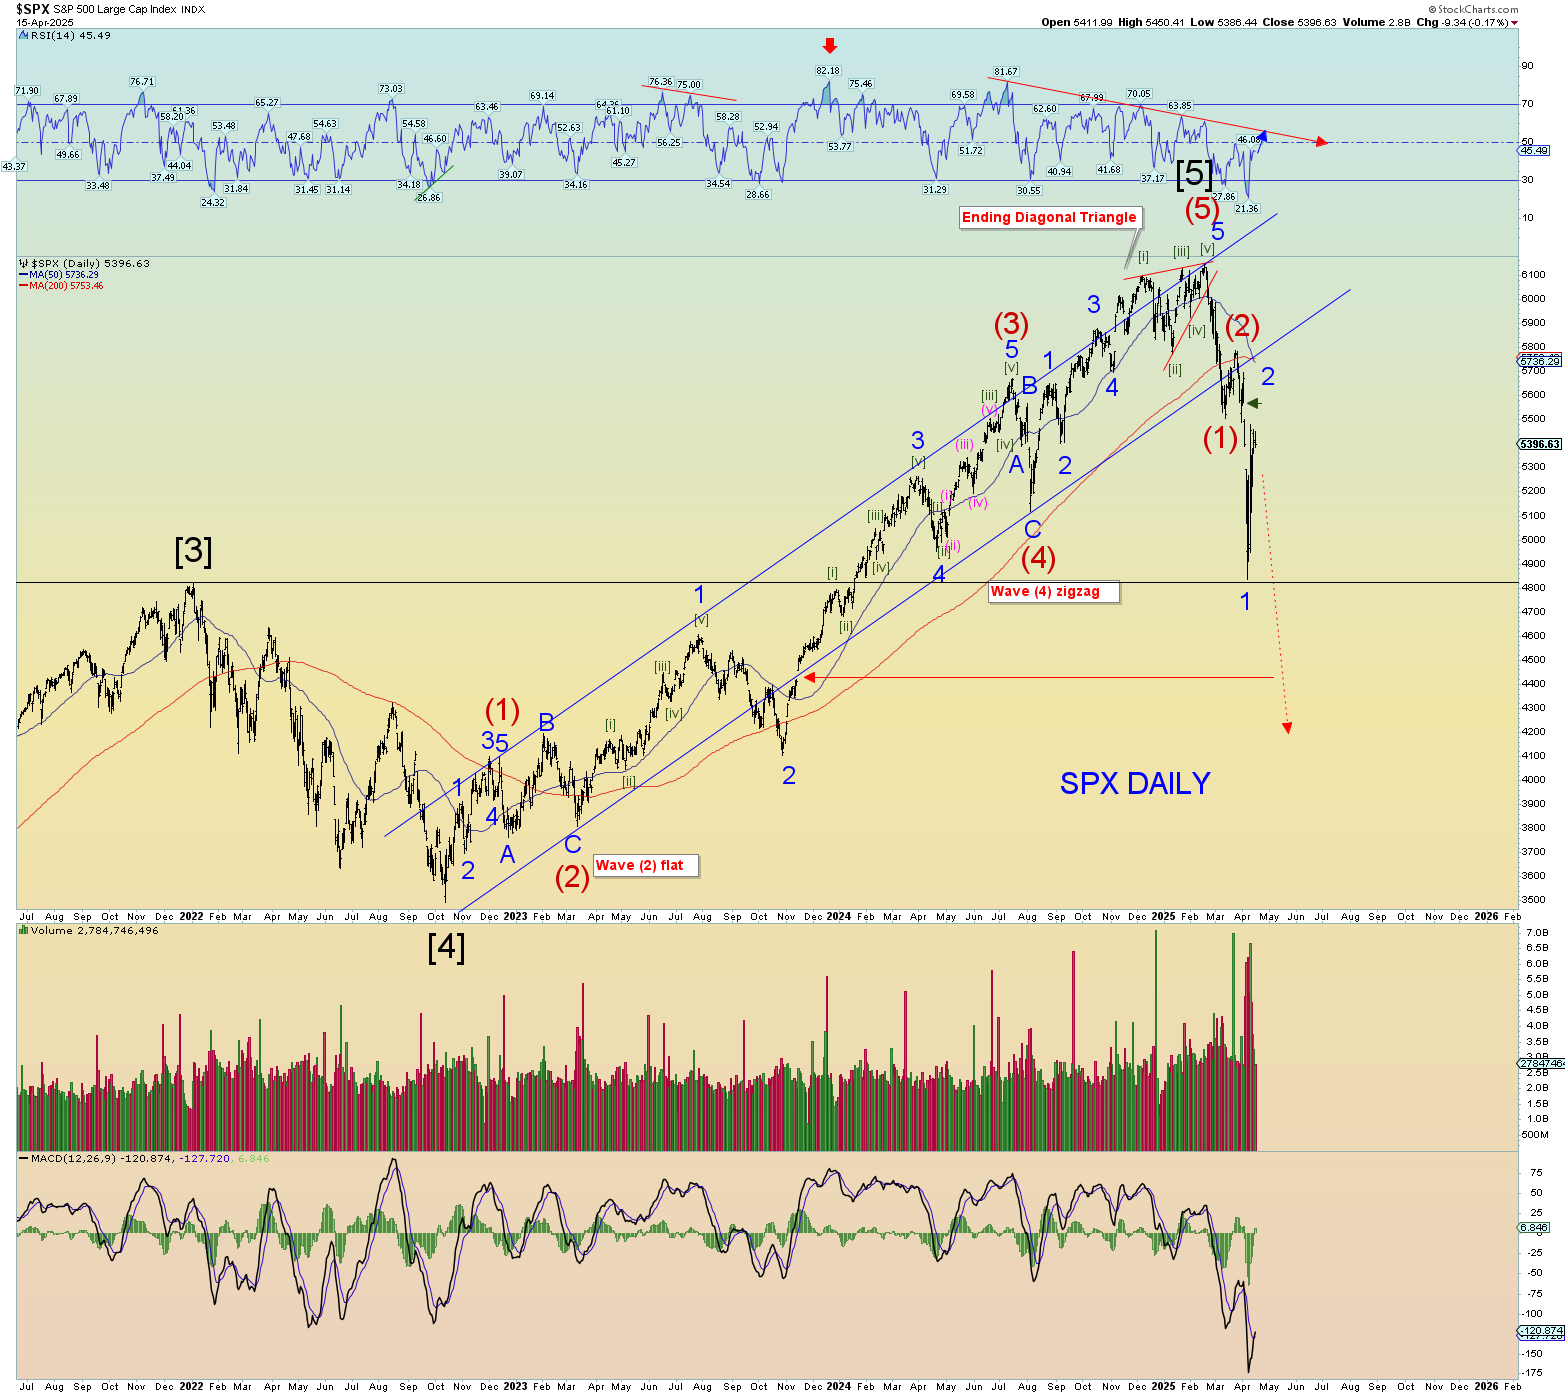
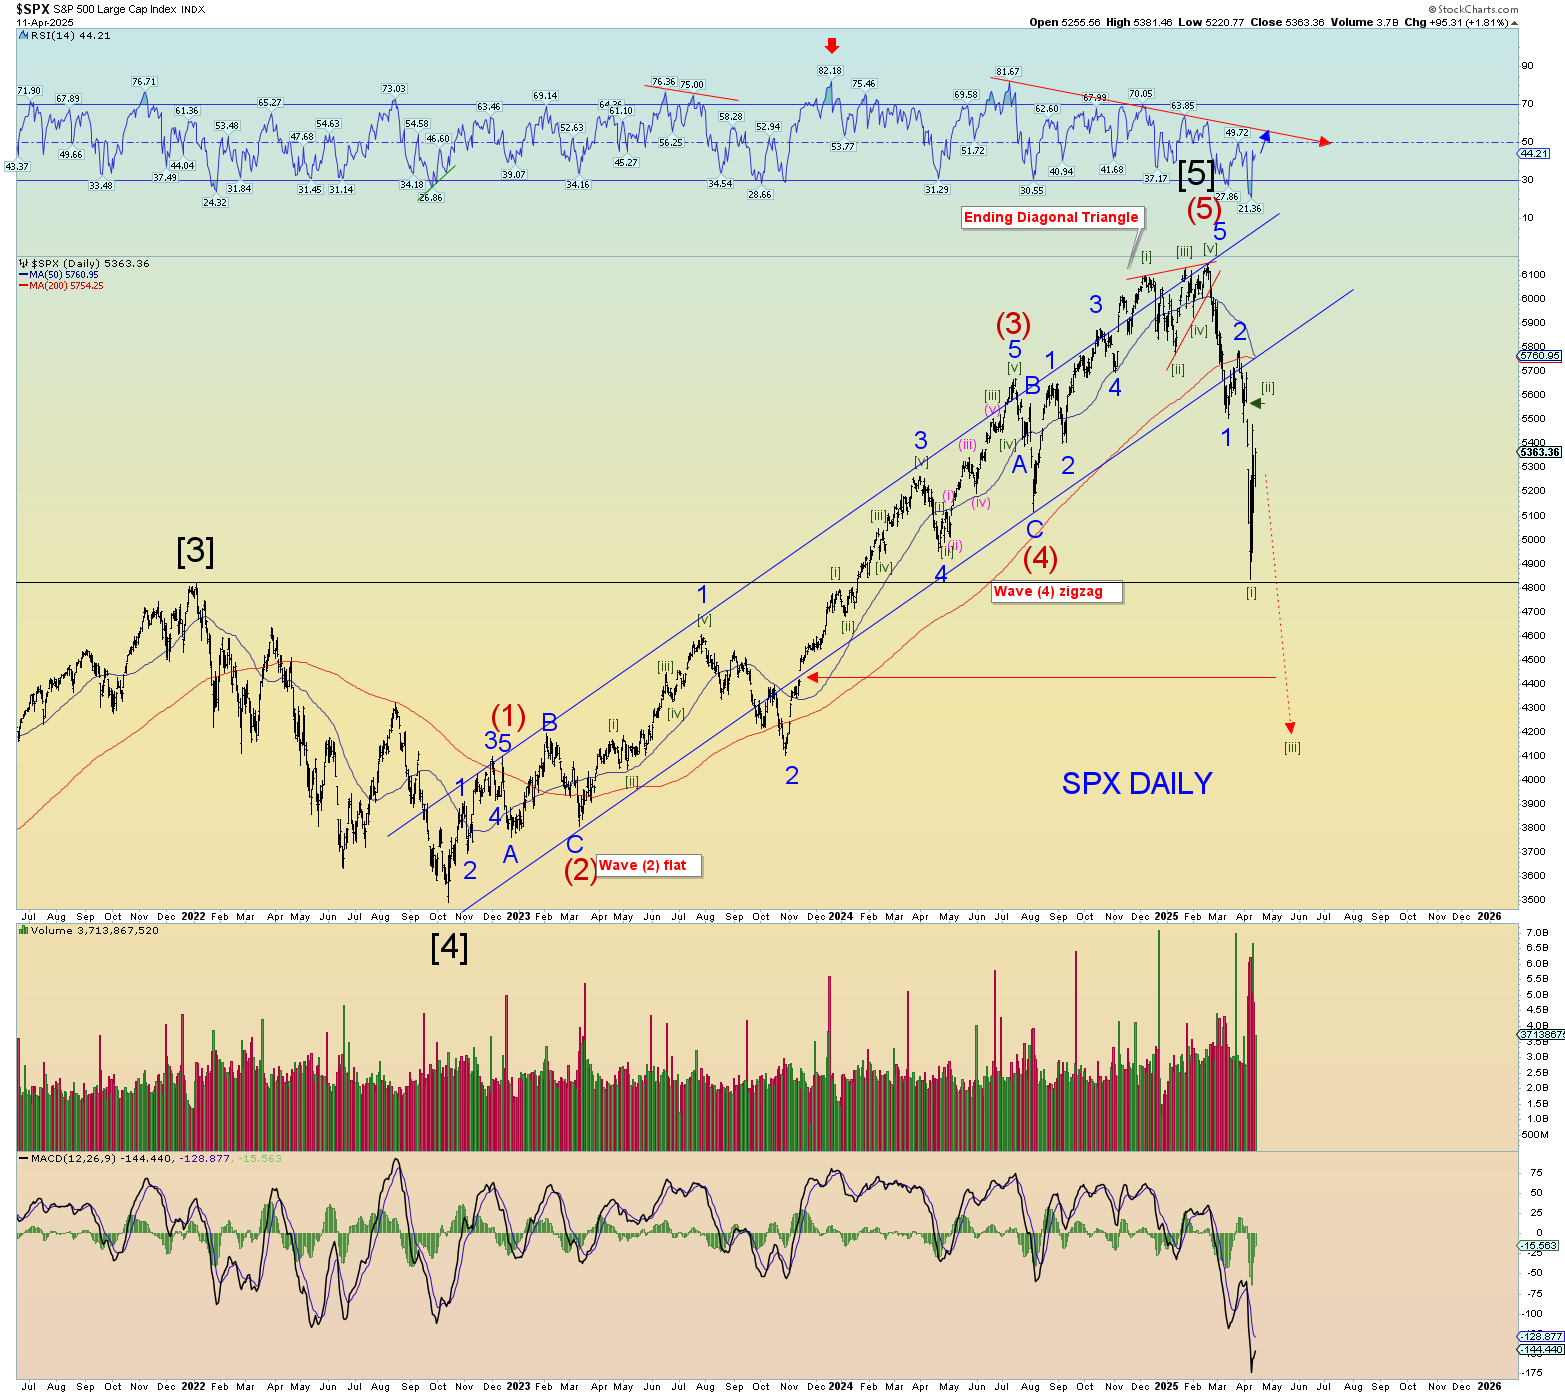
The bullish count, again based on the reliable Zweigh breadth thrust event, has the SPX is a wave (5) count. I have it labeled 1-2, [i]-[ii] up but that could be premature if a more developed multi-month pattern plays out back toward all-time highs. There is nothing objectionable to this count. Yes, wave (4) was quite a shock, but that seems to be the norm anymore. We have wave (3) stretched out nicely and wave (2) alternates in corrective form from wave (4).
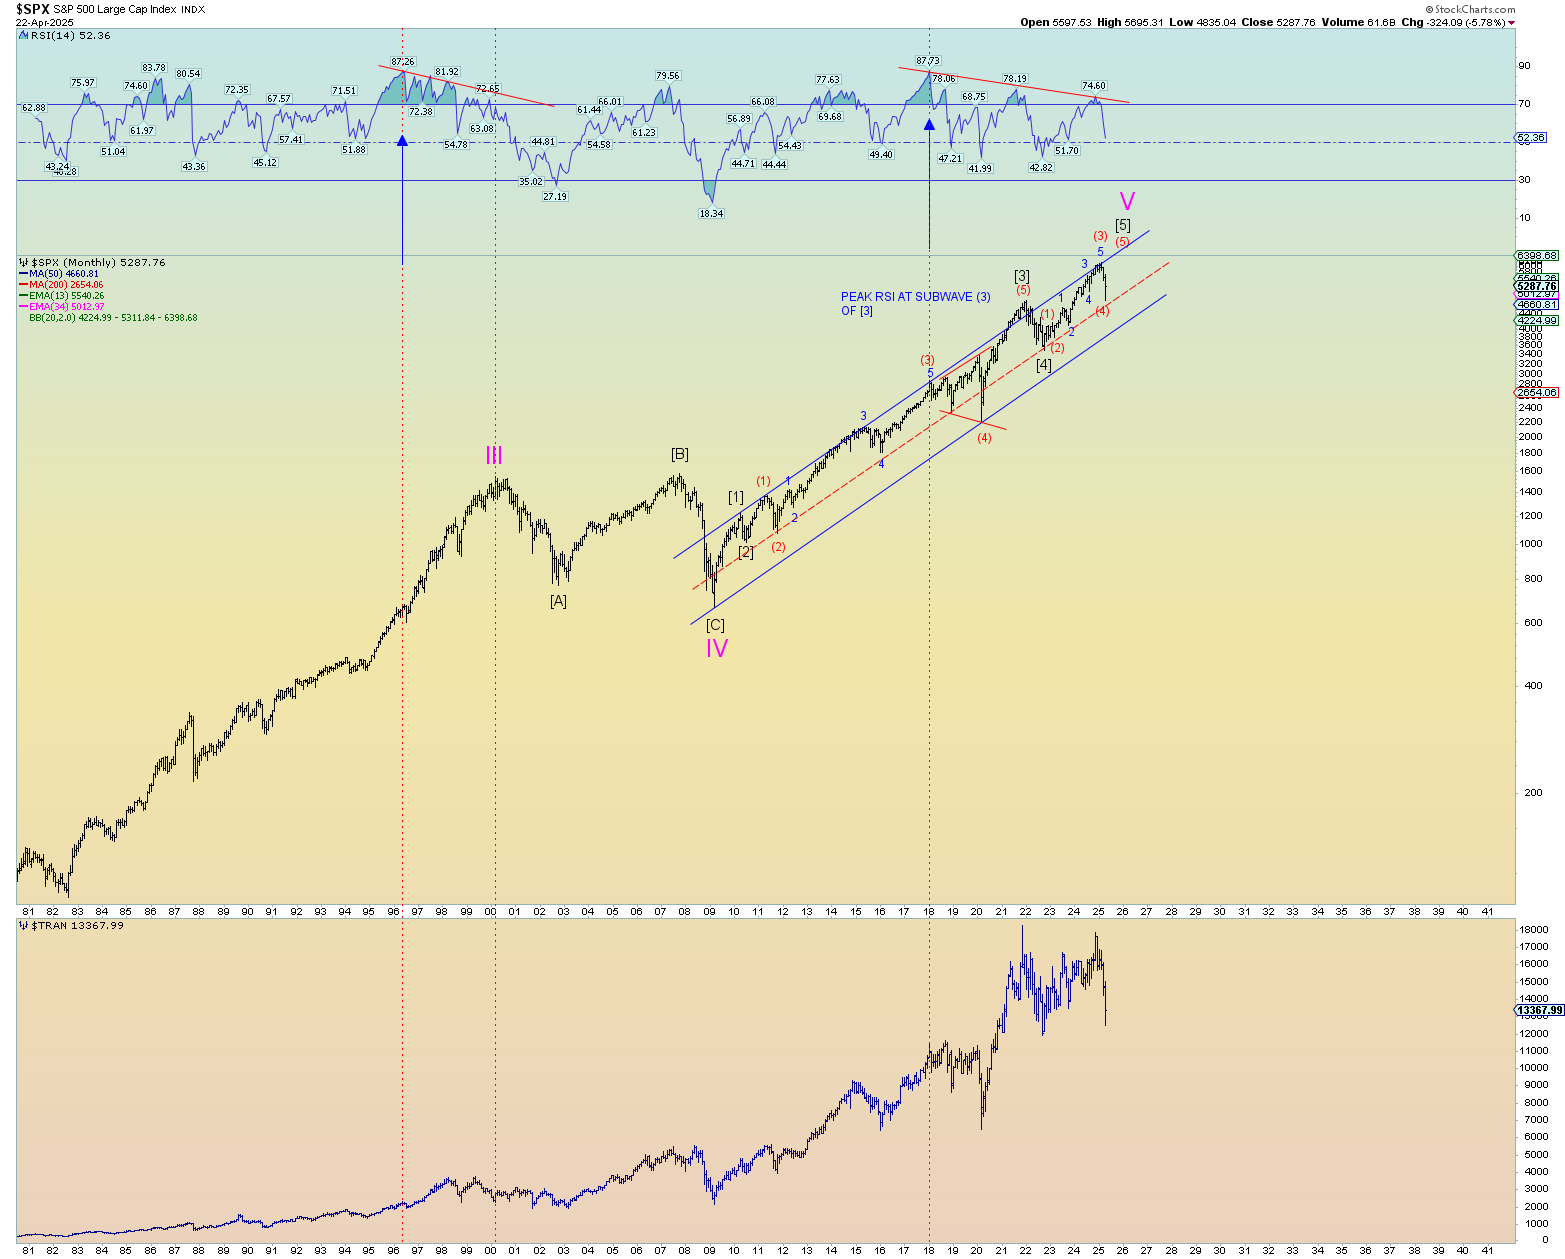
A “megaphone” type ending wave (5) of [5].
THE COUNT – THE BEARISH POTENTIAL
There is hope for the bears. But I think it needs to be based on 2 things at this stage:
A “reverse” Zweig breadth thrust event – a negative extreme event – would have to occur immediately in my opinion. And as luck has it, the market is exactly setup from yesterday’s data for this to possibly occur. Note the breadth thrust chart again (see above). Yesterday’s close (Monday – 28 April) was elevated back again ABOVE the key marker of .615. It closed at .616. The 28th of April would be DAY 0. Trading Day 10 would be the 12th of May. IF the breadth closes beneath .40 again within that time frame, we can consider the “positive” event to be reversed, and a negative extreme event has overridden things. Thats my theory anyway.
THE BEARISH COUNT
This would be the idea that a quick “truncation” occurred a few weeks back and that wave 5 of (1) down failed to make a new price low but came within 1.4% of doing so. These violent moves are largely a matter of extreme overnight futures that result in over-violent, yet quick opening market moves. Simply put, wave 3 down – the spike low – is a result of market violence at the open. (And the other massive distorted open chart gaps we see)
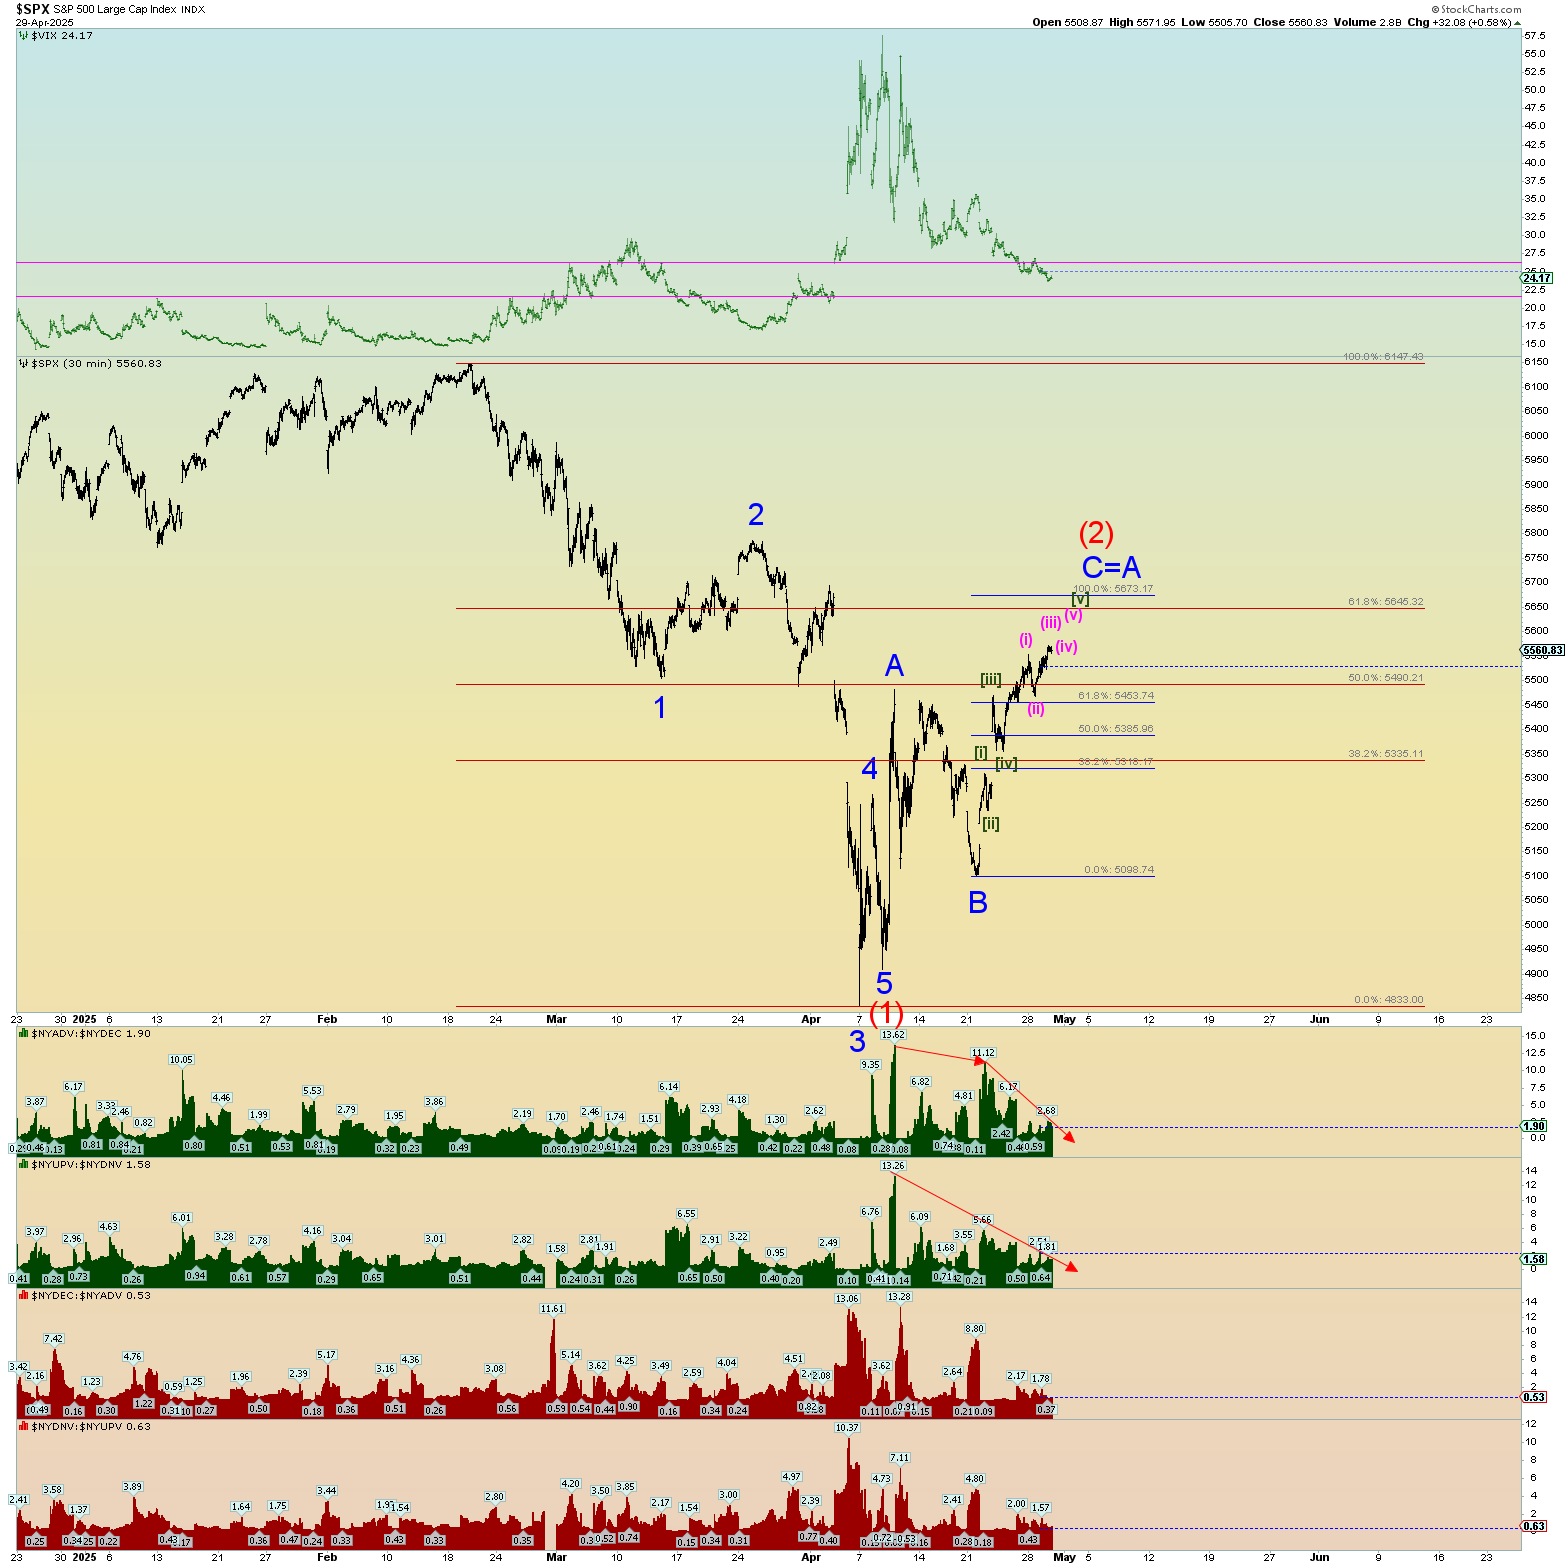
If that’s the case, the move back up since that truncated wave 5 of (1) low can be counted as a big simple A-B-C zigzag that is close to completion. Note that C=A at the top of the still half-open monster gap down. As I said many weeks ago, the market likes to resolve these futures-induced market opening chart gap distortions. Prices have rebounded well into the gap.
CONCLUSION:
I’m certainly not against this bearish count. The bullish count – the megaphone – still looks and feels wrong. And maybe it is. But it is hard to go against a very rare NYSE thrust event that has occurred. Again, the bear’s hope is that this is just a wave (2) and that the reason no true panic has occurred yet (based on CPCE) is because there is so much more terrible bear moves to come in a wave (3) event that takes prices eventually far below SPX 4800. And that would be exciting, wouldn’t it? We have the next 9 trading days to find out.
Some other technical to note: A) the declining trend of up volume and advancers vs. decliners. B) there are 7 small waves up from “B” of (2). It just looks like it’s starting to limp over. C) This is a great stopping point area for wave (2). We have price retrace into the previous sub wave 2 of (1). We are between Fibonacci 50 – 61.8% (a healthy retrace). The VIX is filling its huge gap also (see the pink gap markers).
I apologize for the profanity in yesterday’s post. I had a very bad day and took it out on the market. When in reality I really don’t care about the stock market in whatever way it goes. Sometimes you get “yanked about” in life circumstances and the market has been behaving this way over many weeks. In the end, the market is all in God’s plan so why would I fight it?
Today is a day that took out the most recent high but not the second most recent high. A very obvious triple short-term top in the market has now occurred. The massive 167-point open chart gap down is such a strong market target. When it opened down massively a few weeks ago, I suggested that the market likes to challenge these gaps sooner rather than later. Well, the market plunged and immediately historically bounced, and it has been clawing and heaving doing its best to breach that massive gap down. And so we have reached a stage where it may be in a position to finally do so.
The most bullish count:
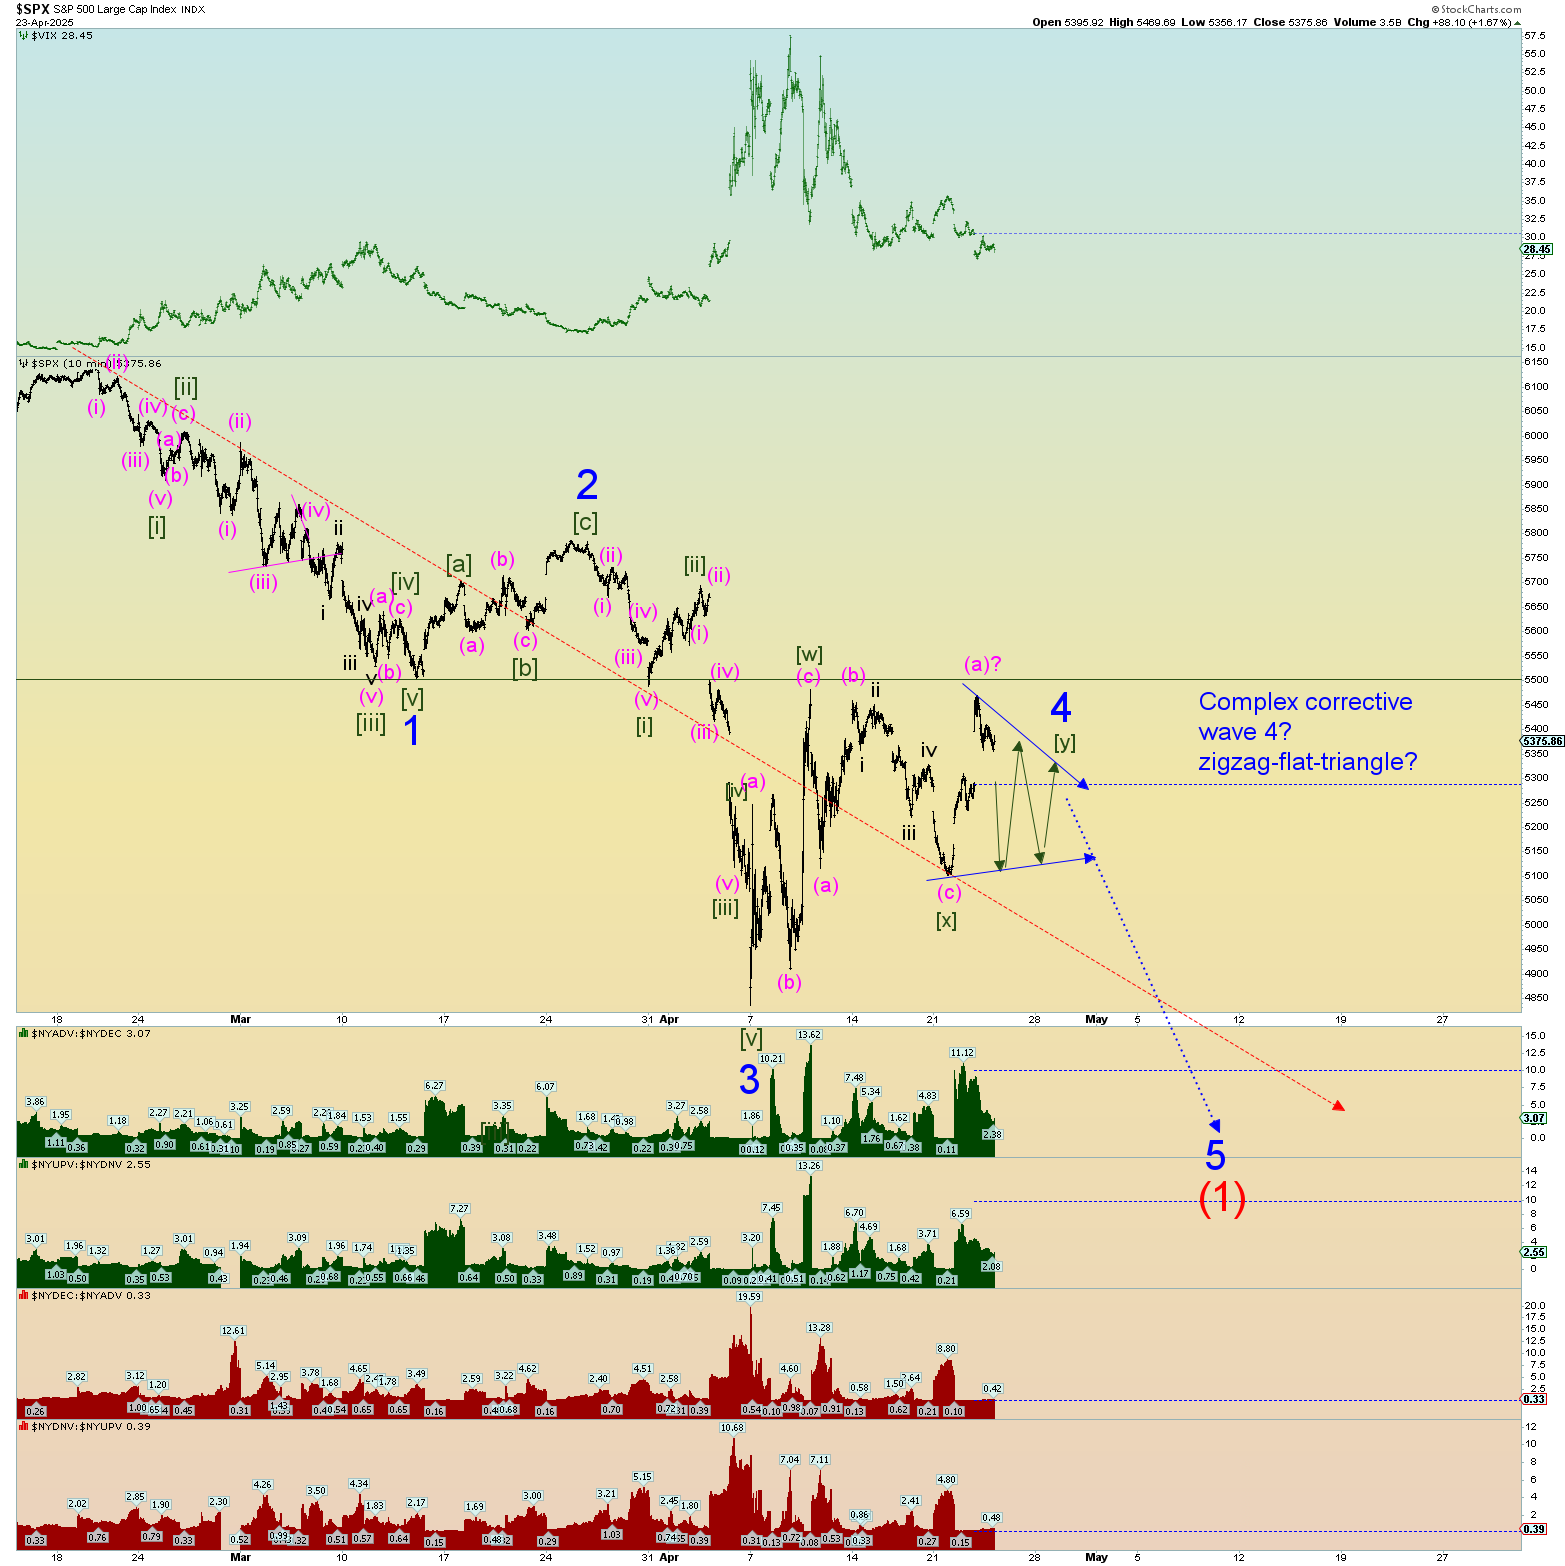
But despite last night’s rant, I haven’t given up on a possible Minor 4 count. Although it would have to be a complex corrective count and the following chart is the best I can come up with at the moment. After all, the market has ALSO left two very large gaps up opens over the last 2 days. Which side will prevail??
Even though the 5-minute charts are considered “squiggles” the size of these daily moves is actually quite massive and volatile still. Sometimes we should zoom out and imagine a count and just be patient. I can still see the above massive 167 SPX gap down being closed or nearly closed and the overall larger count being bearish.
Rulers sometimes work best in the market. It was the logical place for the algorithms to massively defend and buy.
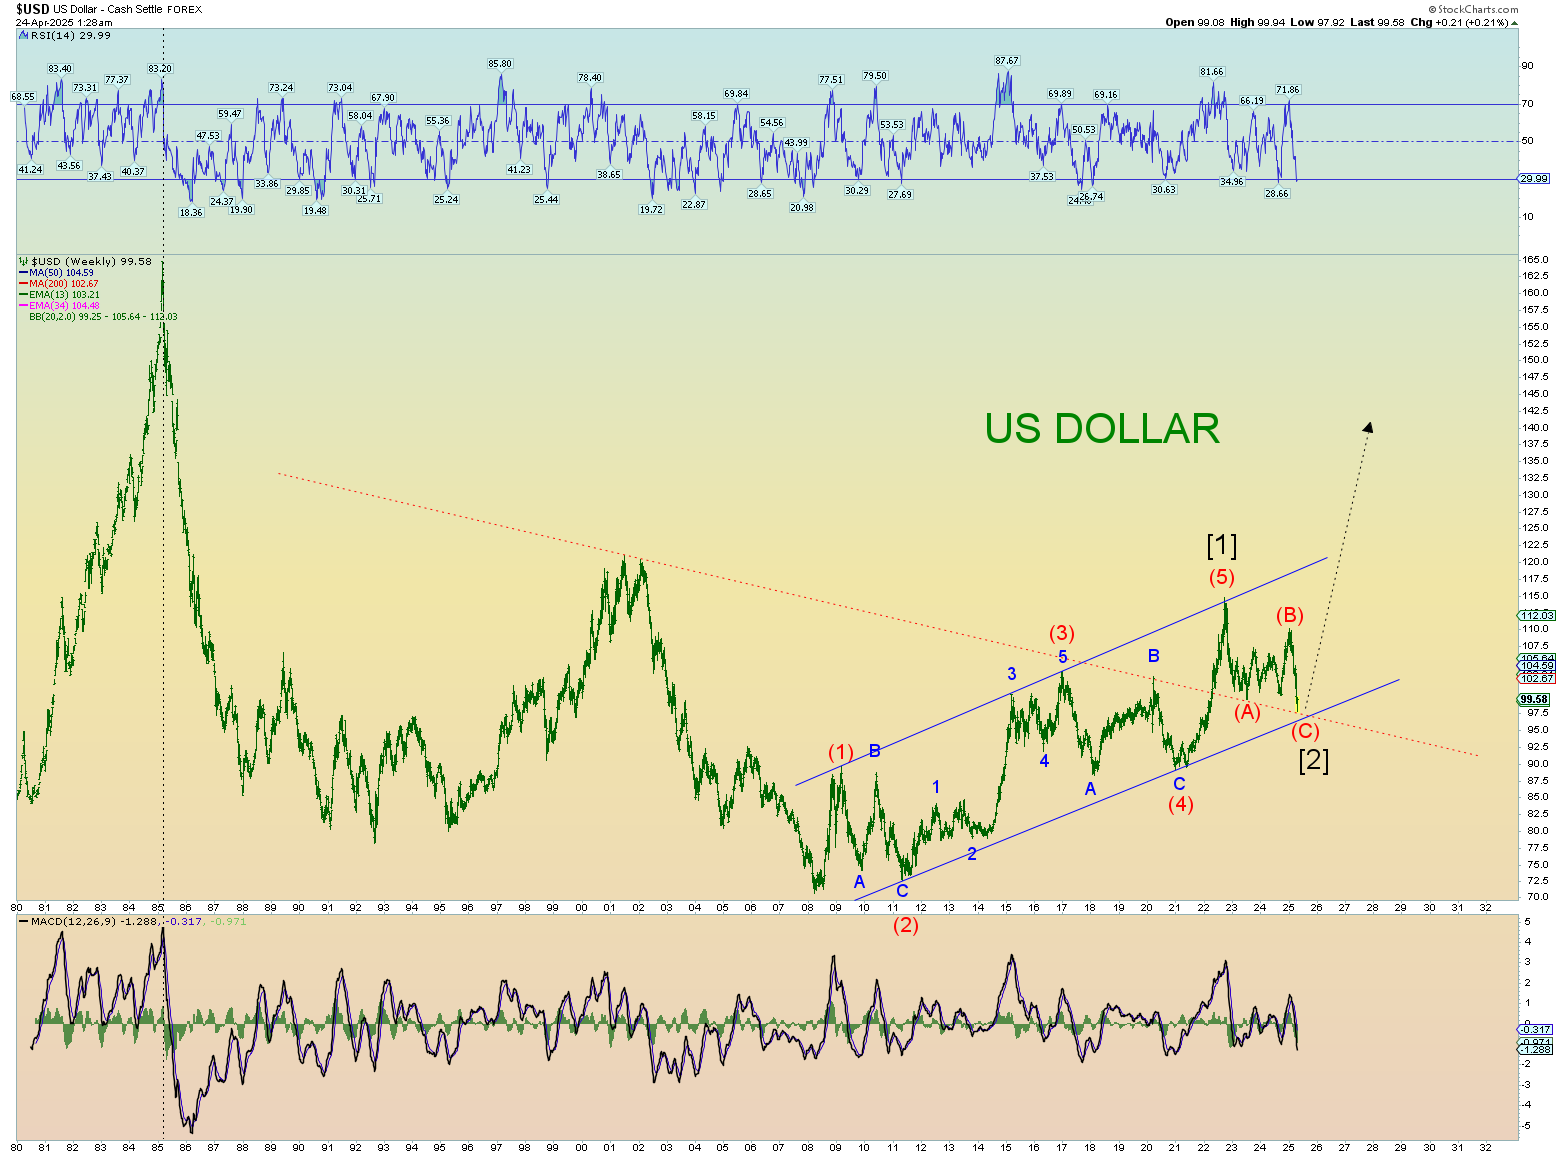
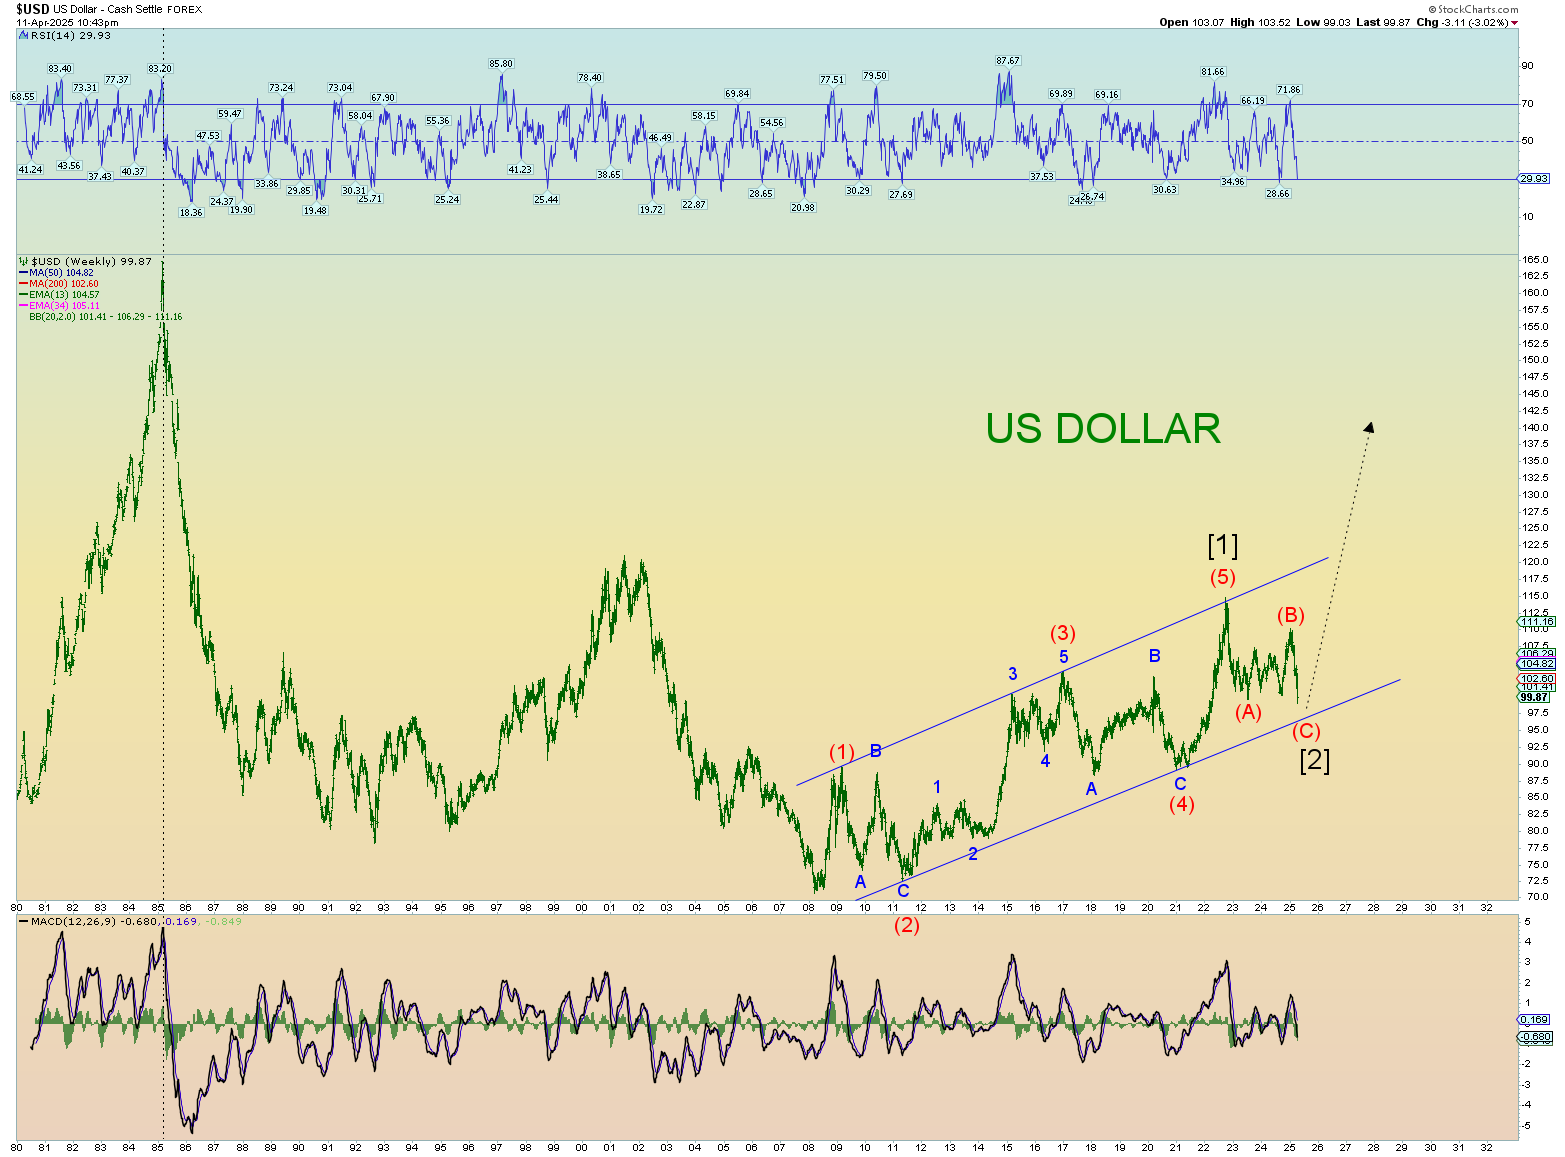
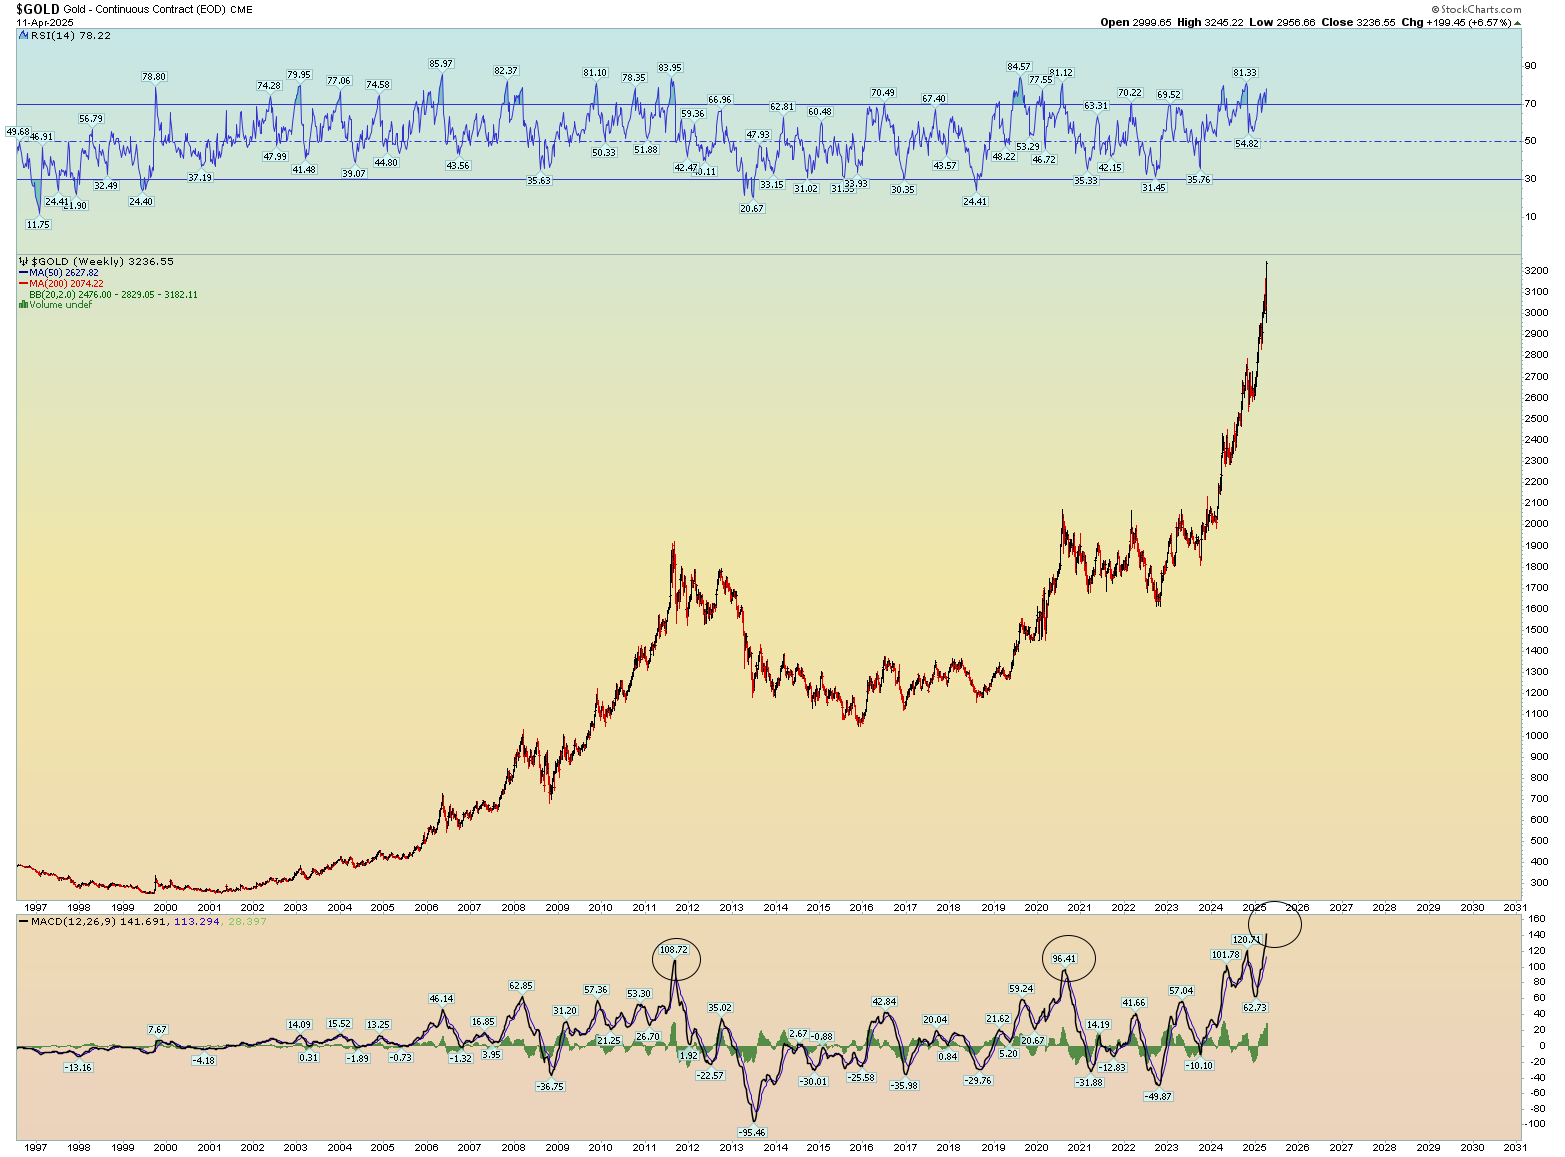
Death of the dollar talk has been rampant. Really? It still looks like an overall bullish setup.
Often the markets have to experience true panic before a meaningful run toward new all-time highs. Yet, the CPCE is so still obviously NOT panicked, we can take solace that the market has not been overly “bearish”. The contrarian play is that the market is going to drop yet more first.
I’m posting a chart full bull retard here. A possible primary Elliott Wave count is that the SPX makes a new all-time high eventually within a few months or so. The caveat is that the DJIA, and NASDAQ composite probably diverge and not make a new all-time high. In other words, today was the “kickoff day” of a significant wave 3 of 3 event upwards in the SPX. Practically a 90% up day all around. The wave count is such that the SPX has had a series of 1-2, [i]-[ii] upwards. Both the corrective wave 2 and [ii] are 3-3-5 “flats”.
The overall primary count would be thus:
The alternative count is that the market is just going to keep fucking with us as much as possible and cover the very big open gap above in a wave (1)-(2), 1-2 DOWN and then collapse.
I wished I cared, but this massive trading range is just one bug jerk around so far for both sides.
Of course, the other count is wave 5 of (1) is just going to take its fucking time as much as possible to fuck with you and fuck you out of all sanity. That seems about right.
CONCLUSION:
I’ve presented the 3 top counts based on my feelings of today. I wanted to be bearish but about 4 dickheads from work swear the market is “over” that I thought to myself, these assholes are so bearish I should probably be bullish. And today’s internal numbers and the fact that a possible 1-2, [i]-[ii], double 3-3-5 flat pattern, back-to-back ended yesterday is noteworthy for the contrarian in me. One guy who didn’t even know what the Dow Jones or S&P 500 index was, emphatically told me the stock market is finished just deflated me to the point where I resign and might as well start counting to a new all-time high again.
When the plebes at work are paying attention to their 401Ks to the point of making proclamations about the stock market in which they don’t even understand that the S&P500 is an “index” and not a stock, then I resign to the possible wave count, that new all-time SPX highs are probably coming in the summer….I really hope I’m wrong.
The 2 bearish wave counts both have the market requiring new lows. These are the best counts considering that the wave structure since the market low looks corrective up. In either count, a break to a lower low should not be long and drawn out. The VIX should elevate again and an impulse lower should occur over the next week.
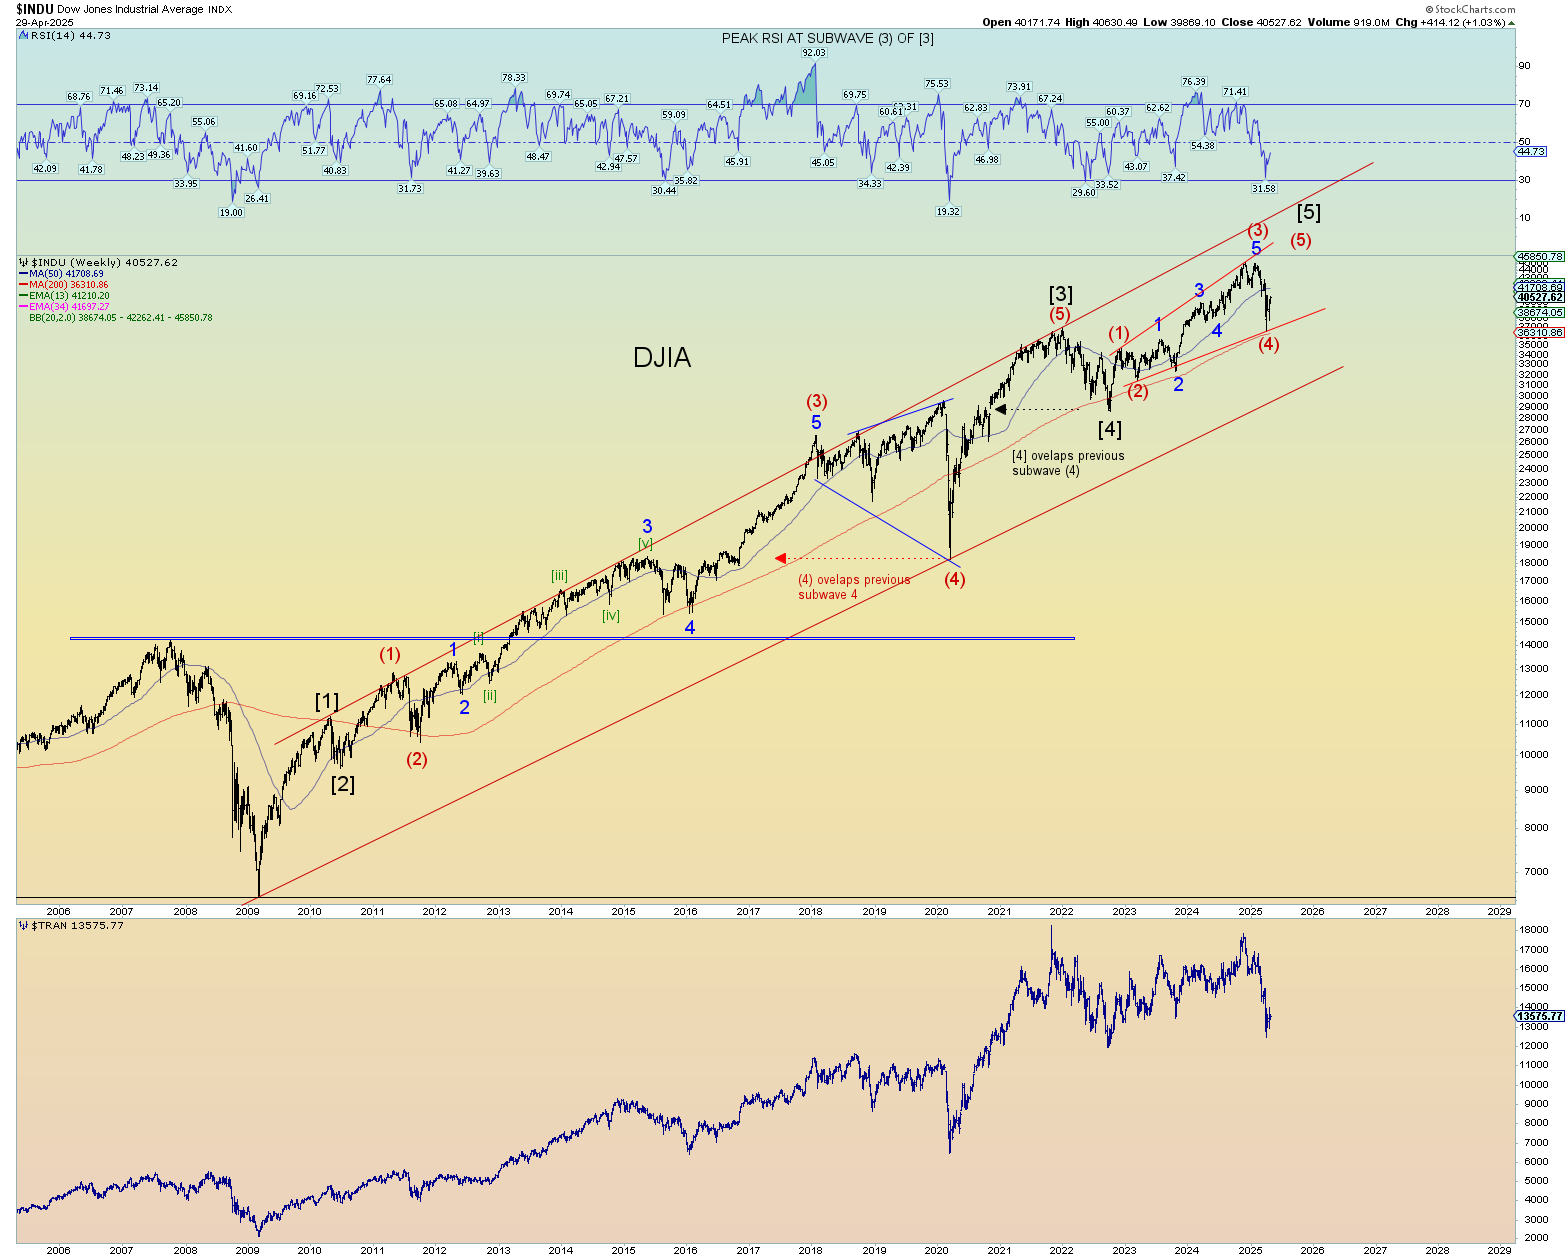
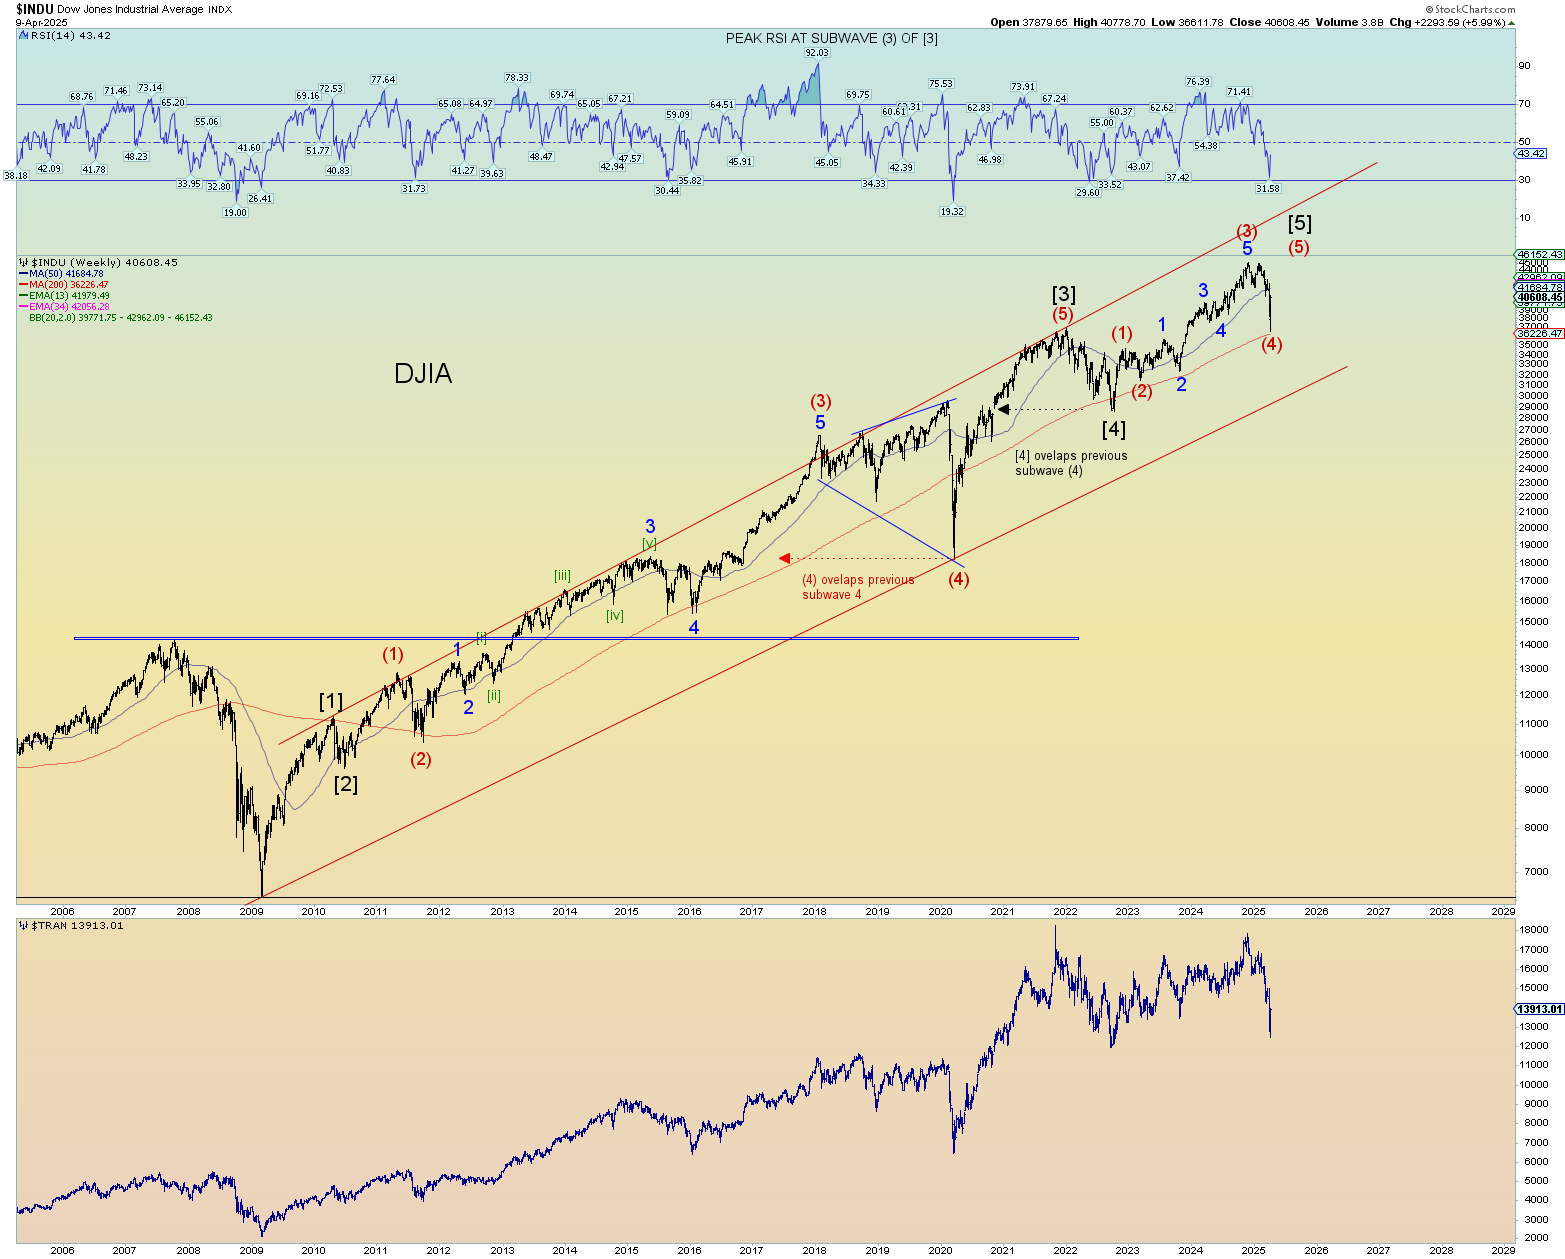
The bullish count option is shown on the DJIA at a lower degree level than the chart from yesterday. But as you can note from the above bearish charts, the wave structure since the low counts more as a three-wave corrective up rather than impulse.
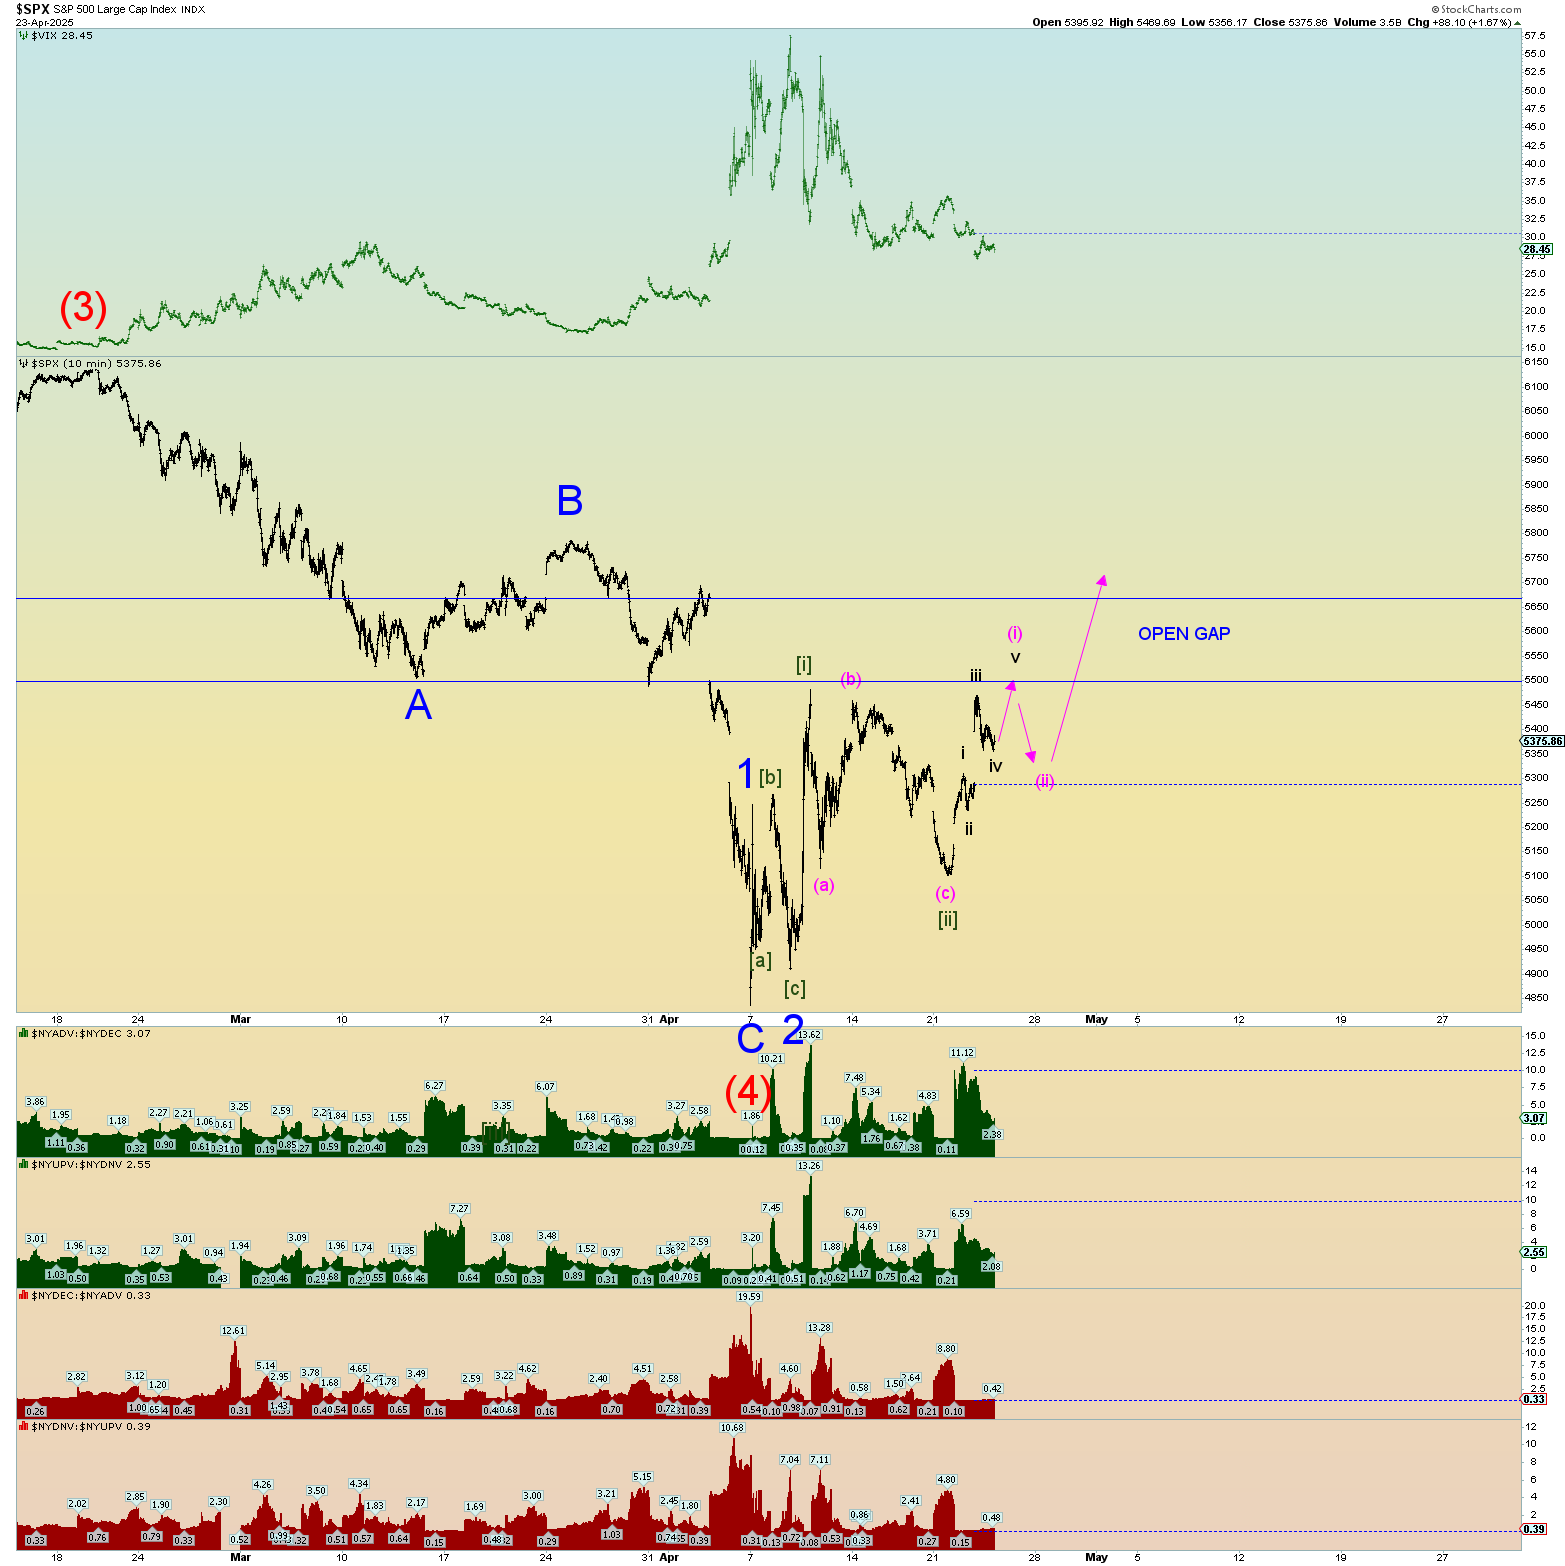
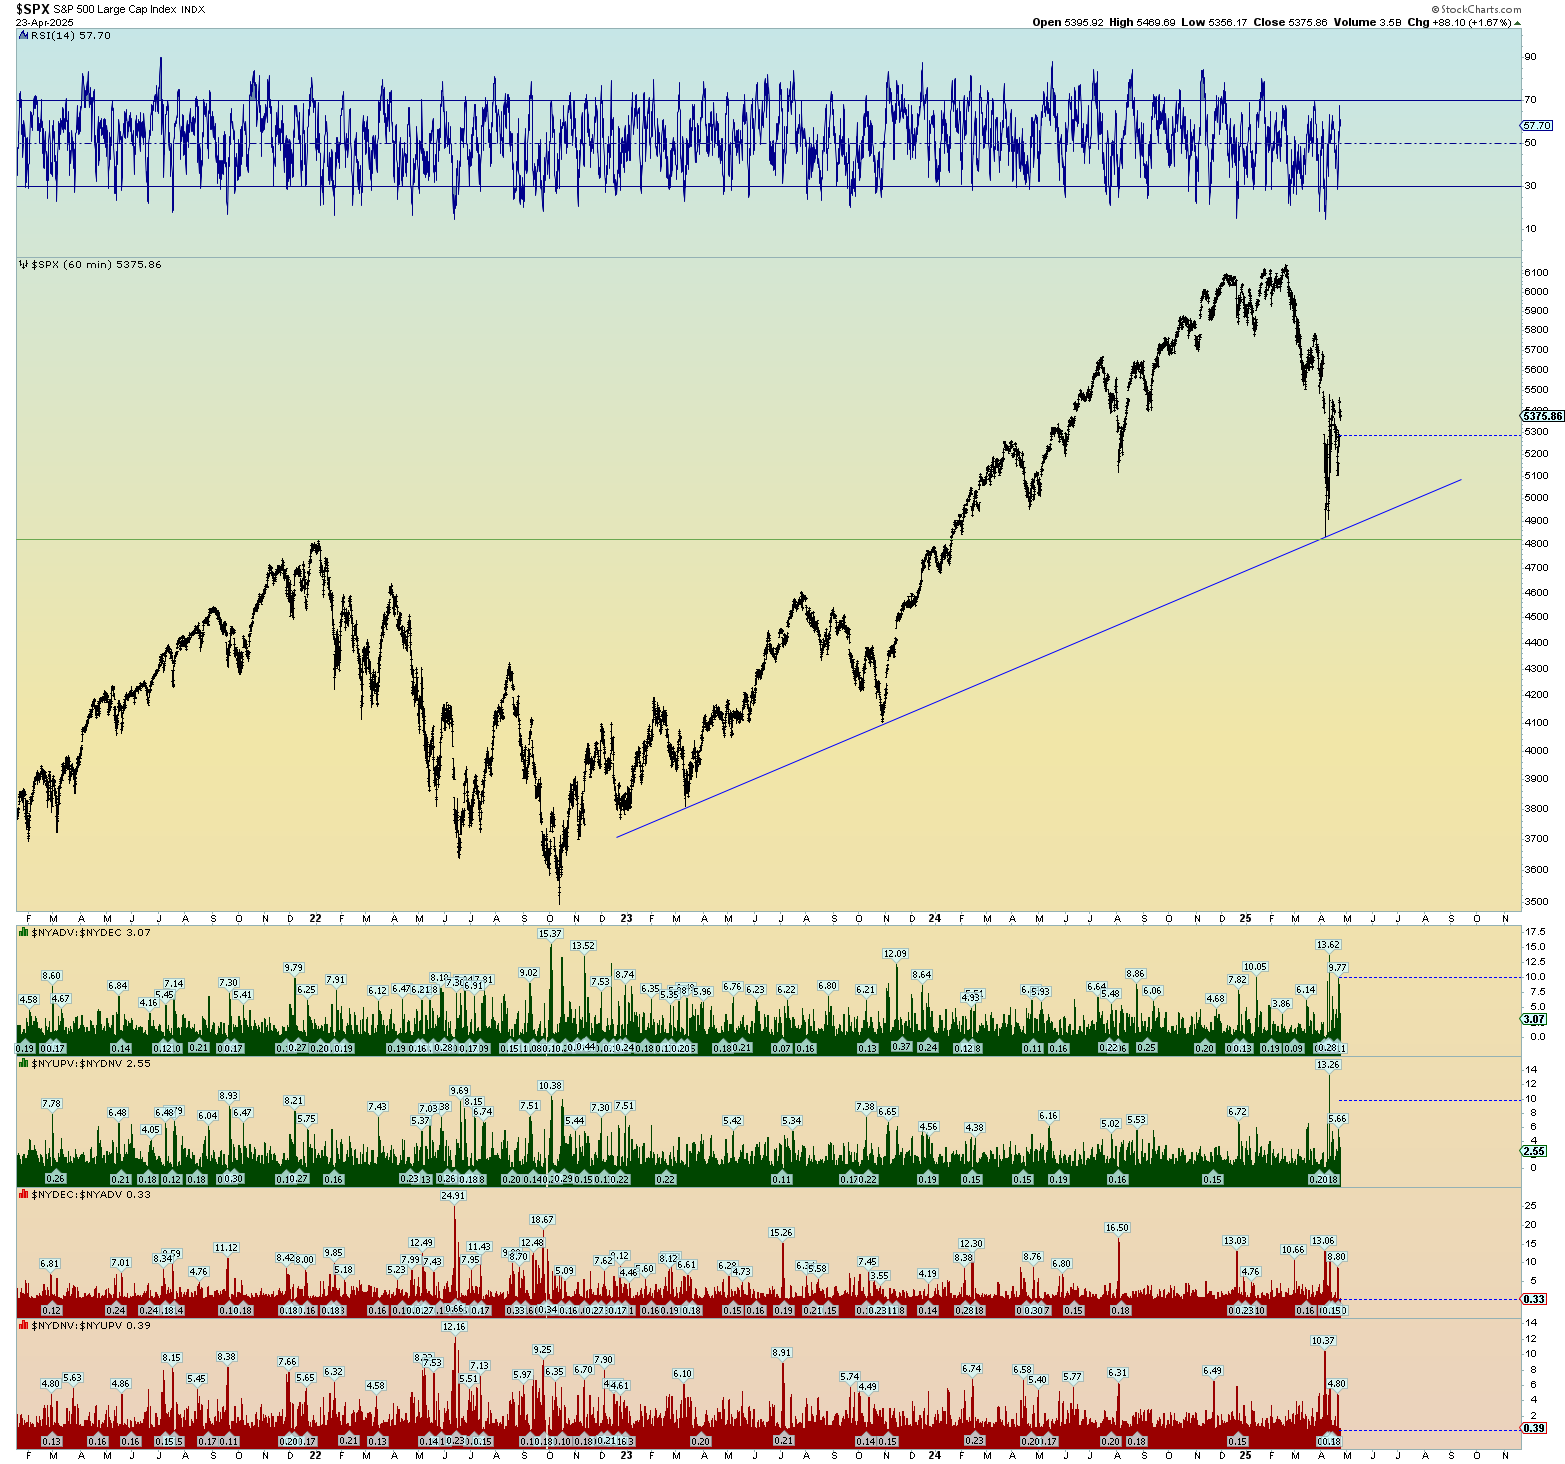
The ridiculously very large open chart down gap still exists just above the price point of today’s close. It would be a good place in the count to try and breach this open gap in the most bearish count of (1)-(2), 1 – 2. Please note that the market is still trading within the very large trading range created by the euphoric squeeze up to where pink wave (a) is currently labeled.
There are other possible counts. Perhaps the “tease” of breaking yet higher is just that and prices start drifting heavily lower to trade in the lower part of this massive trading range that was created in about 30 minutes time. I have no preference. I don’t really actually care to be honest. Break higher would be exciting, breaking lower would be a thrill. Let’s let the market tell us if we are a massive 3 wave down from peak or something more sinister such as a massive impulse is happening. Fun times!
This is the bullish chart but it’s kind of boring, yes? A slog back up to new all-time peaks. As if we haven’t seen that song and dance before. Whatever. See the slog of post 2020 Covid collapse? It took months to break to higher highs again, but it did. Again, if that’s the case, I’m going to get bored again and probably just wait for the dreadful slog to be over with. This doesn’t break any rules, but it looks gay.
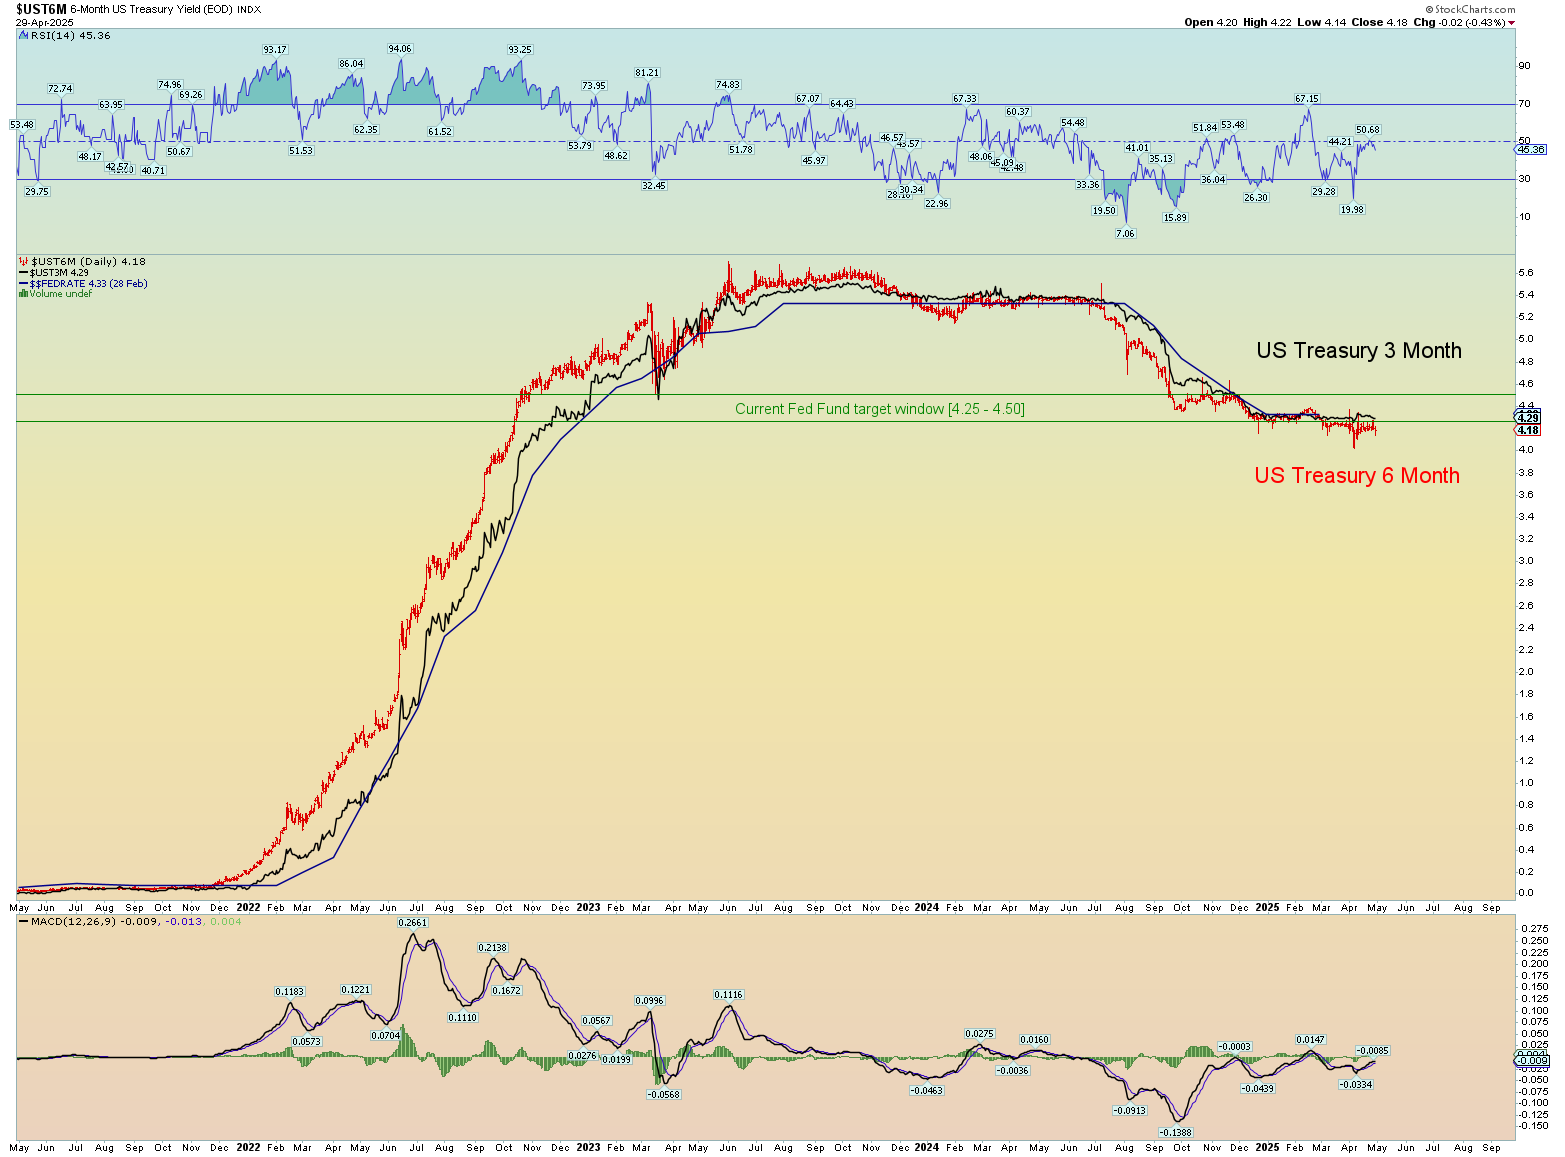
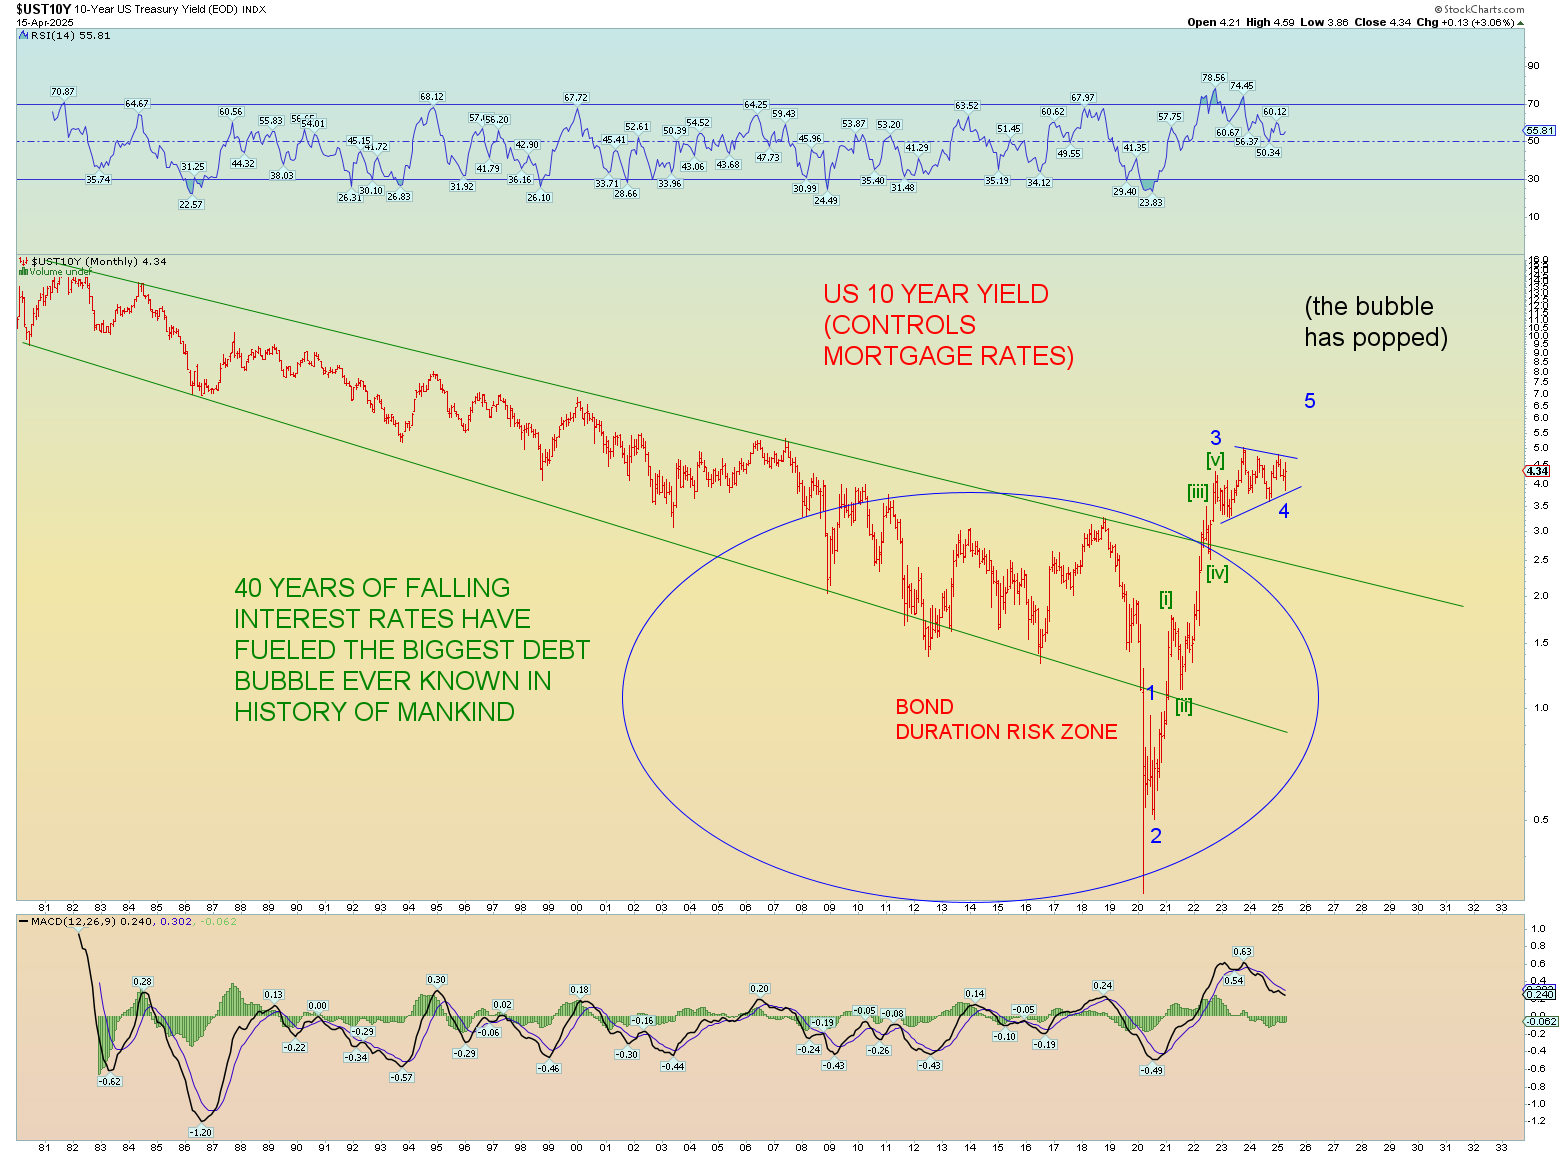
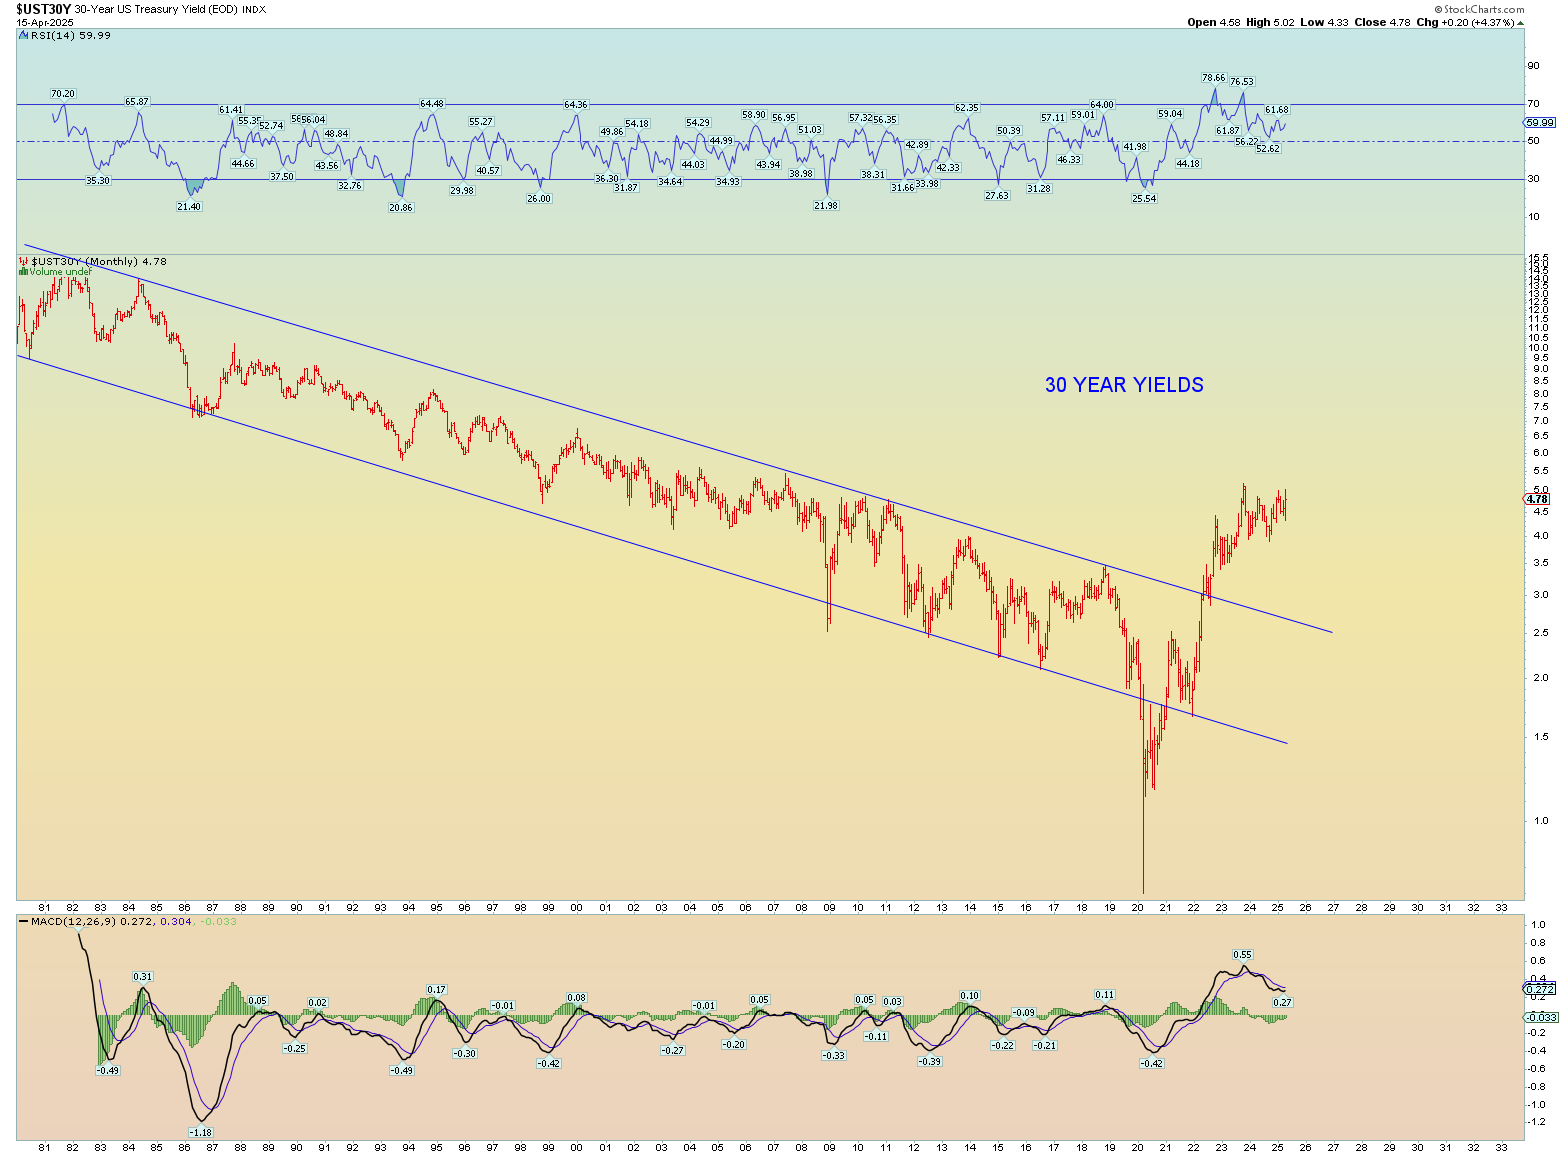
In 2020, the Covid panic, interest rates hit the floor across the spectrum. A dramatic ending to a 40-year downtrend in yields. That has not happened this market collapse (yet) and I don’t think it will happen. There is simply too much debt to hide. Oh, there are a zillion debt-hiding programs the Fed and the banks have created, but at some point, it will fall apart and probably quite quickly. Which would suit them just fine anyways as the system has been setup to “take everything”. They are not hiding it anymore. The Great Taking – Documentary
10-year yield seems to be in a log consolidation period with a coming break higher.
The best count has the market in a (1)-(2), 1- 2. We might get a surge Monday morning to fill the open upper gap down.
Of course, futures should tell us a story if they are down big time come Monday. We shall see. We still might be in a wave 5 of (1) down. It’s not the best count, but it cannot be ruled out just yet.
The bullish alt count has new market highs coming. I’m not ruling this out, it just doesn’t look right.
The primary count of Minor 4 corrective of Intermediate wave (1) down is abandoned even though technically wave 4 has not yet interfered within wave 2’s price range. However, today was too strong of an up day in the context of a “corrective” Minor 4 wave. Therefore, the count has 2 possibilities:
1) The market traced an overall major corrective 3 wave pattern from peak to recent low and now will eventually make a new all-time high. This is shown here on the DJIA: (This is NOT my primary count though – it doesn’t look right)
2) The market is actually experiencing a wave “one-two, one two” bearish down event. THIS is the primary count. The upper open gap may even be closed in this proposed count. Overlap may even occur from peak 2 into the previous wave (2) price range. This is the top bearish count. However, things would have to reverse fairly quickly in this count. A quick price peak and then a persistent drive lower.