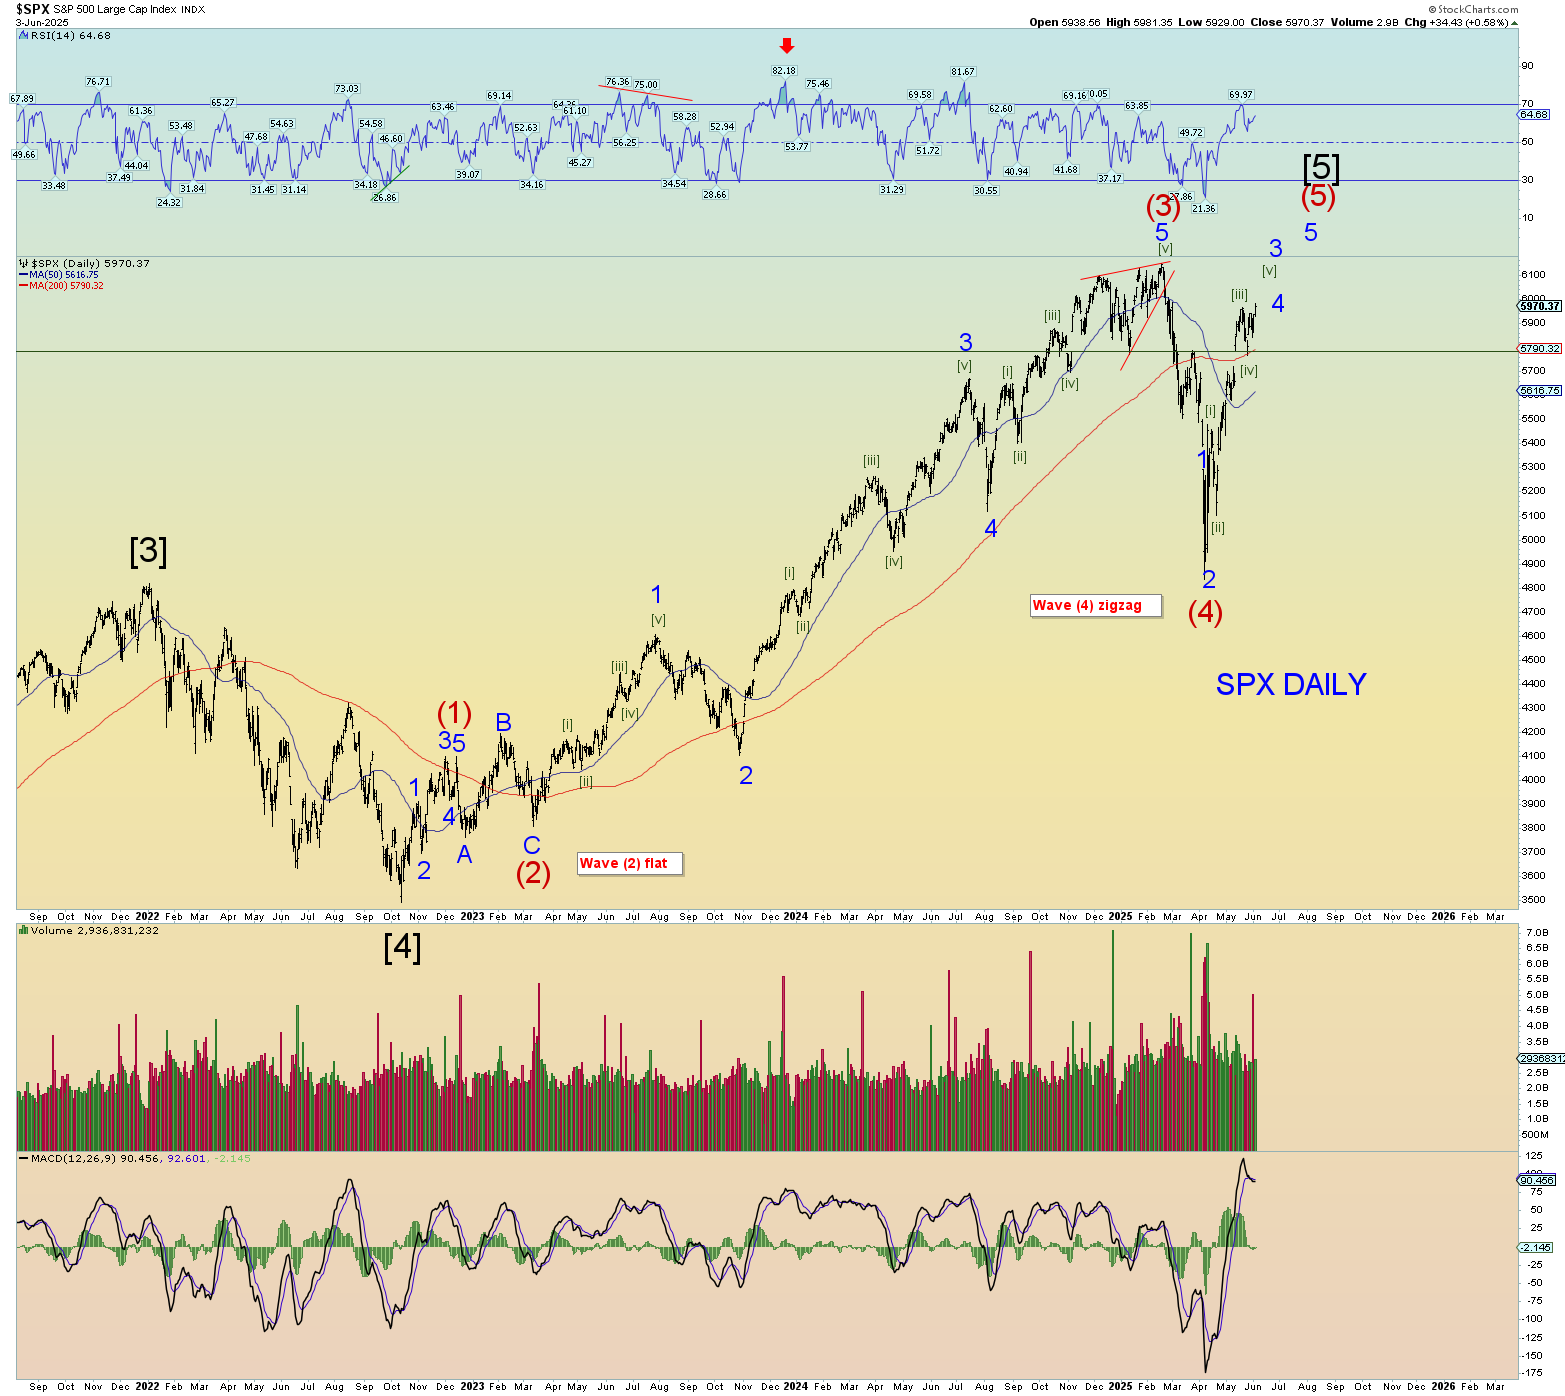
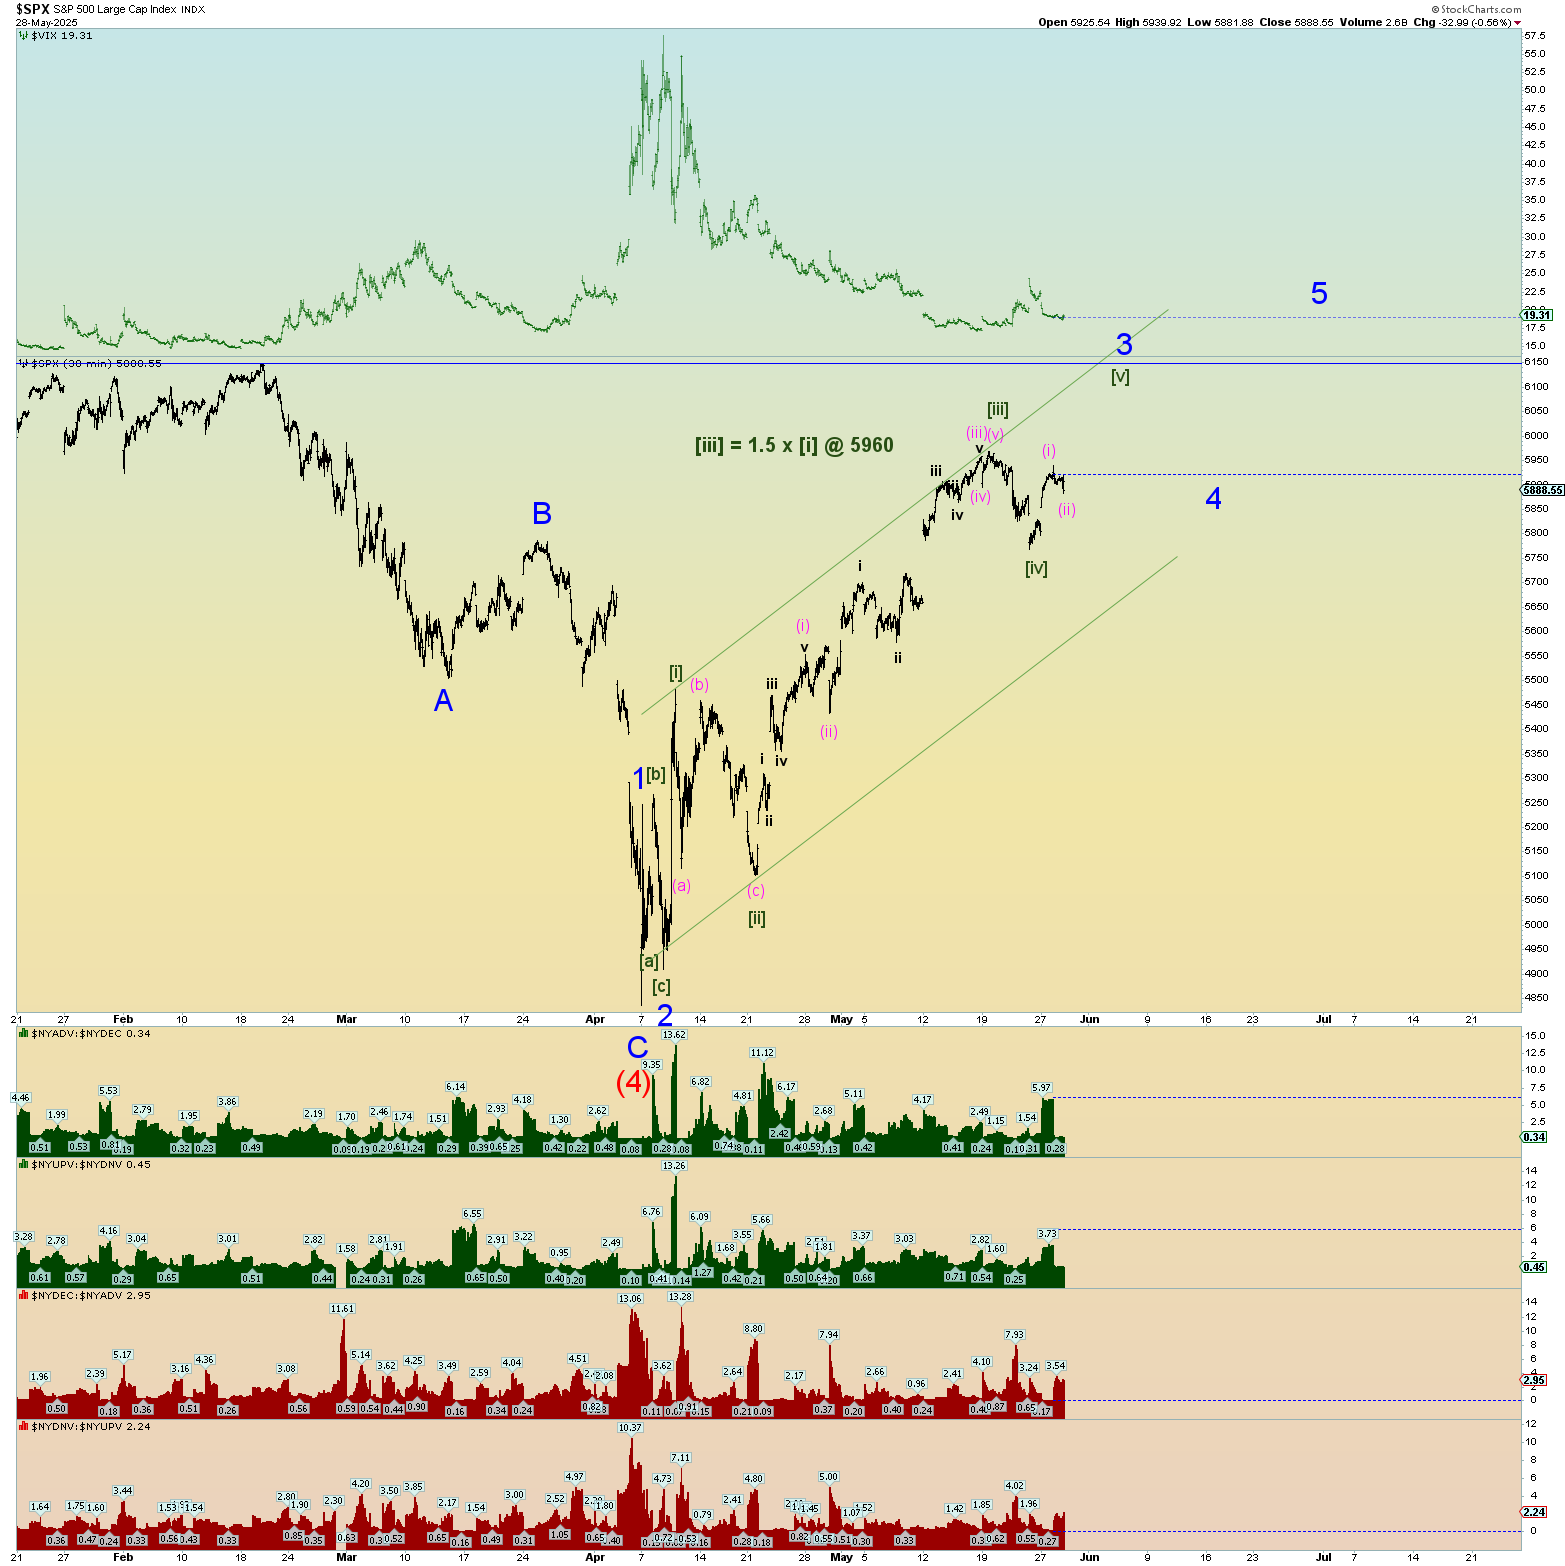
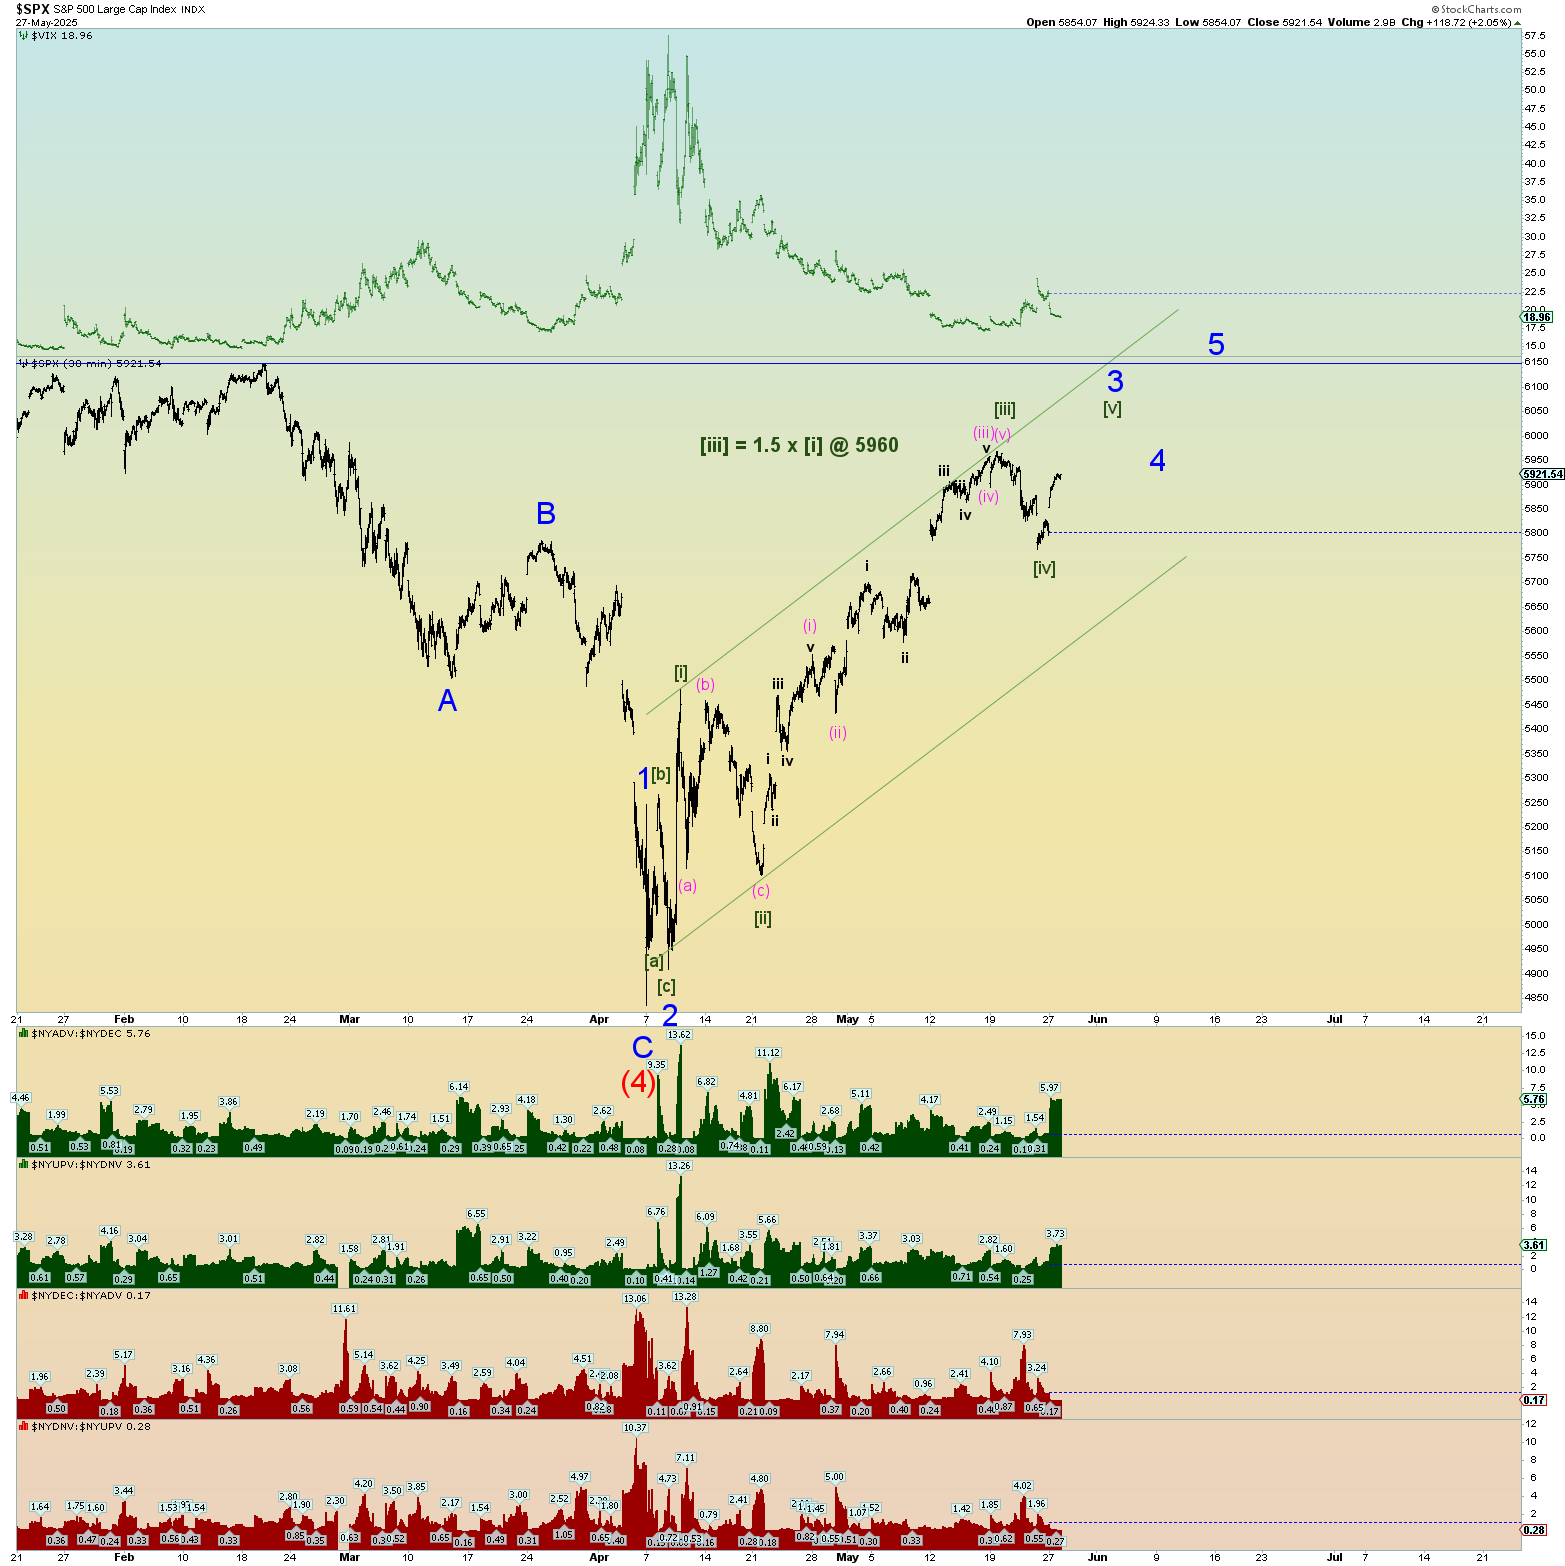
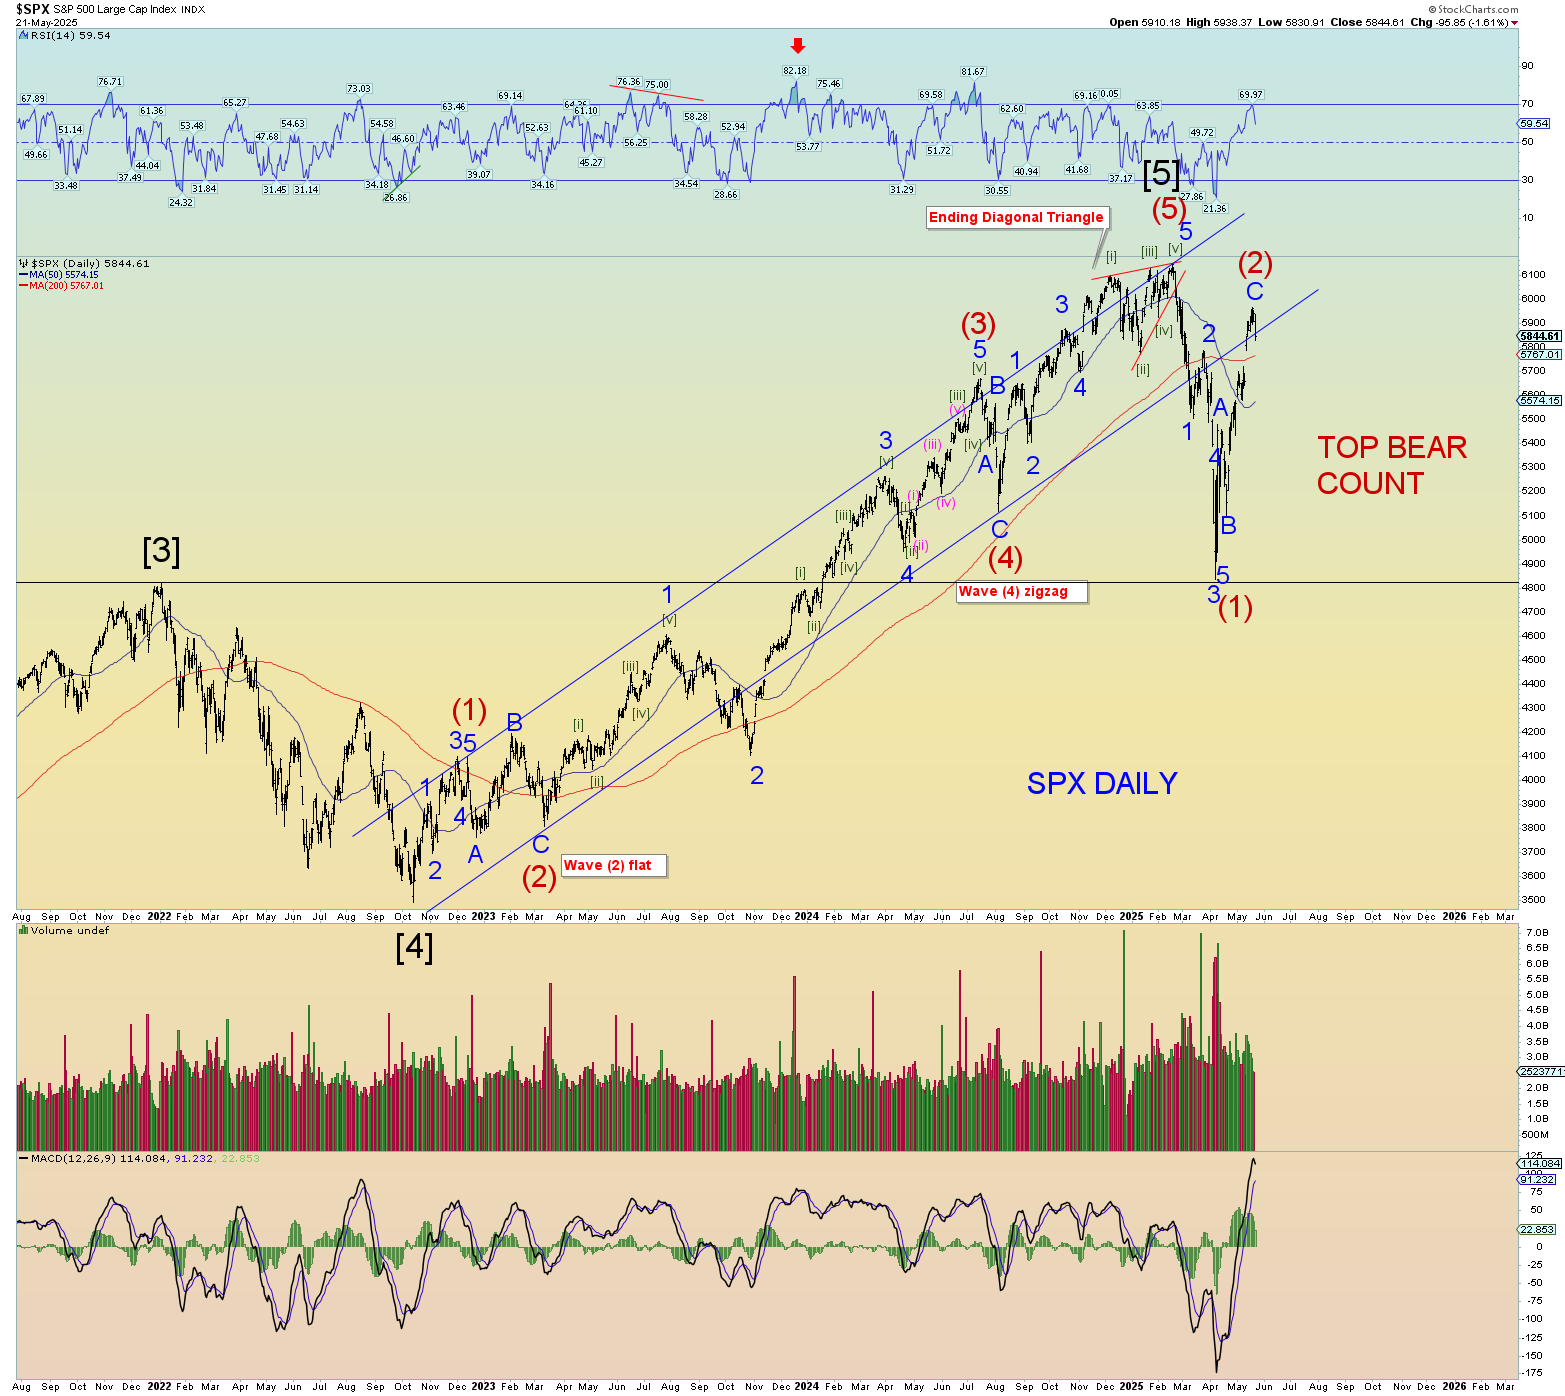
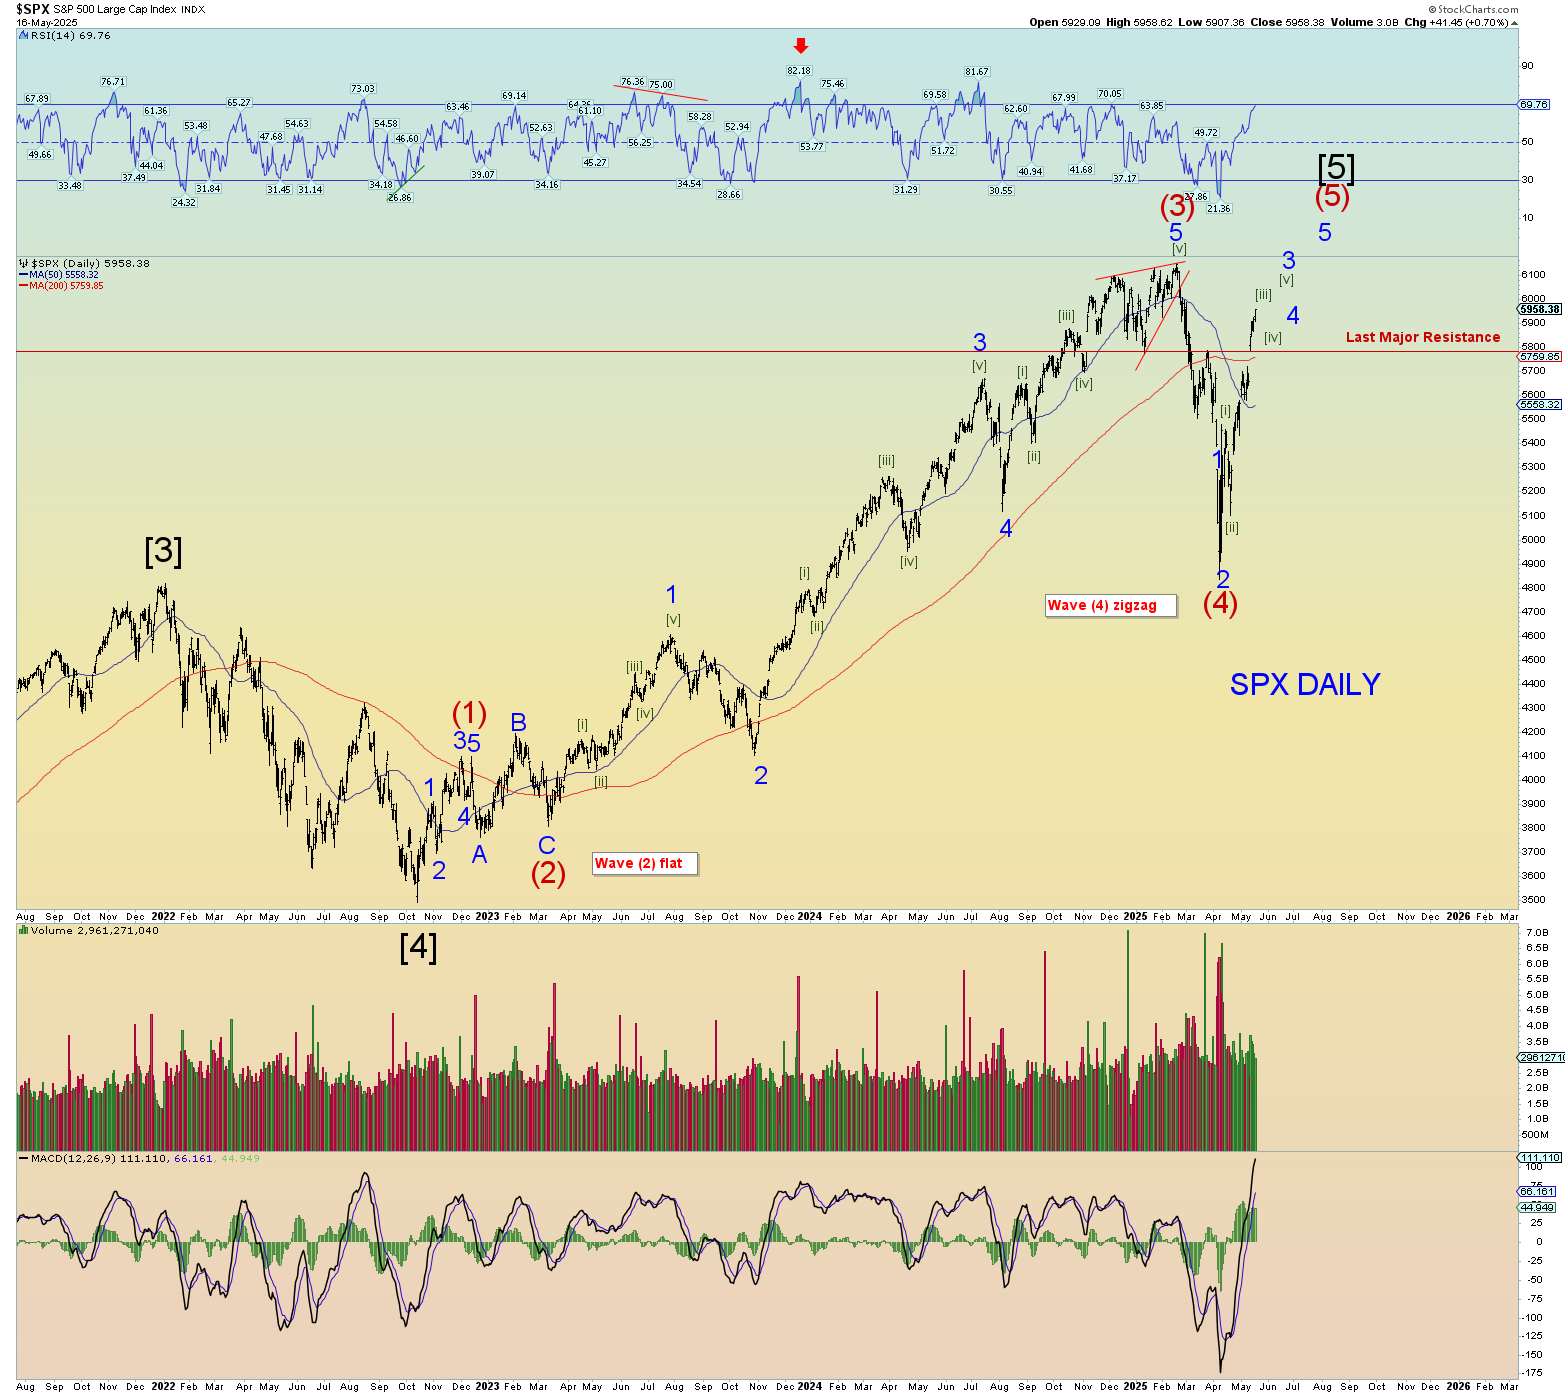
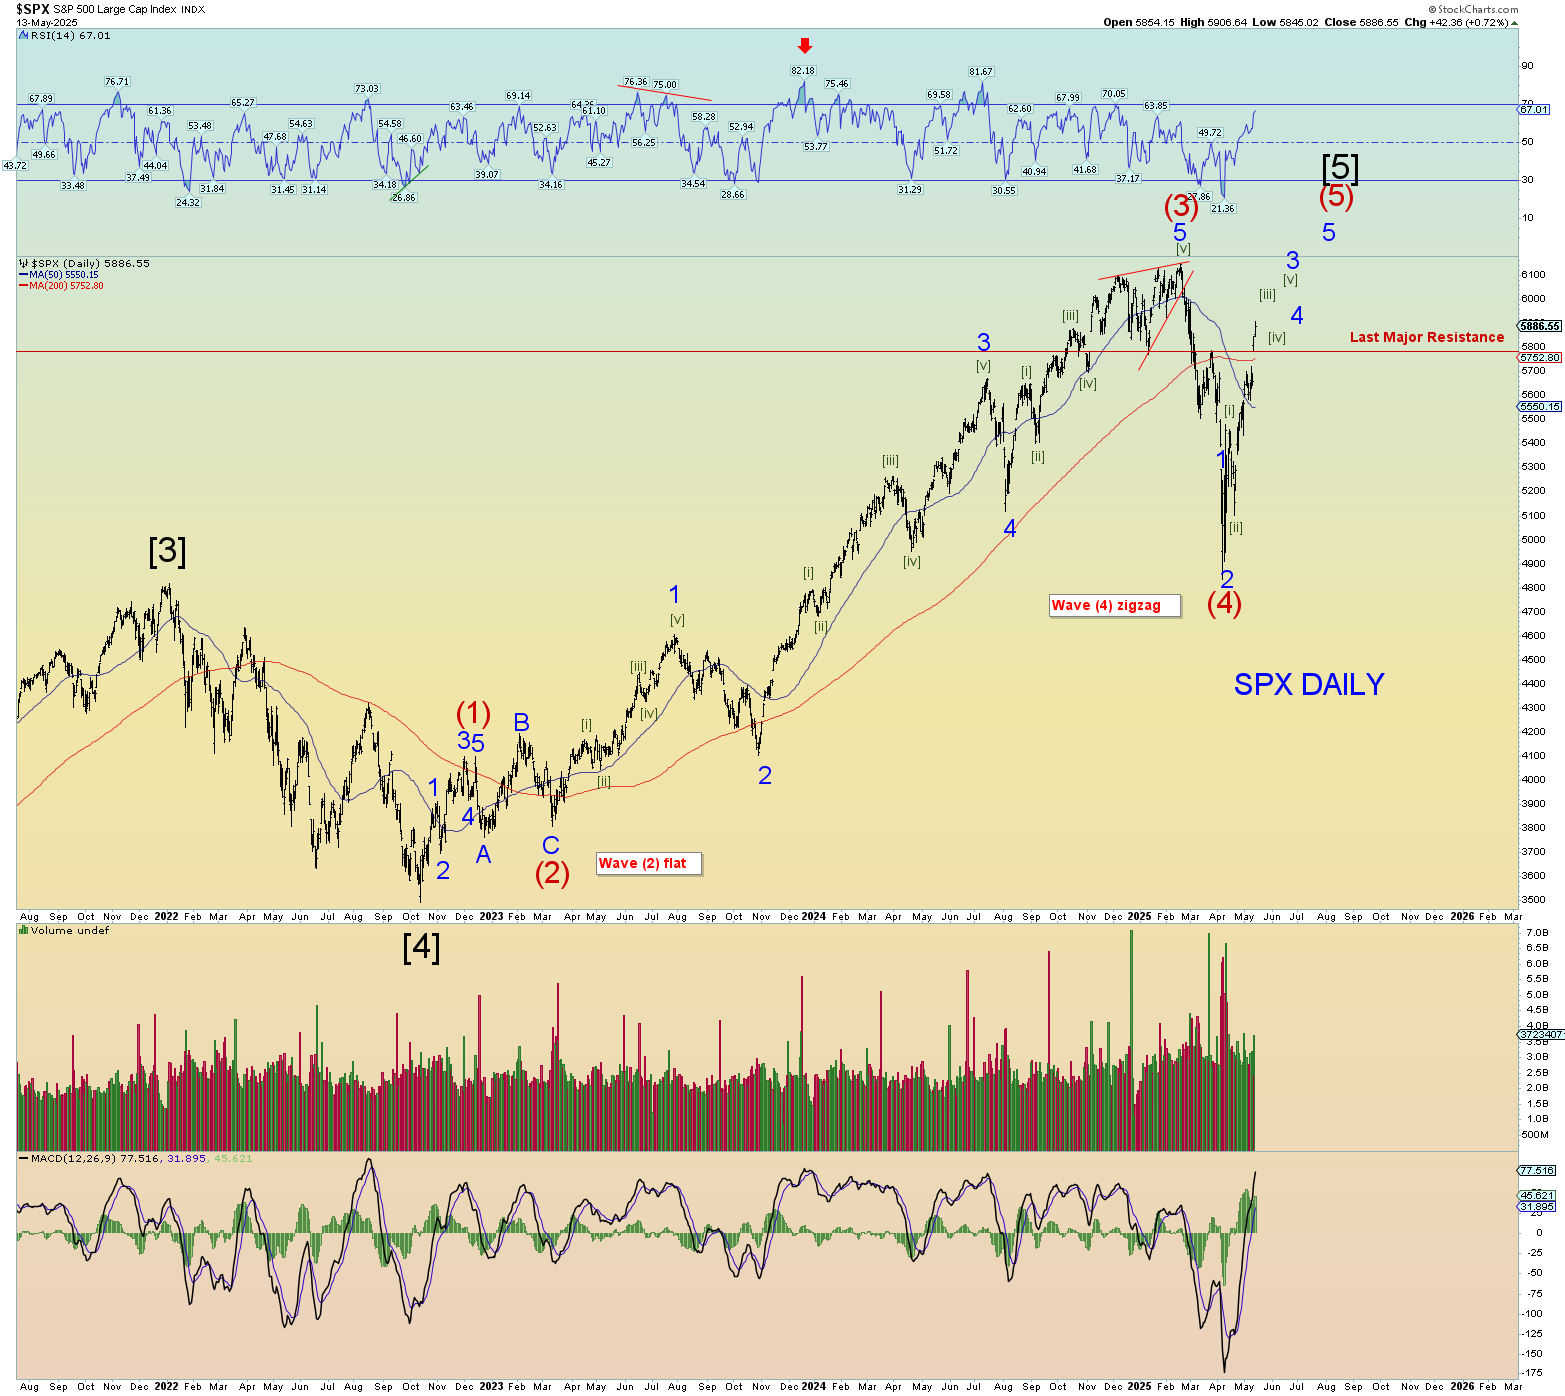
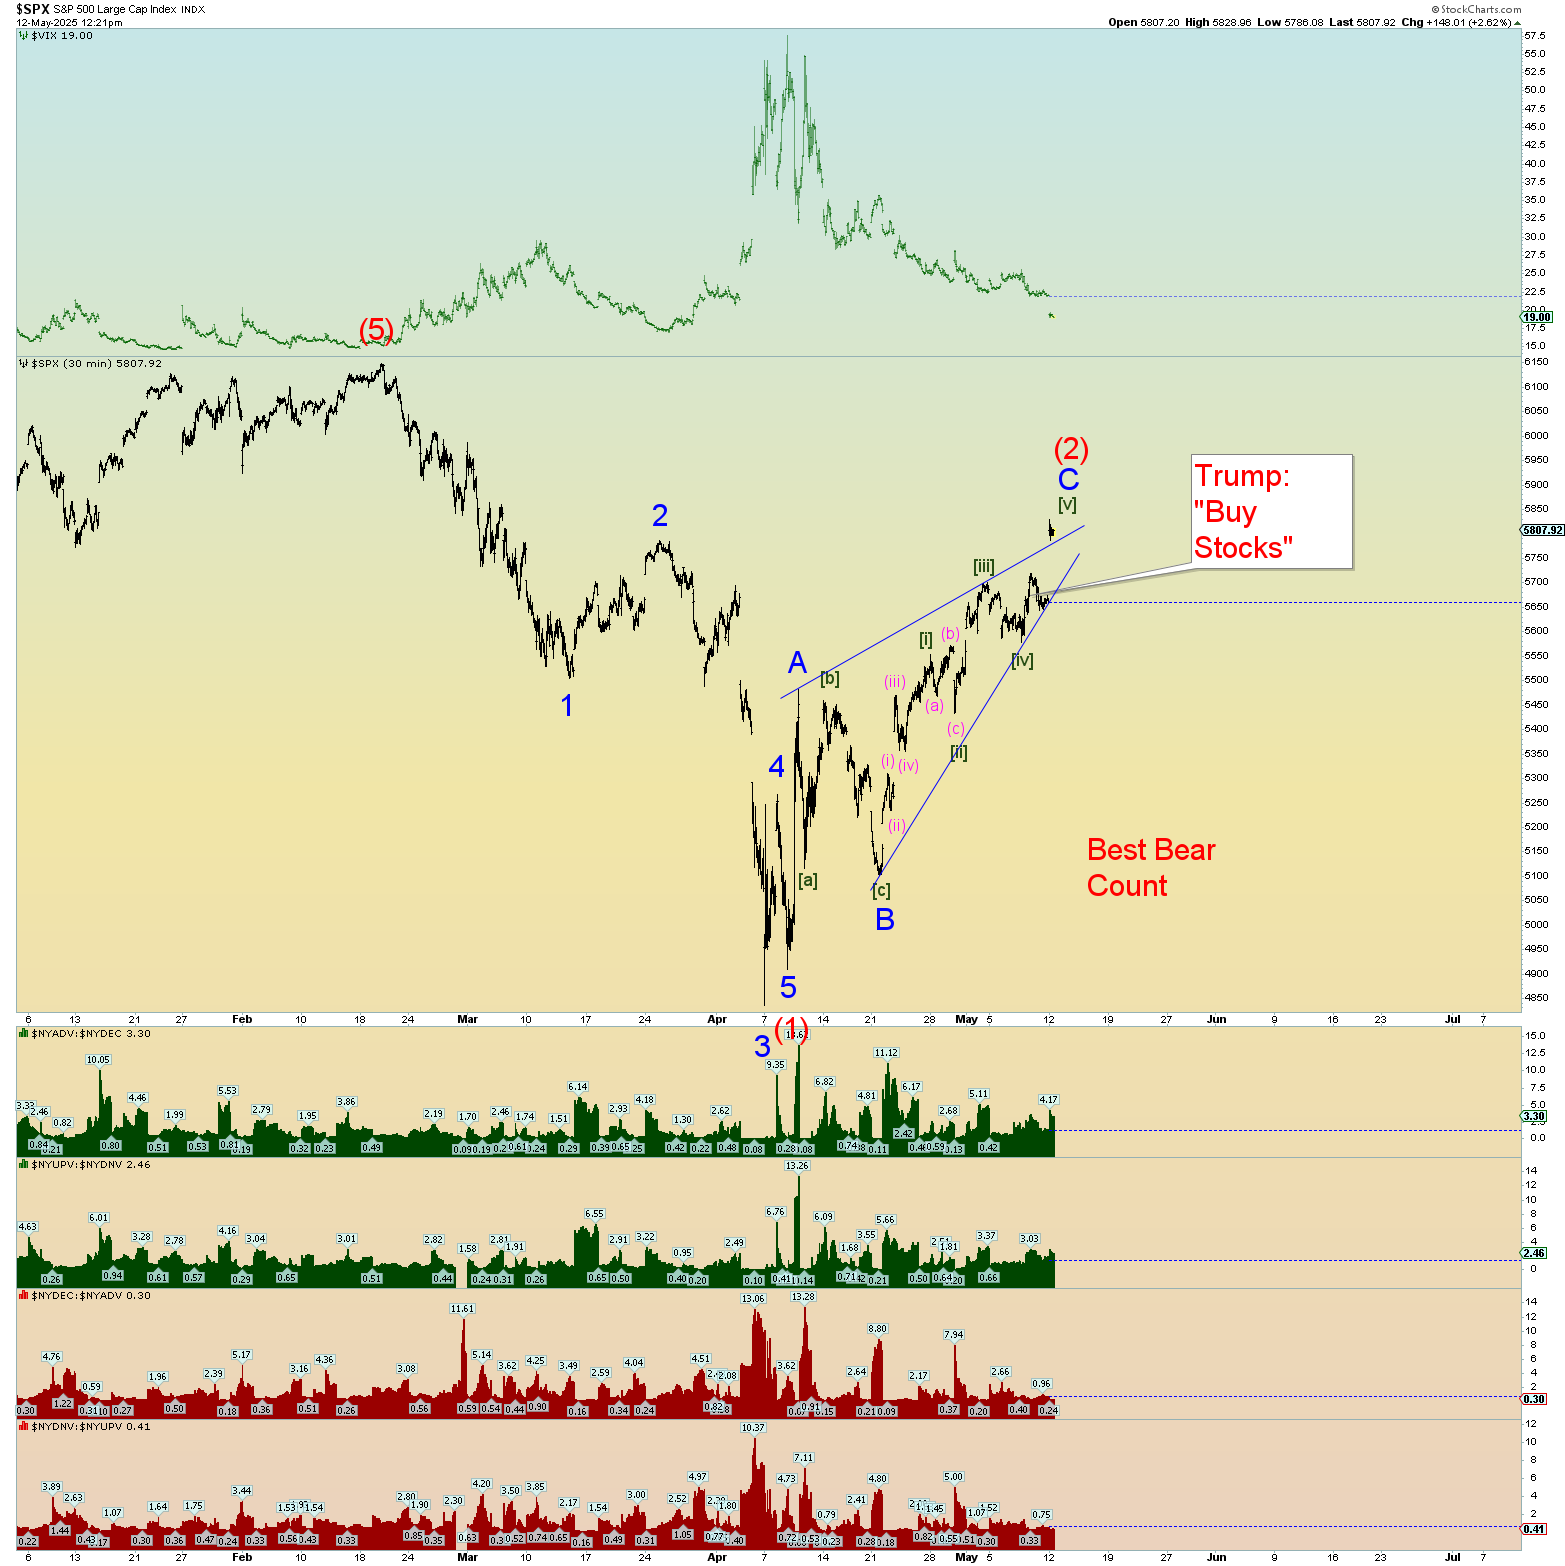
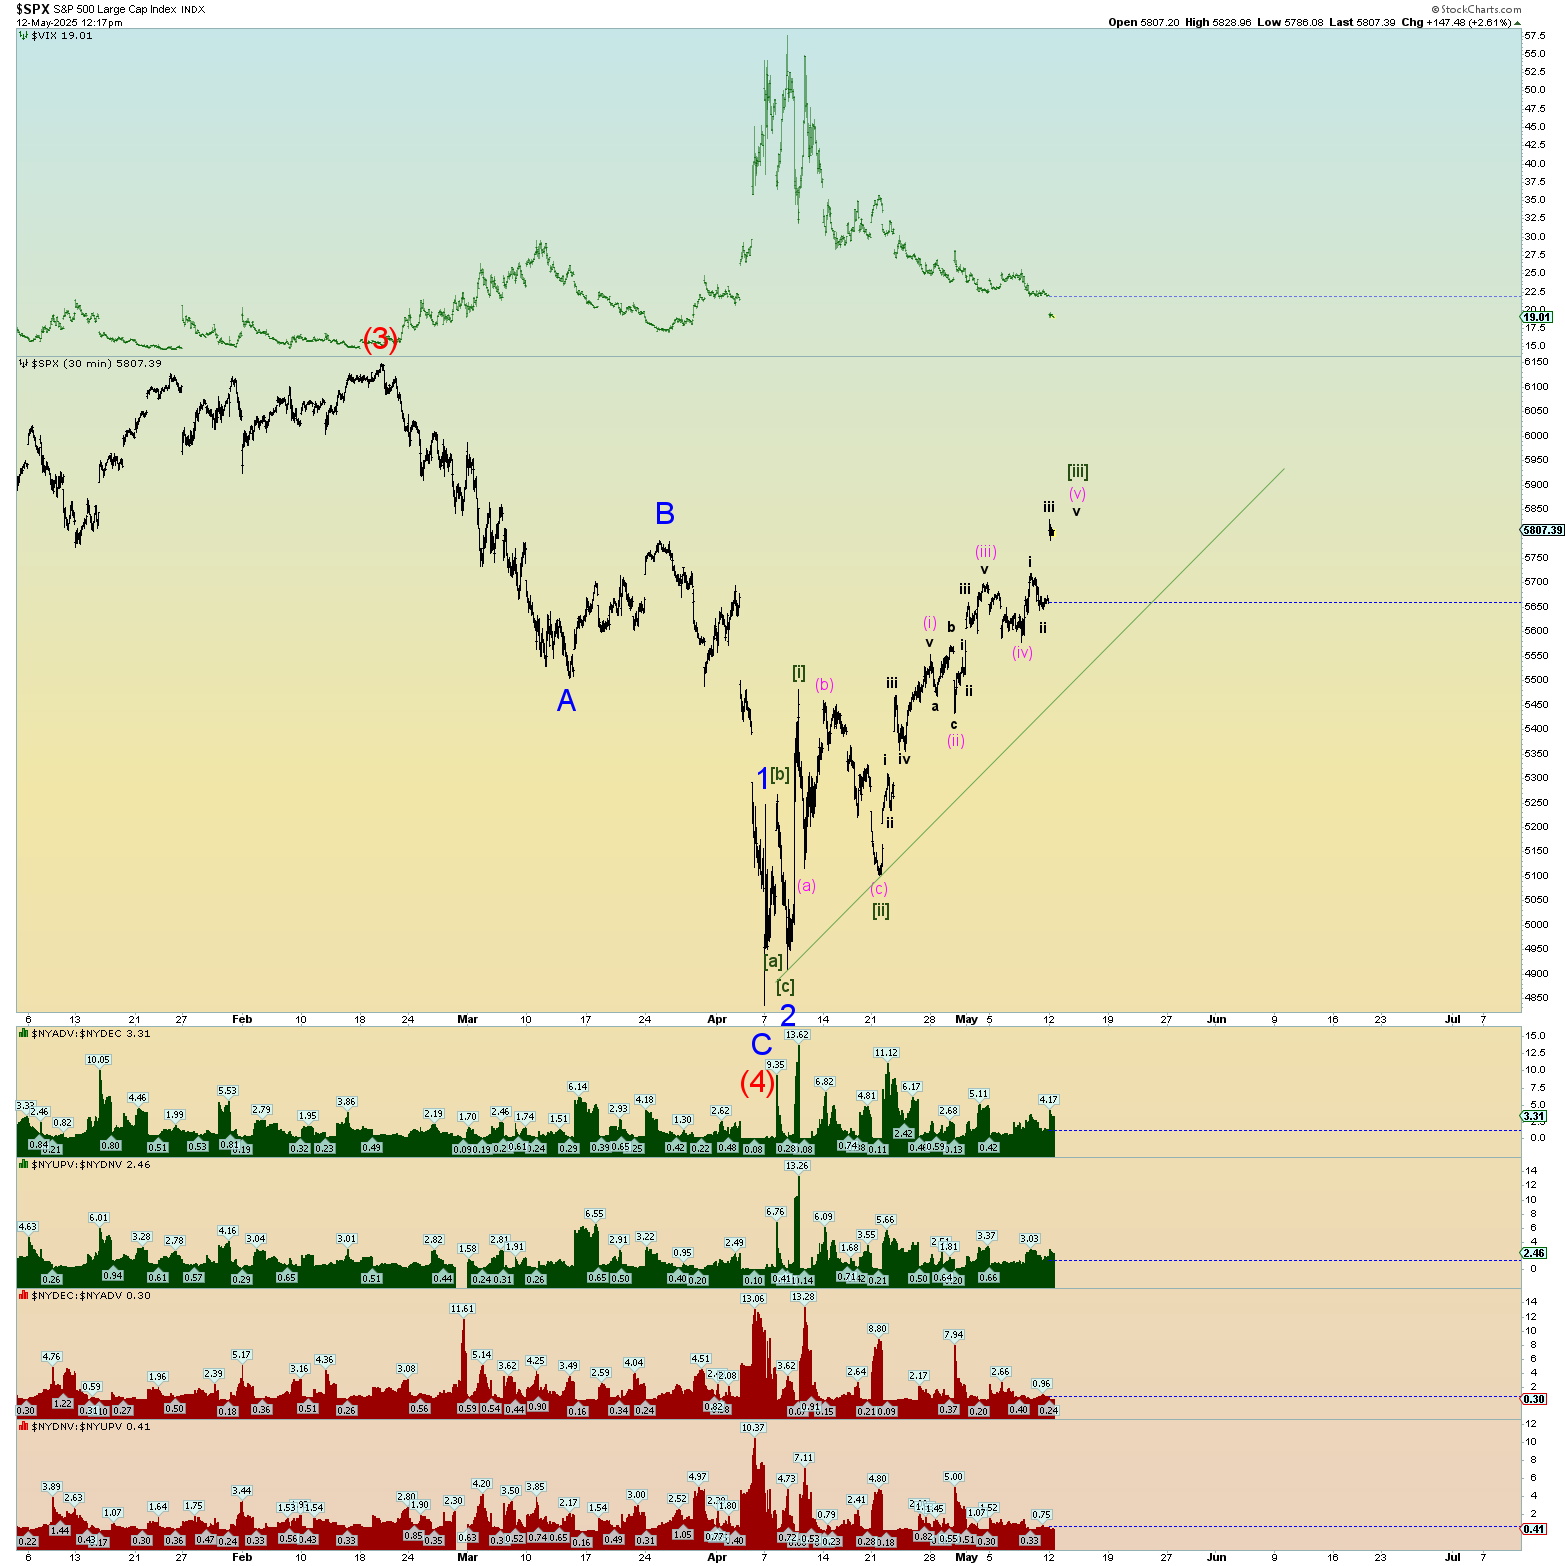
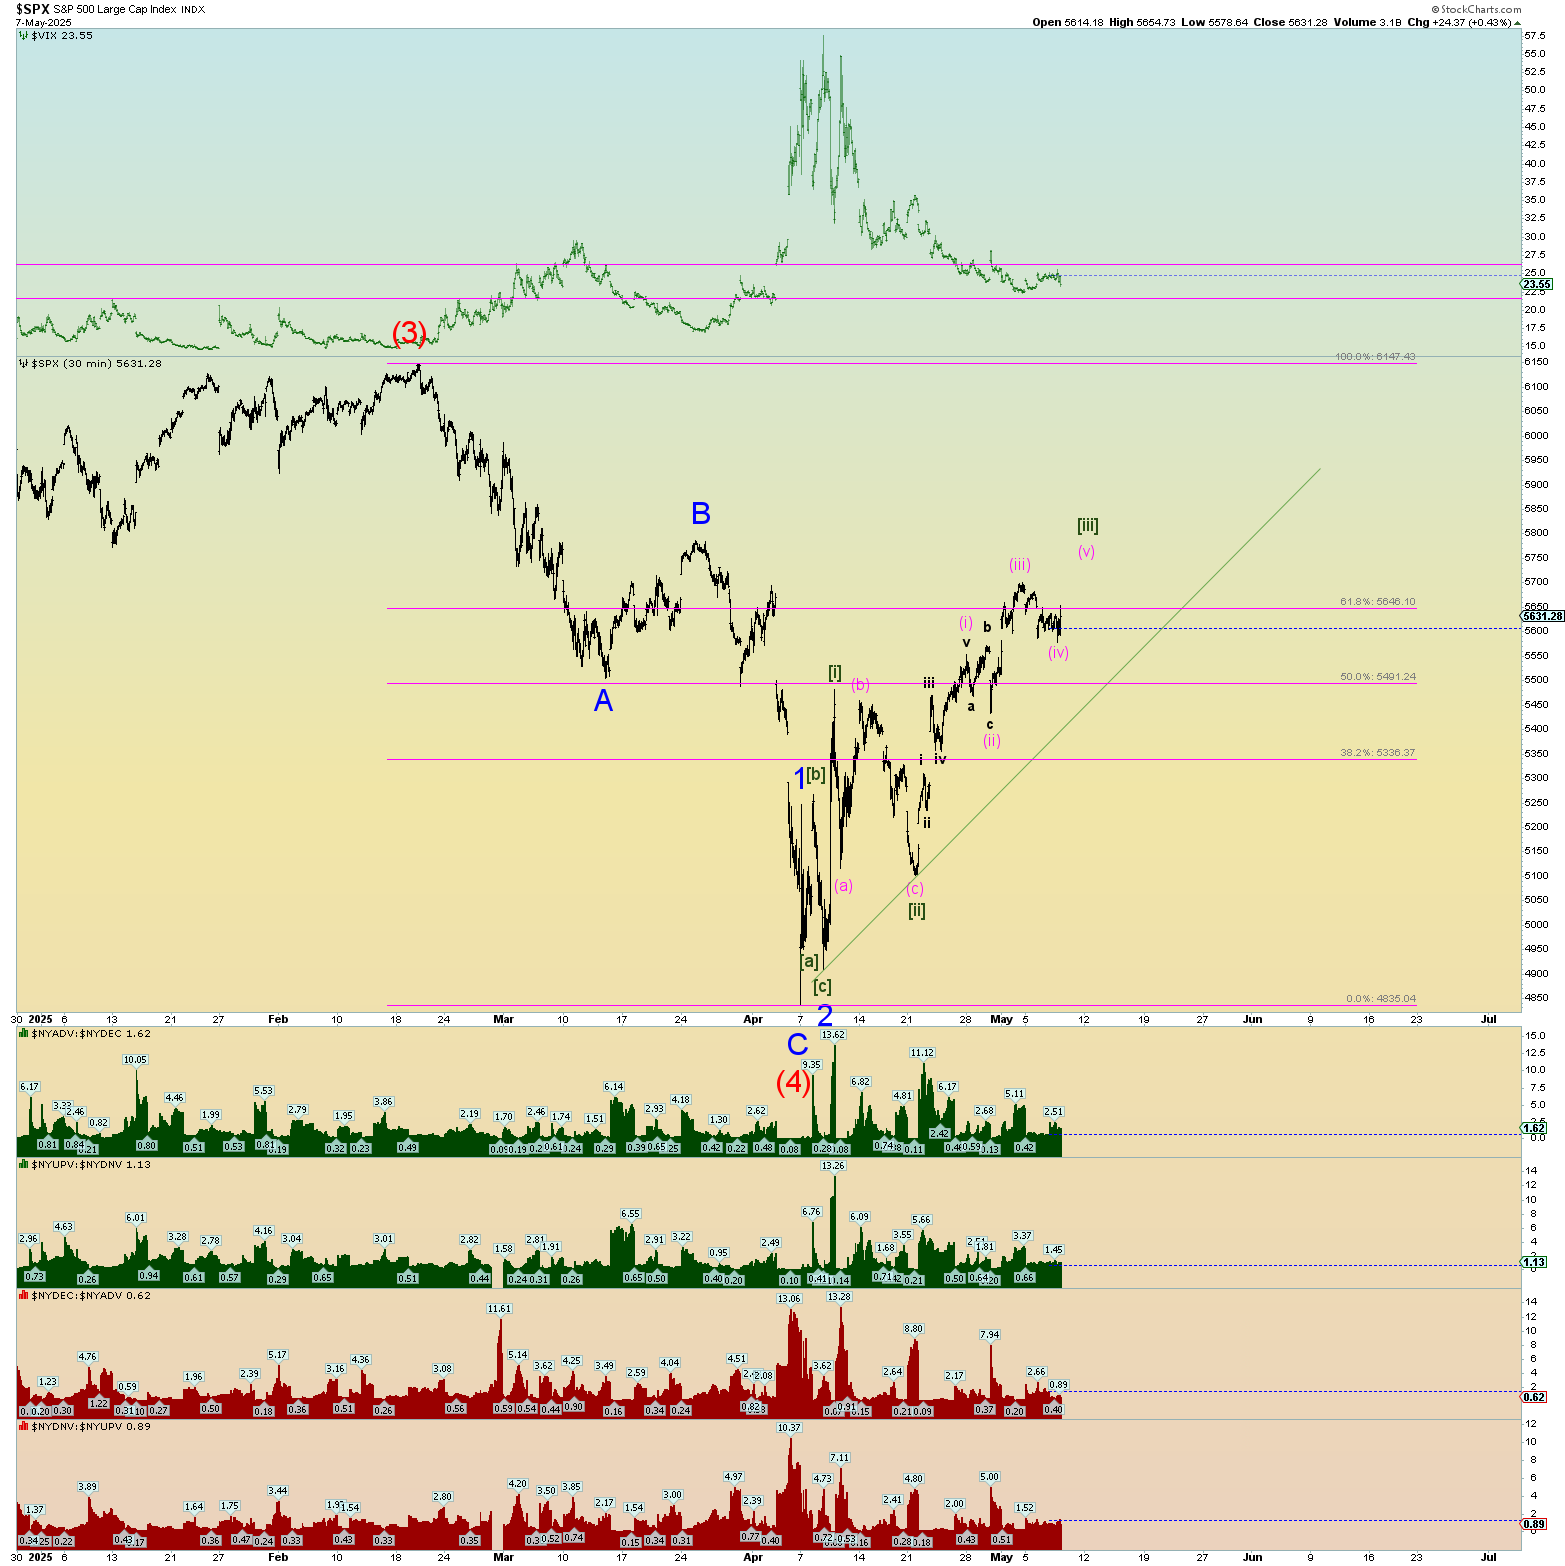
Everything seems on track. The DJIA is lagging badly the SPX which is what I predicted weeks ago. But the count seems sound. The overall target is that the S&P500 makes a new all-time high this summer probably within the next 5 weeks.
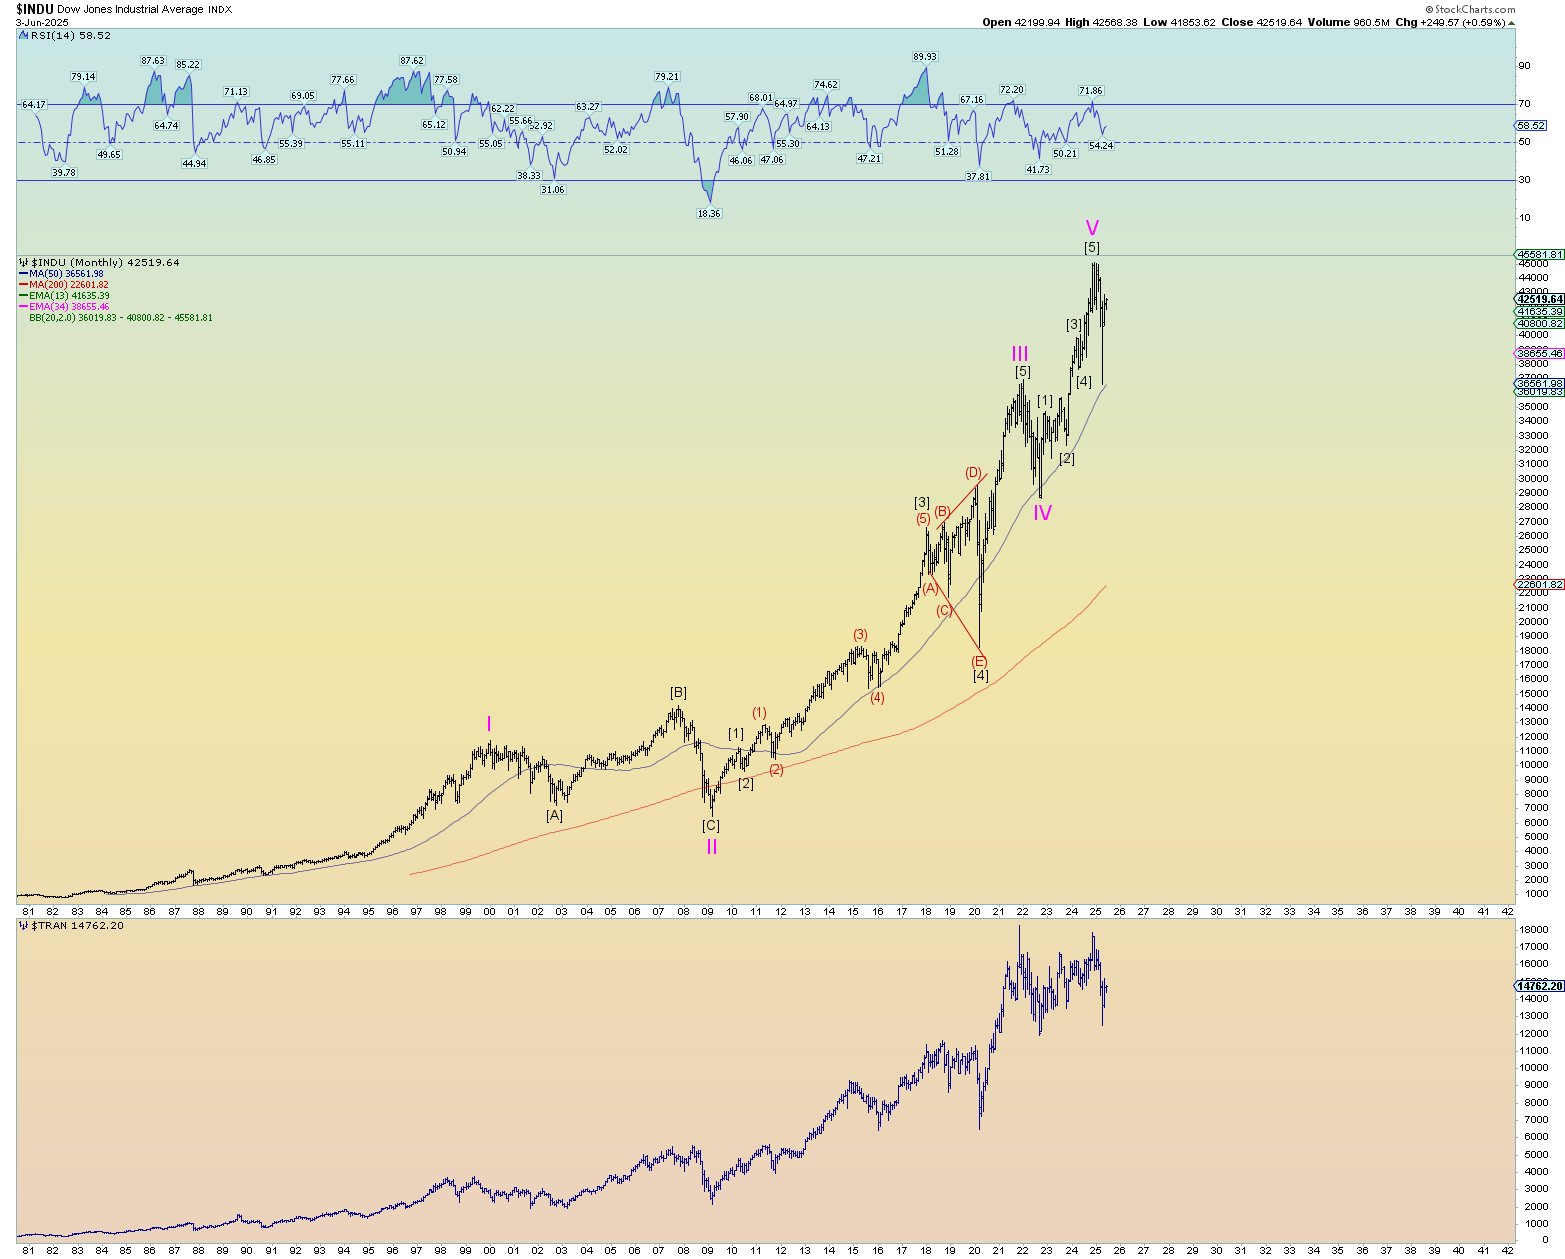
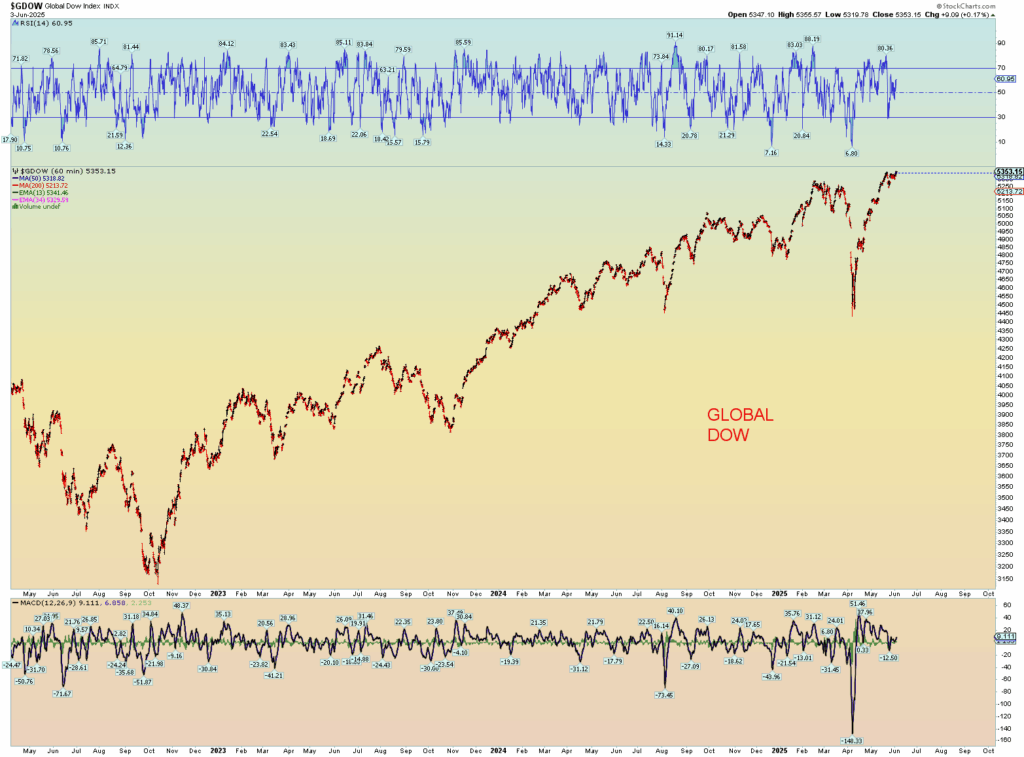
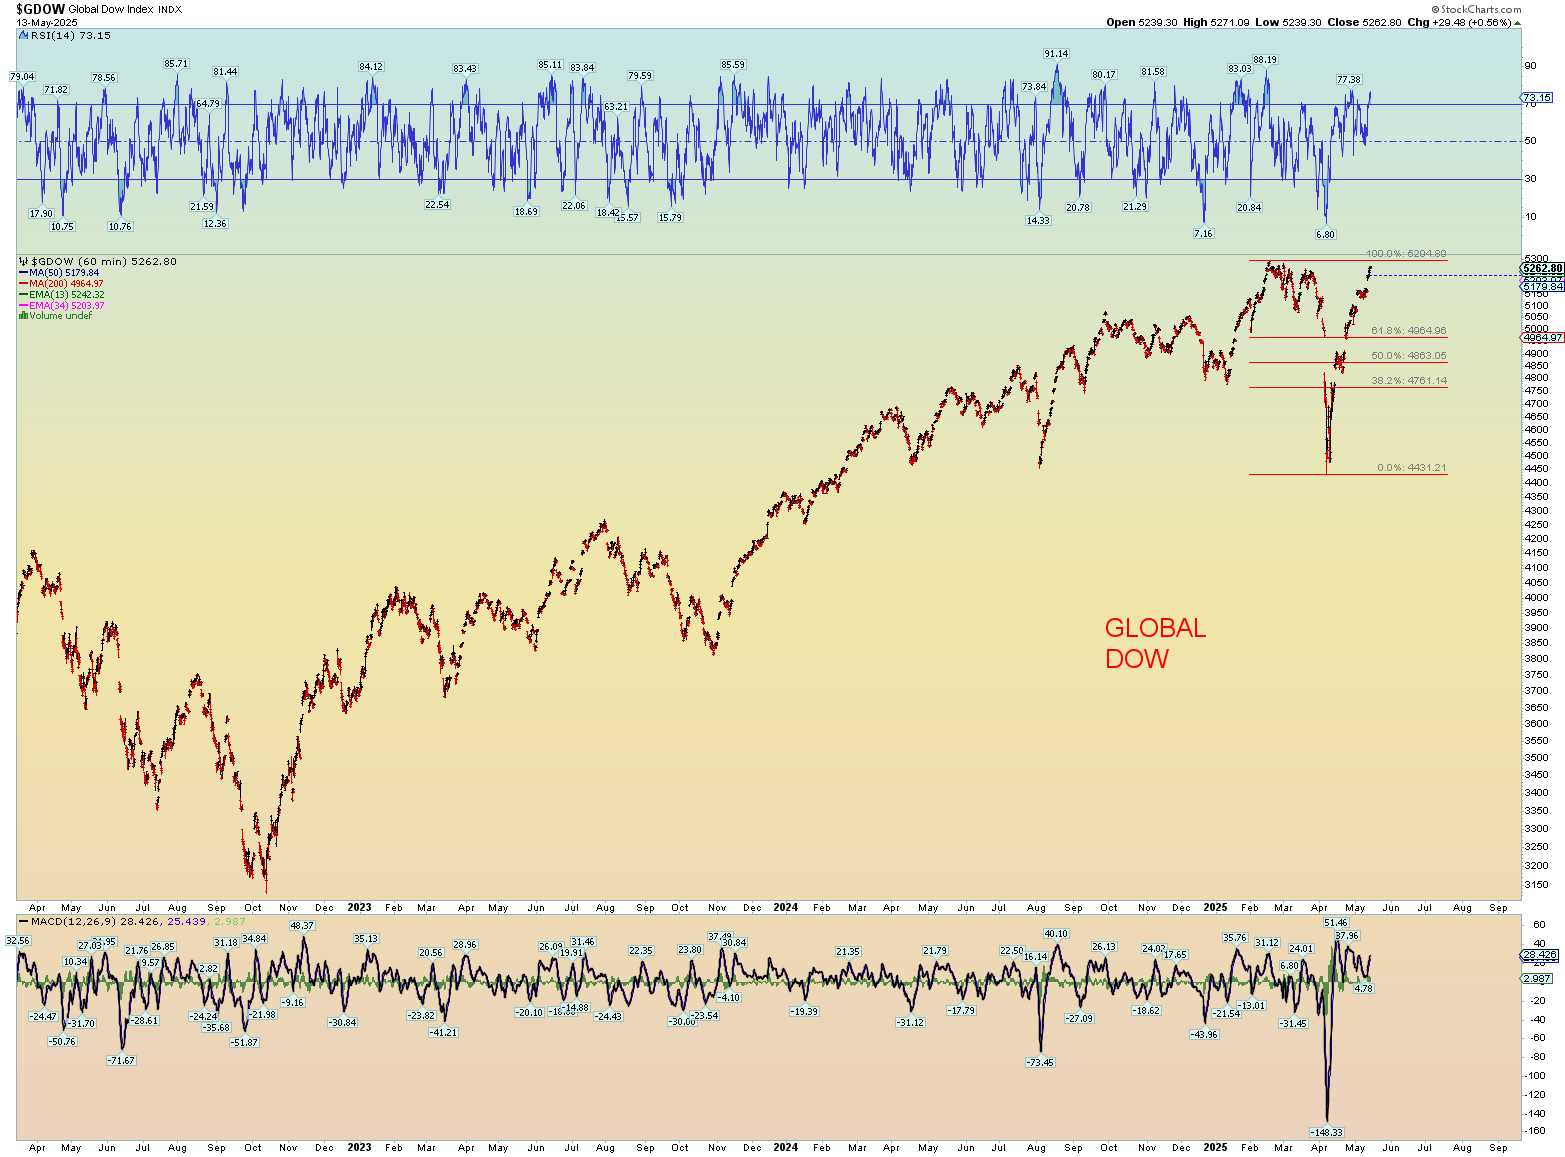
This shows a different perspective and a higher wave degree concerning the DOW. I mainly included it because prices are lagging.
The Global DOW has made a new all-time high, however. Significant divergence from the Industrials.
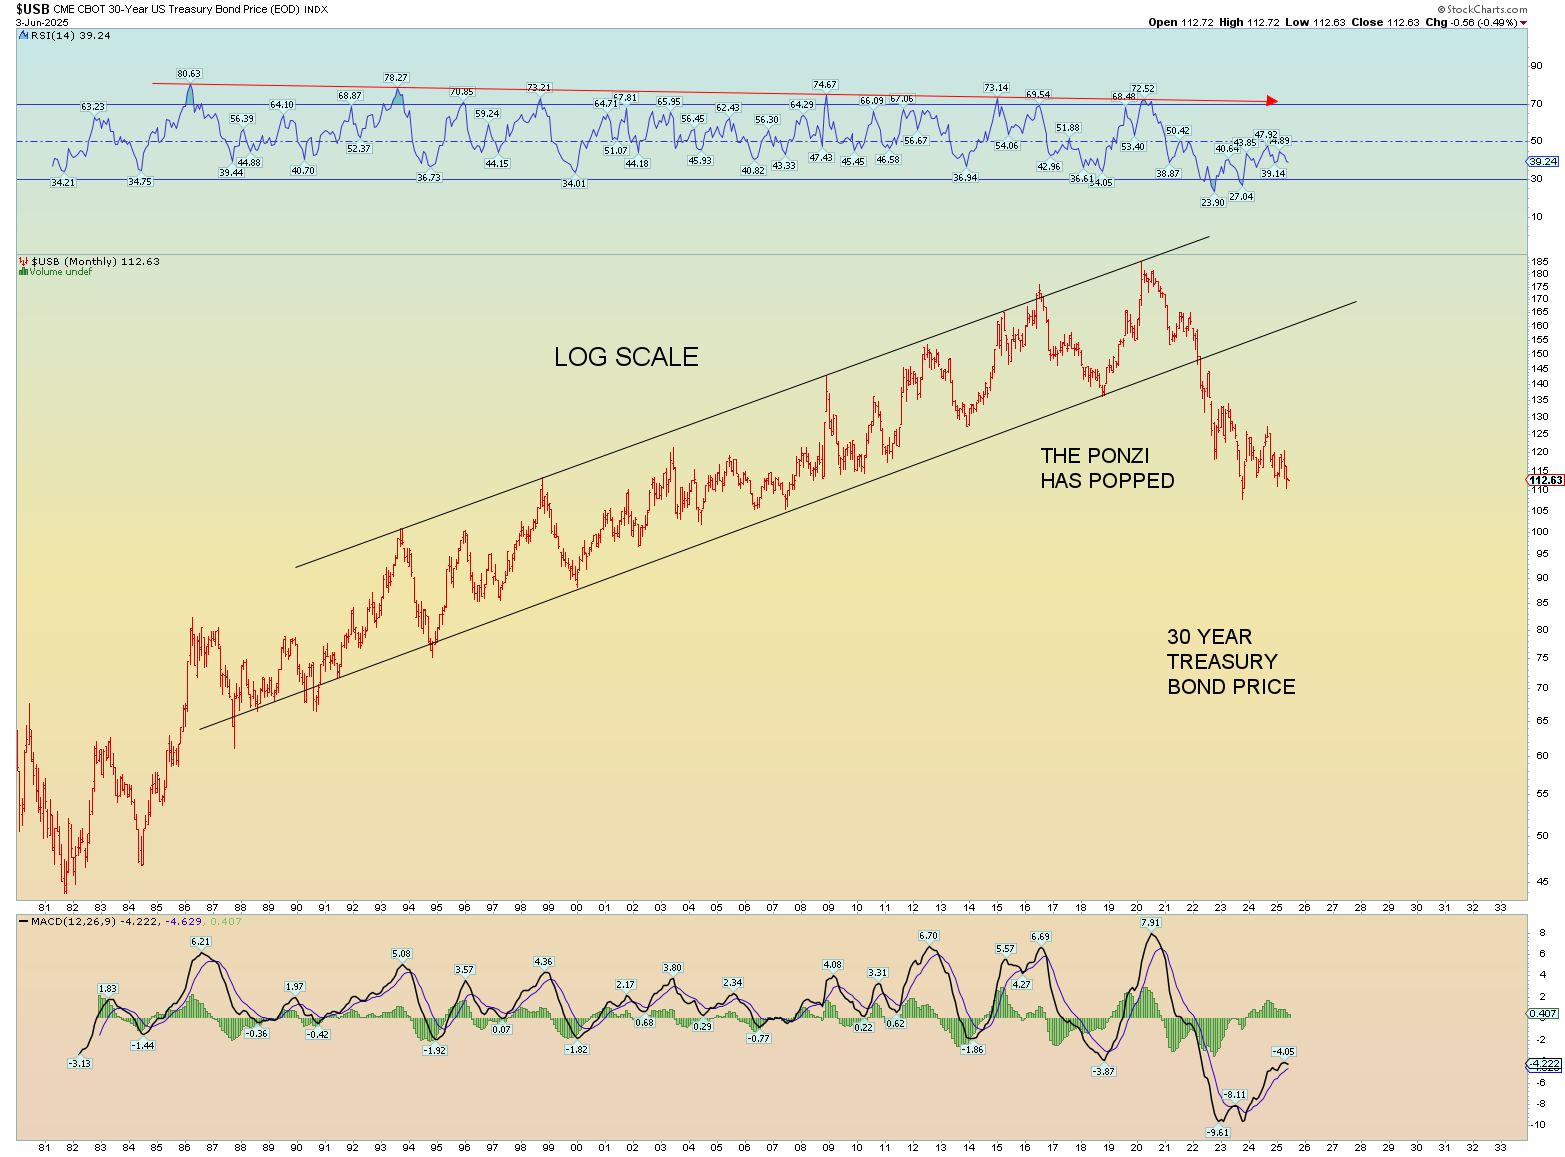
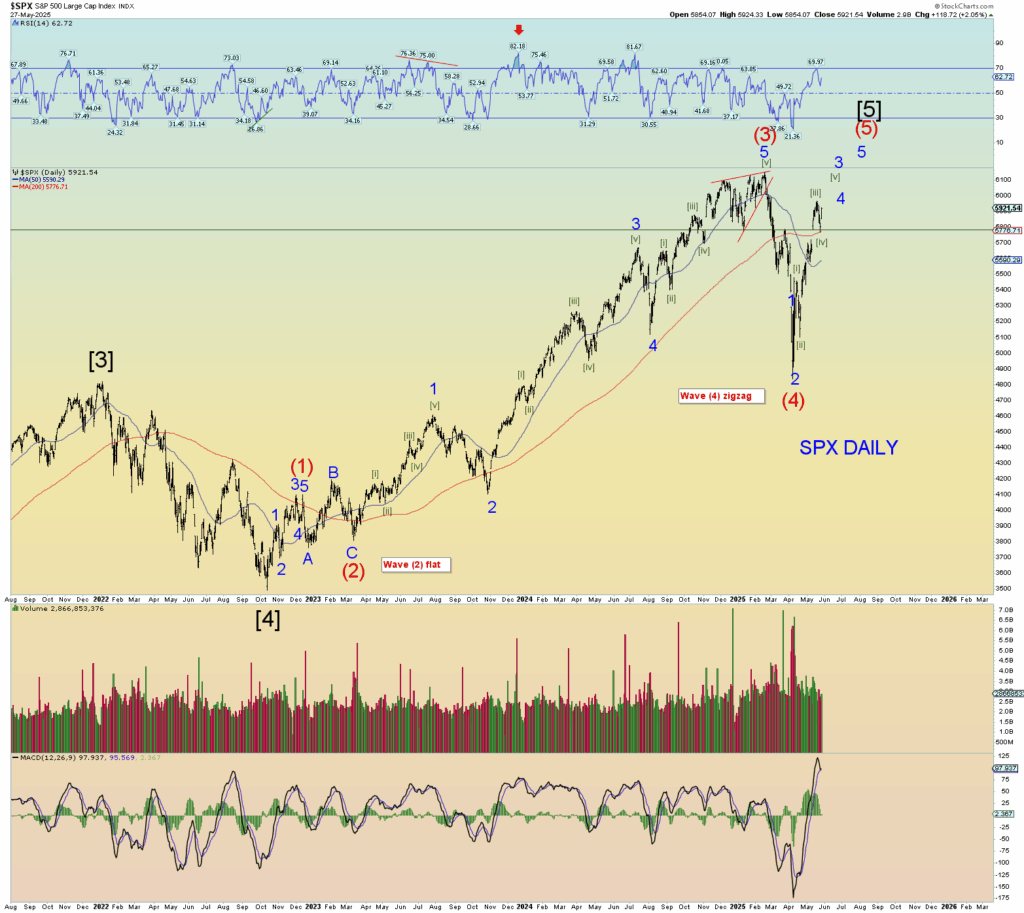
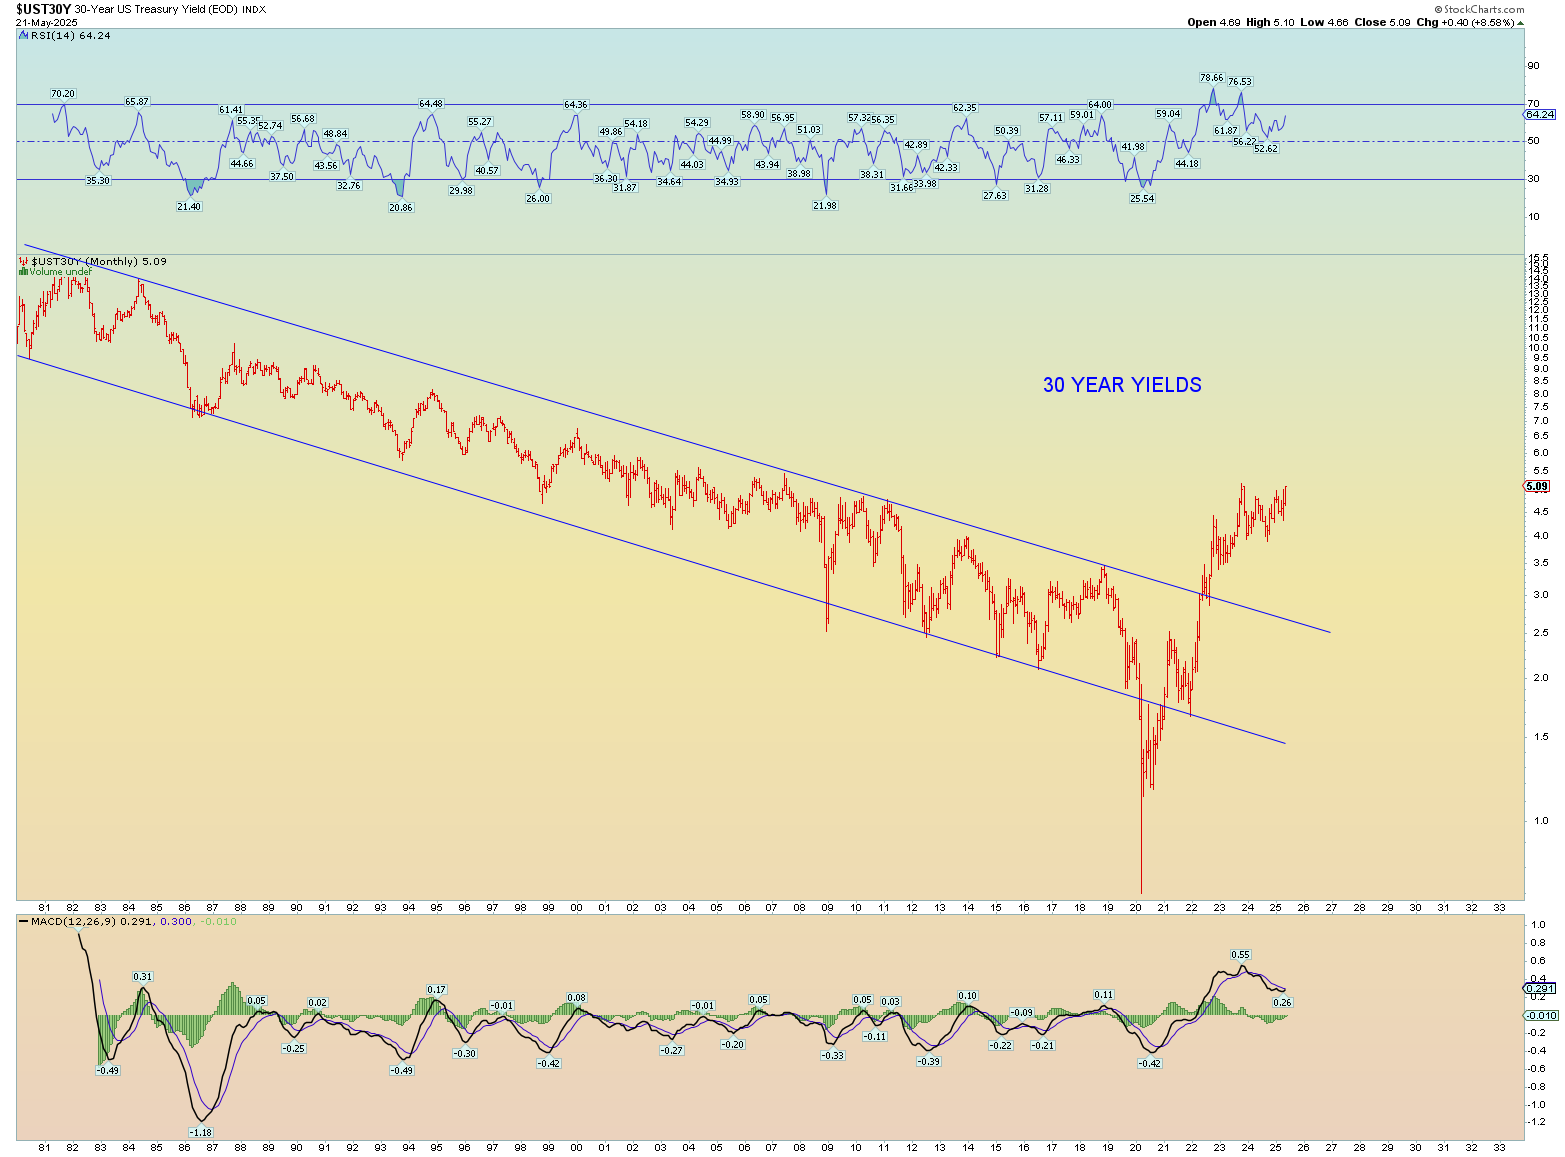
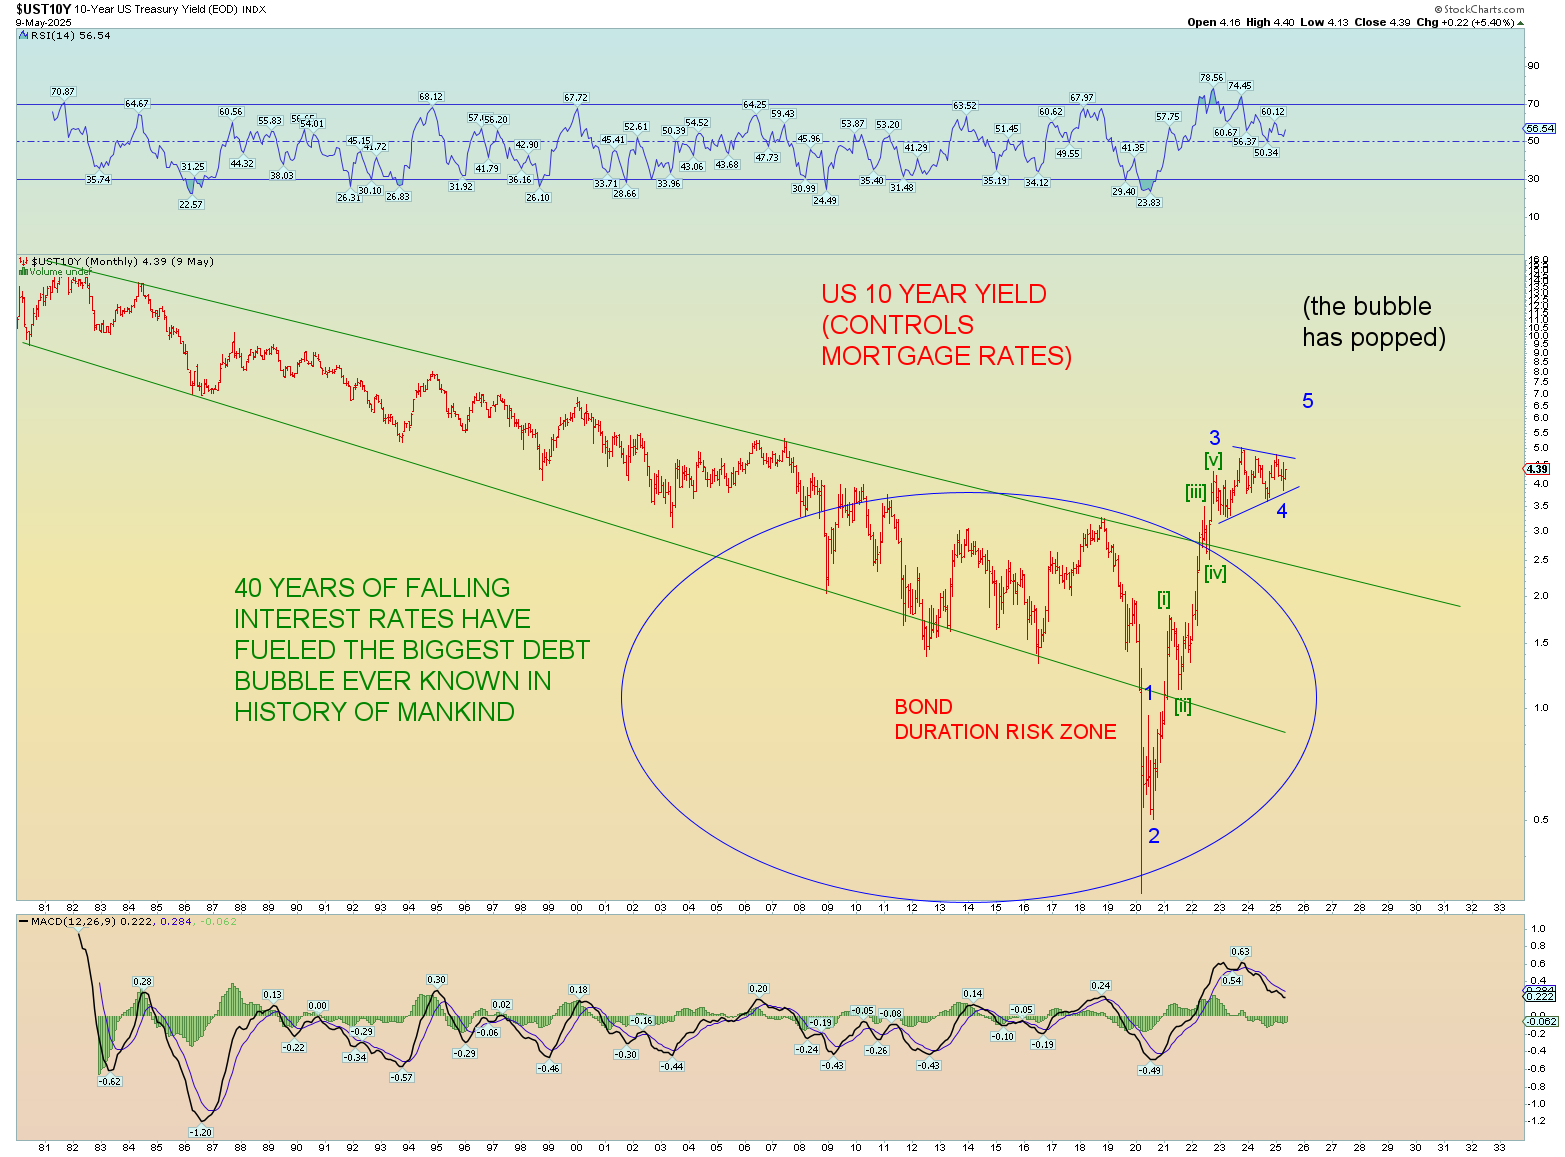
Again, it’s all about the debt loads. The extreme technical oversold condition on the monthly scale has been worked off. This is not a bullish configuration.
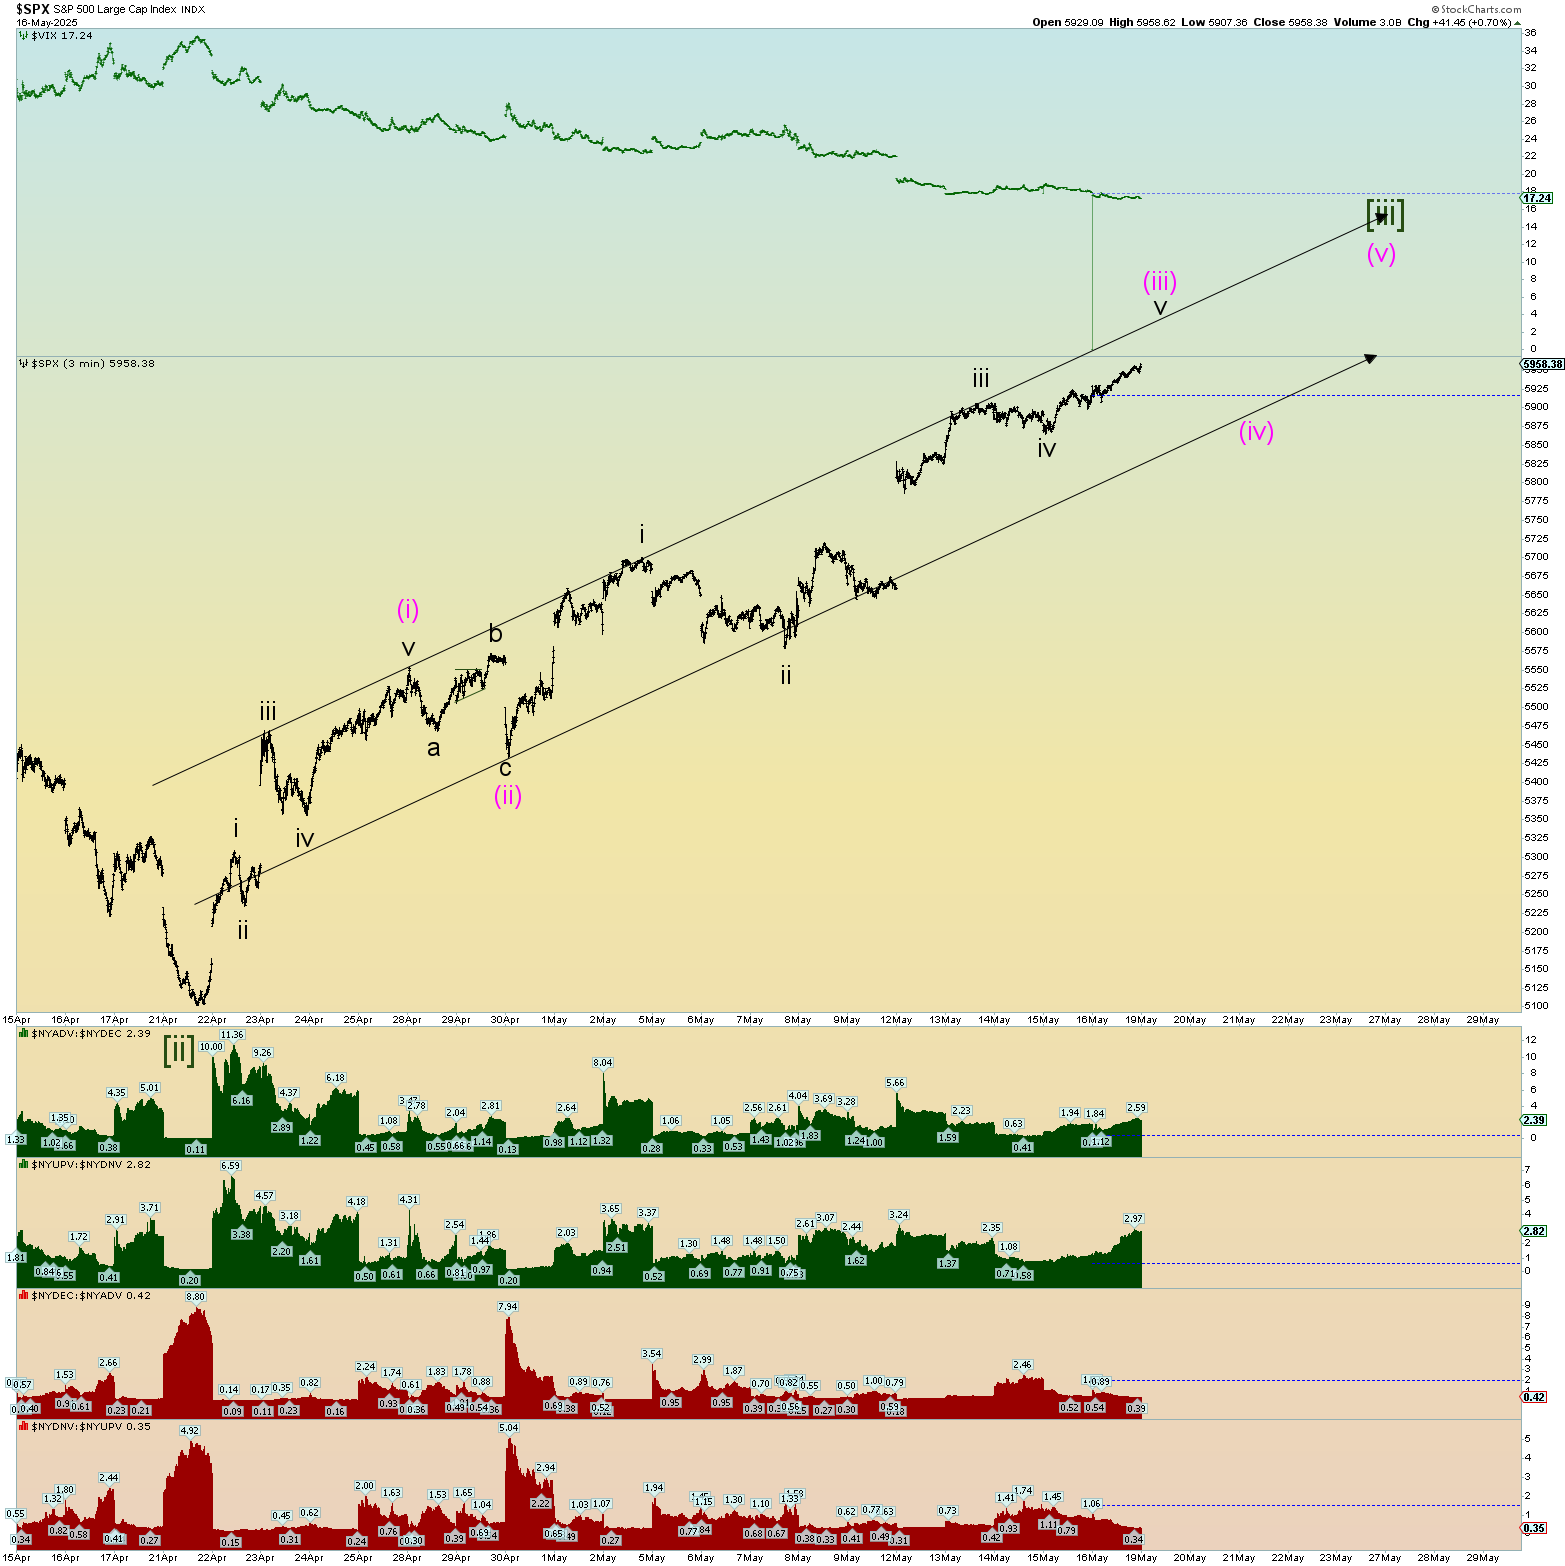
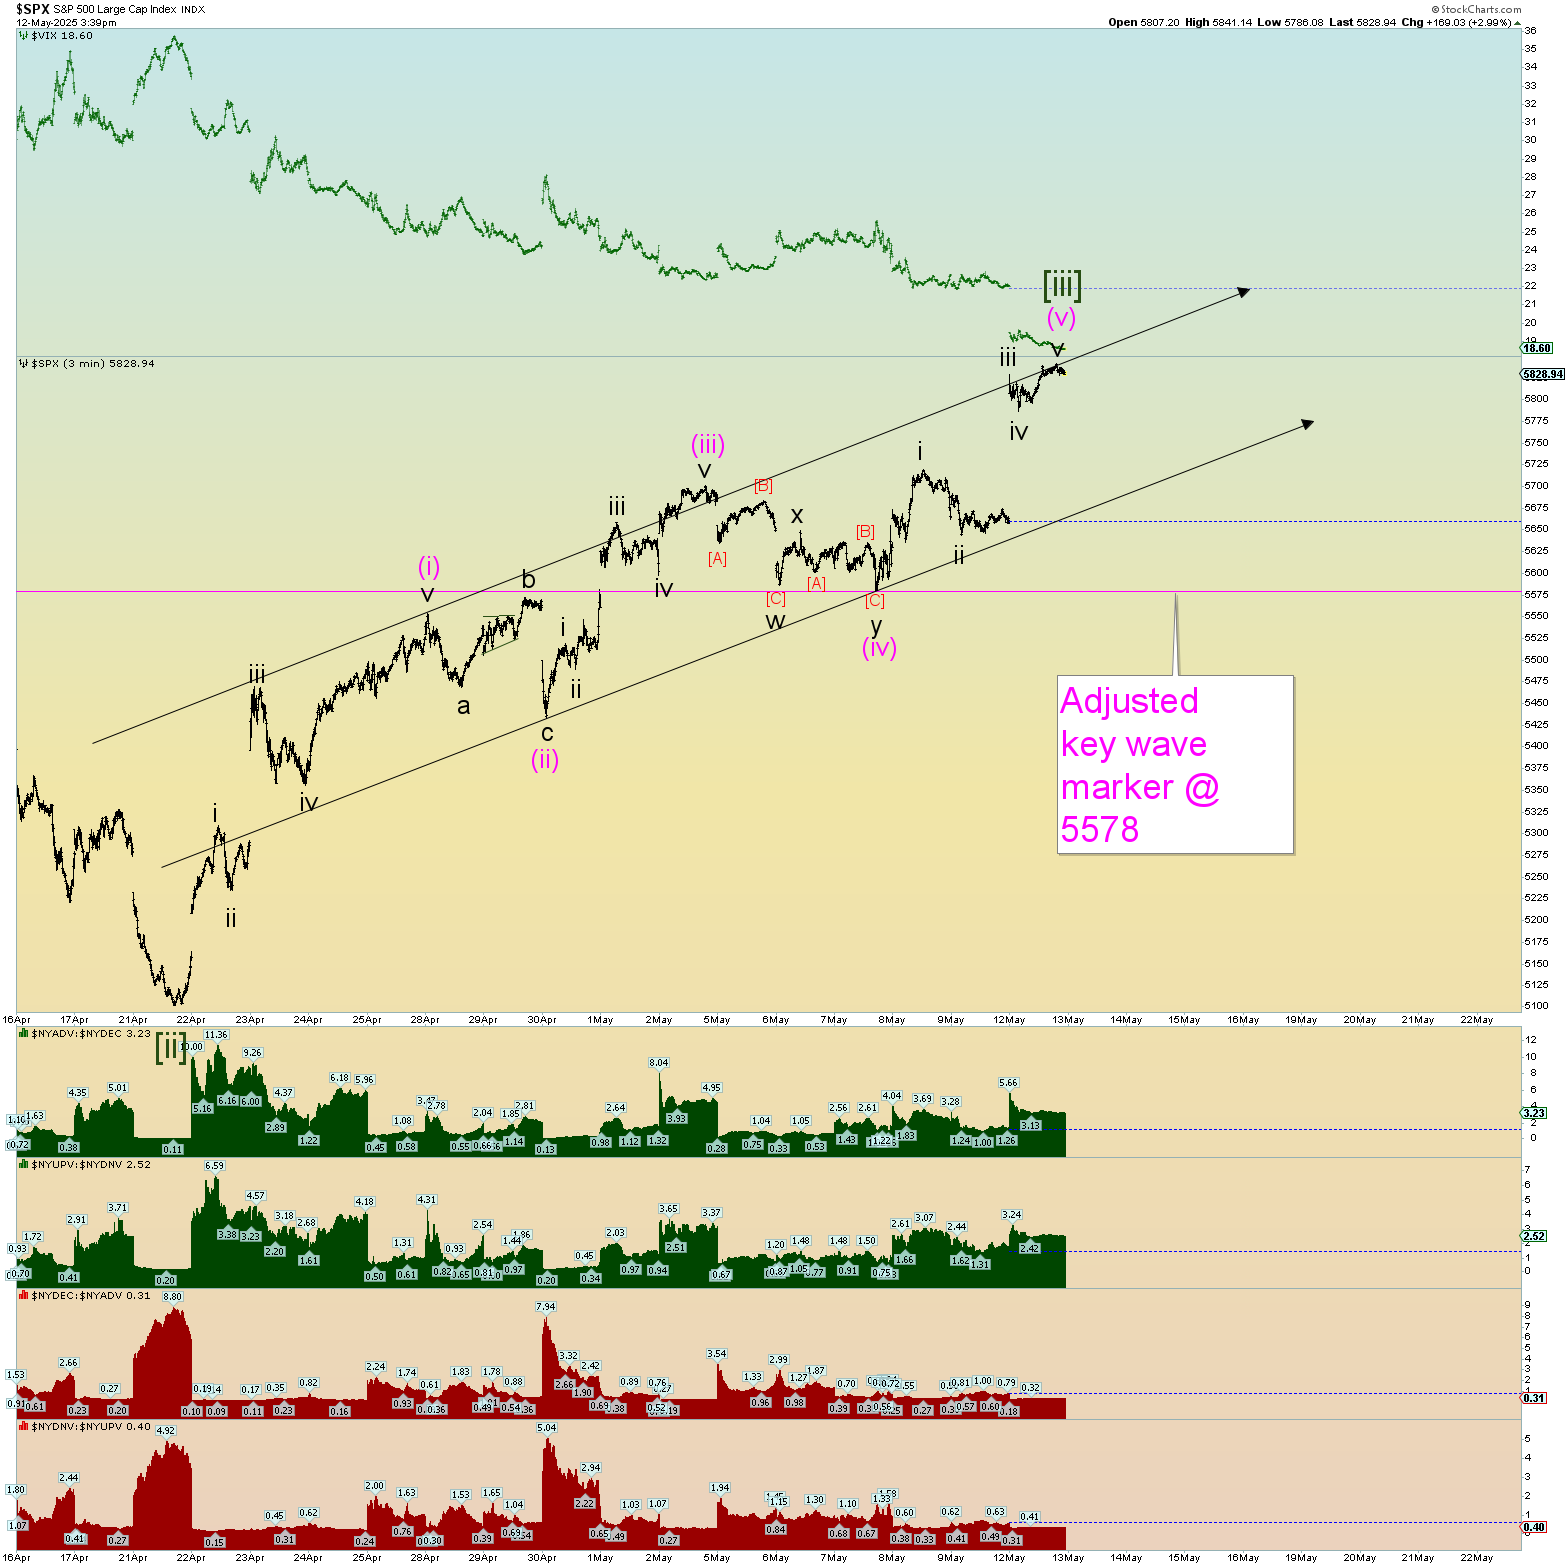
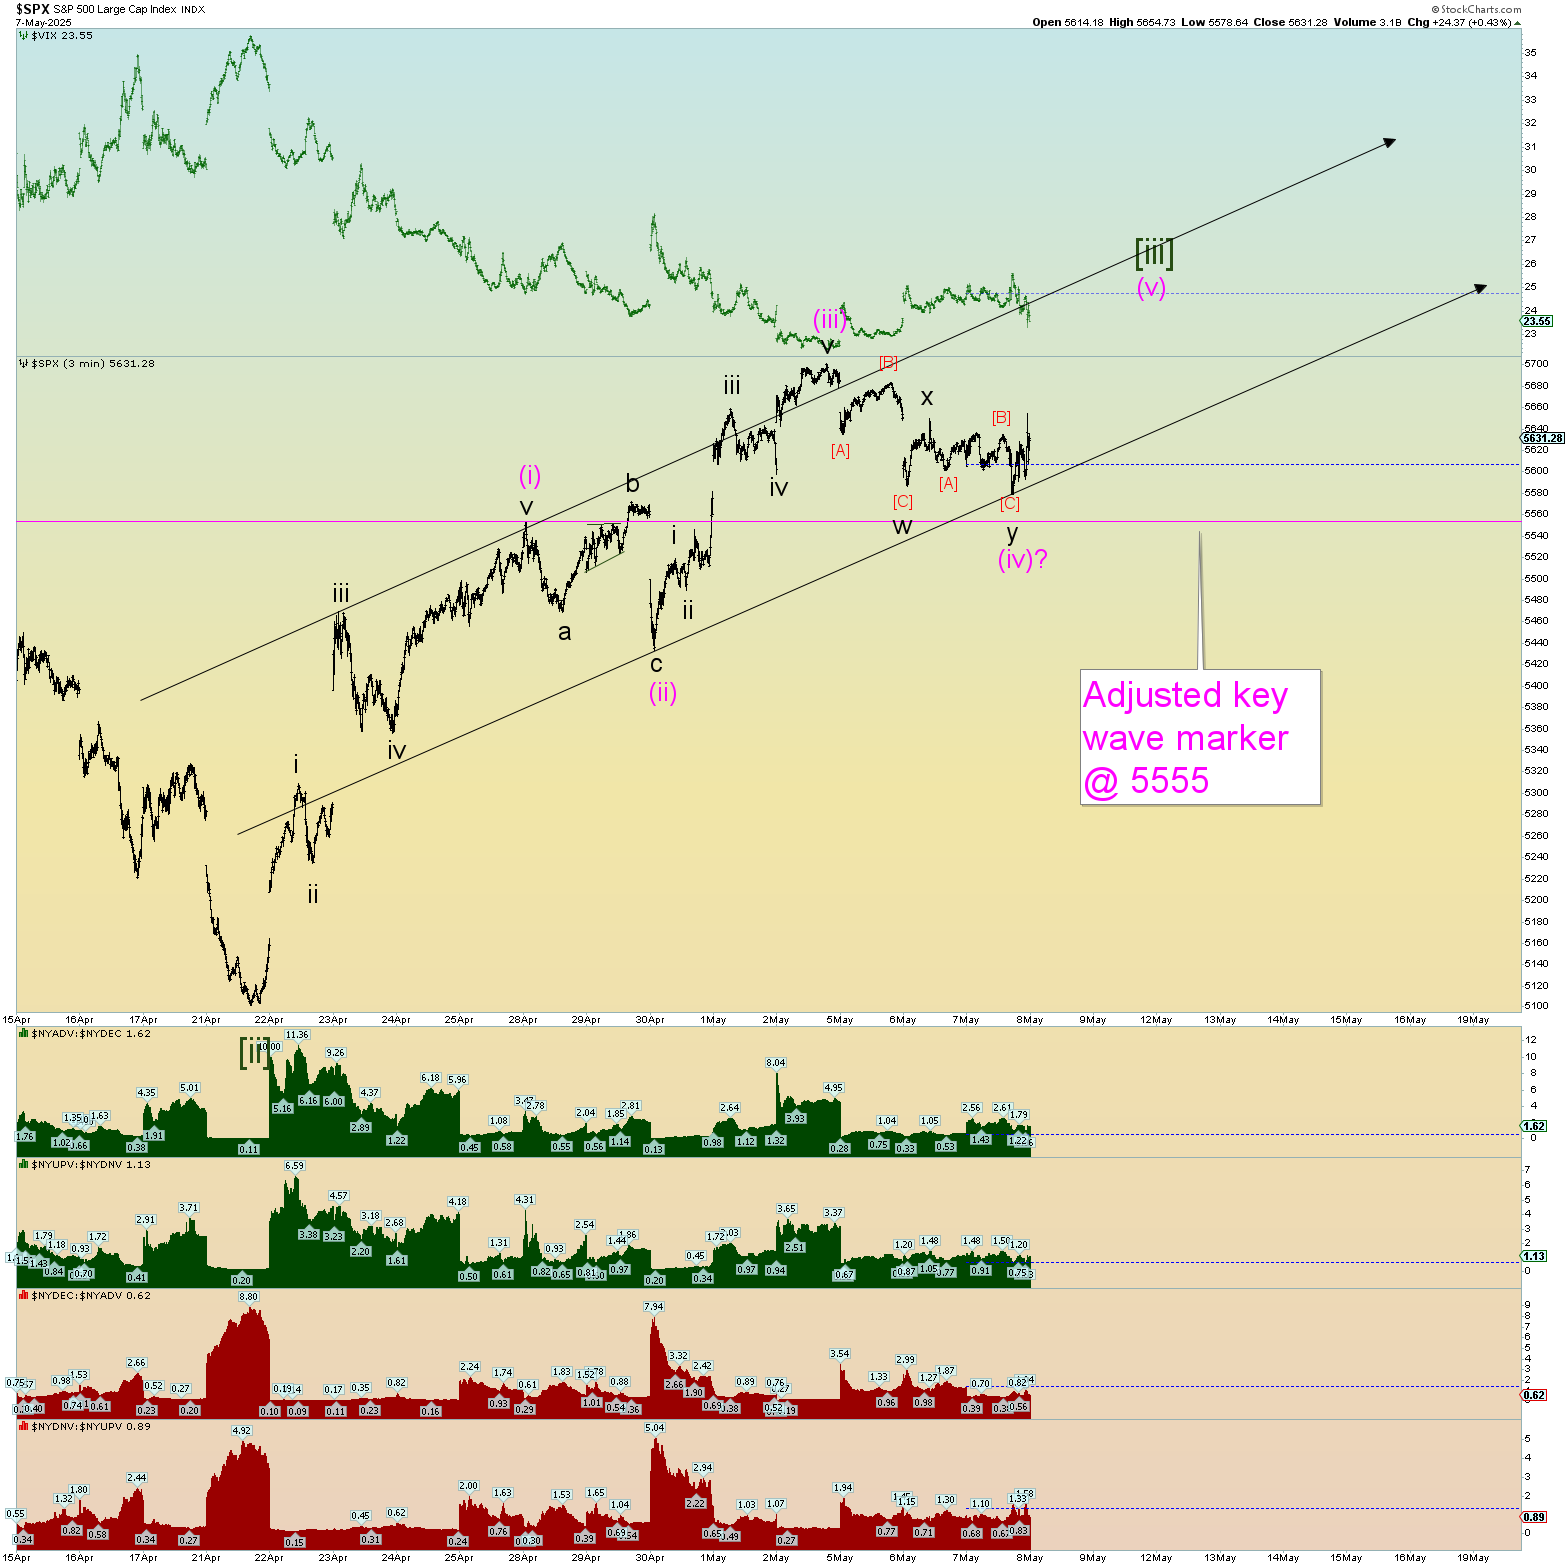
Today’s correction was big enough to consider the top of Minute [iii] has occurred. One such squiggle count is presented below. I feel the market’s best bet is to limit this Minute [iv] and continue higher sooner rather than later. A bigger dip would be damaging. Today’s market internal numbers ended on a high down volume and decliners vs advancers. That’s got to be concerning for bulls who bought this big open chart gap up.
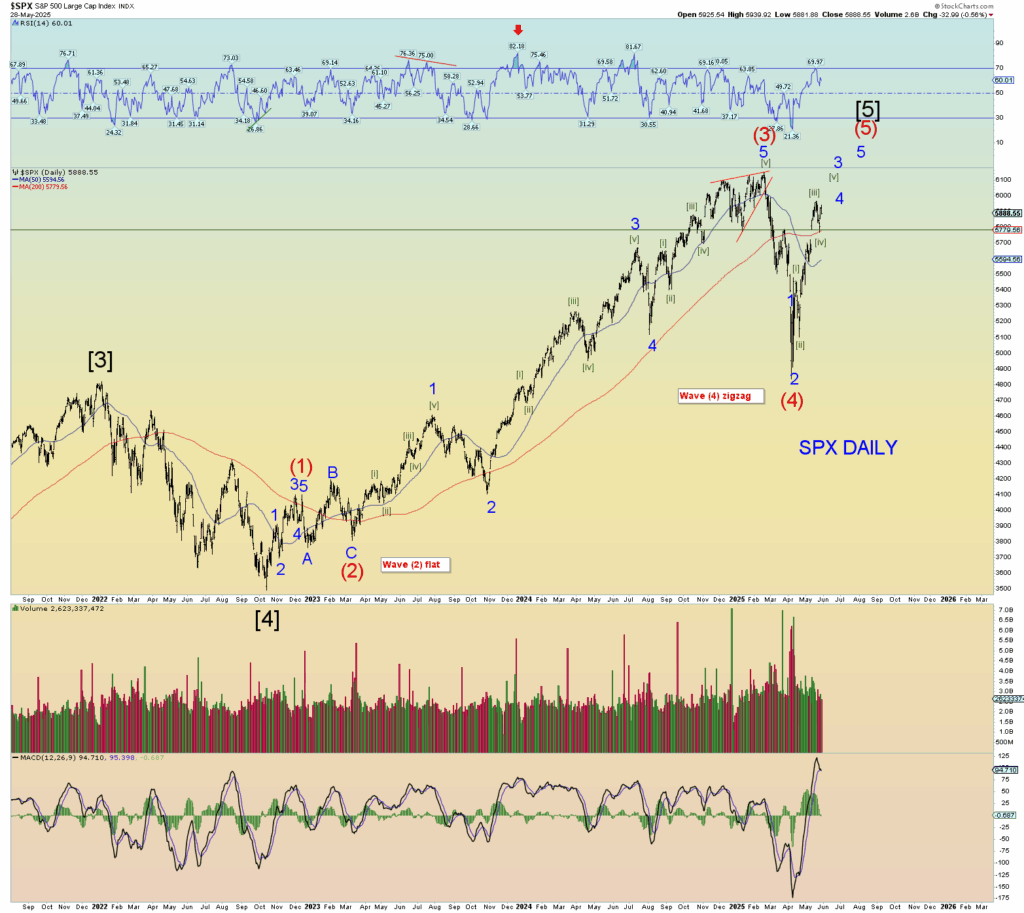
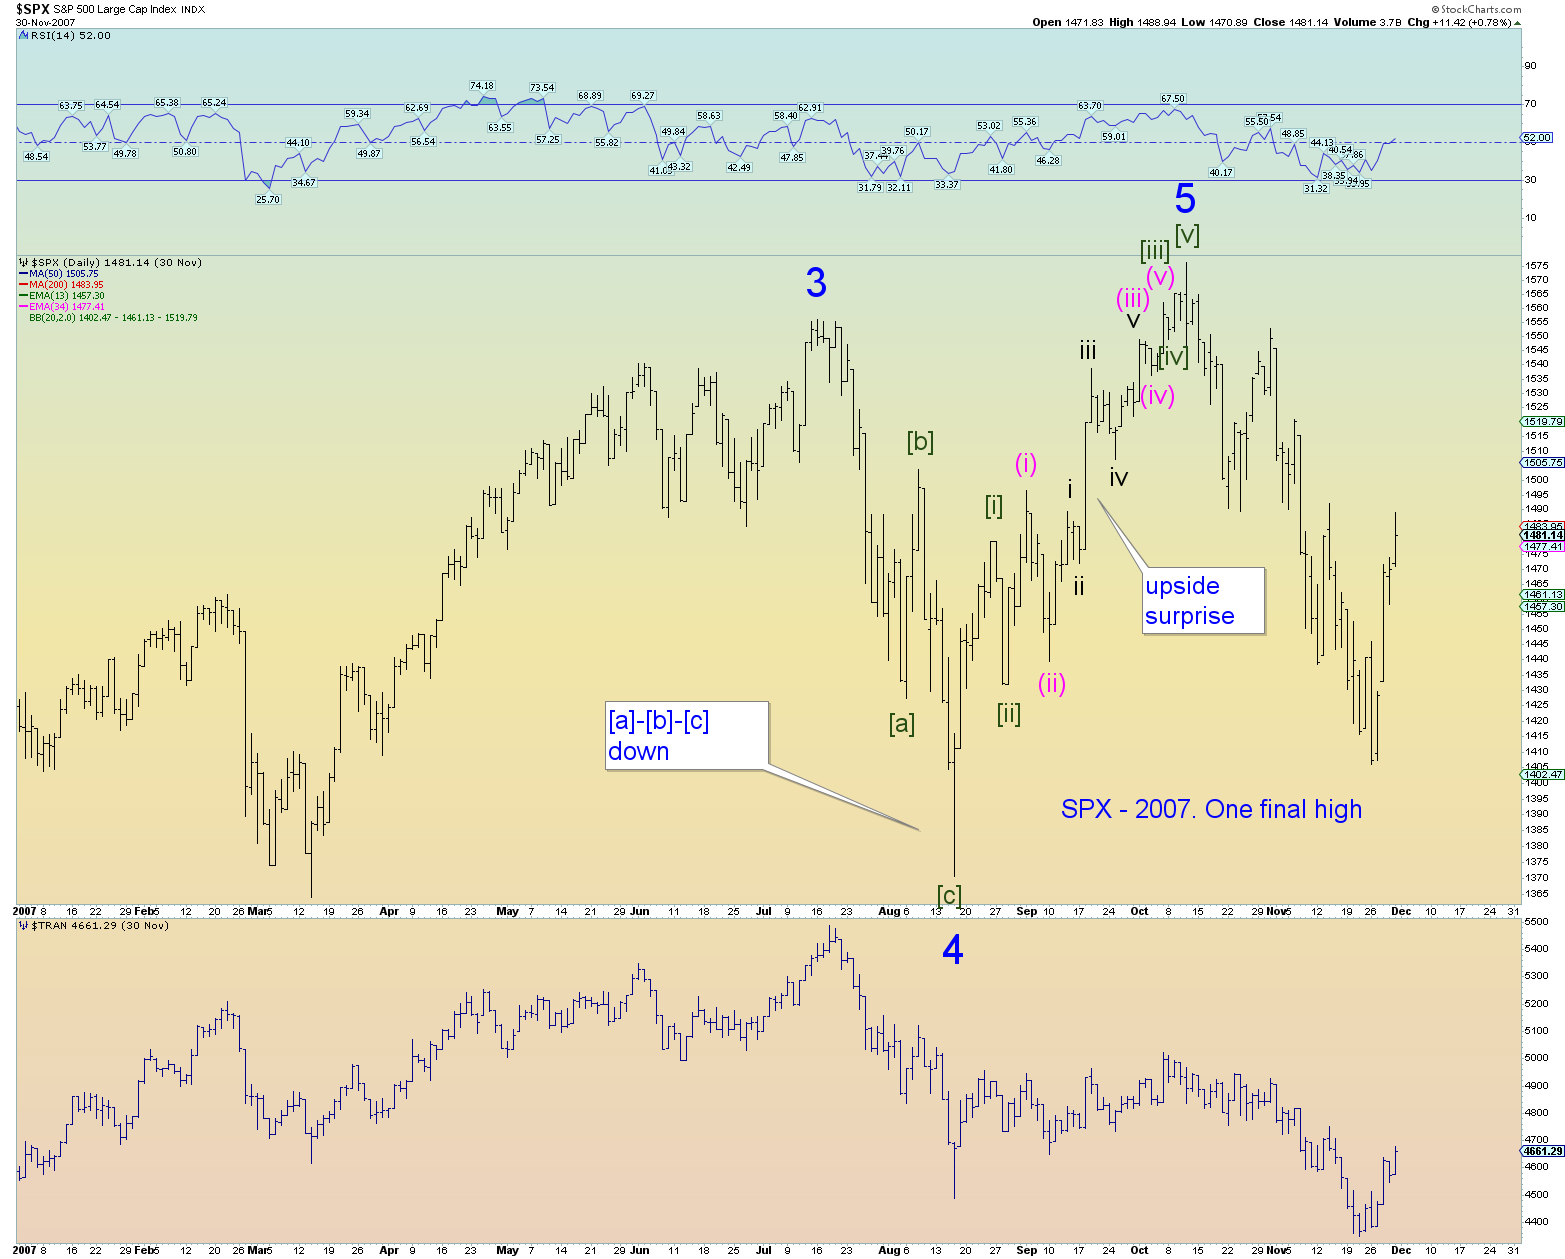
Again, looking at 2007’s final push to another new high occurred in rapid fashion (even though at least 1 degree wave lower) with big waves at the bottom of the structure and smaller at the top. It’s an example of a last market high wave that did not have a perfectly symmetrical structure.
I feel today’s market must do the same to have a chance at a new all-time high. Do it quickly in the summer when trading is thinner. Remember, I may be “bullish” short term for this final wave reaching a new high, but in reality, it still counts as the last. In my eyes, if it squeaks out a new high, its over anyways. I could care less and if does not happen, we are well prepared for an extremely bearish count.
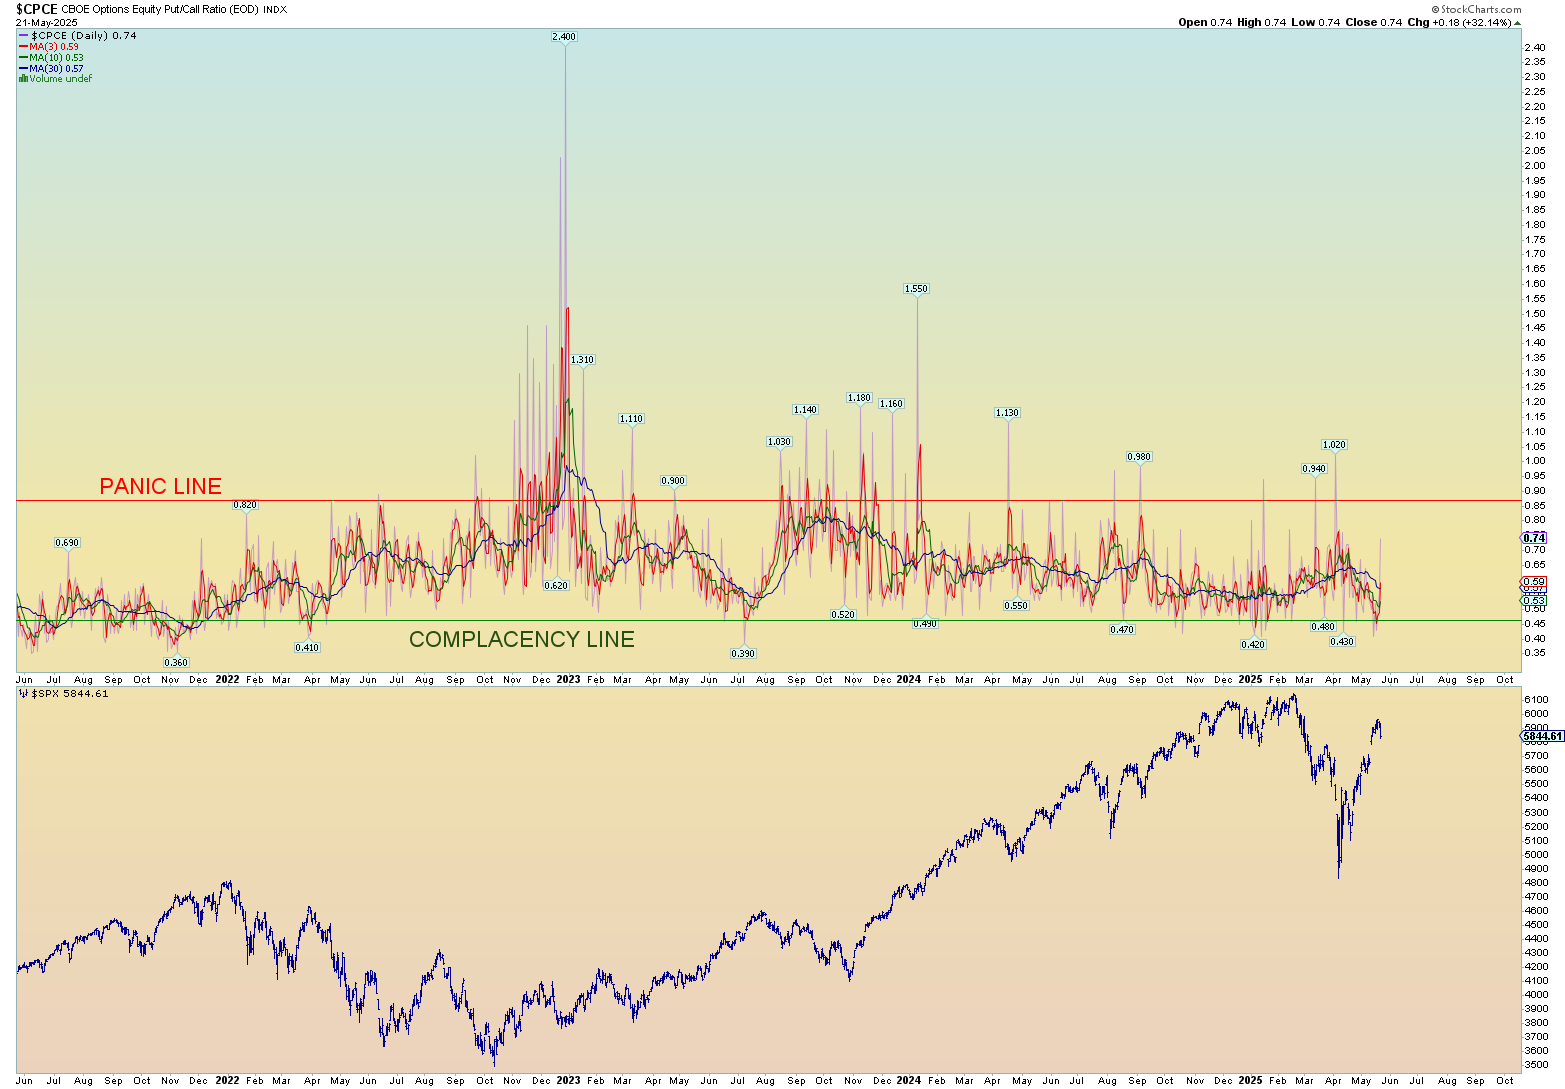
The CPCE reached extreme complacency levels on the 3 day and 10 day moving average. Again, I’d like to point out, there was no real panic in the April’s market downturn. It’s got to be concerning for the bulls that the positioning became so one-sided bullish again so quickly. Rising prices no matter the cause is of course inflationary.
The overall concerning thing for bulls, is interest rates are sticky high and seem to be headed higher after a long consolidation period along the yield curve. The world is bankrupt folks. People are living in a delusional global financial market propped up by Satan himself. It’s not “if” the time will come, but simply “when”. When will the global financial system self-implode? The tariff wars cannot be put back in the bottle. Consumers will pay the price for the tariff increases. Any dummy should know that.
Um, yes Virginia, there has been a long-term trend change! Duh!
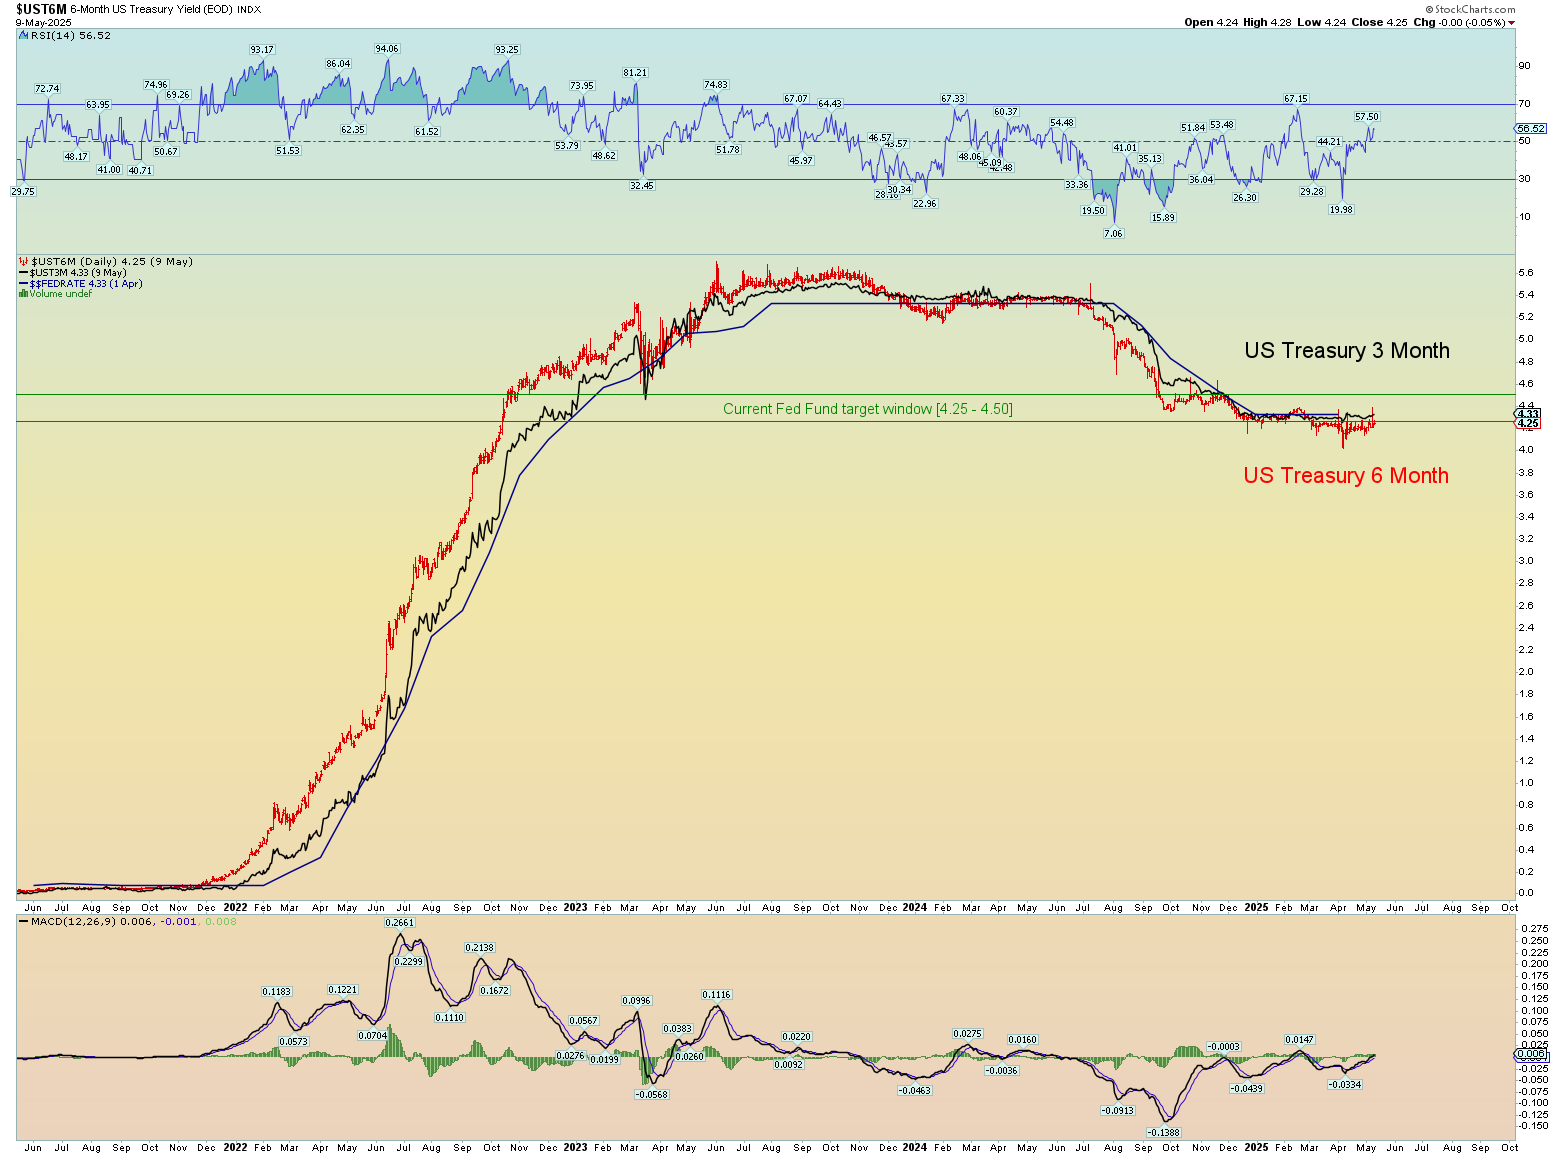
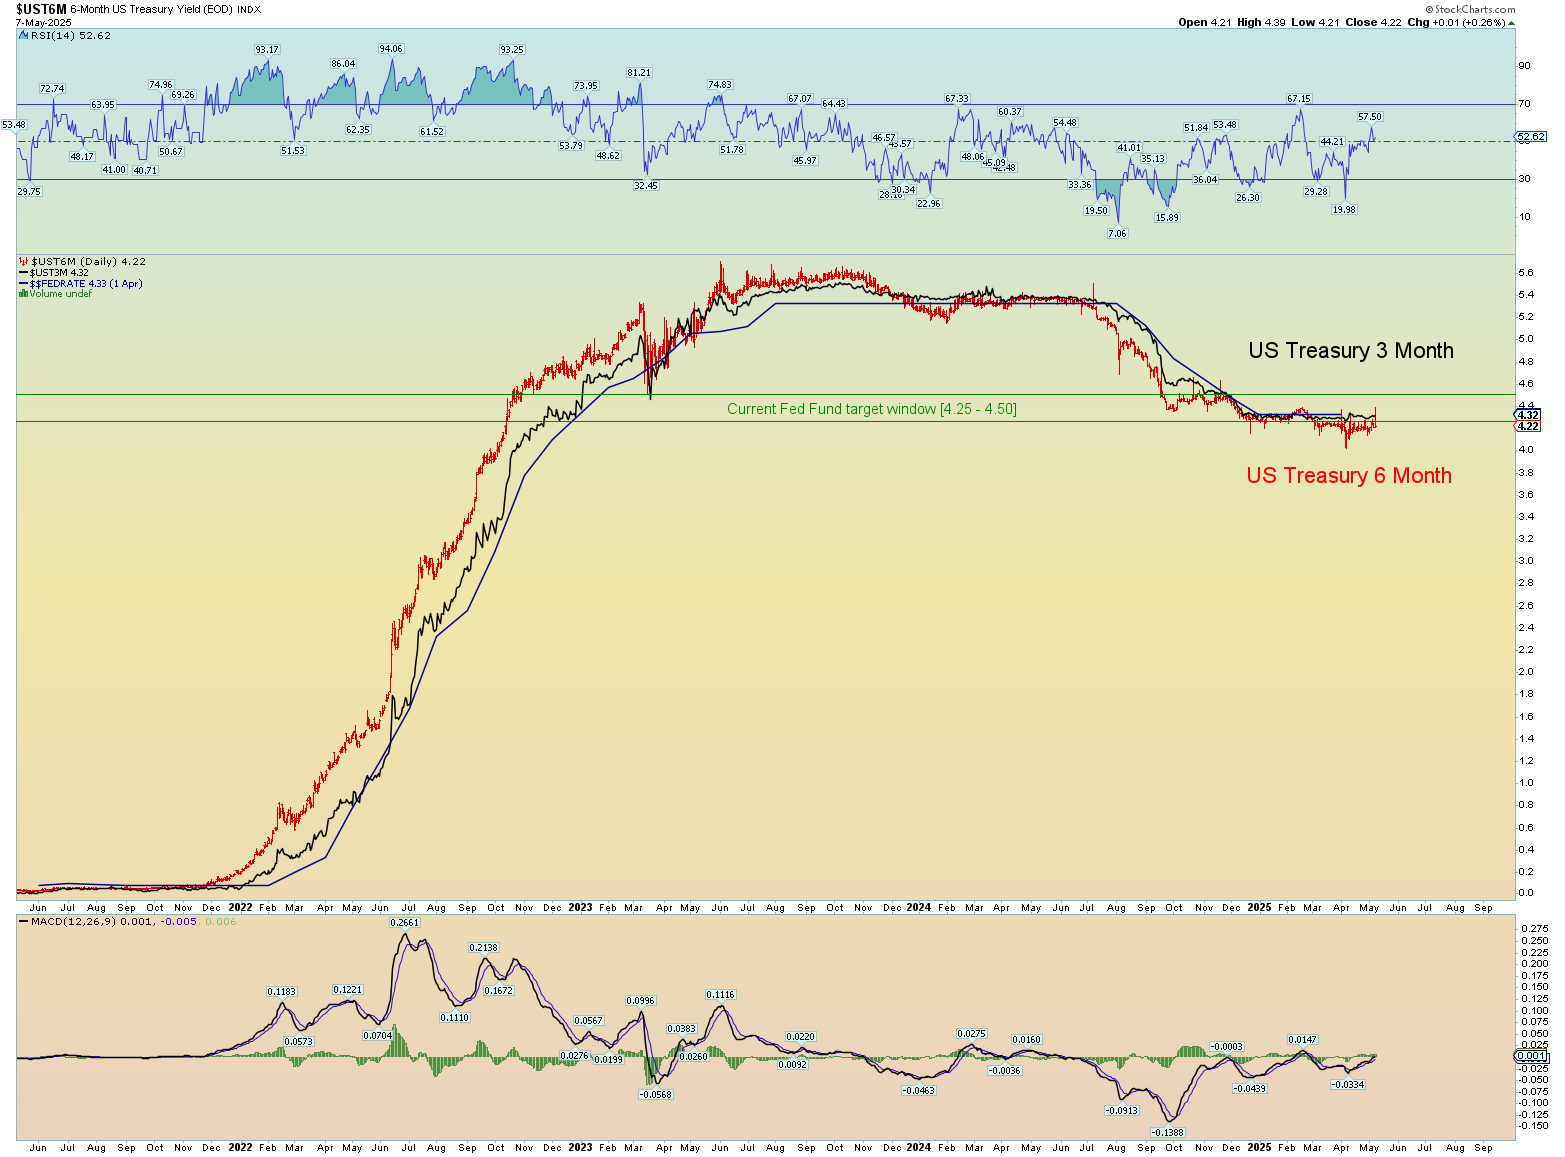
One key thing I’m looking for is if the 6-month yield flips higher and again begins to lead the 3 month also back higher. Look for a yield crossover.
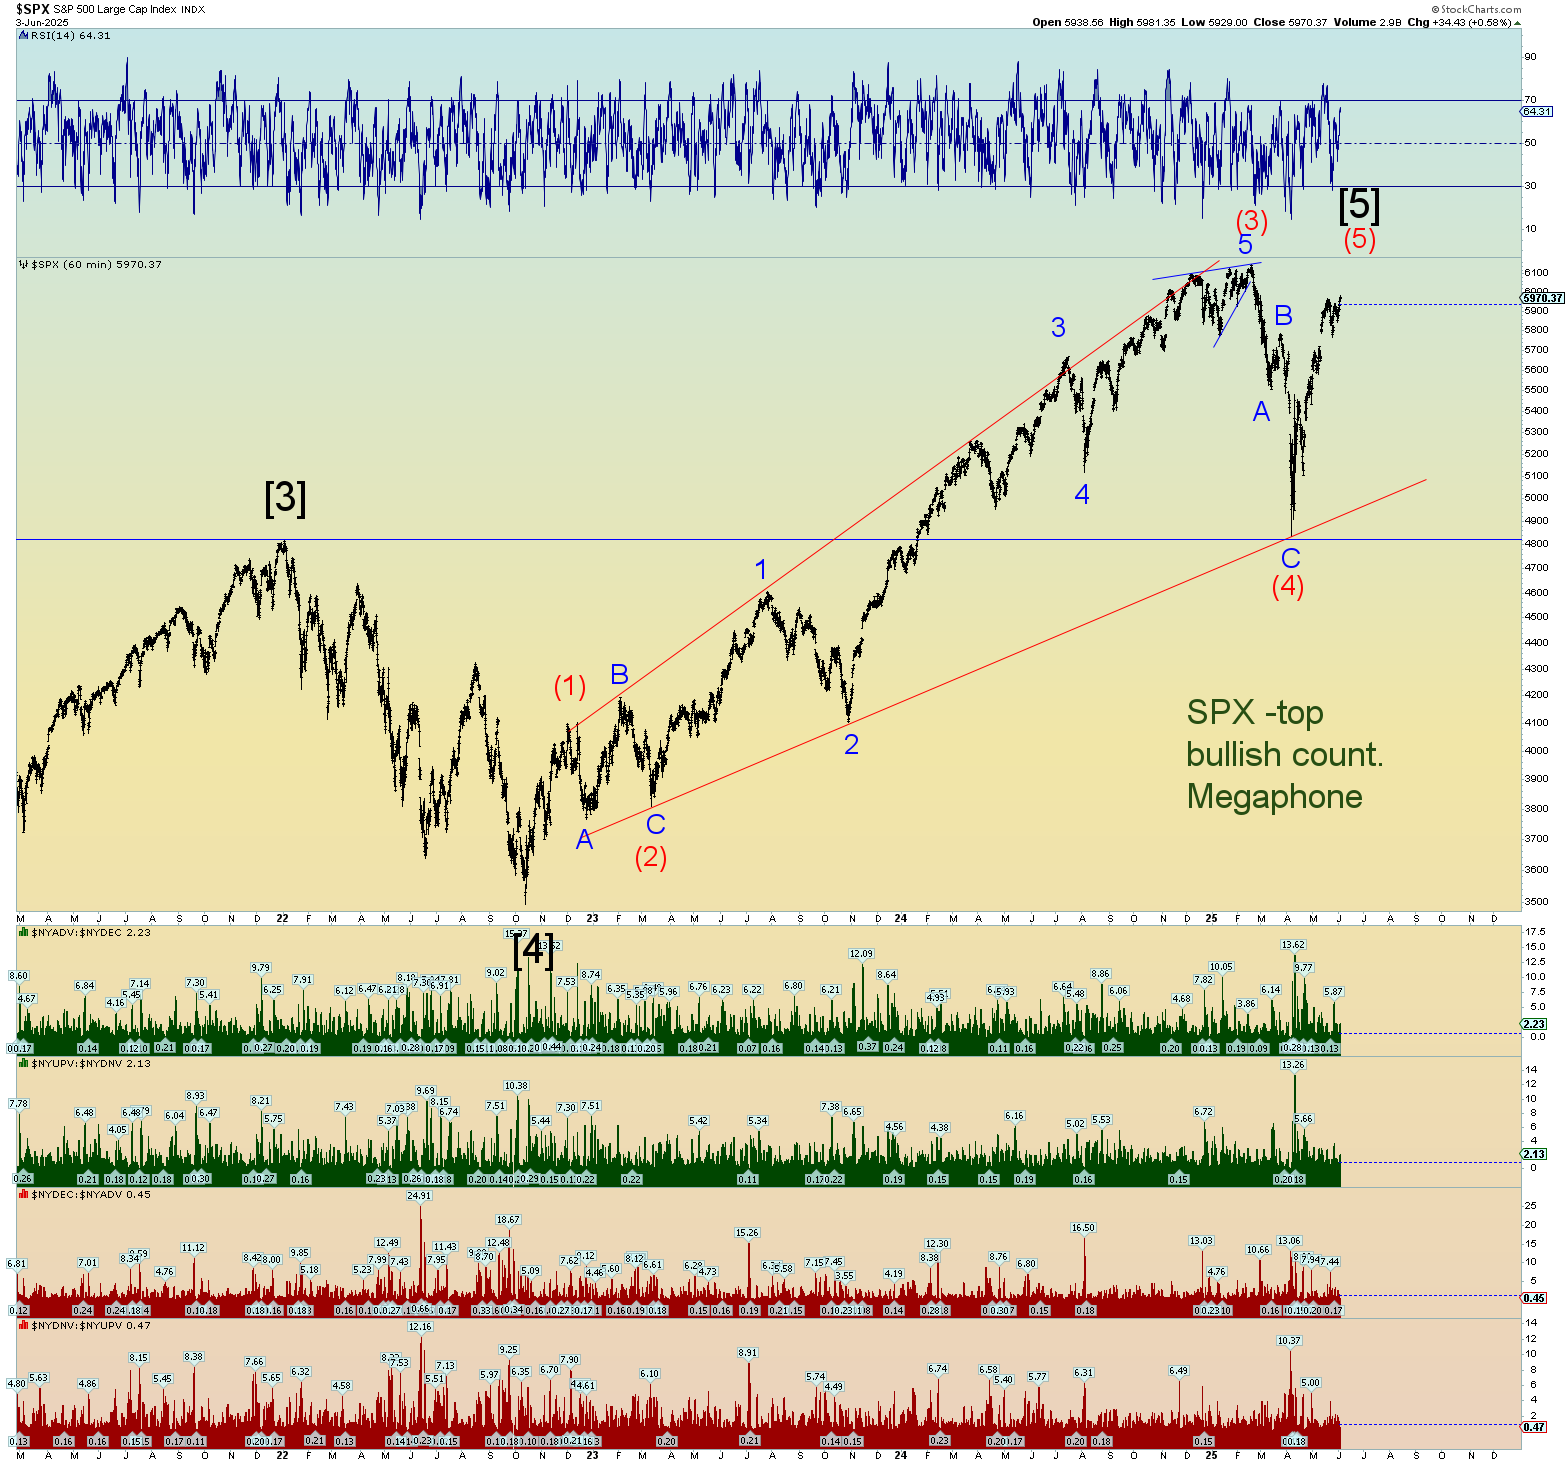
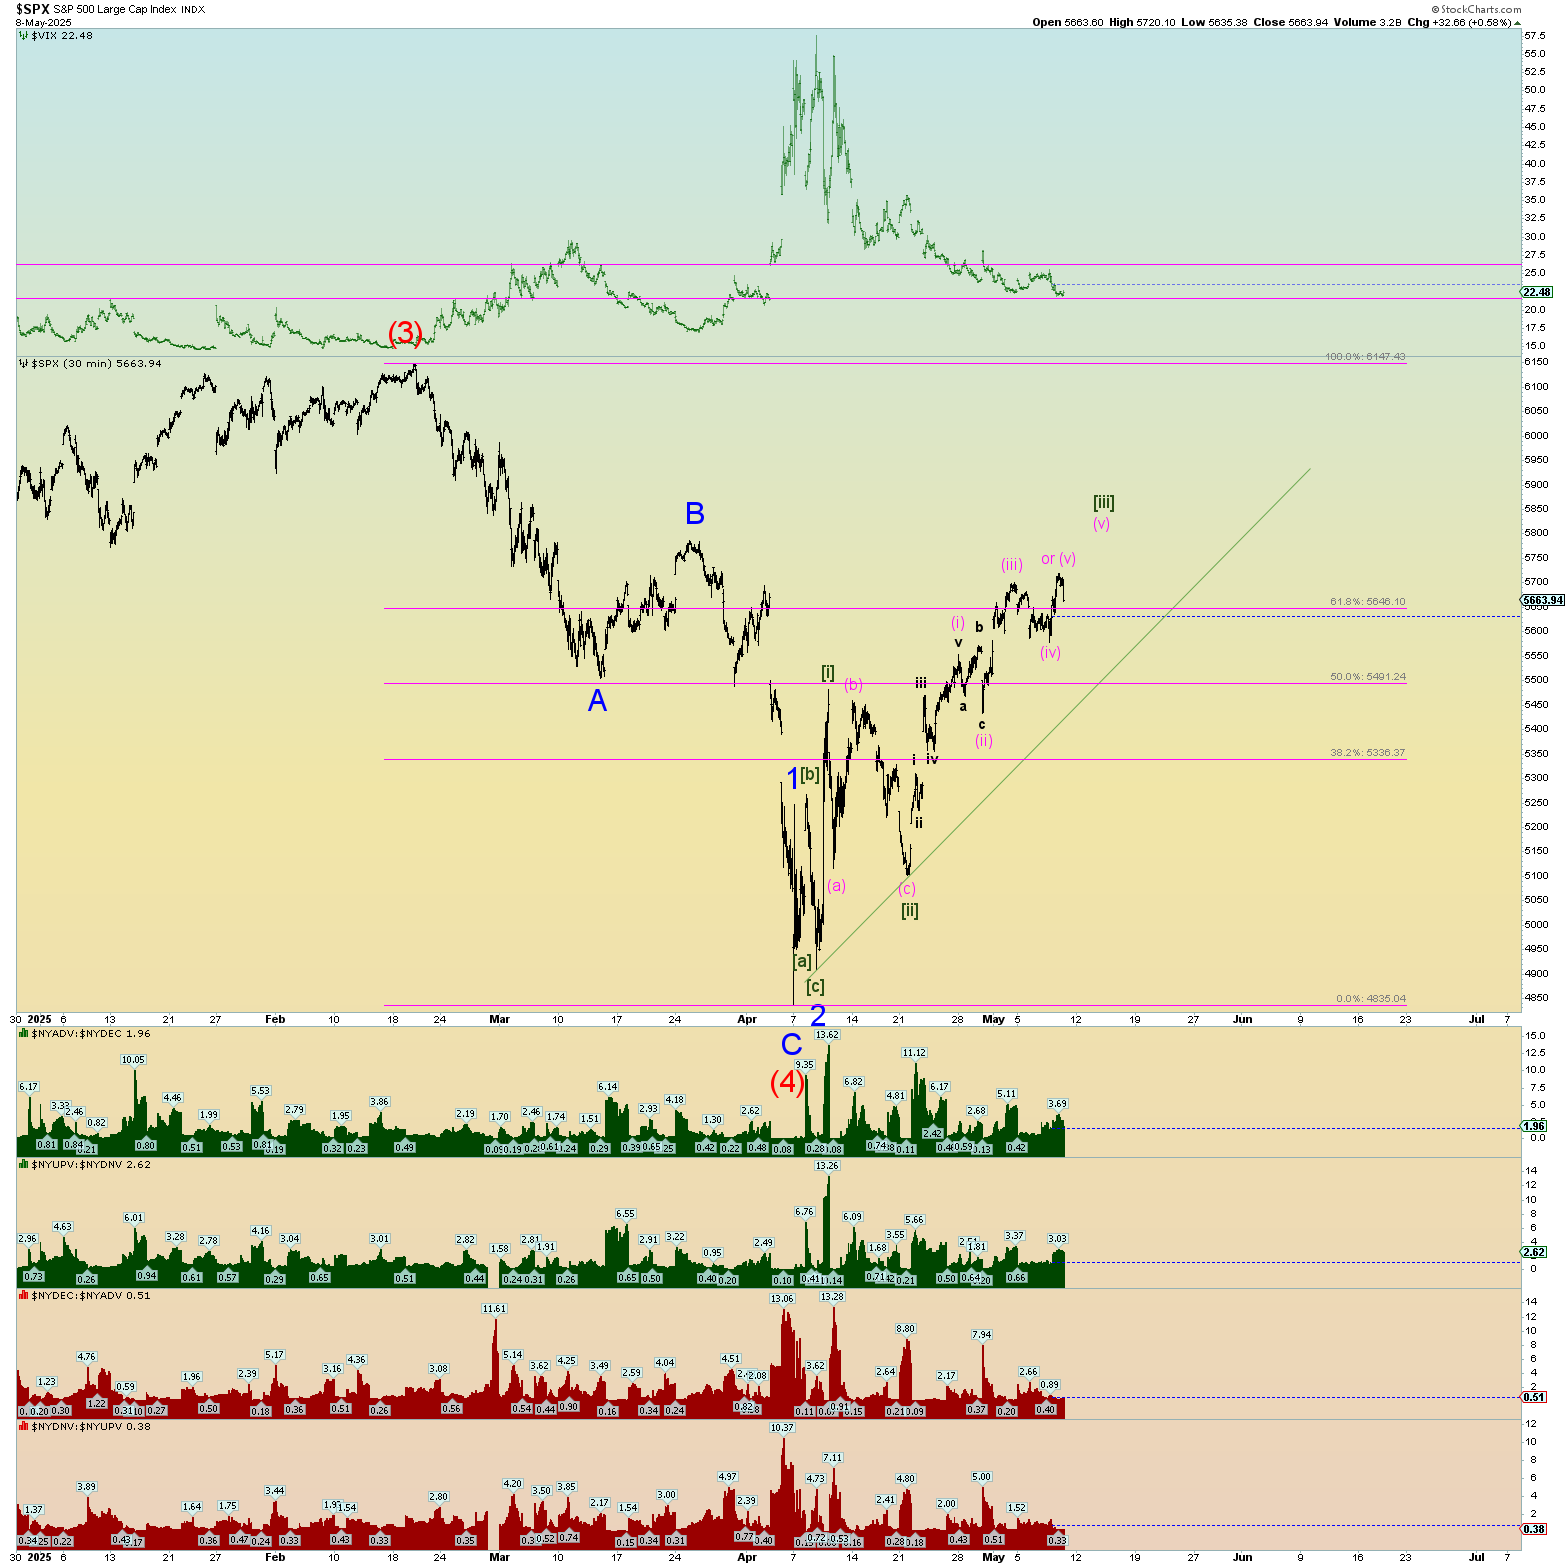
And for the hardcore bears who have endured this historic rally since the April low, I still have a chart that in my opinion, would be just fine. If correct, Wave (2) really has stretched itself and I would consider it over. Prices trying to jump back in the old uptrend channel is a typical stopping point and reversal.
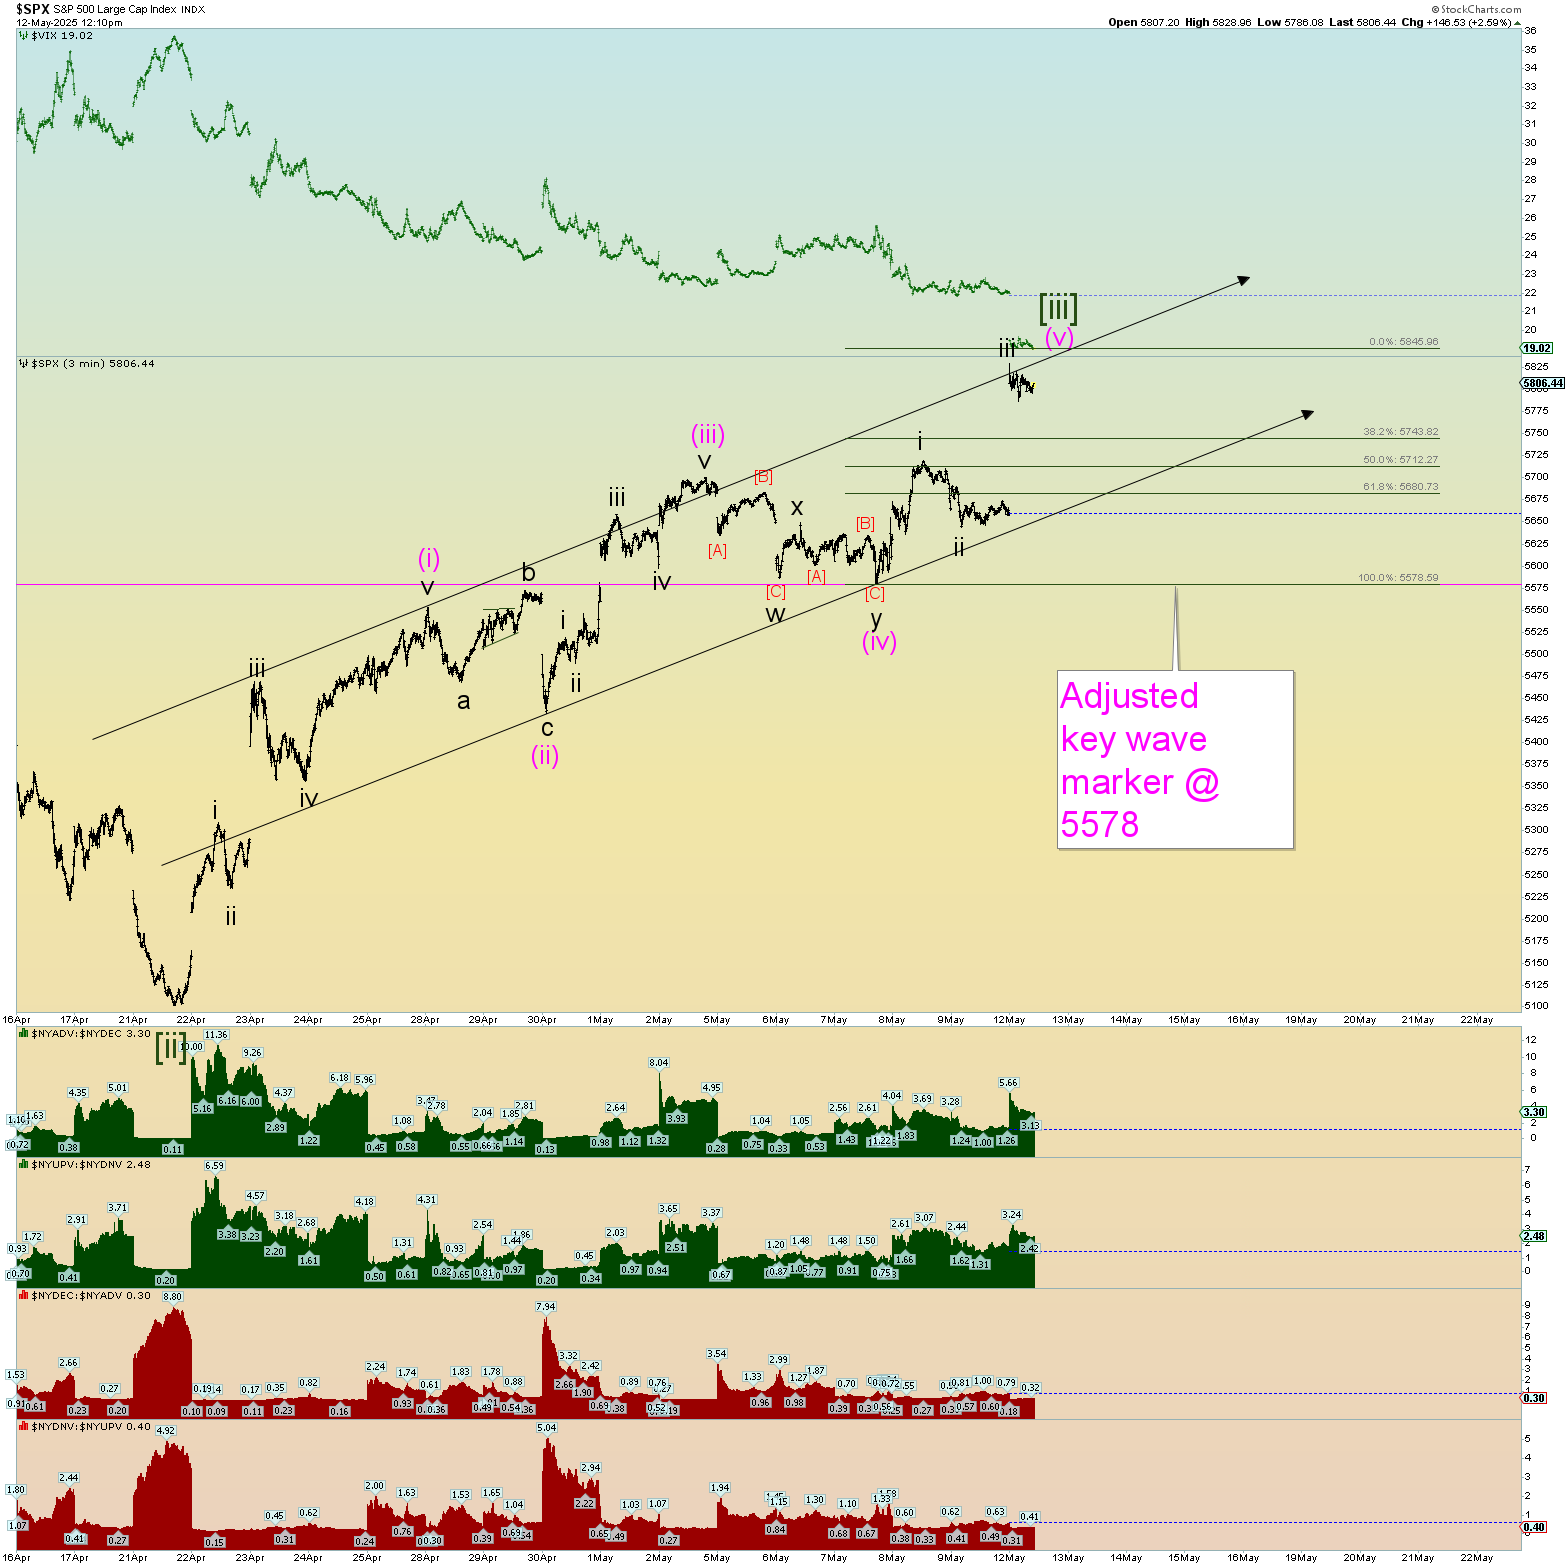
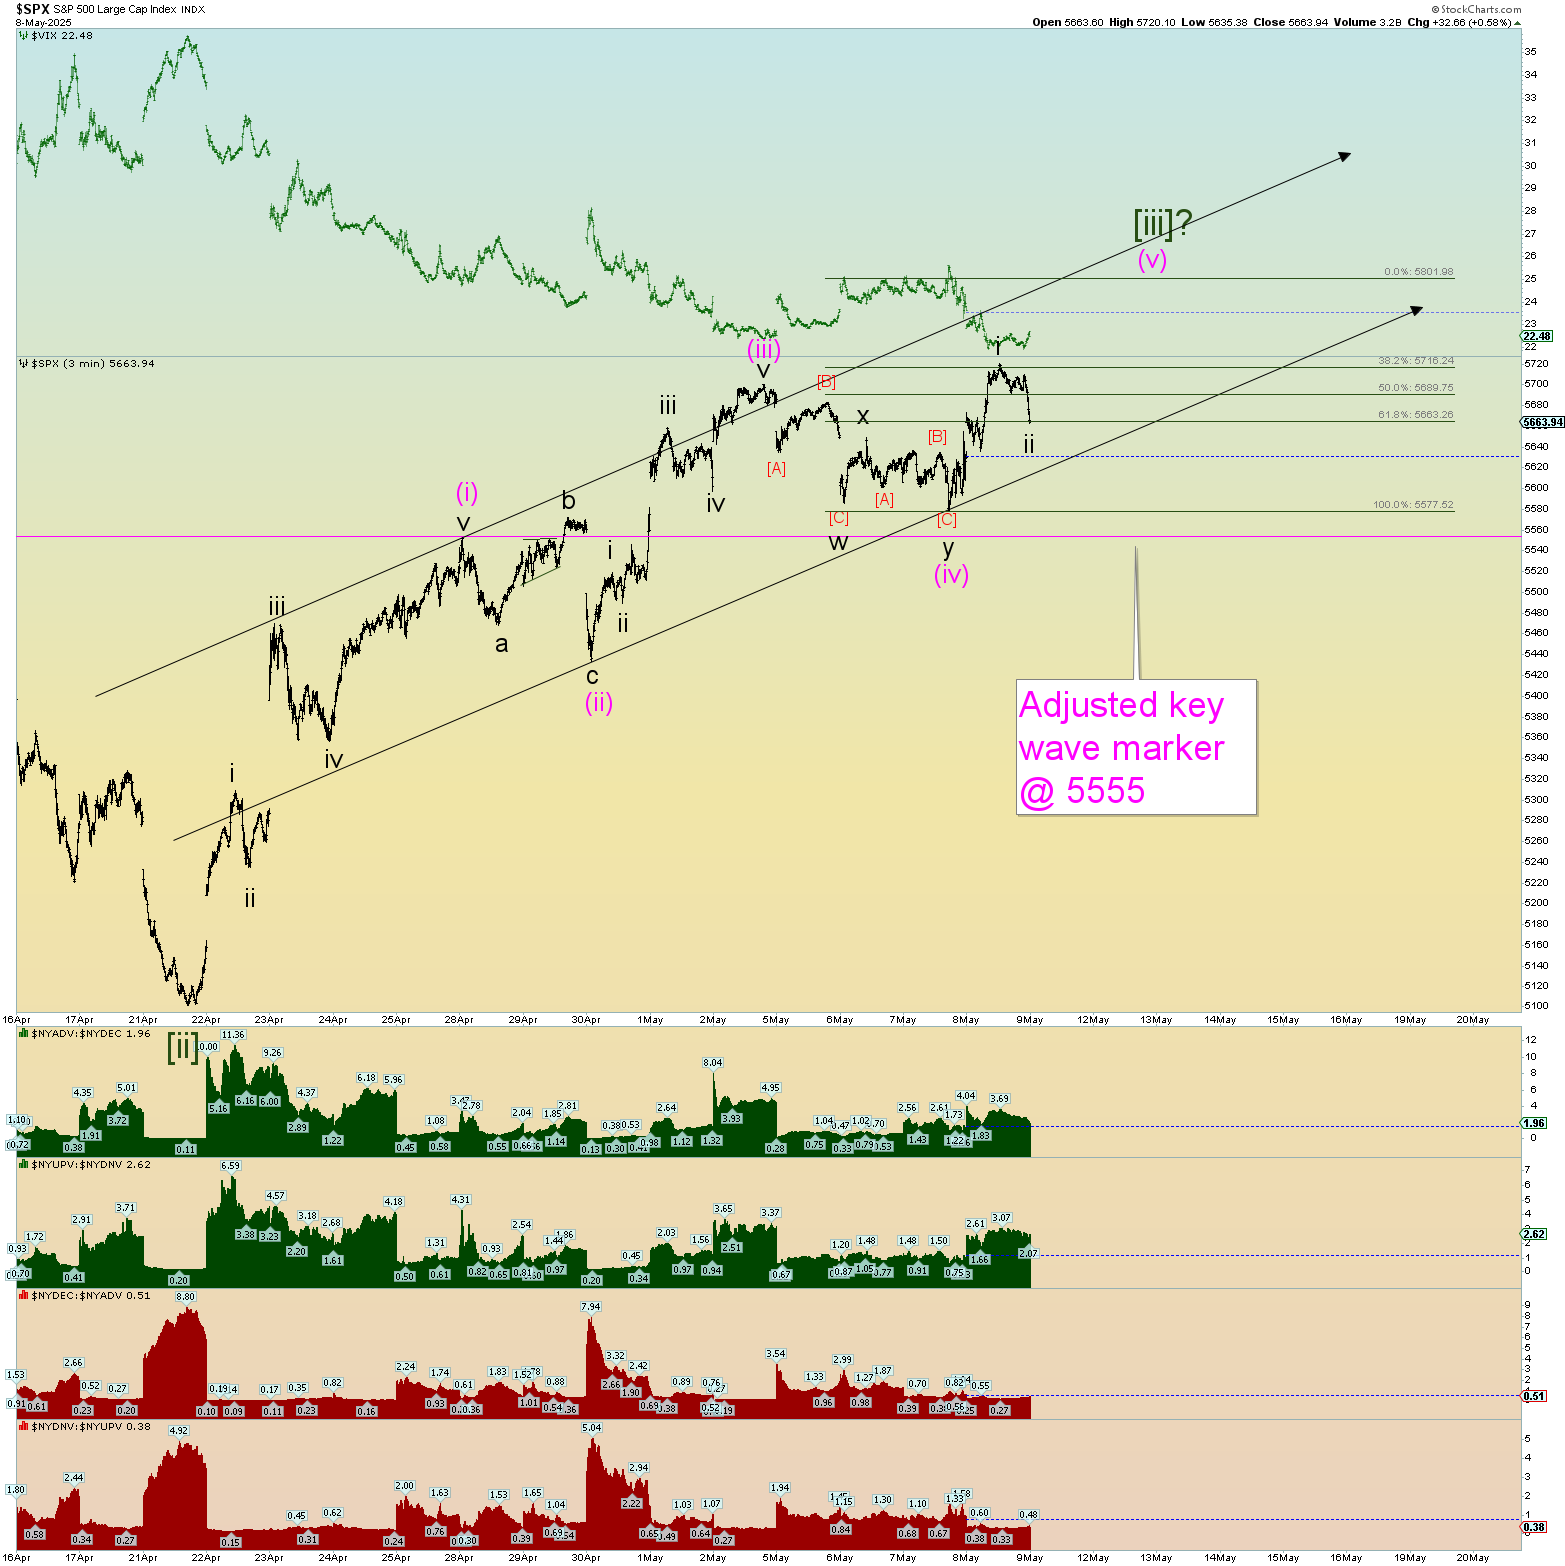
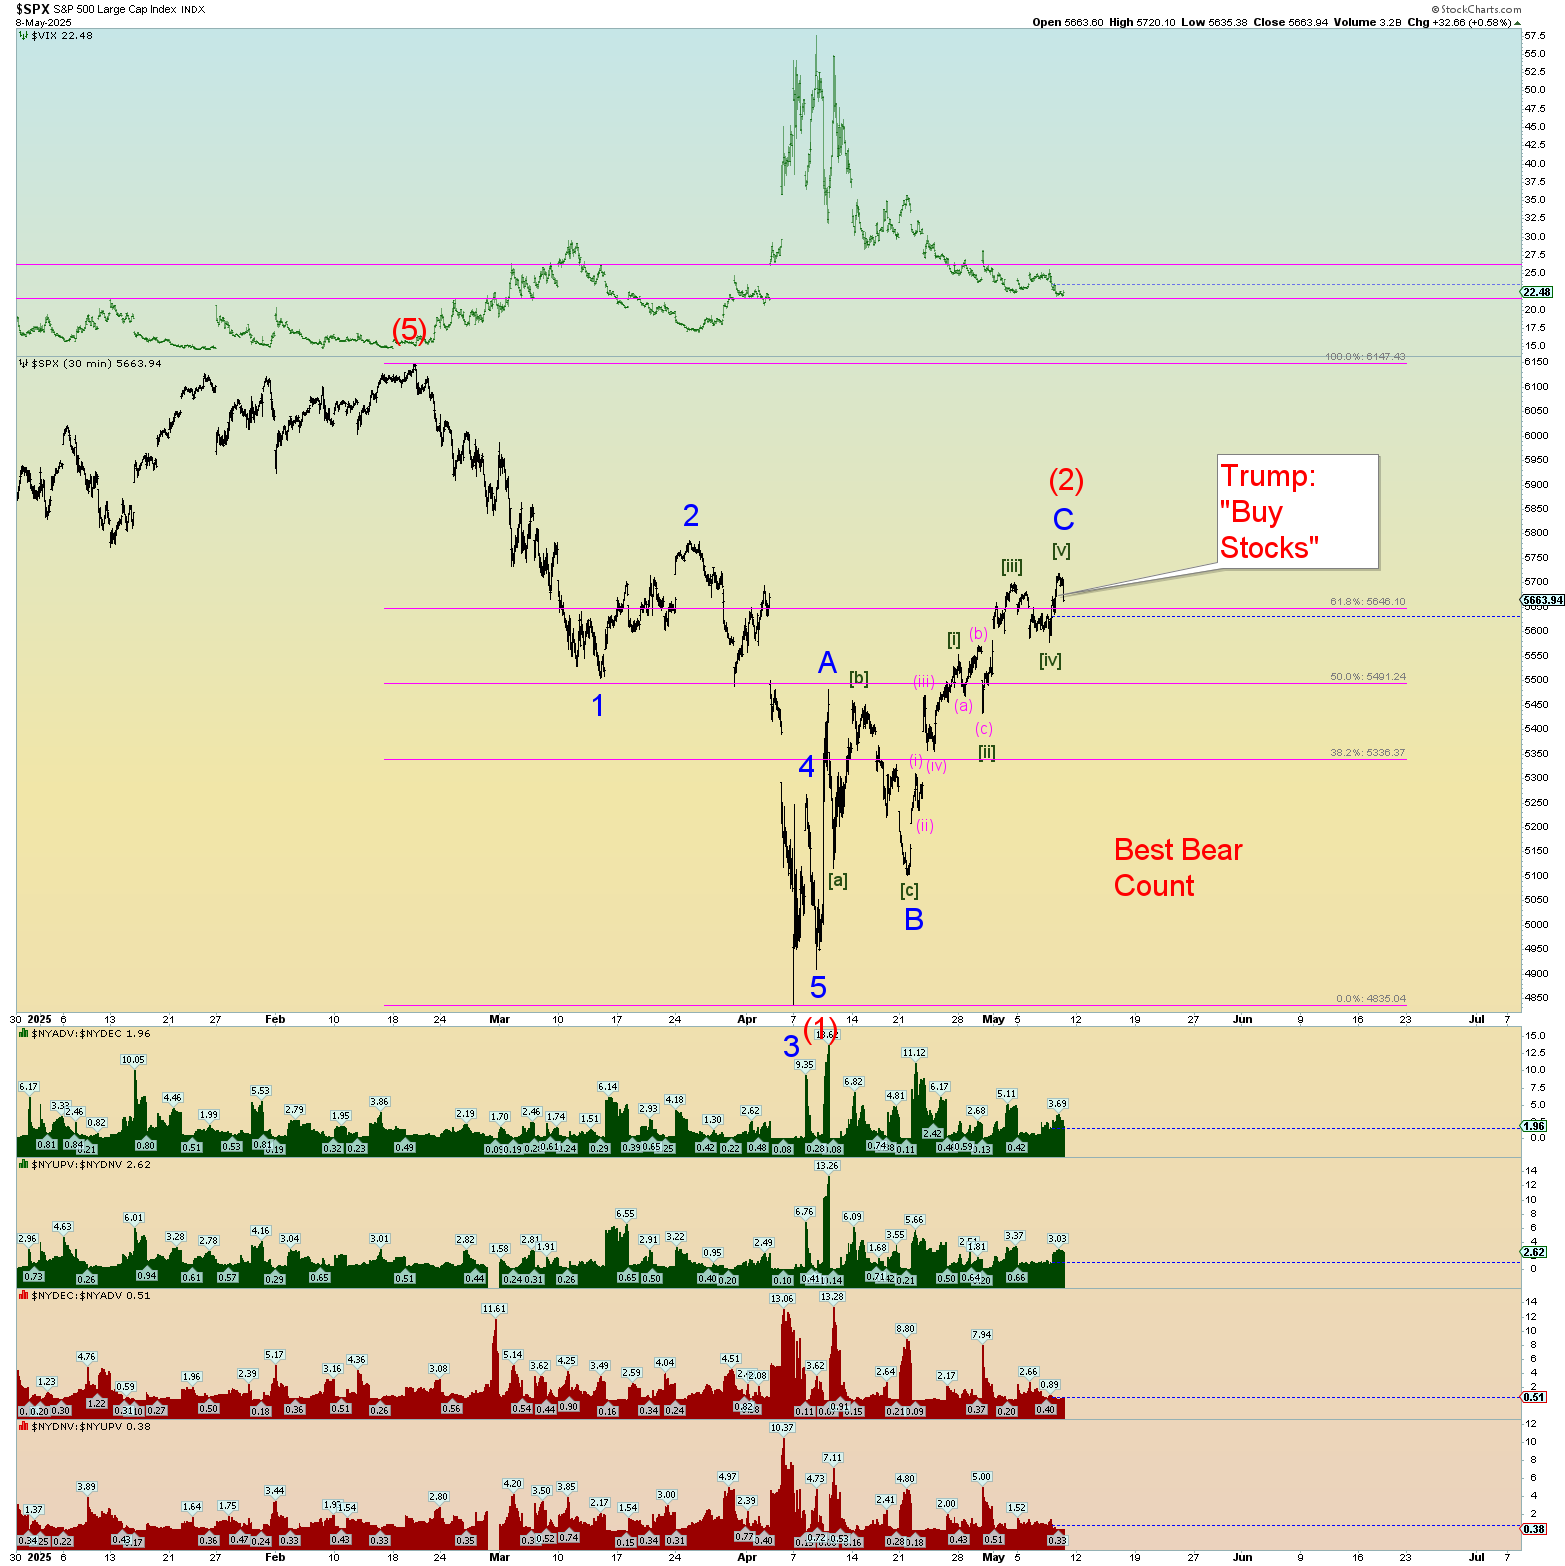
A price moves beneath 5650 would be a key wave marker. But thats still 200 points beneath.
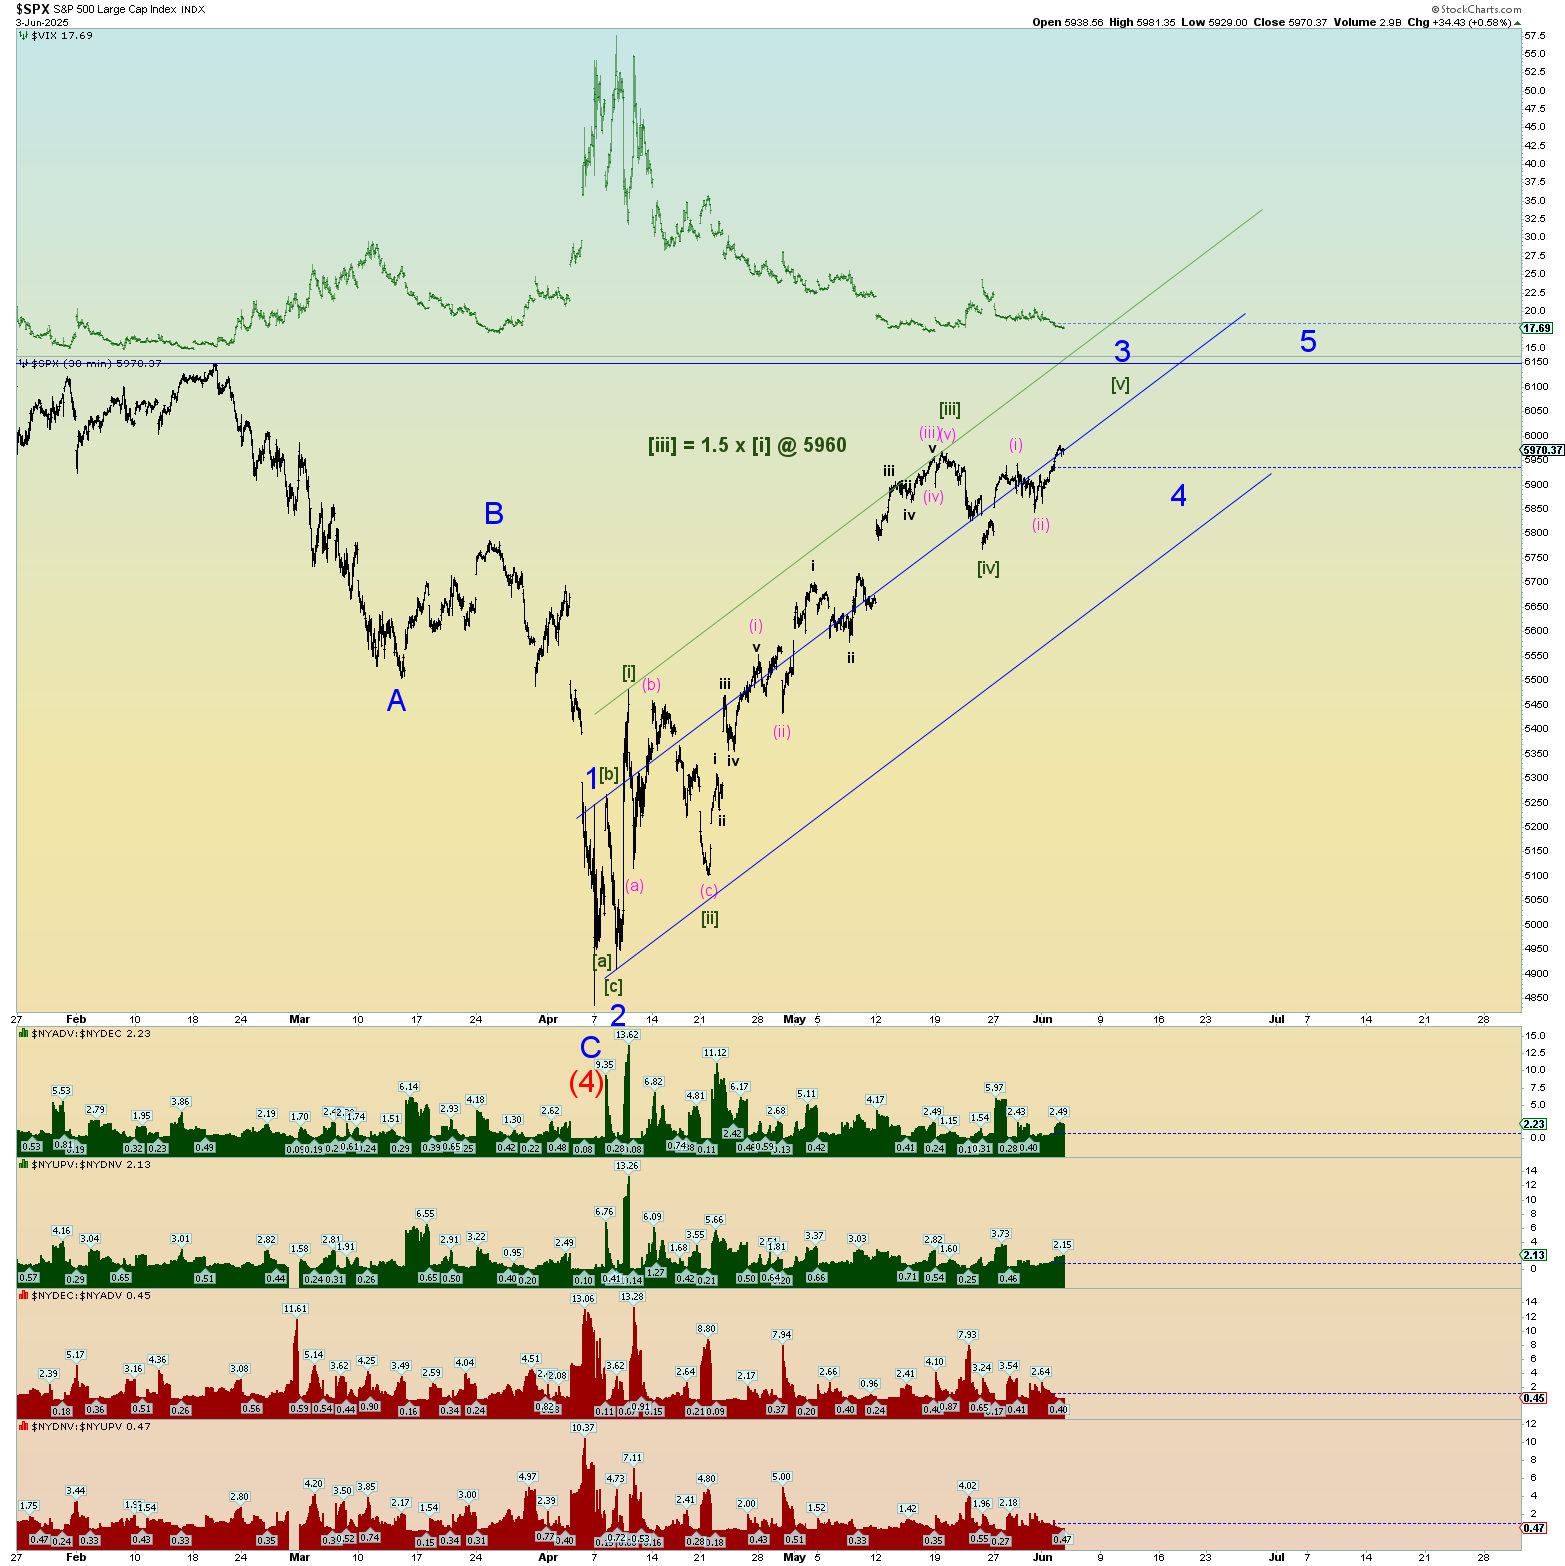
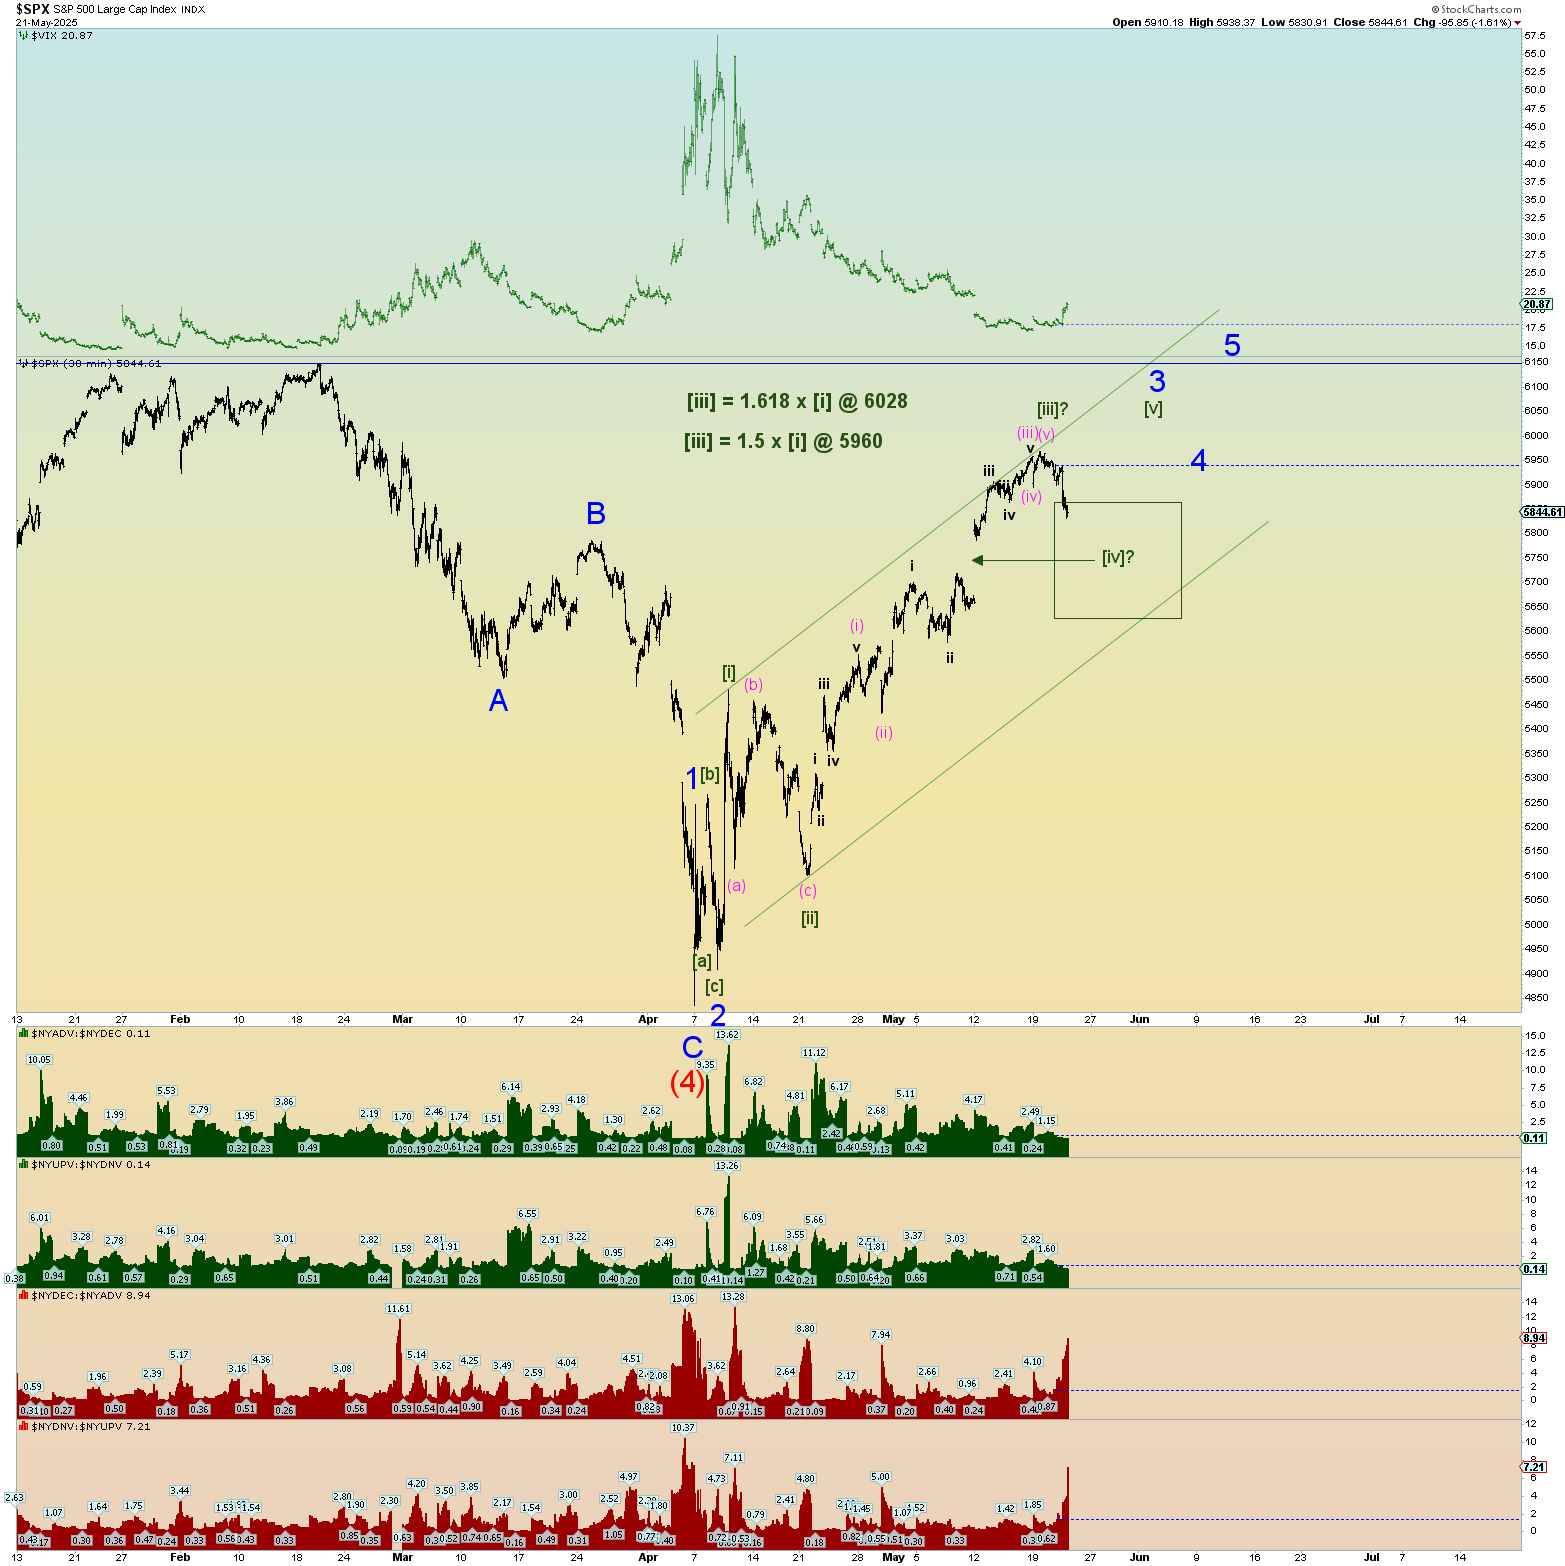
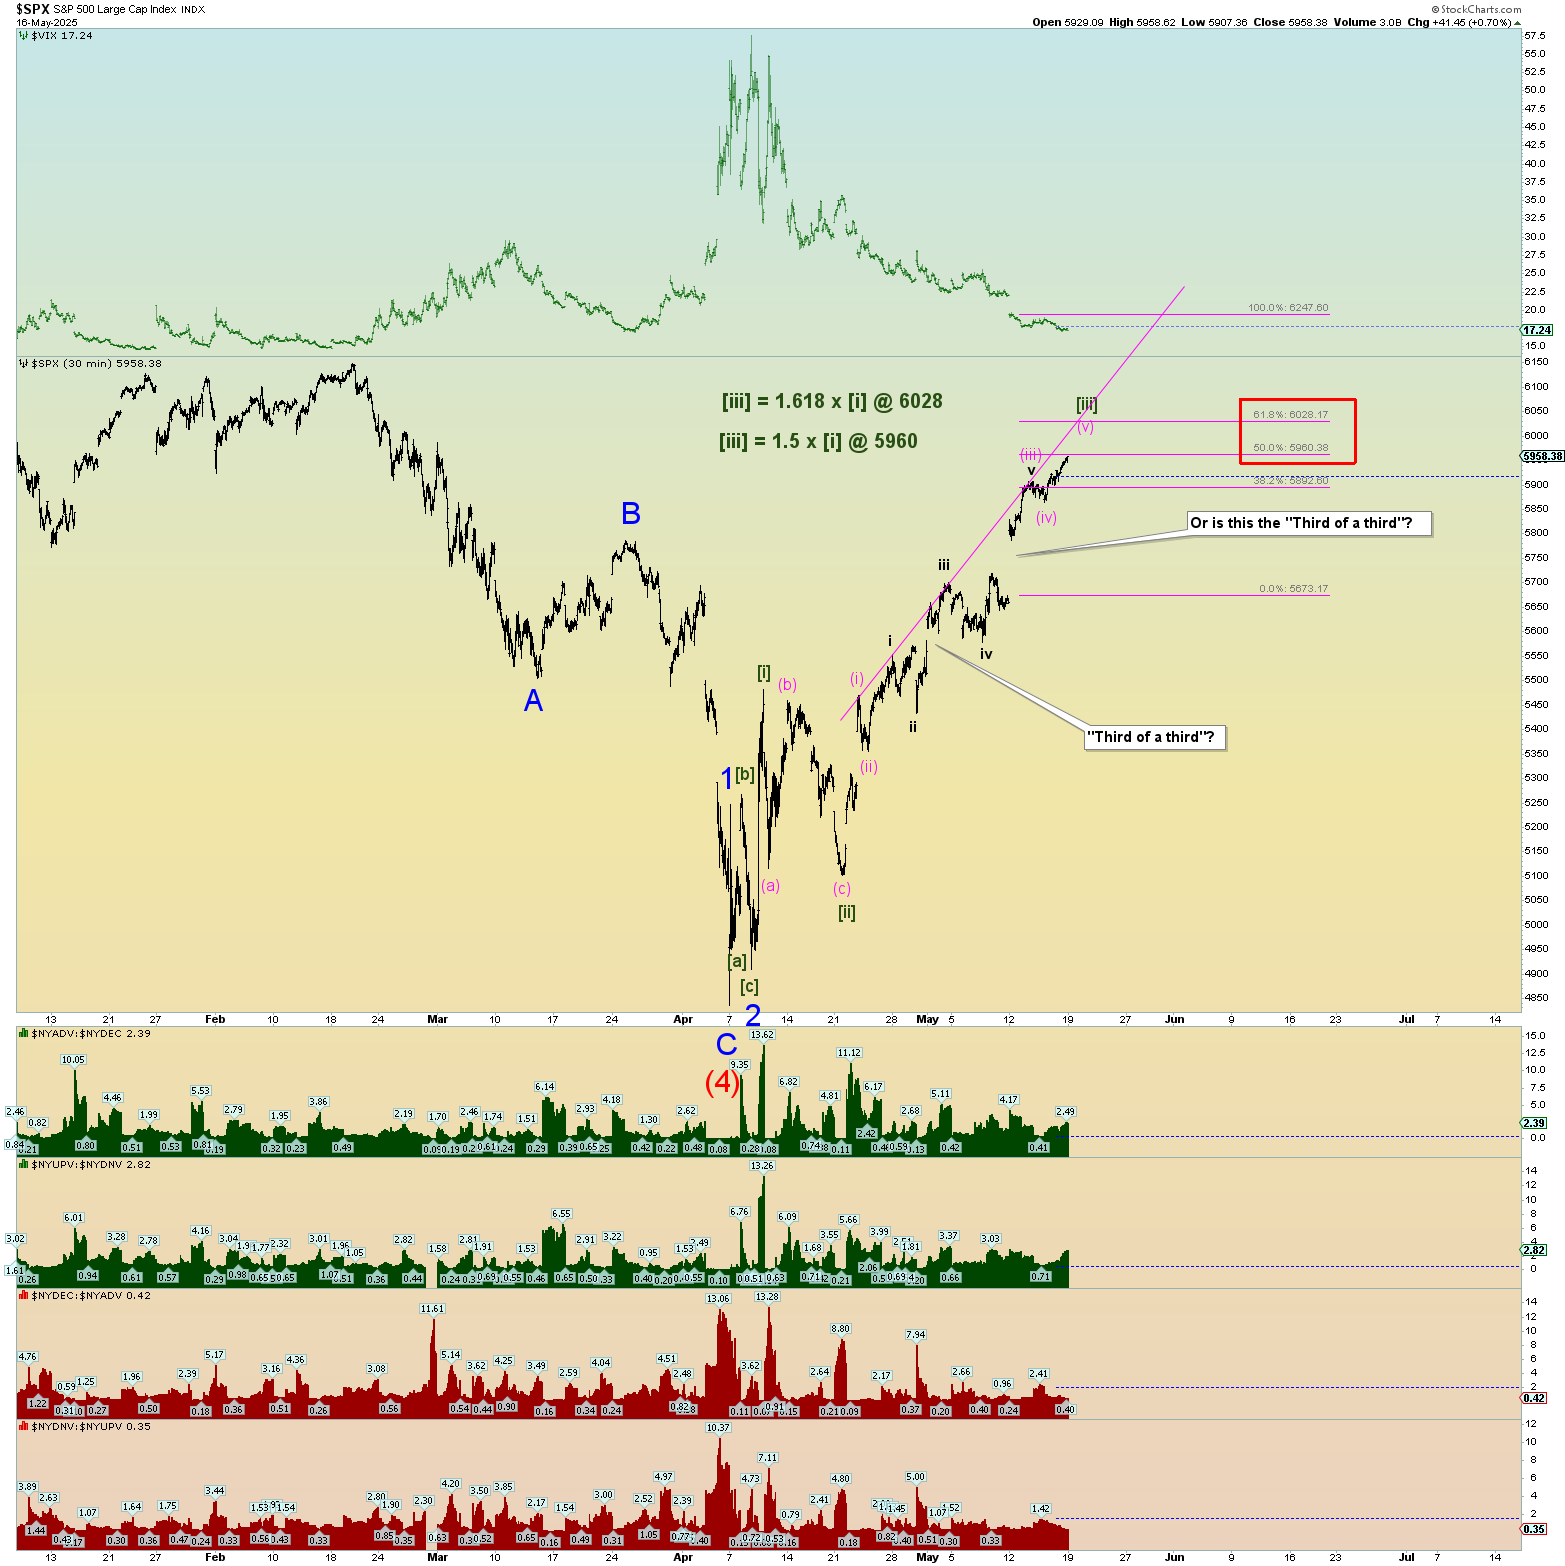
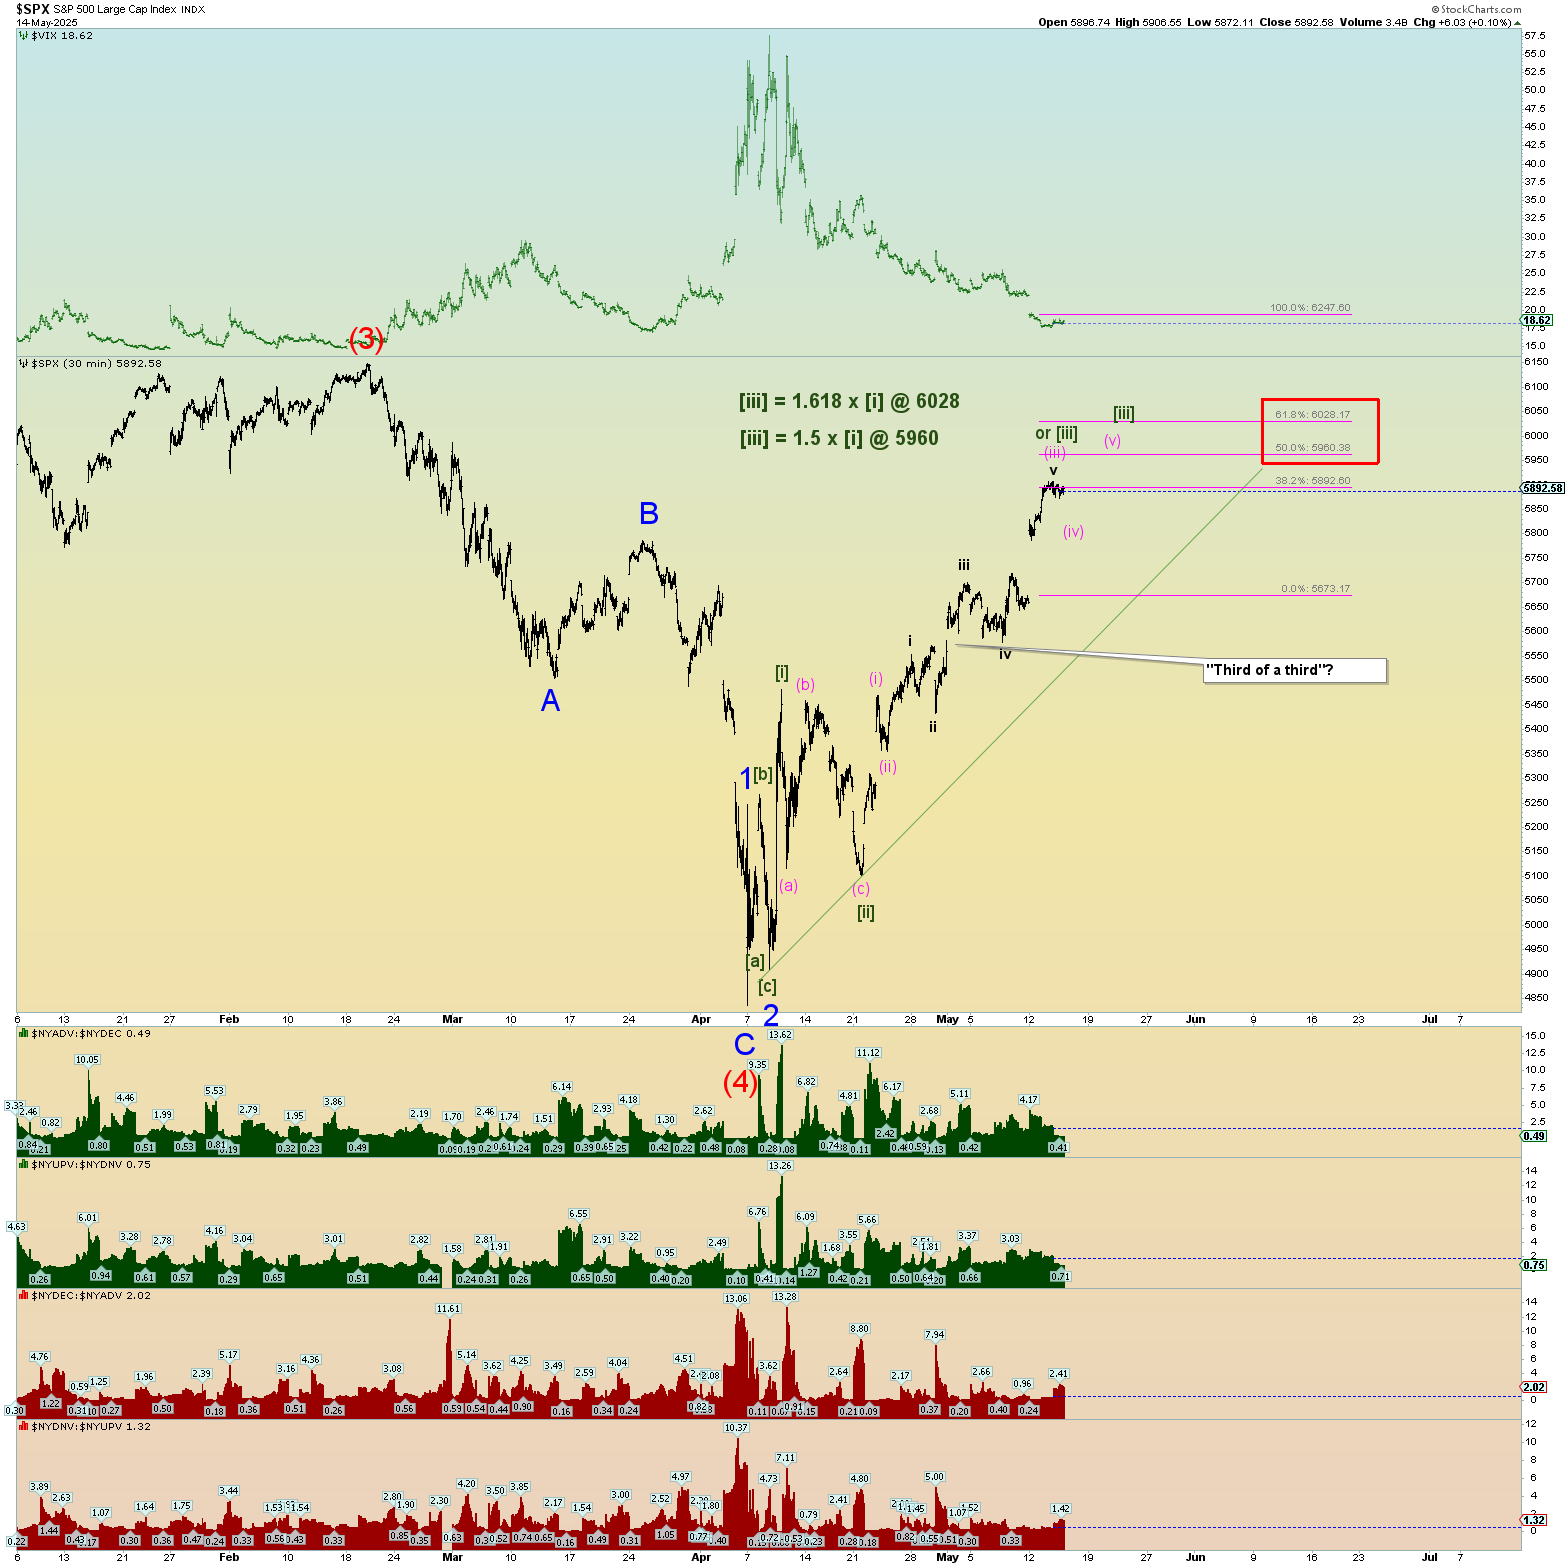
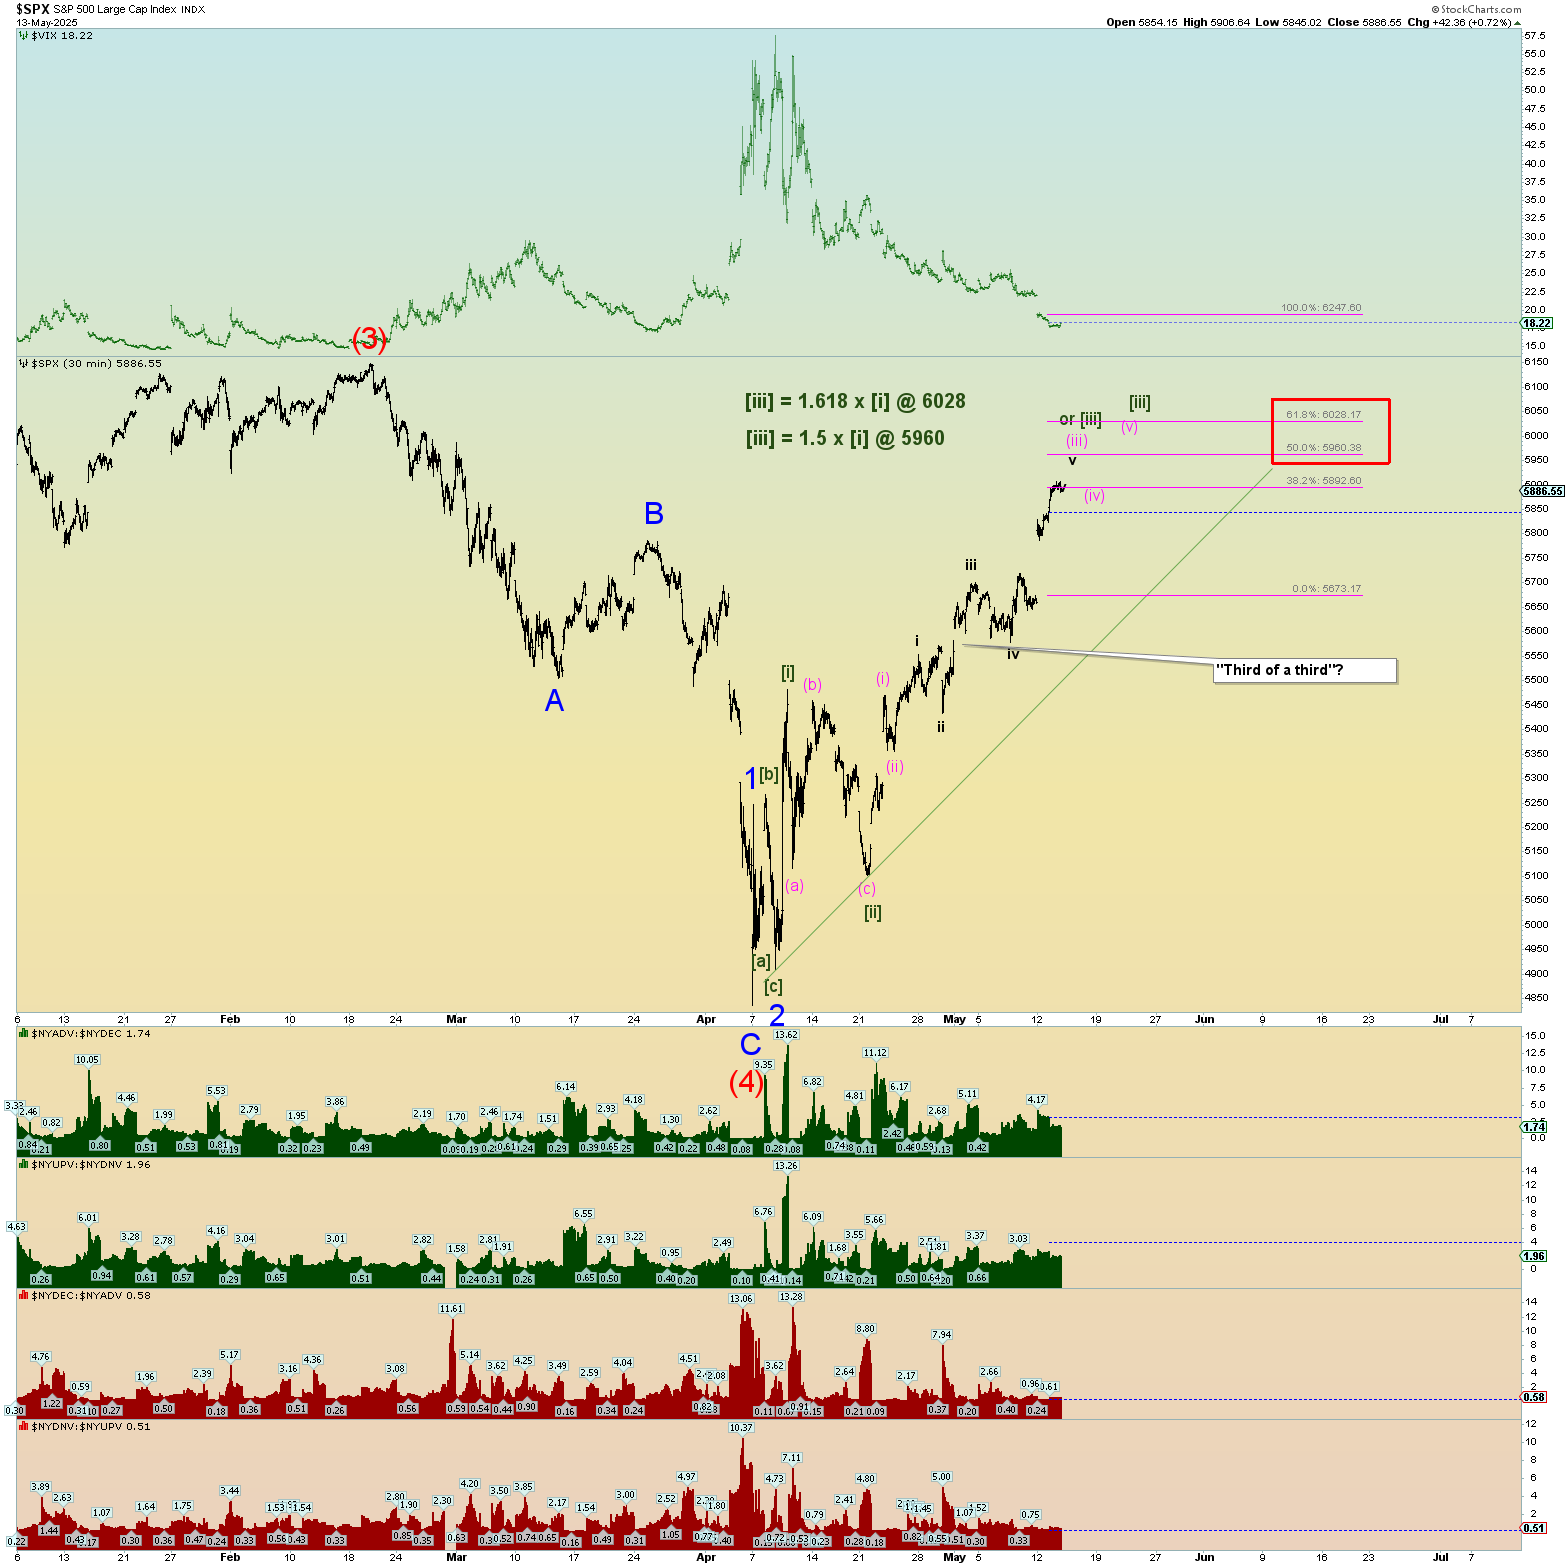
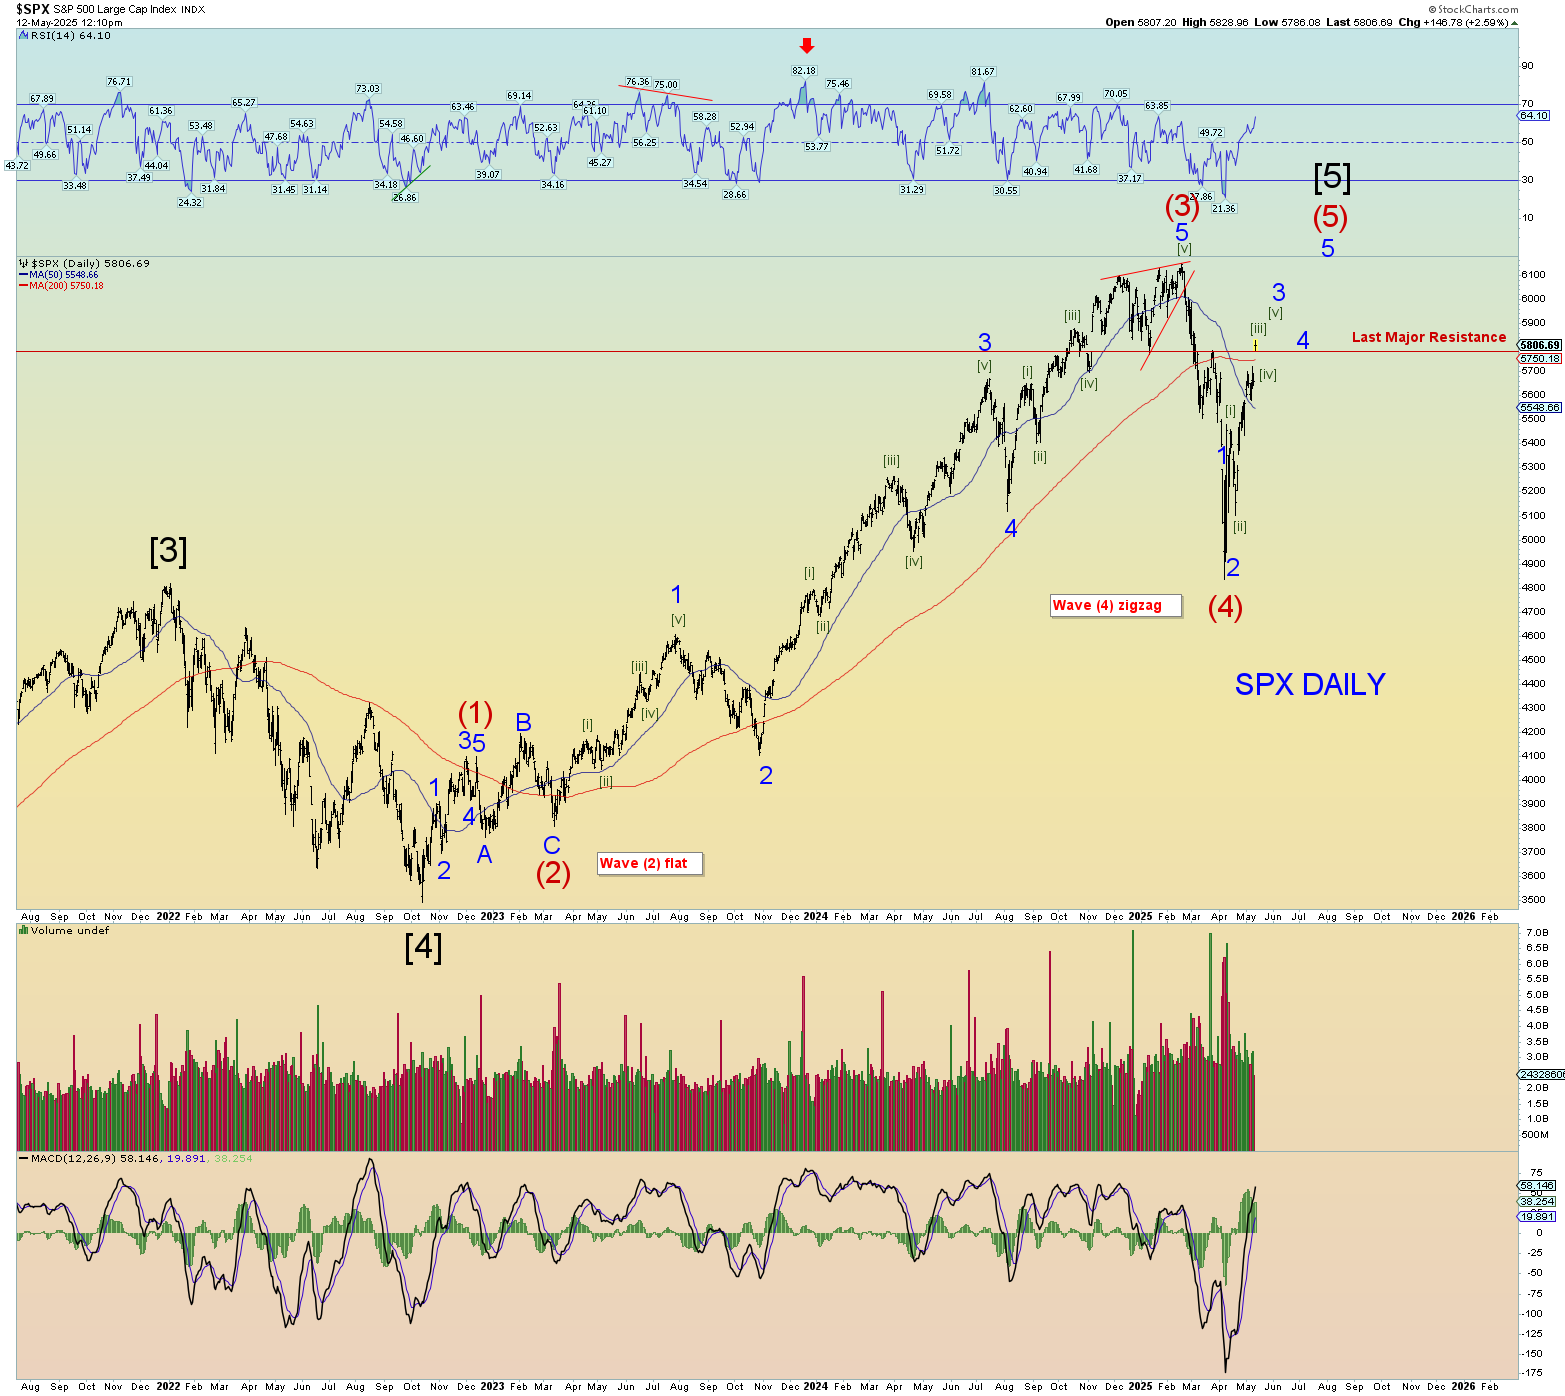
The SPX met the Minute wave [iii] x 1.5 of wave [i]. Obviously Minute [iii] can go higher. I gave two basic squiggle counts within the 2 charts:
But overall, from a bigger picture standpoint, we are looking for the top of Minute [iii] of 3. The next significant corrective wave will either be Minute [iv] of 3 or the higher level 4 of (5).
I guess the best way to look at the still powerful unfolding Minute [iii] of 3 is to see how much it expands in relationship to Minute [i]. An ideal spot would be a Fib ratio of 1.618 x Minute [i]’s wavelength. So far it has extended a bit beyond 1.38%.
The squiggles will work themselves in due time.
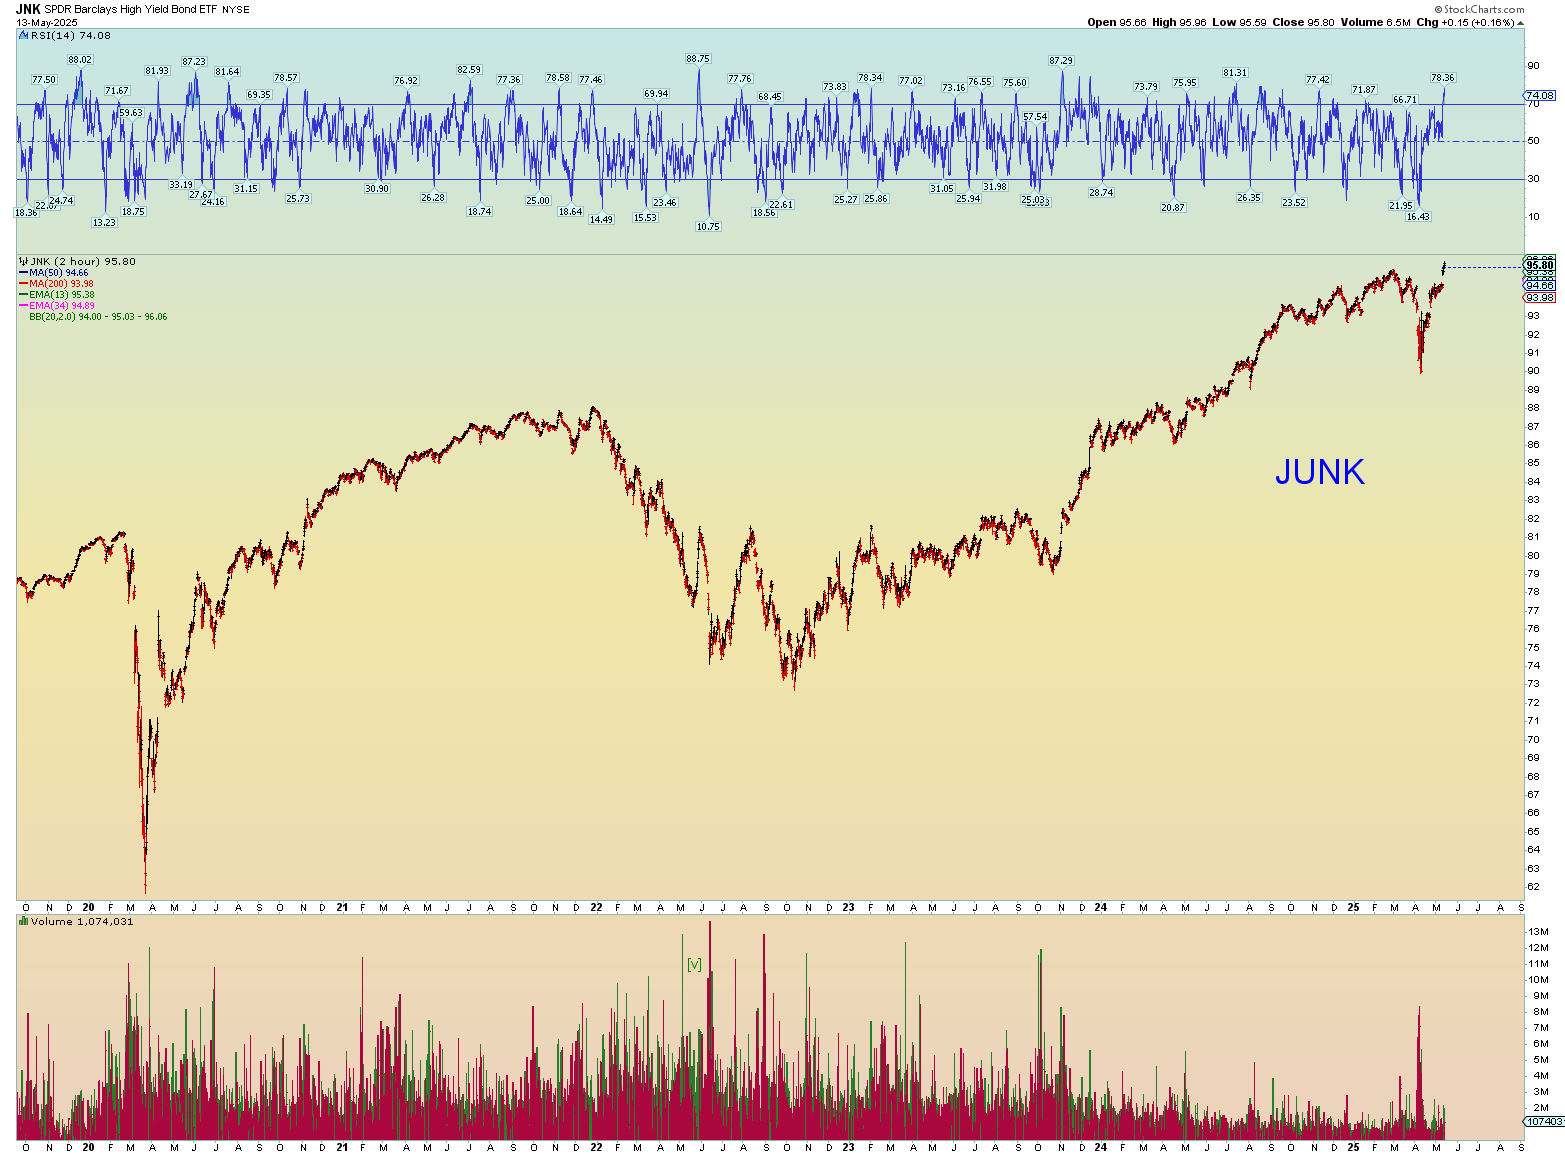
The Global DOW is near a new all-time high along with JUNK.
Again, if prices go above 5845, then the wave count I have labeled is not correct. Wave (iii) of [iii] cannot be the shortest wave. So far, the SPX has a 5841 high. So, we can still label it this way for now.
[Update 12:45 pm EST]
The pattern with the 10-year yields is a long-winded contracting triangle with breakout upside outlook. Today may be the beginning surge and then the talk will all be about interest and mortgage rates surging. Which is of course unsustainable for the economy, the consumer and our debt-laden governments at all levels.
And the short-term rates are holding steady. Powell cannot lower rates if the market tells him not to. The FED must set the short-term rate to what the market signals (best seen through the lens of the combined 3- and 6-month yields) otherwise interest rate distortion occurs which would be bad for the Fed which after all, is a private bank.
[Update 12:25 pm EST]
The market is making an interesting wedge pattern with “overthrow” at the top. Although this is not the primary count, I have to show it, nonetheless because if it is correct the collapse will be very, very swift back down through the bottom wedge line in total exhaustion. Today’s euphoric gap up and all is wonderful with the world is kind of overdone, don’t ya think?
So, the pattern is interesting but if no quick follow-through crashing through the downside, then it is not a true rising bearish wedge.
Prices gapped right over the last major resistance. I think prices will still struggle here and today’s massive gap up will close in Minute wave [iv] of 3.
Wave (iii) of [iii] cannot be the shortest wave. So, Minute [iii]’s top price must come in under about 5845. The adjusted key wave marker has been raised a bit from 5555 to 5578.
The market confirmed the short-term wave count with a higher recovery high today.
Today might have been the top of Minute [iii], but it could just be the first subwave of (v) of [iii]. I prefer it to be the first subwave as wave (v) of [iii] needs to stretch out a bit perhaps.
The best bear count is a truncated (1) down and an A-B-C up. If this is the count, then today would be a good stopping point, and all waves are minimally in place to consider the count complete. We may have got a “top tick” moment with Trump saying to buy stocks. Just a thought. It’s not the primary count but the VIX is still quite elevated. Any sharp price move below 5555 is concerning for bulls.
The Fed didn’t lower rates because the market has yet to signal lower rates. The market leads (Specifically the 3- and 6-month yield) and the Fed follows. That’s the way it has always worked.