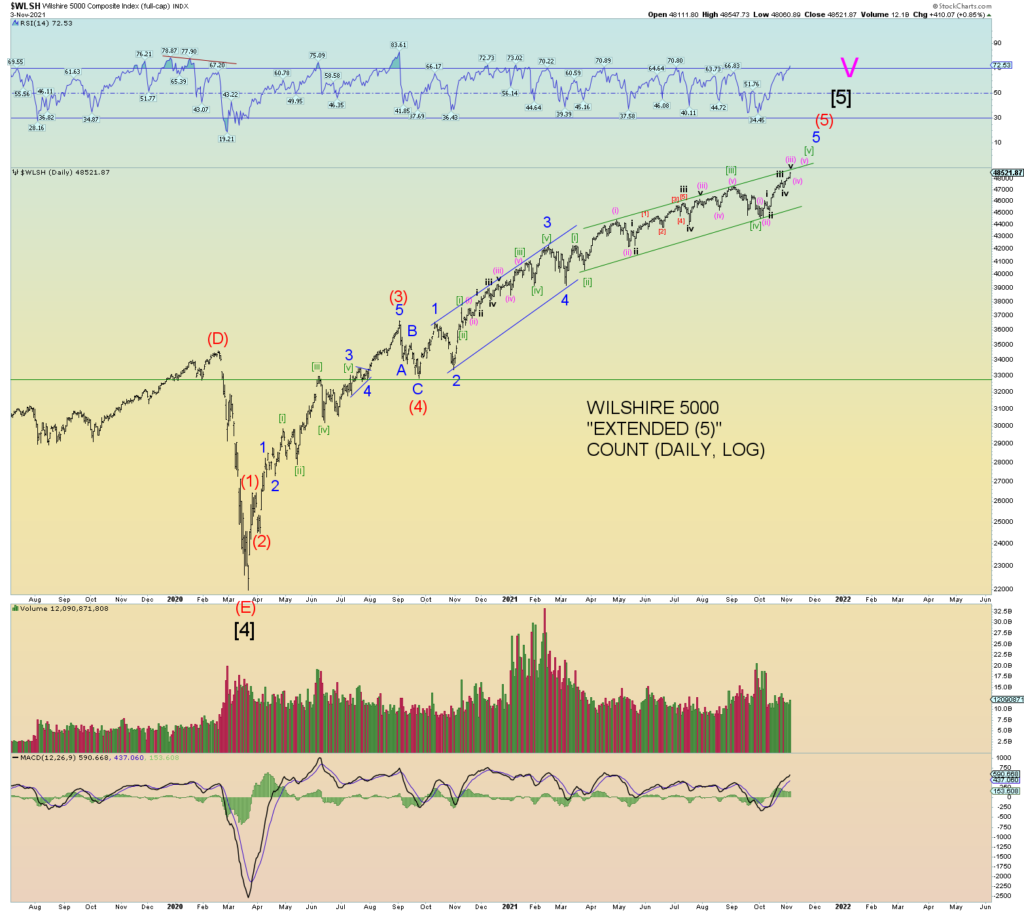
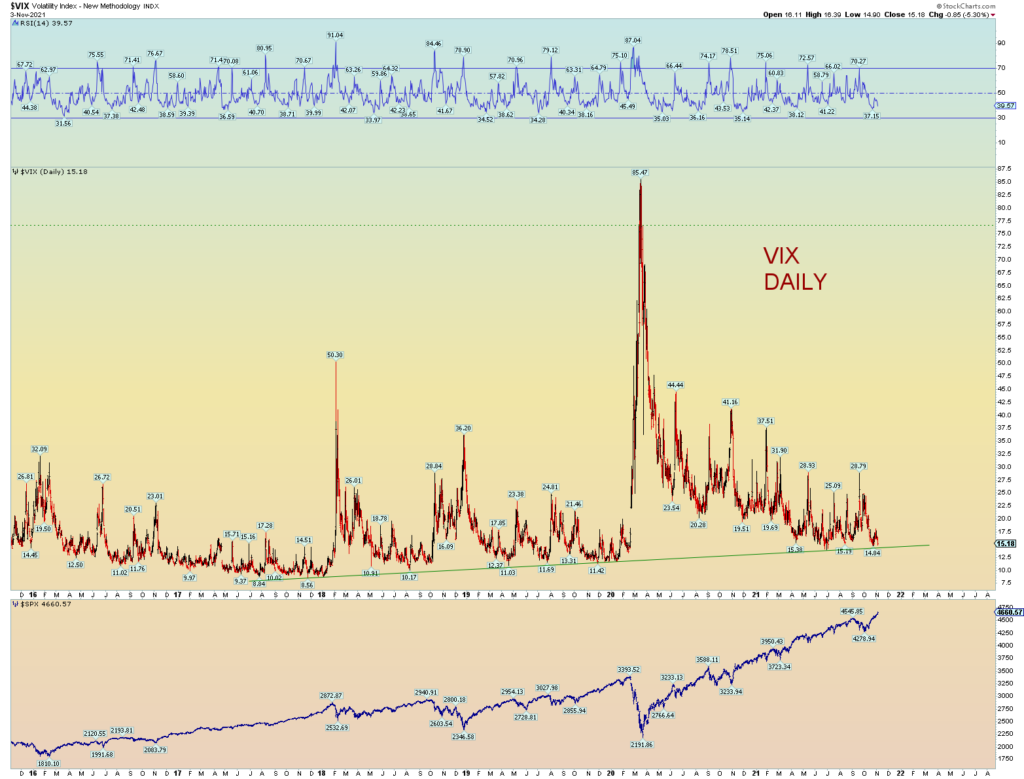
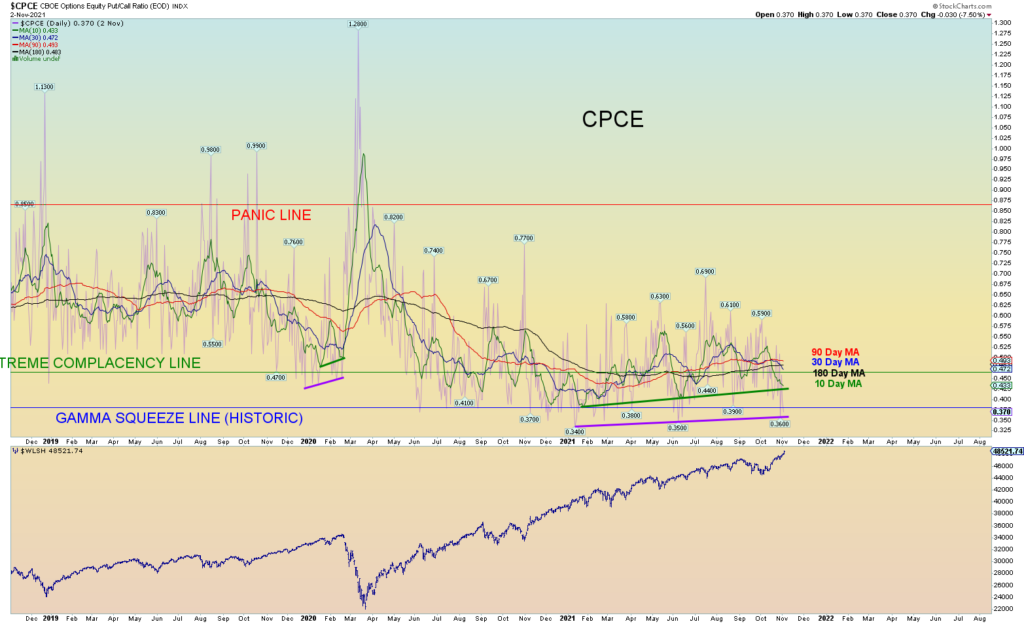
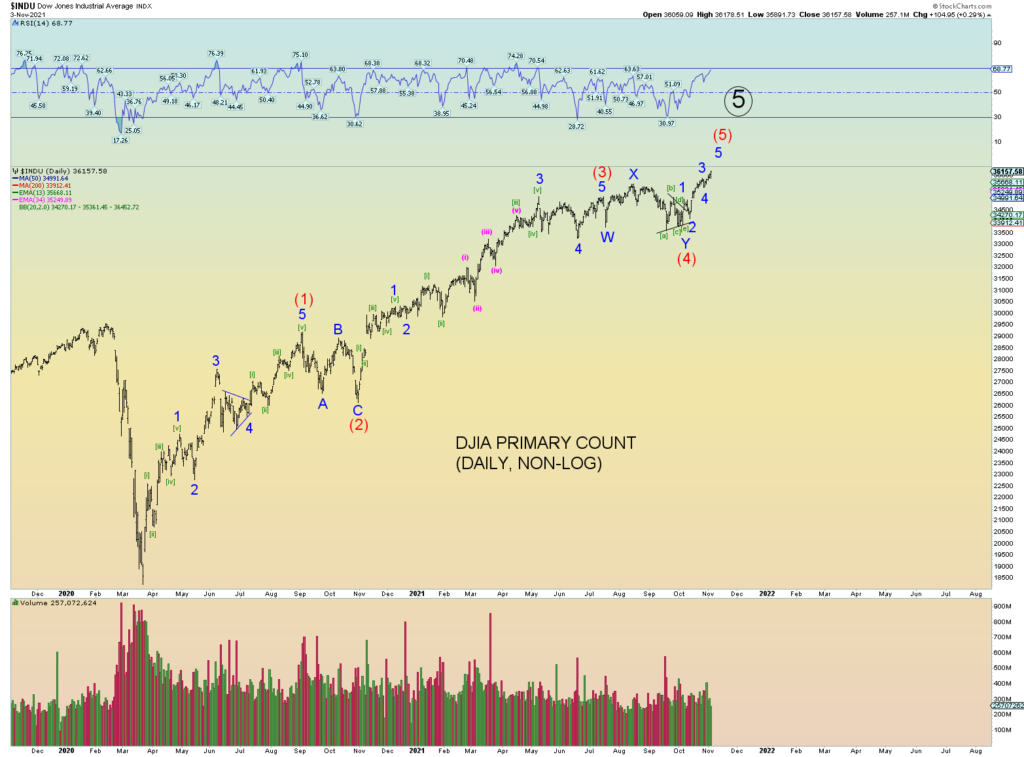
The wave pattern is developing nicely. All the indexes are pretty much aligned with each other in their respective subwave counts.
There are 2 different versions of the extended fifth wave count, so I decided to just go with the one as they both say the same thing anyway. This is the more “classic” way of labeling an extended wave five. It is ridiculous in length and now time. But if this is the “end” there couldn’t be a more appropriate spot as the mania goes onward and upward.


The Wilshire weekly. Dancing above the channel line.


Just incredible leverage being used to pump prices. I suspect there is a HUGE air pocket beneath everything. Price discovery in the coming bear market will be fun to watch.

DJIA count is better counted in a differing way. The large relatively sideways price action from May to October fits better as an Intermediate sized wave. The Wilshire above did not have a sideways price action.

So everything is probably looking for the top of their respective subwave threes, a pullback, and then the final wave.

No more DOW theory divergence. But who cares. Look at that weird spike candle. It actually makes more sense that both the Industrials and Transports spike to all-time highs at the end of the mania rather than a divergence. This is the end of the world you know…
