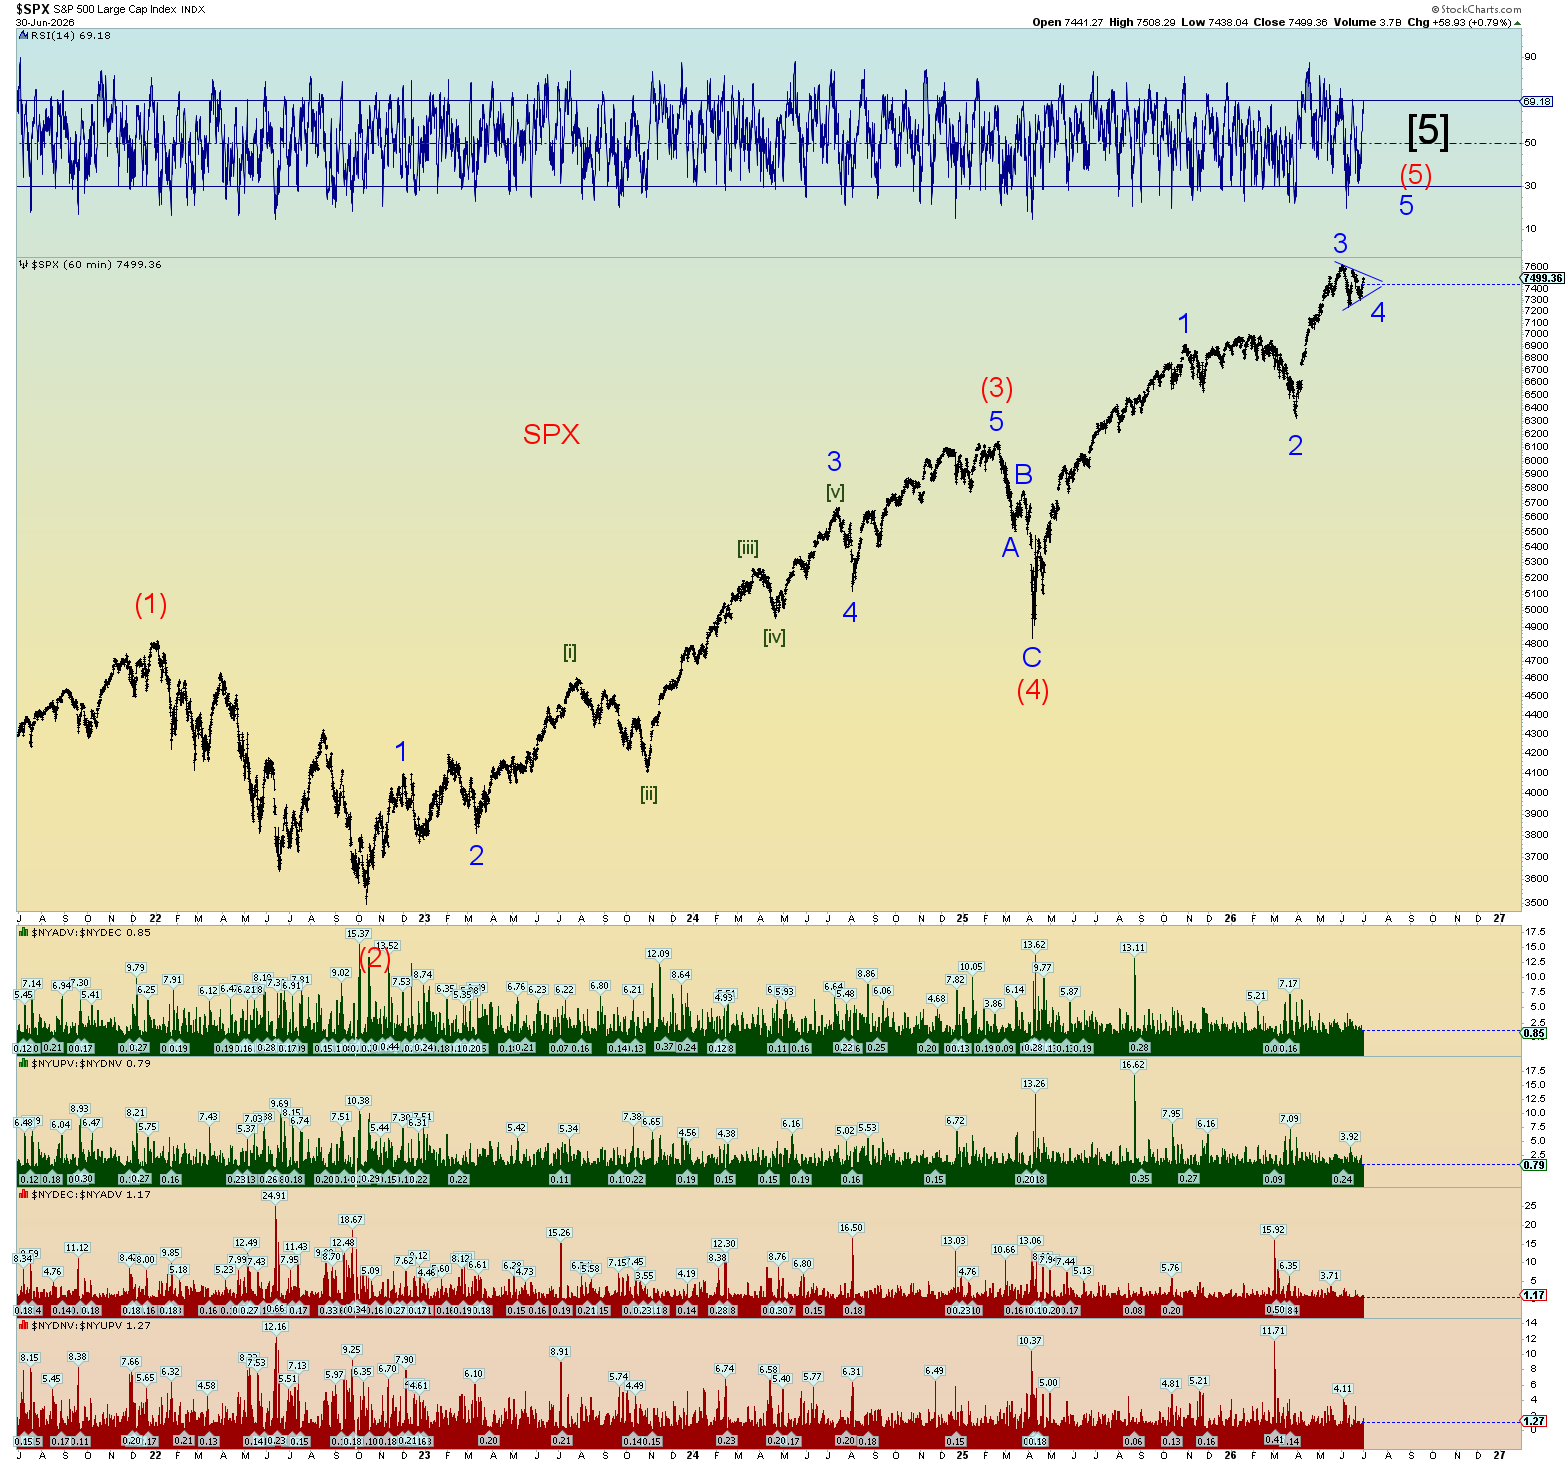
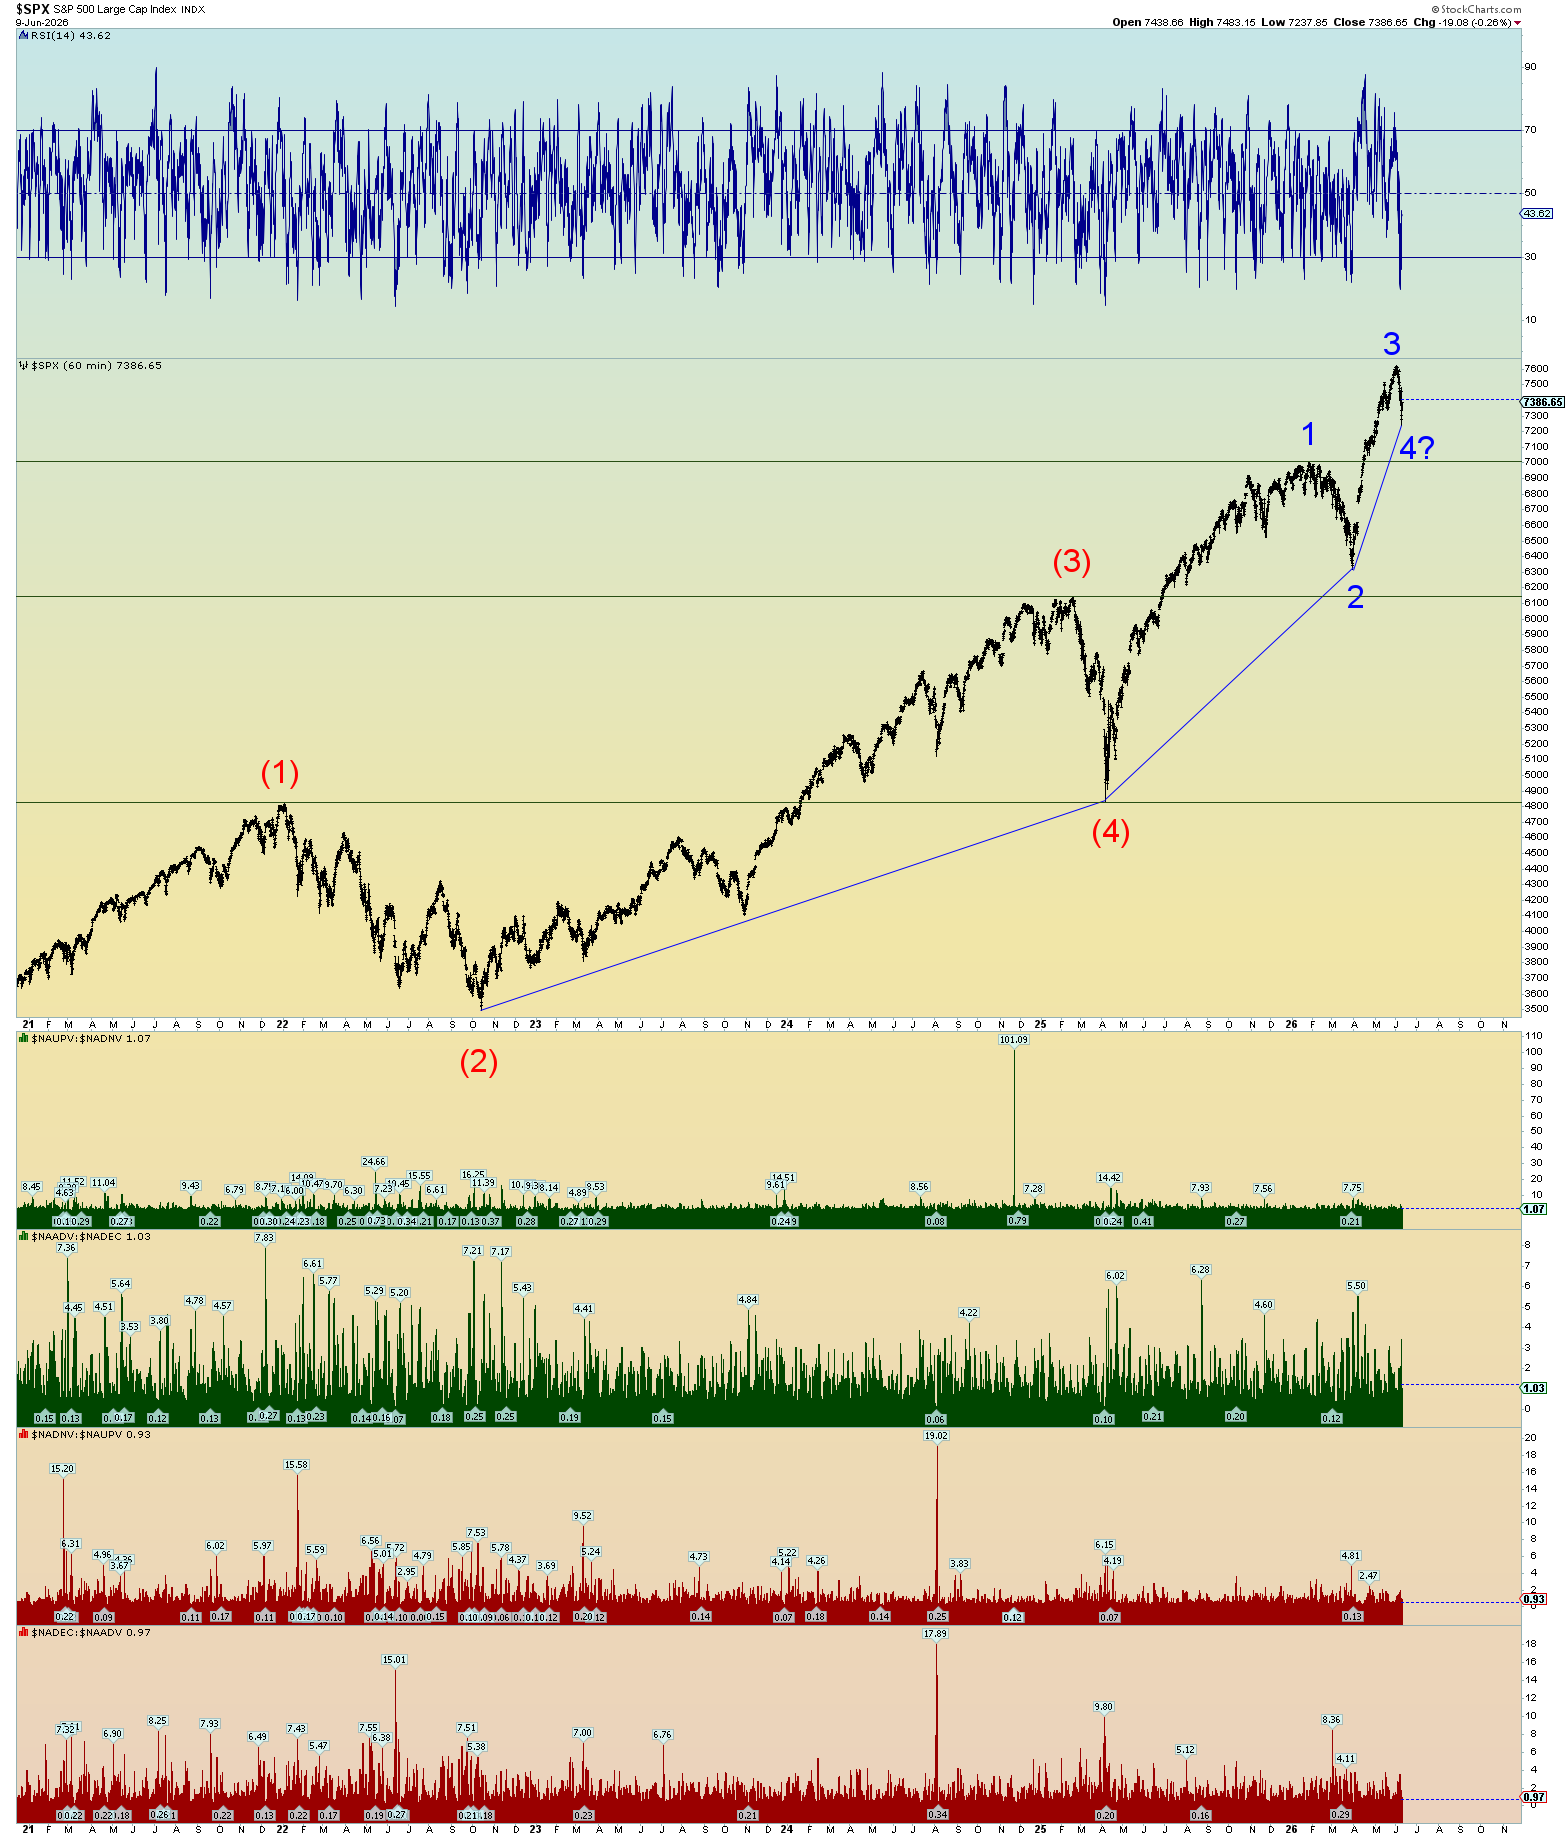
Again, I believe the market will hold up through summer. Perhaps a Minor 4 triangle is forming. The truth is, the SPX could drop 400 points from here – from 7500 to 7100 – and Minor 4 would still be a valid count. I would not be surprised if it did.
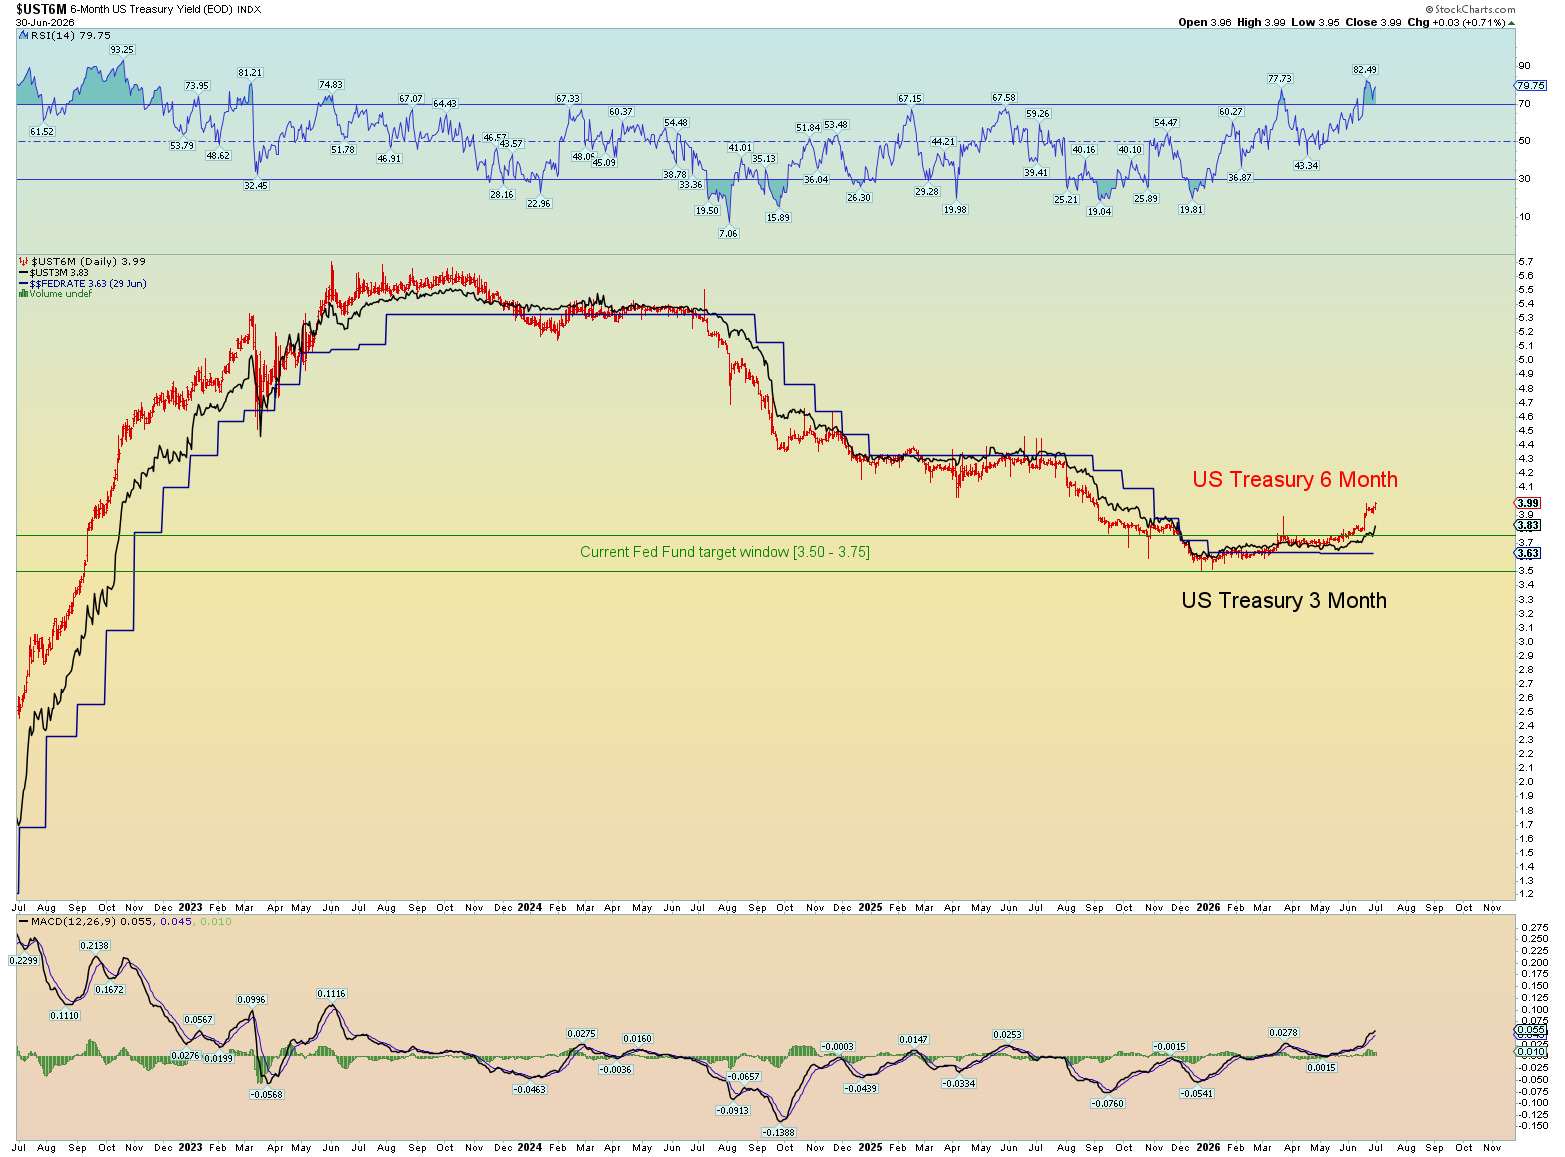
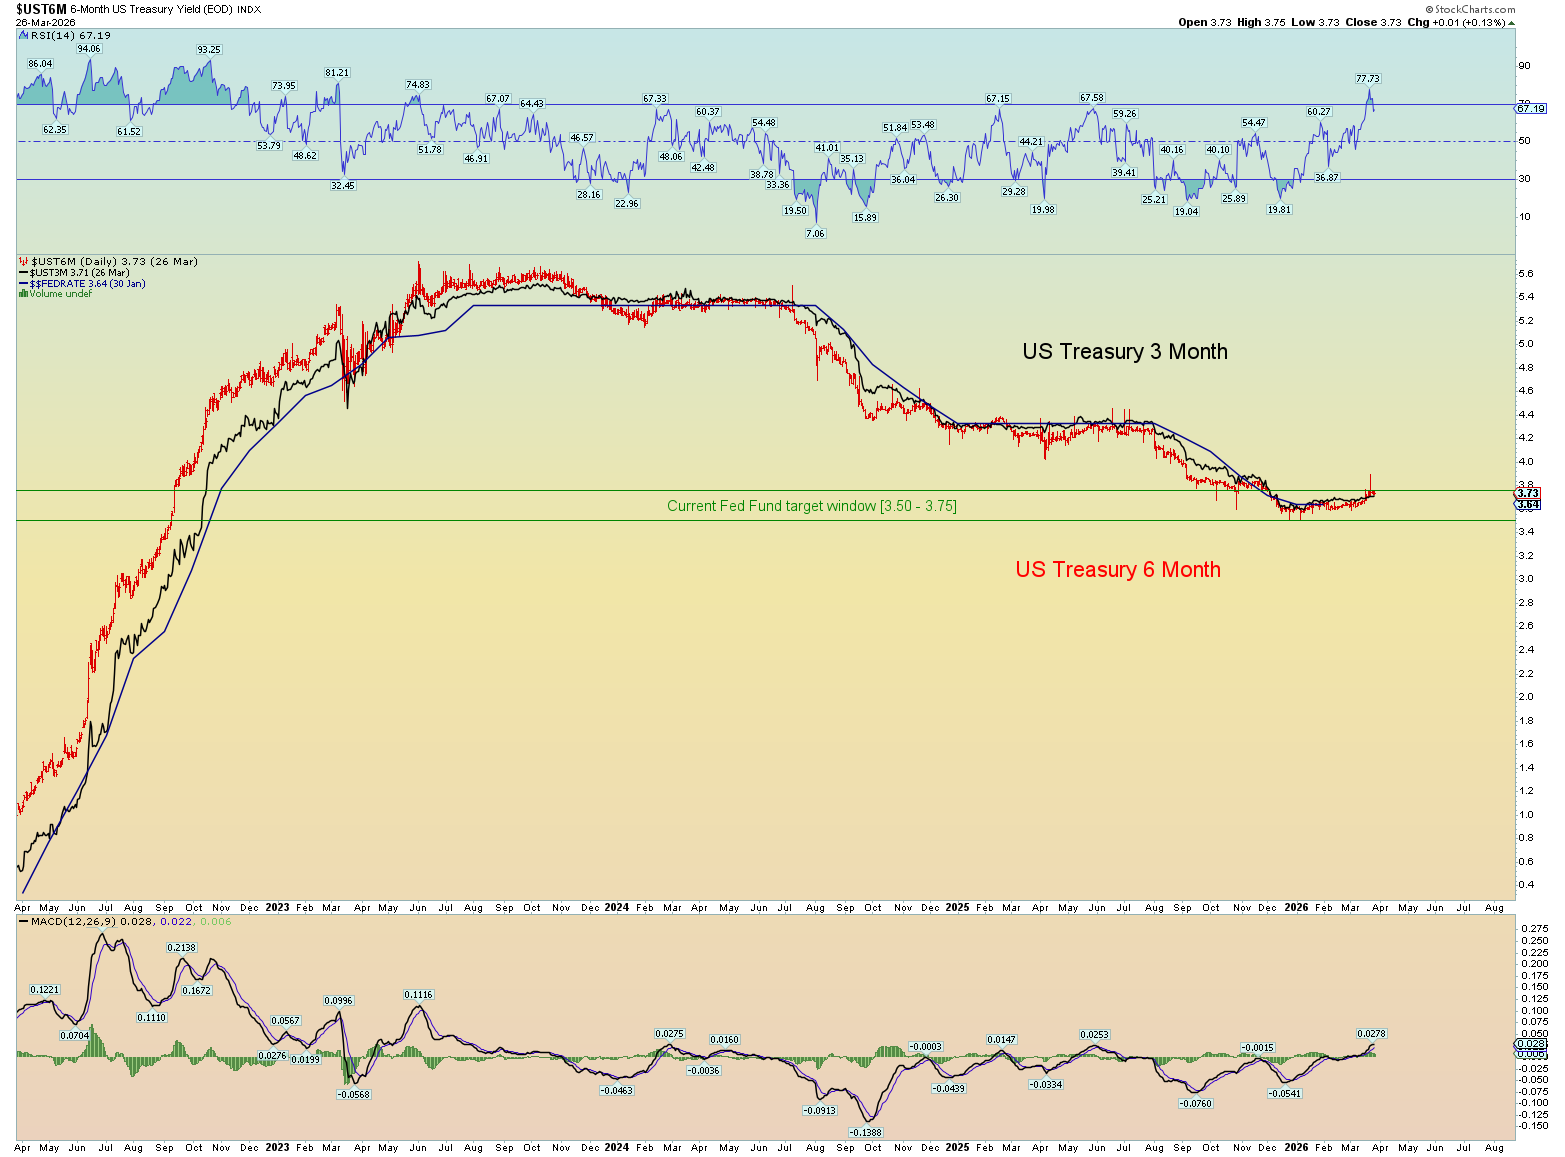
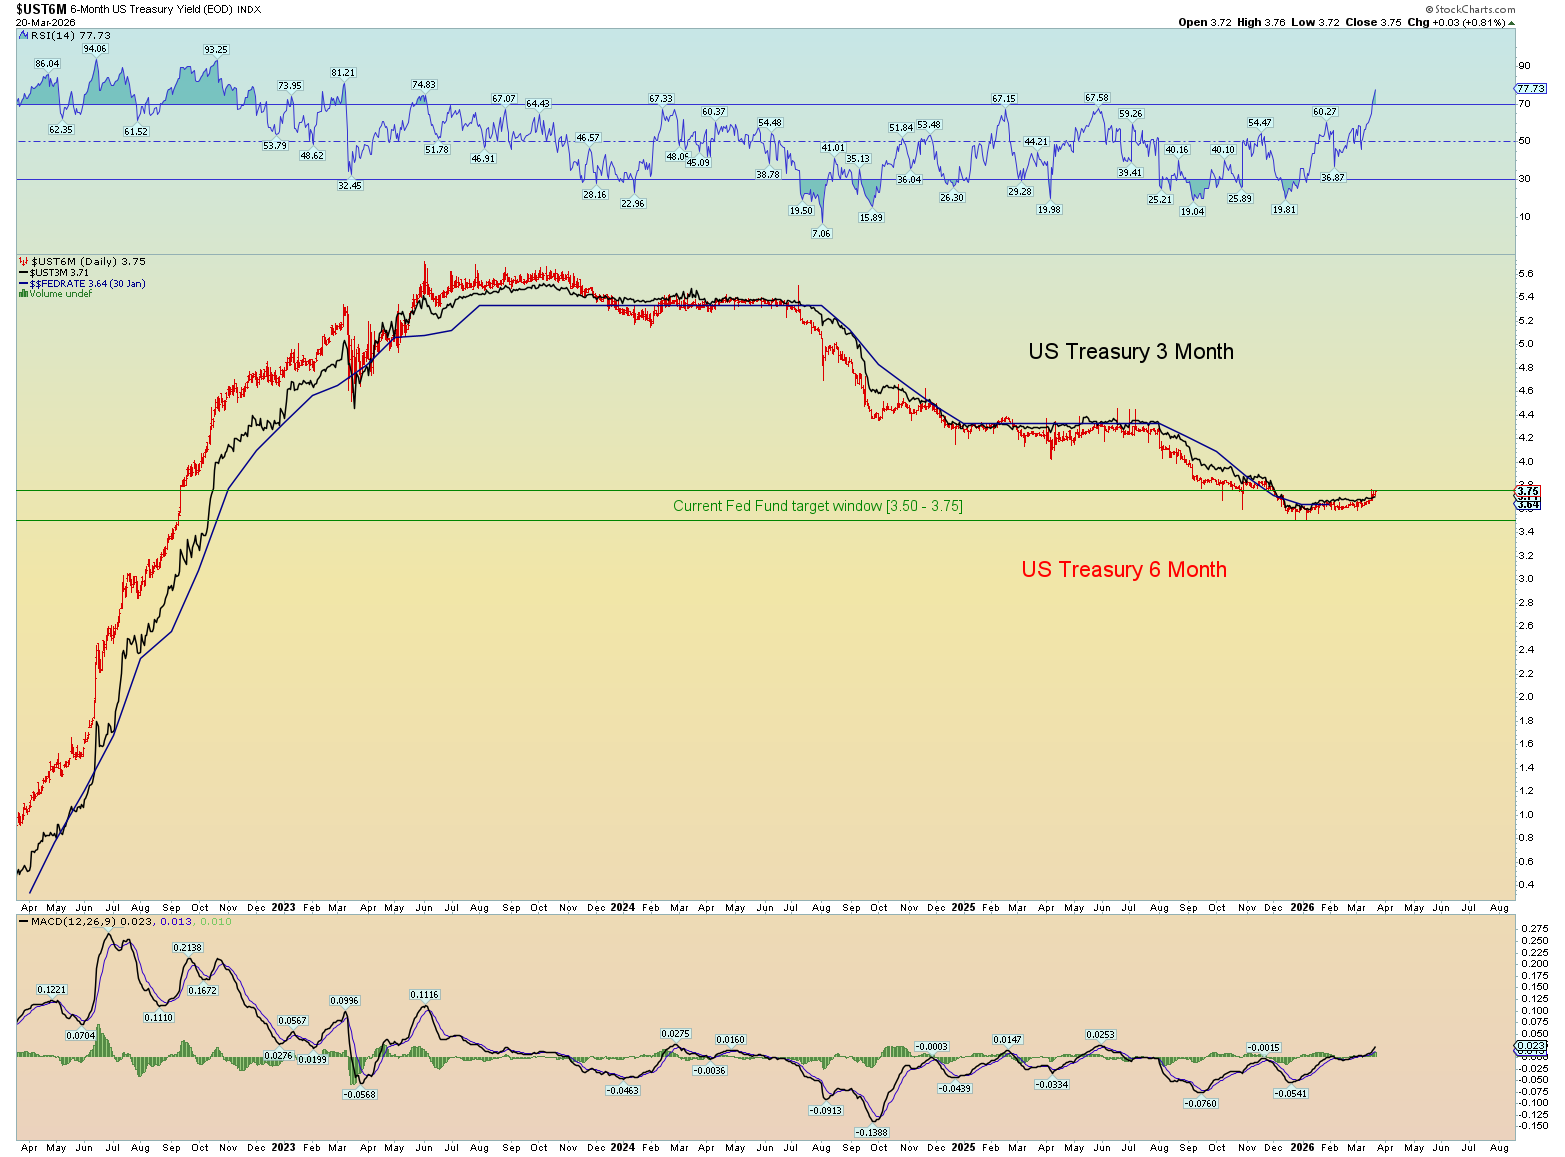
Oh oh, not good. A .25-point interest rate hike is beginning to be signaled by the market.
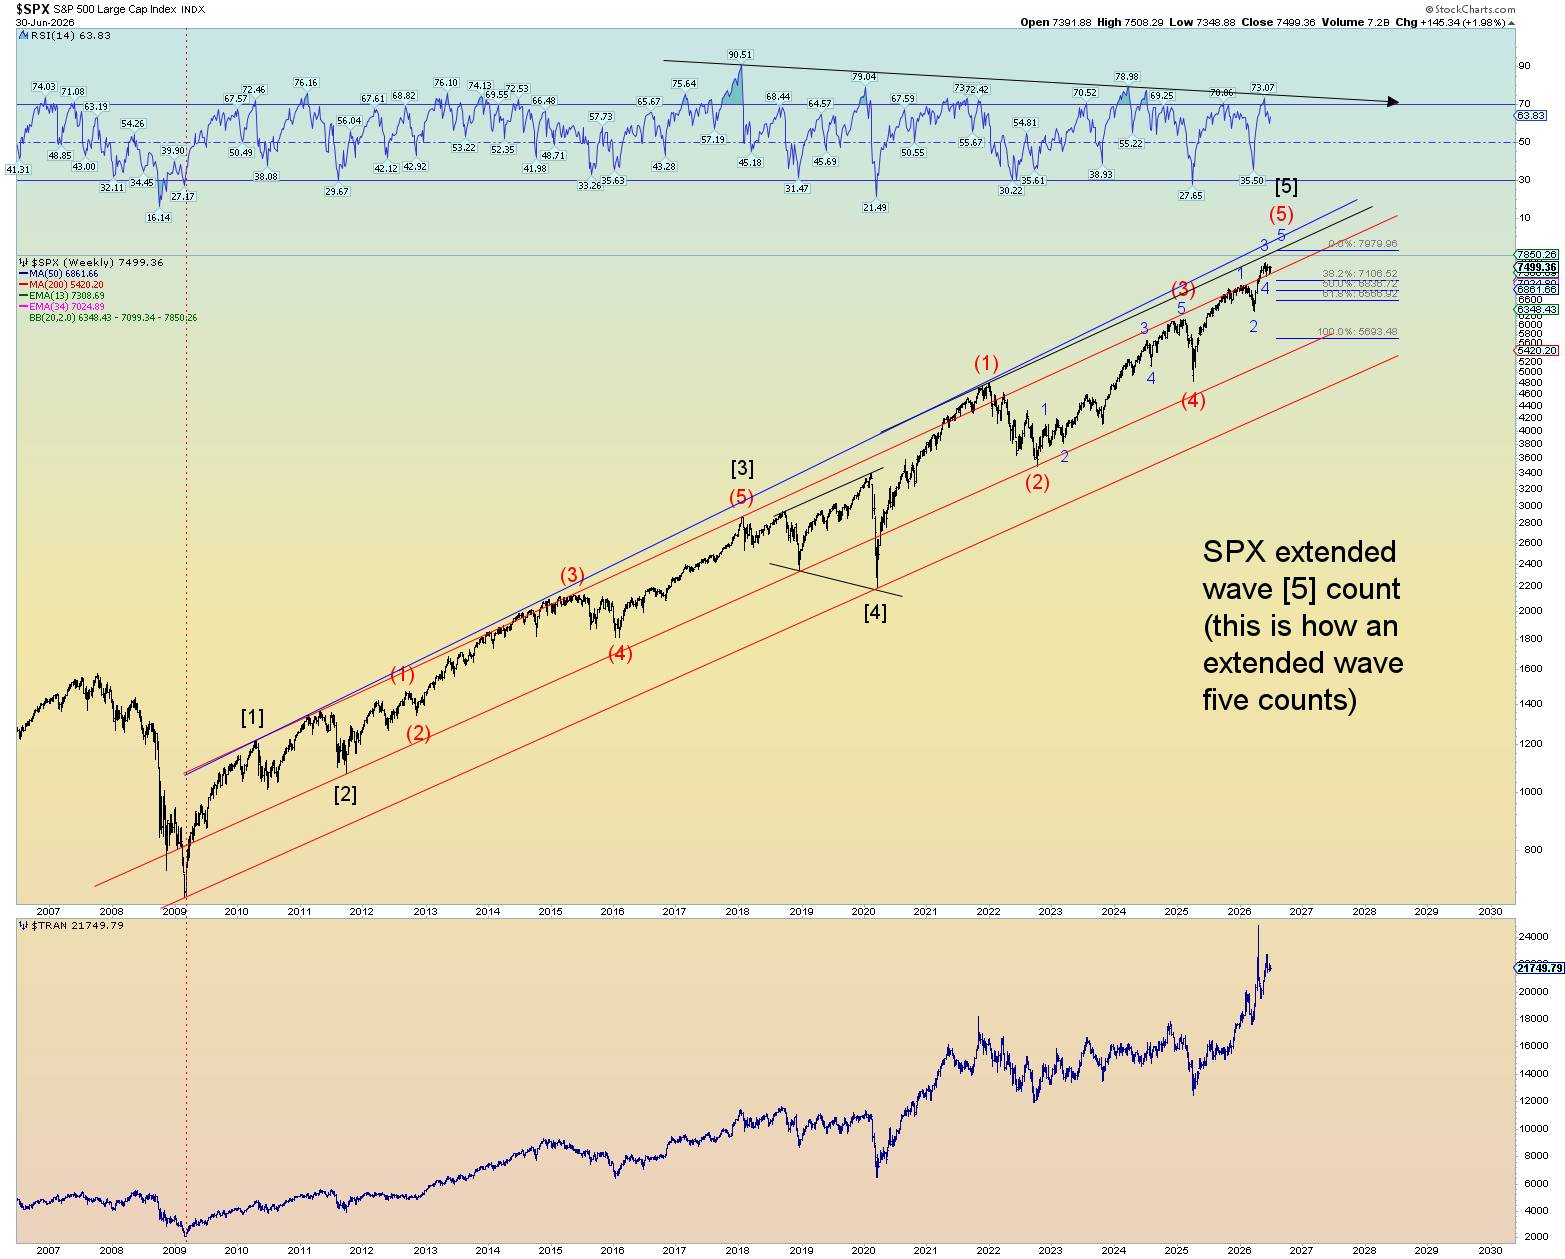
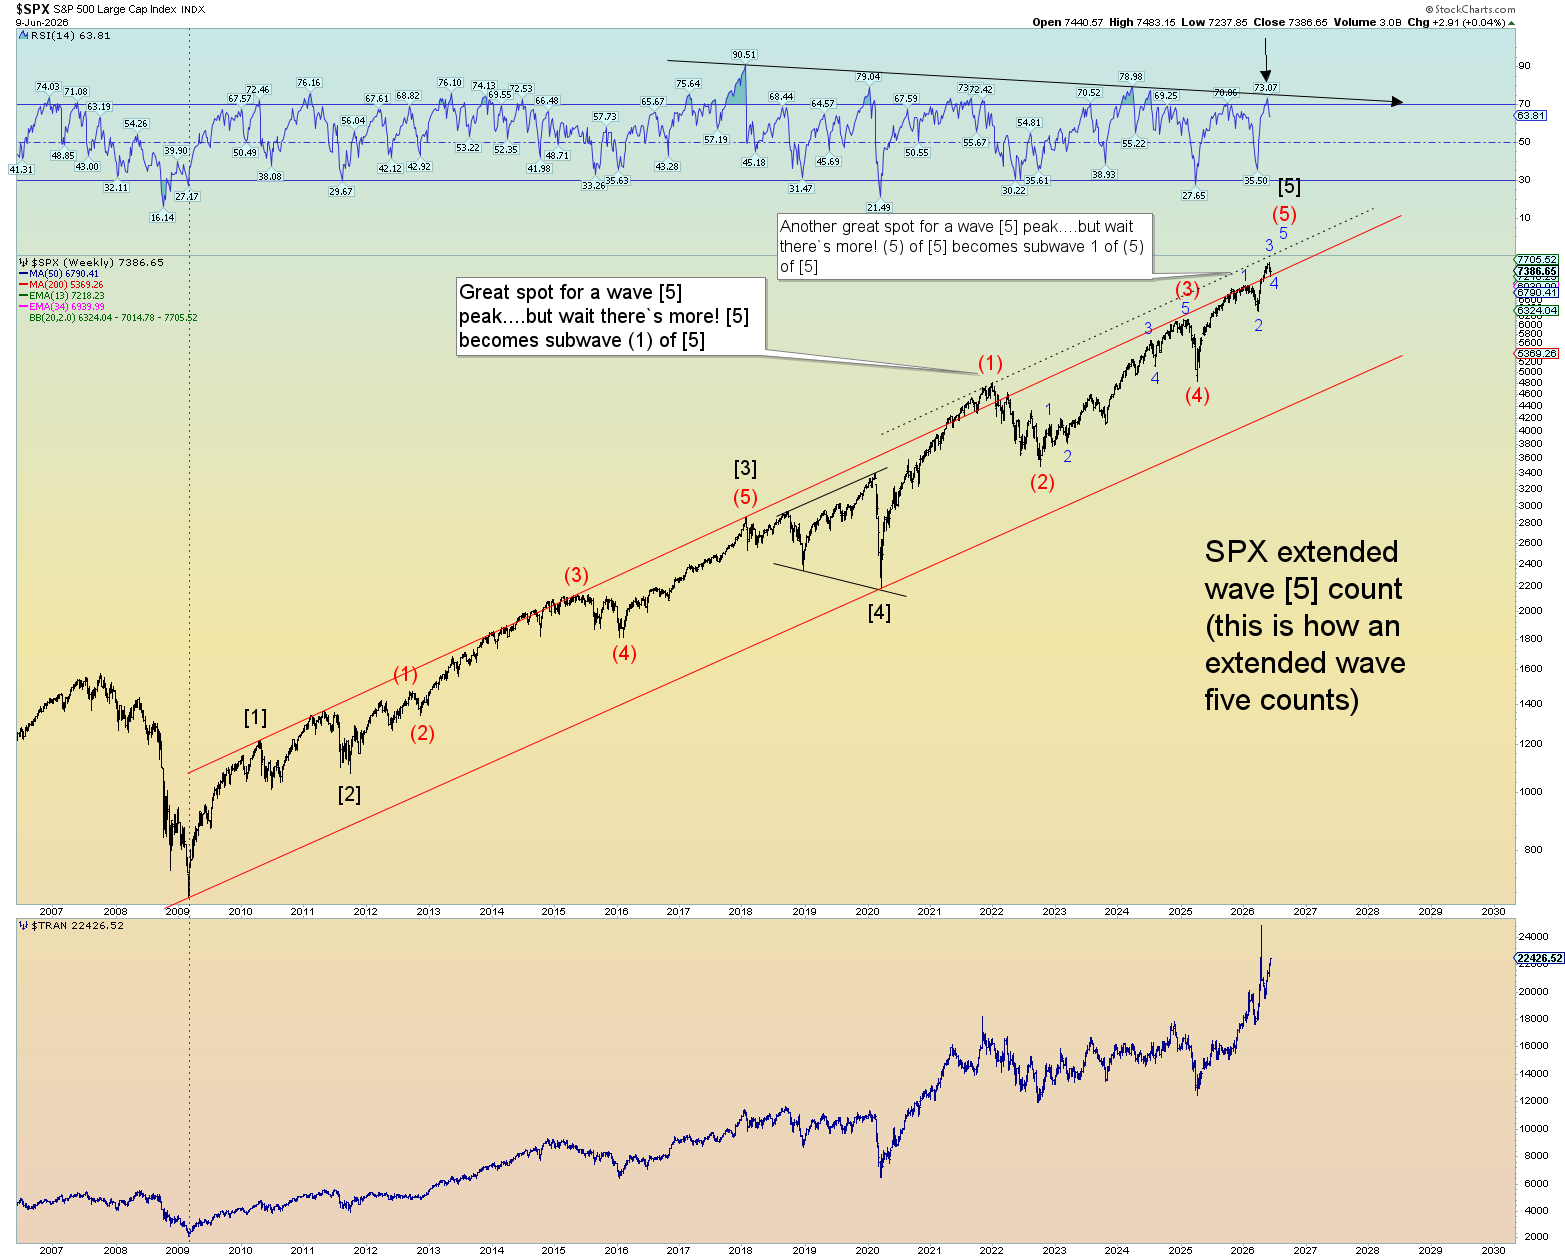
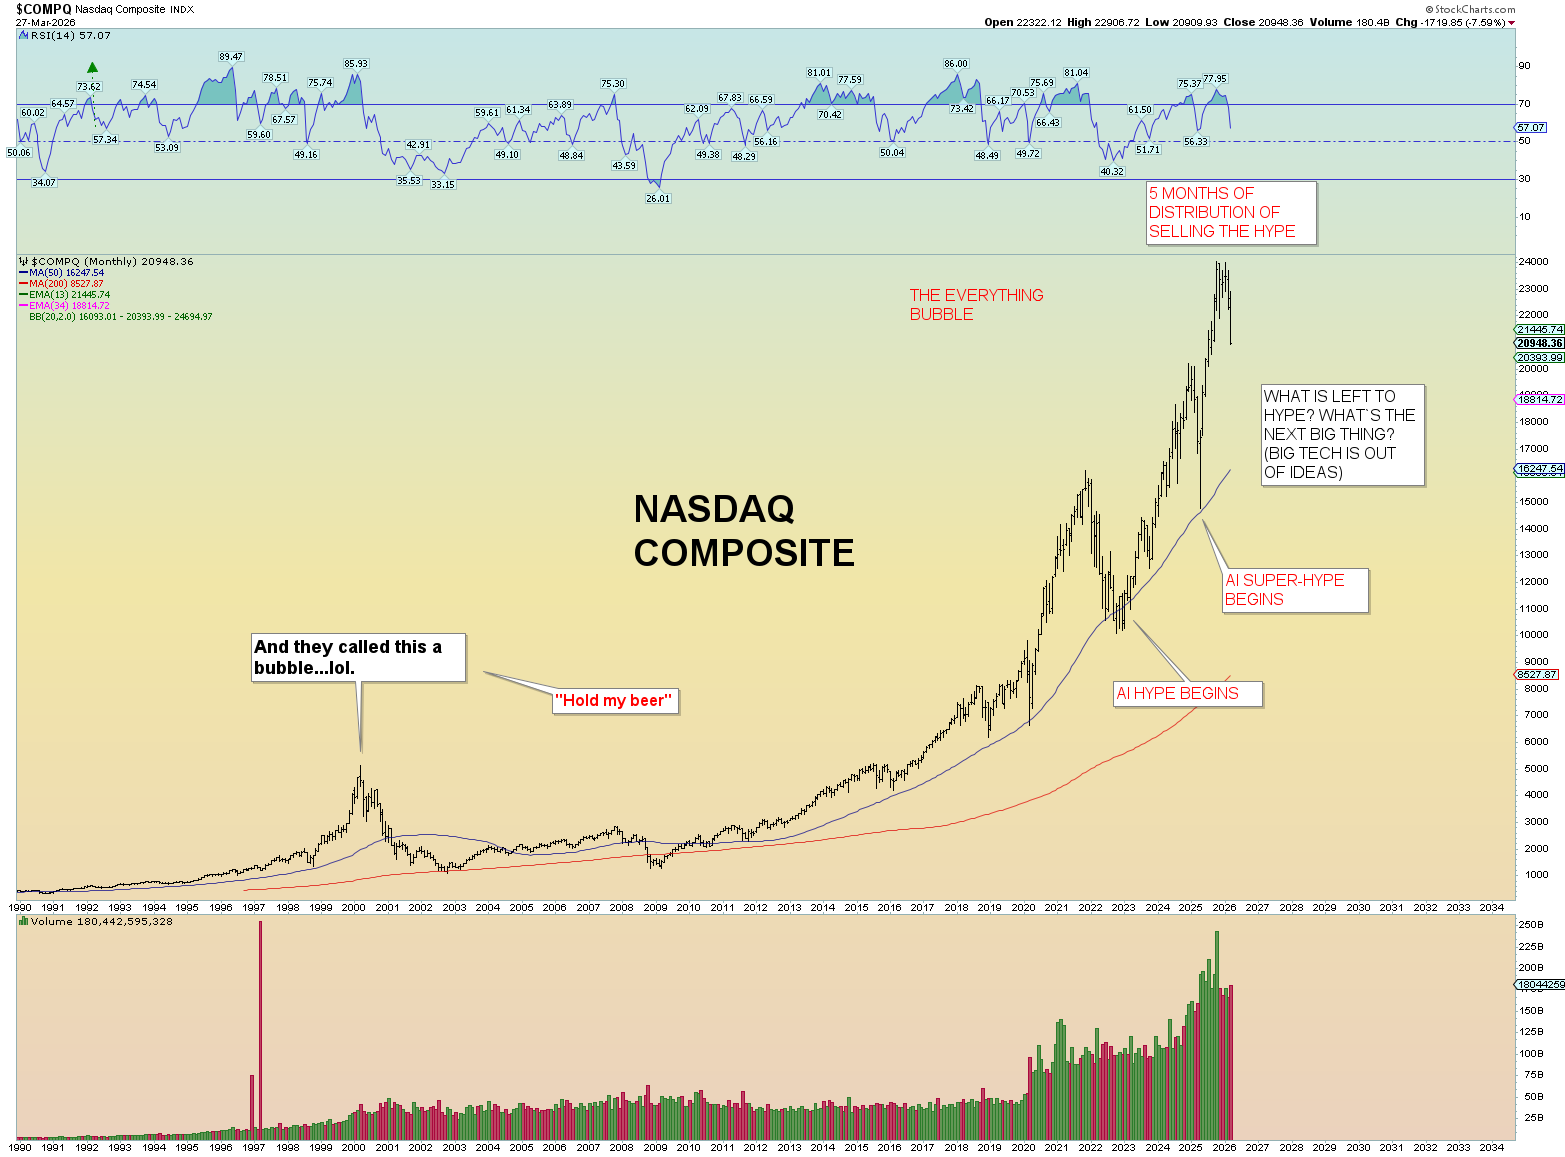
The extended wave five count since 2020 seems to be finishing up this summer. I do expect Space X, Anthropic and OpenAI to go public before the market totally crashes.
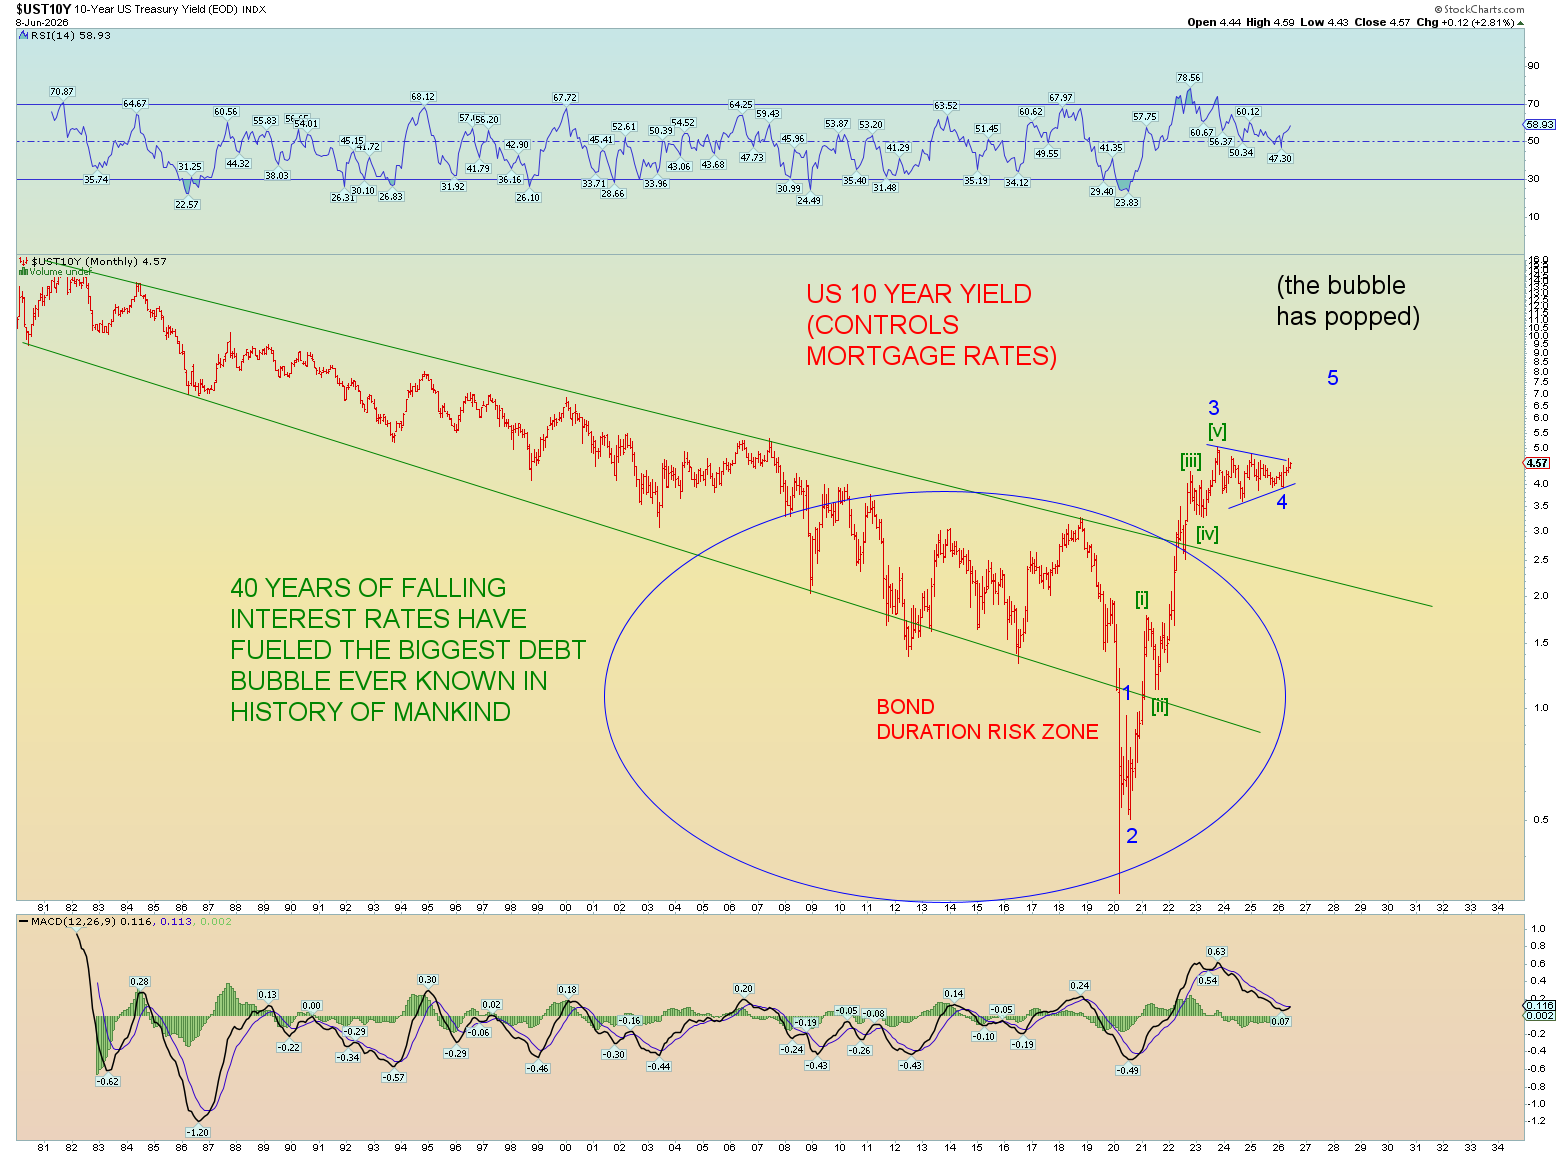
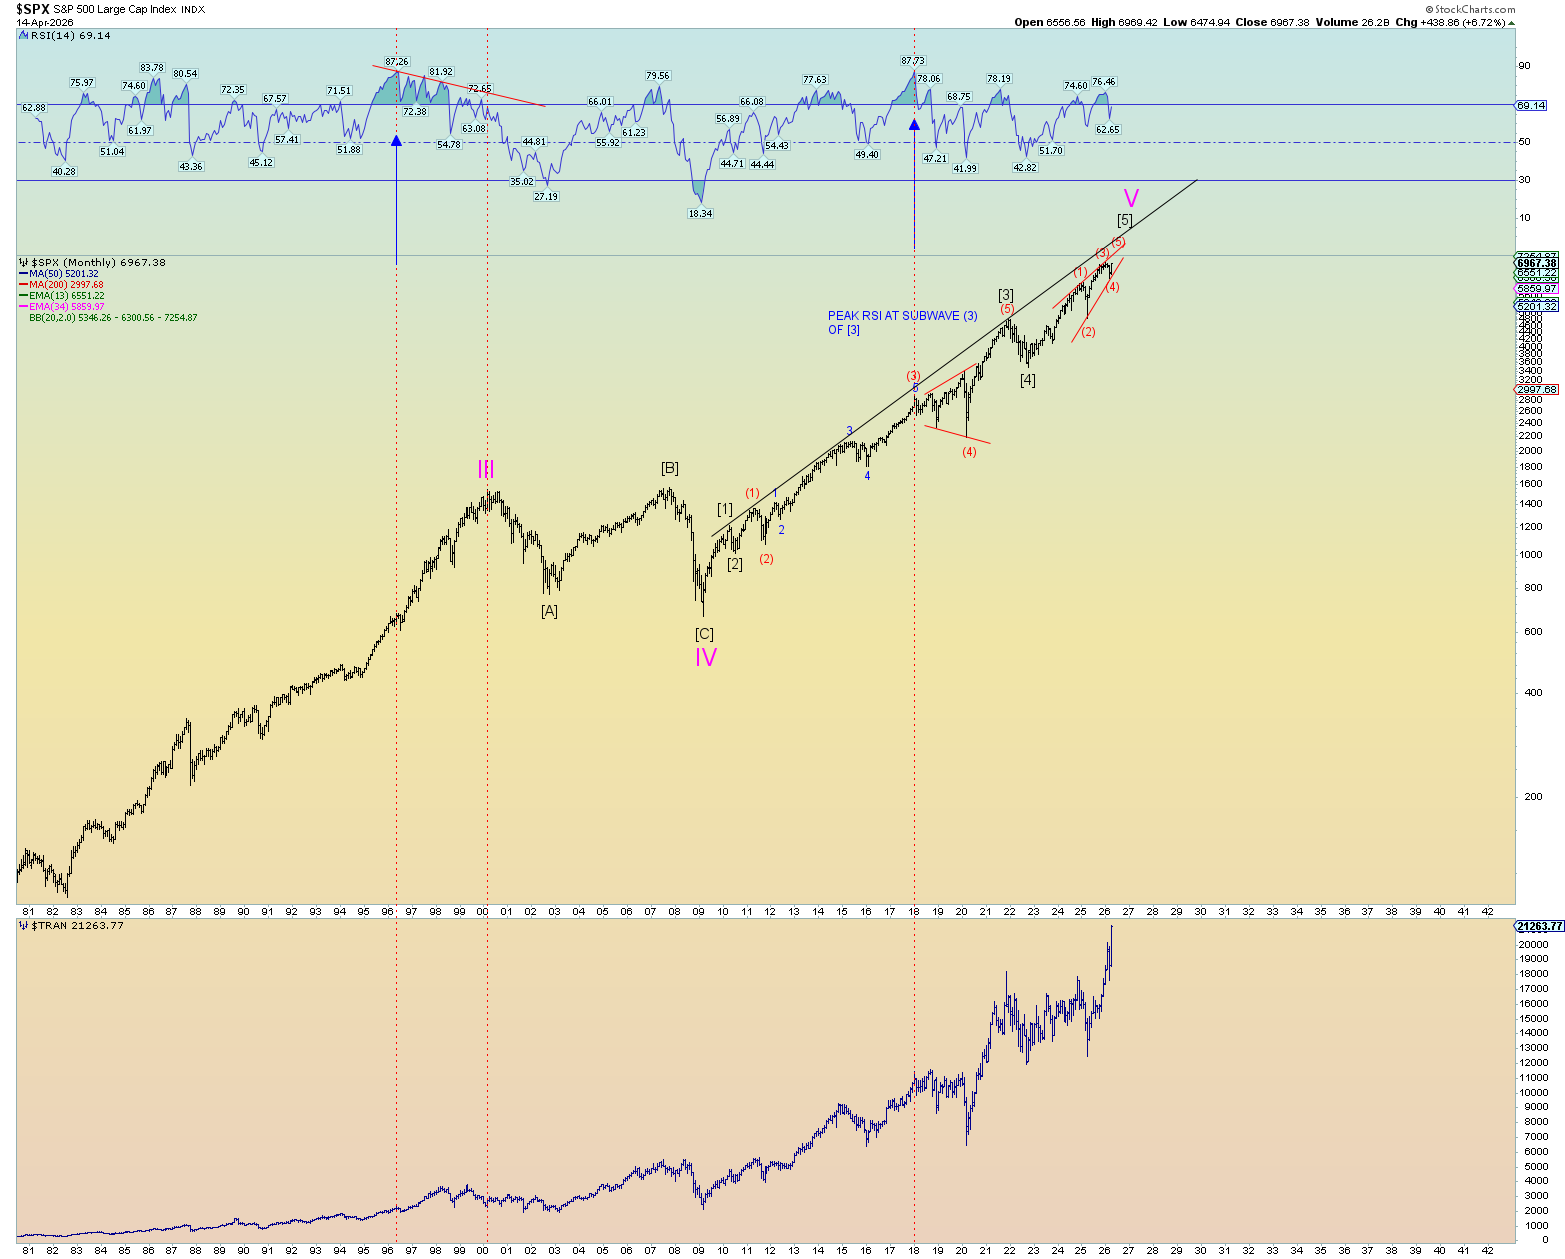
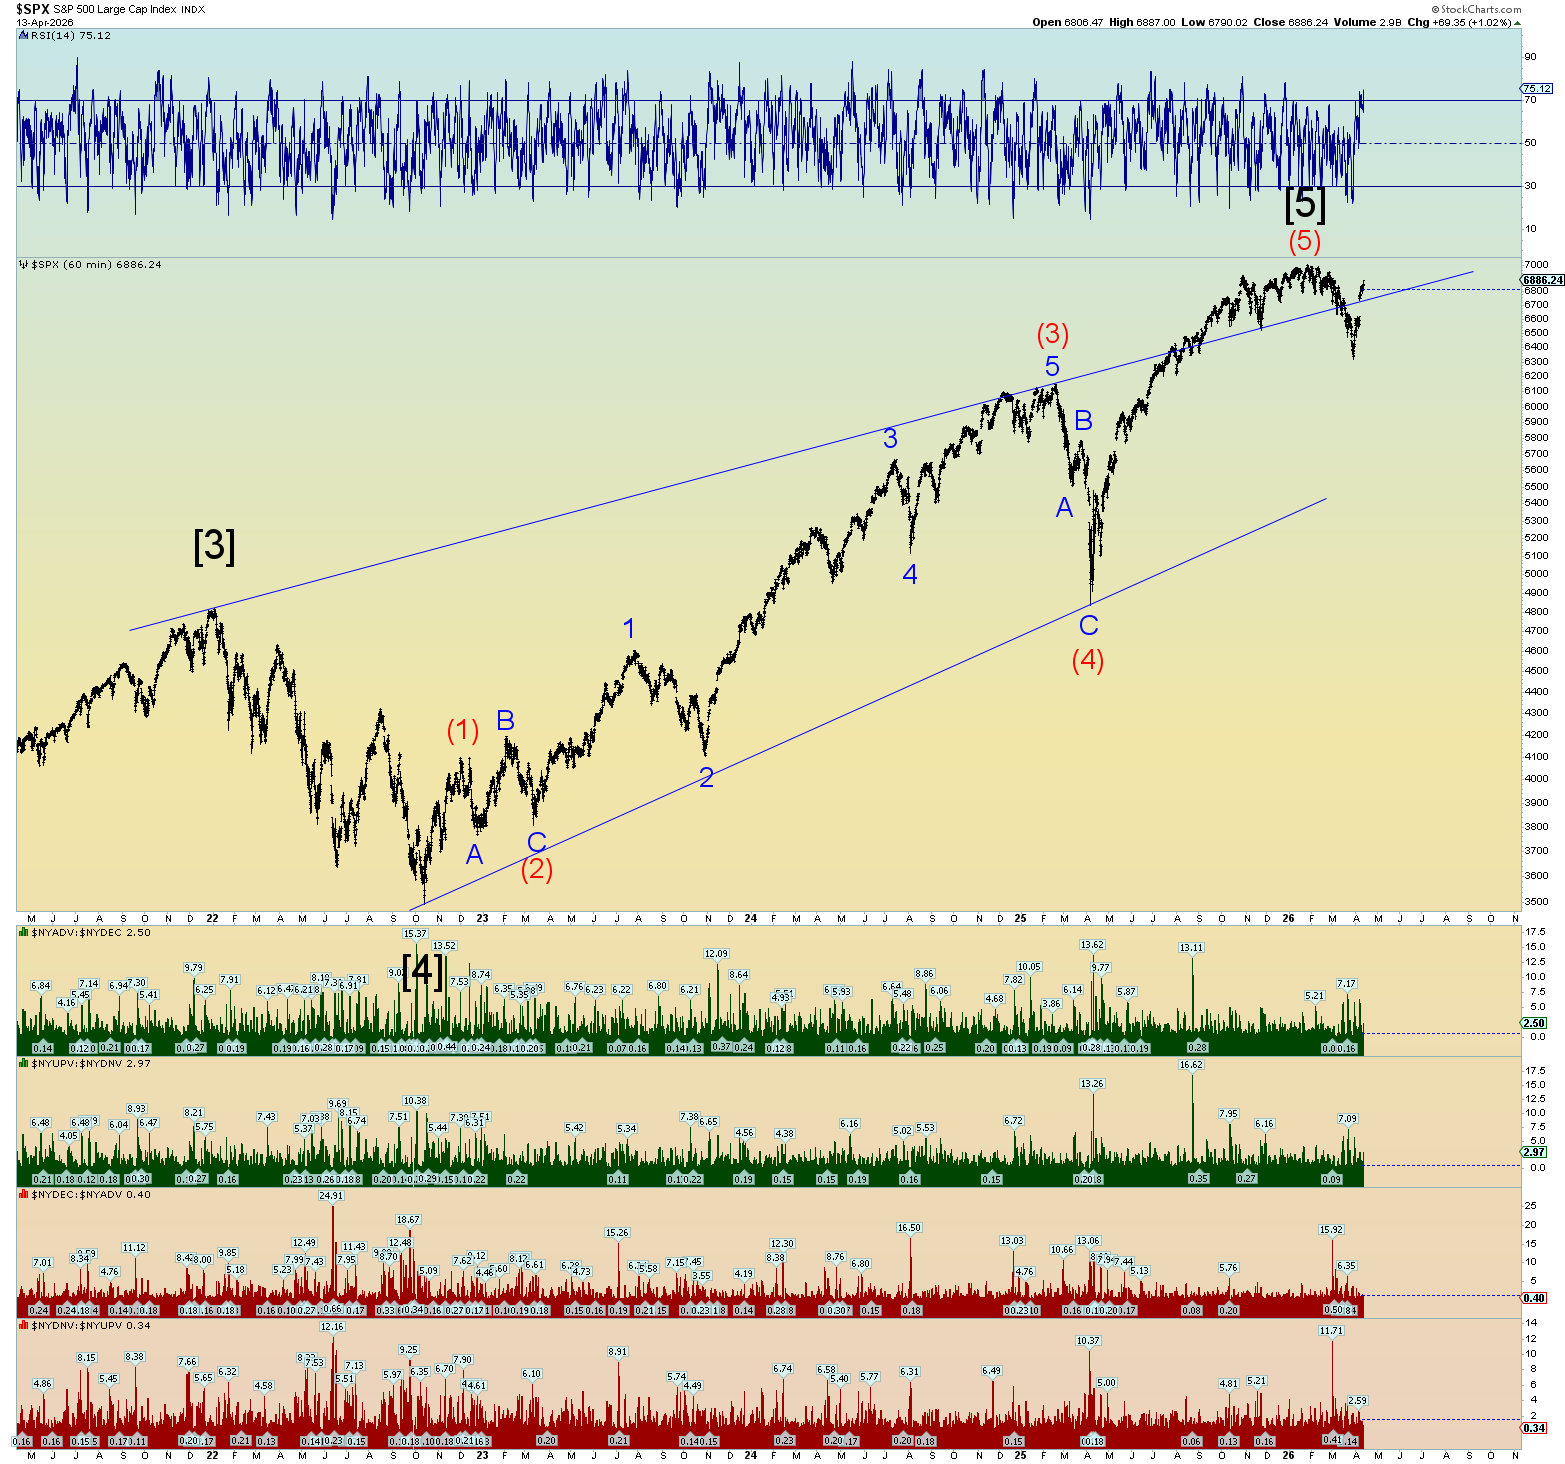
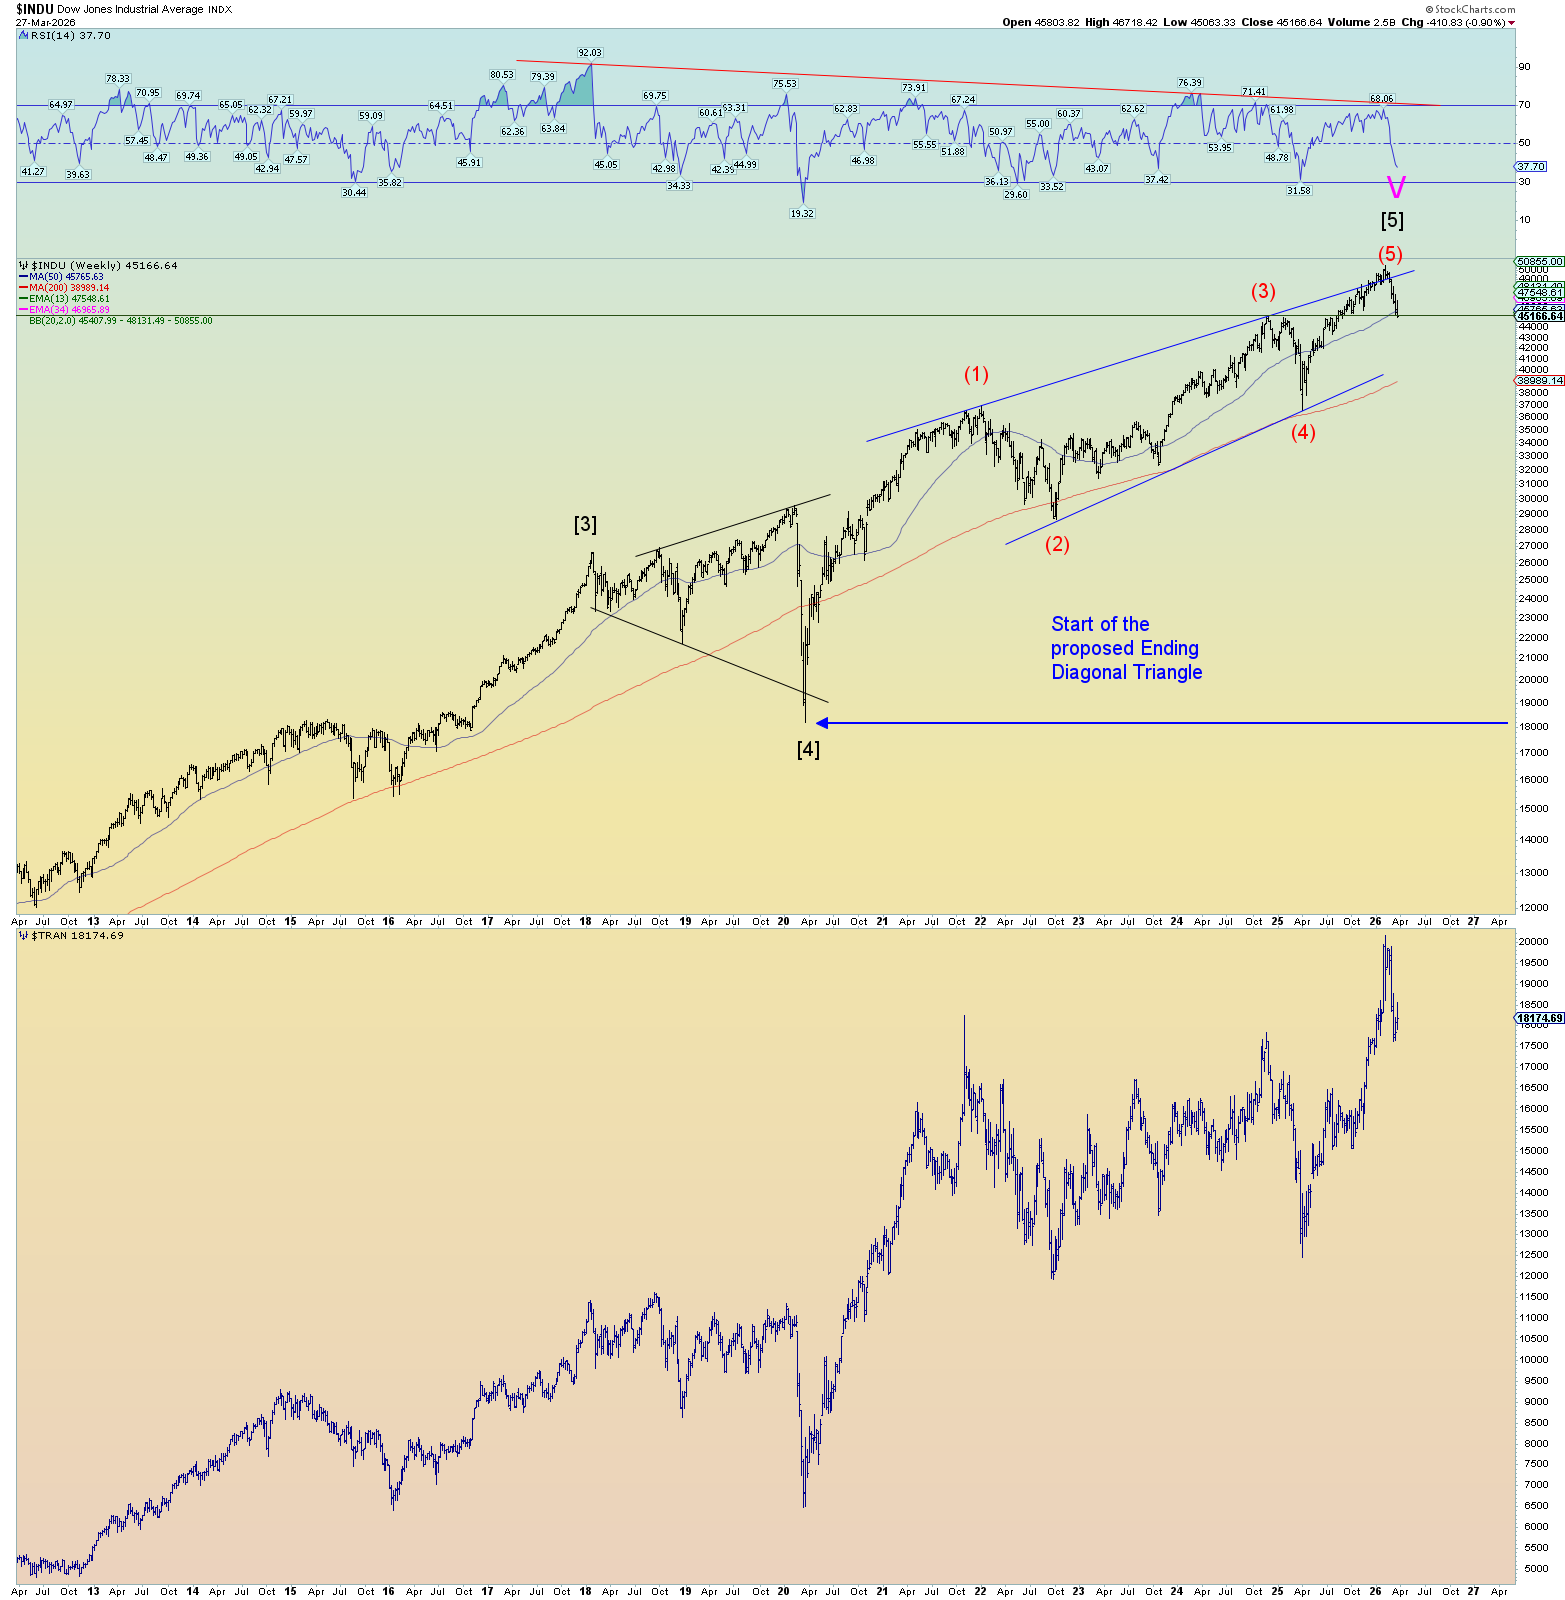
There is a certain mathematical elegance to the chart below.
The following chart explains why and how to label an extended wave five. The market made a perfectly fitting peak in 2021 and did decline to (2). However, the market extended indicating an extended wave (5). This pattern didn’t fully realize itself until the recent blast up that took us to 3 of (5) of [5].
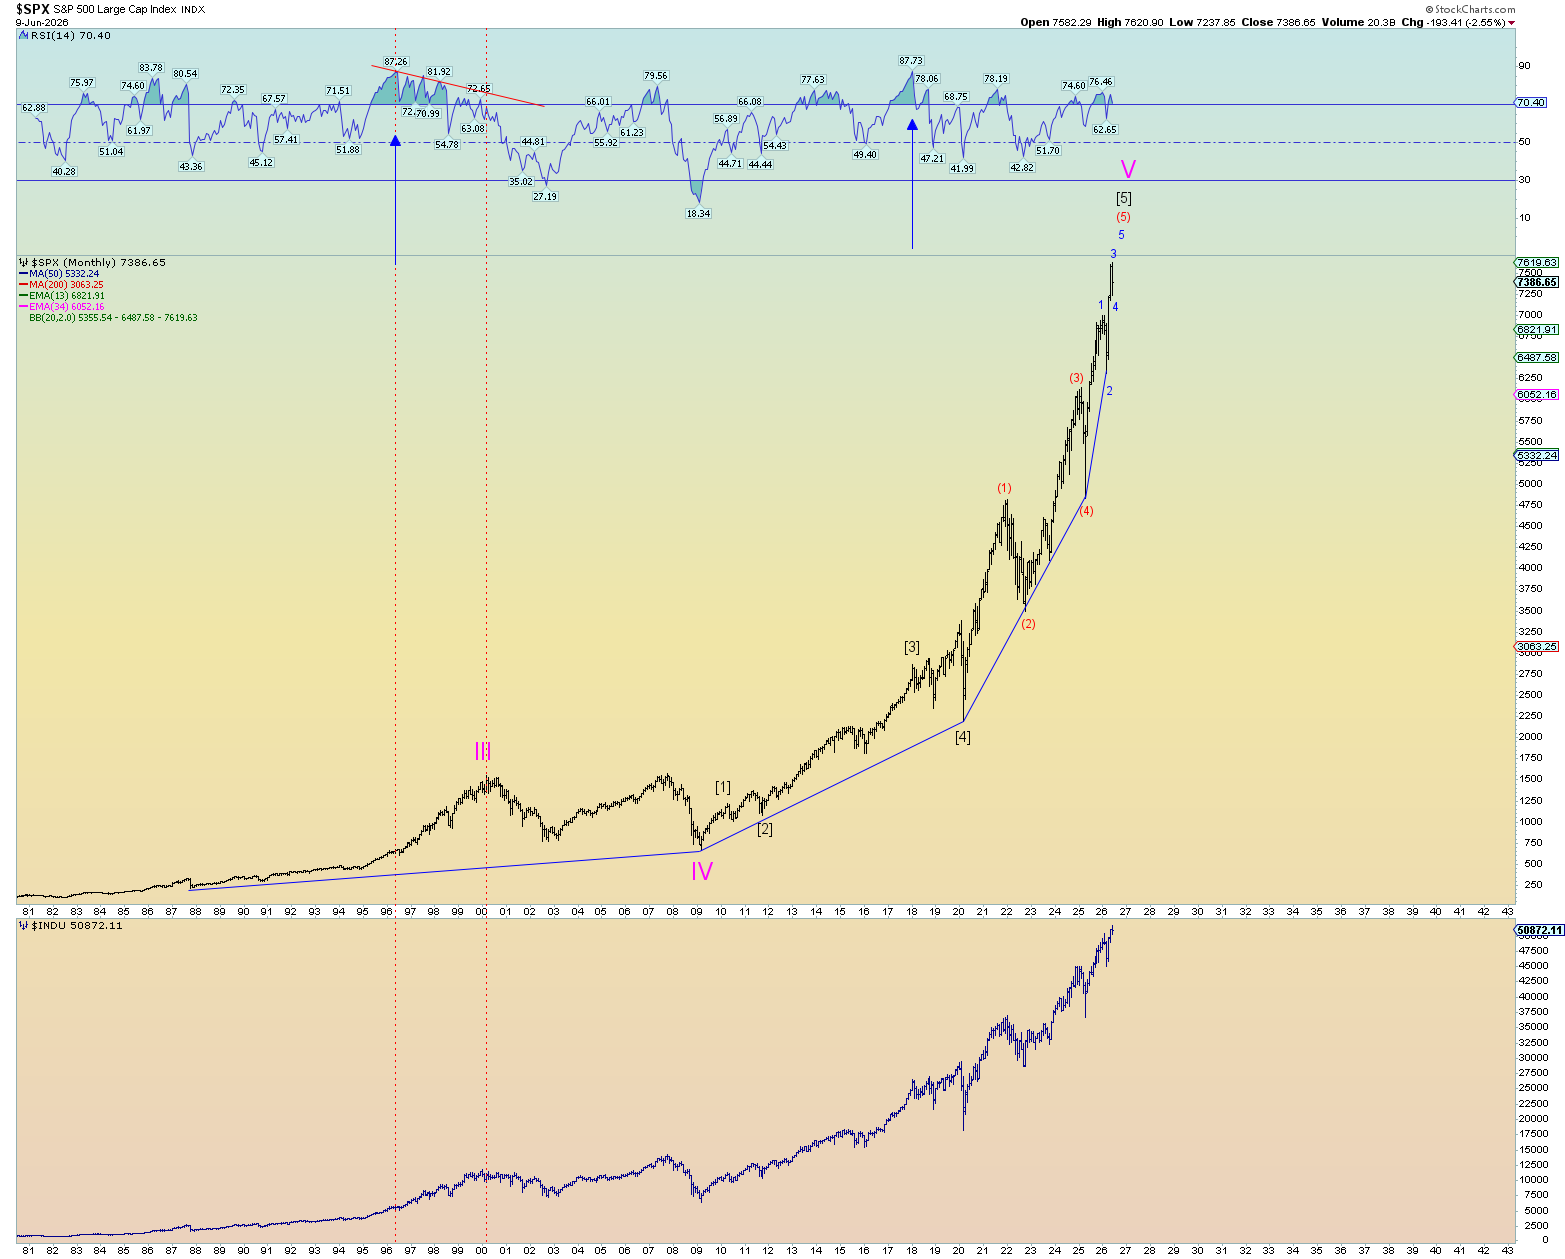
It would be prefect if the market made yet another new all-time high this summer or even Fall.
Wave 4 cannot enter into wave 1 price territory or else the count is invalid.
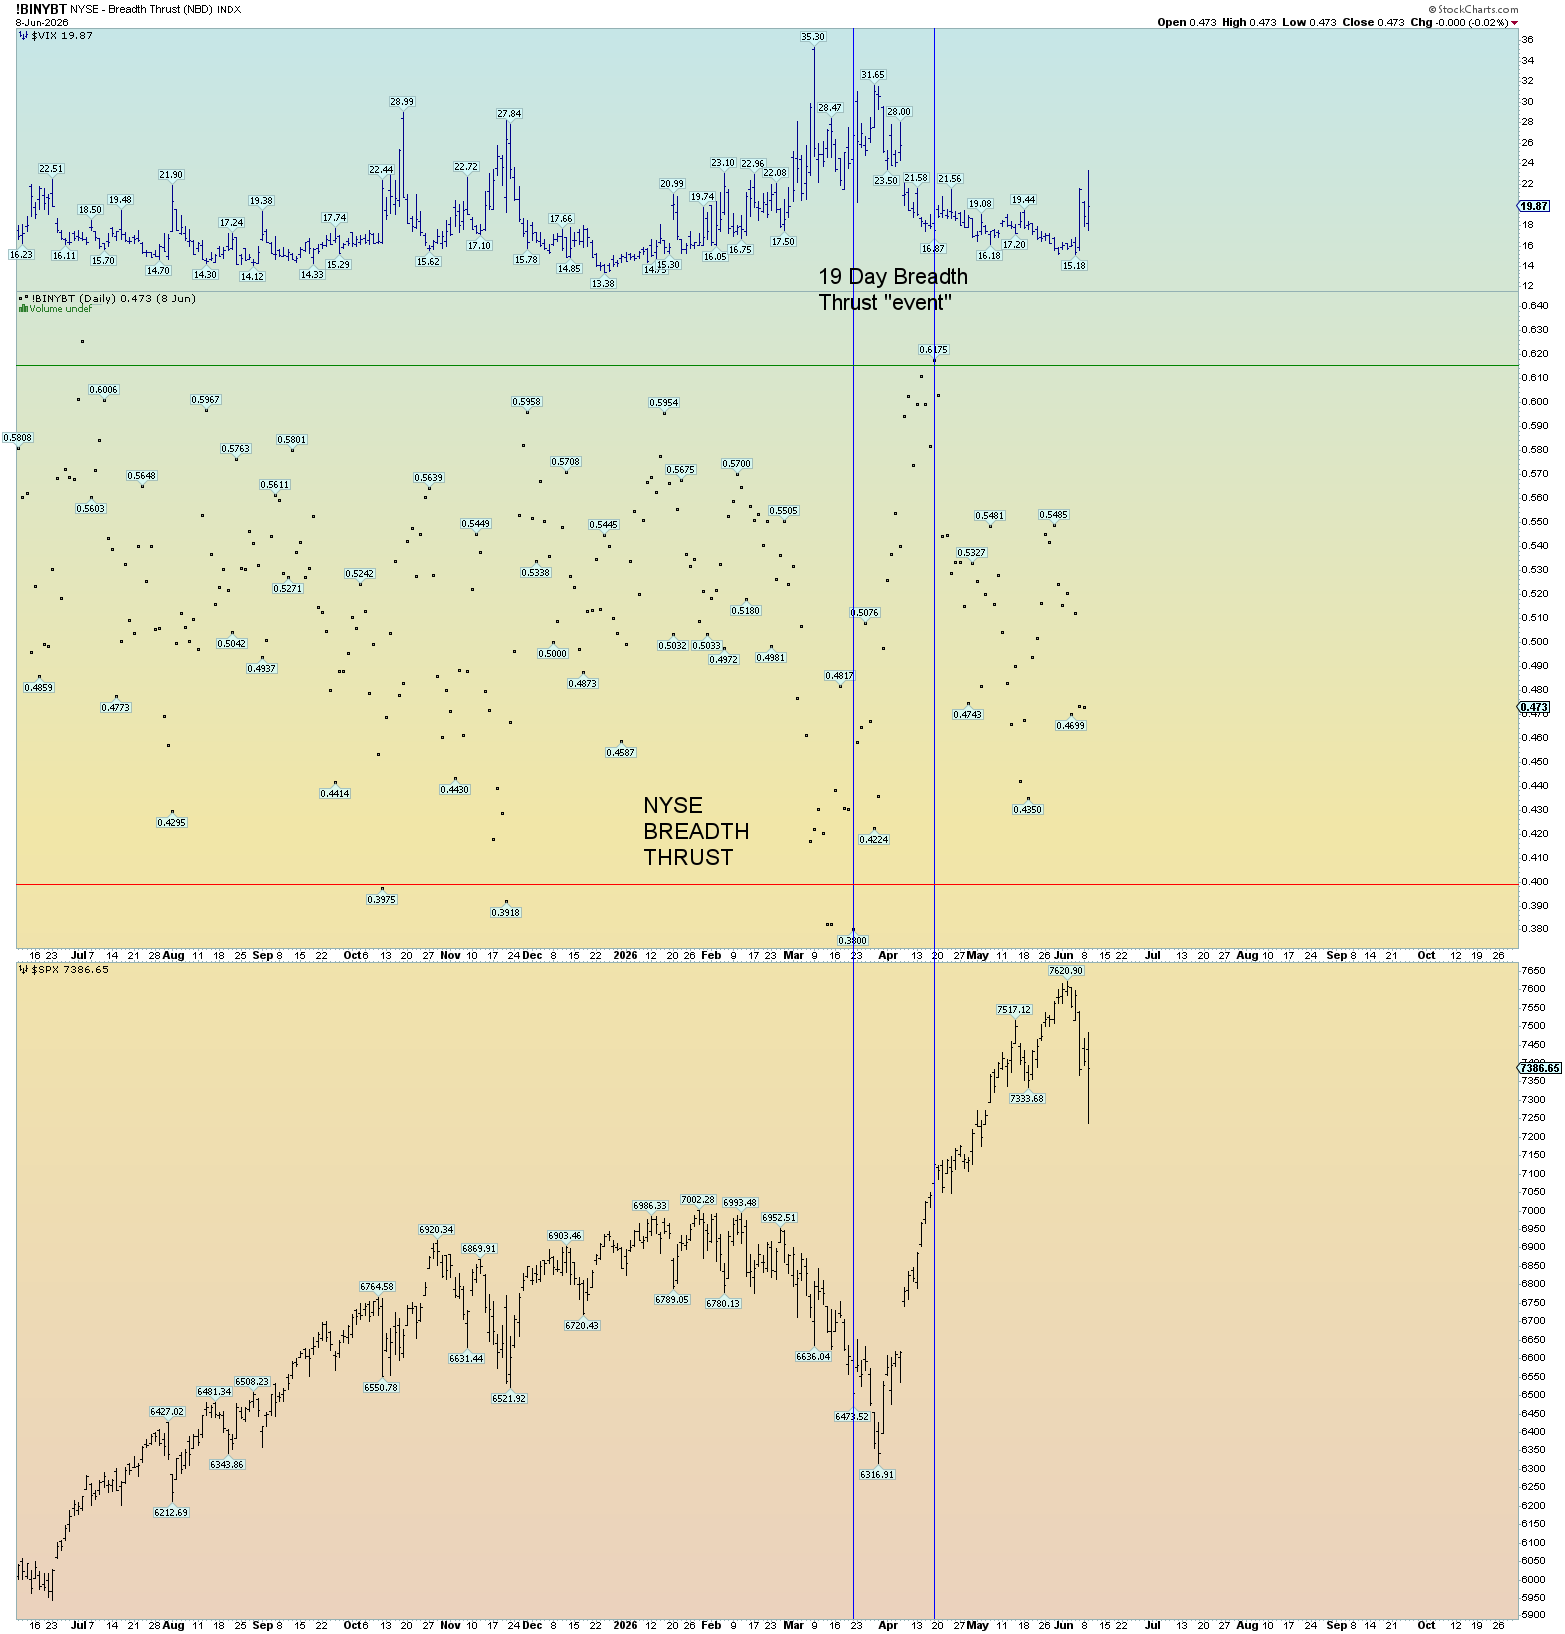
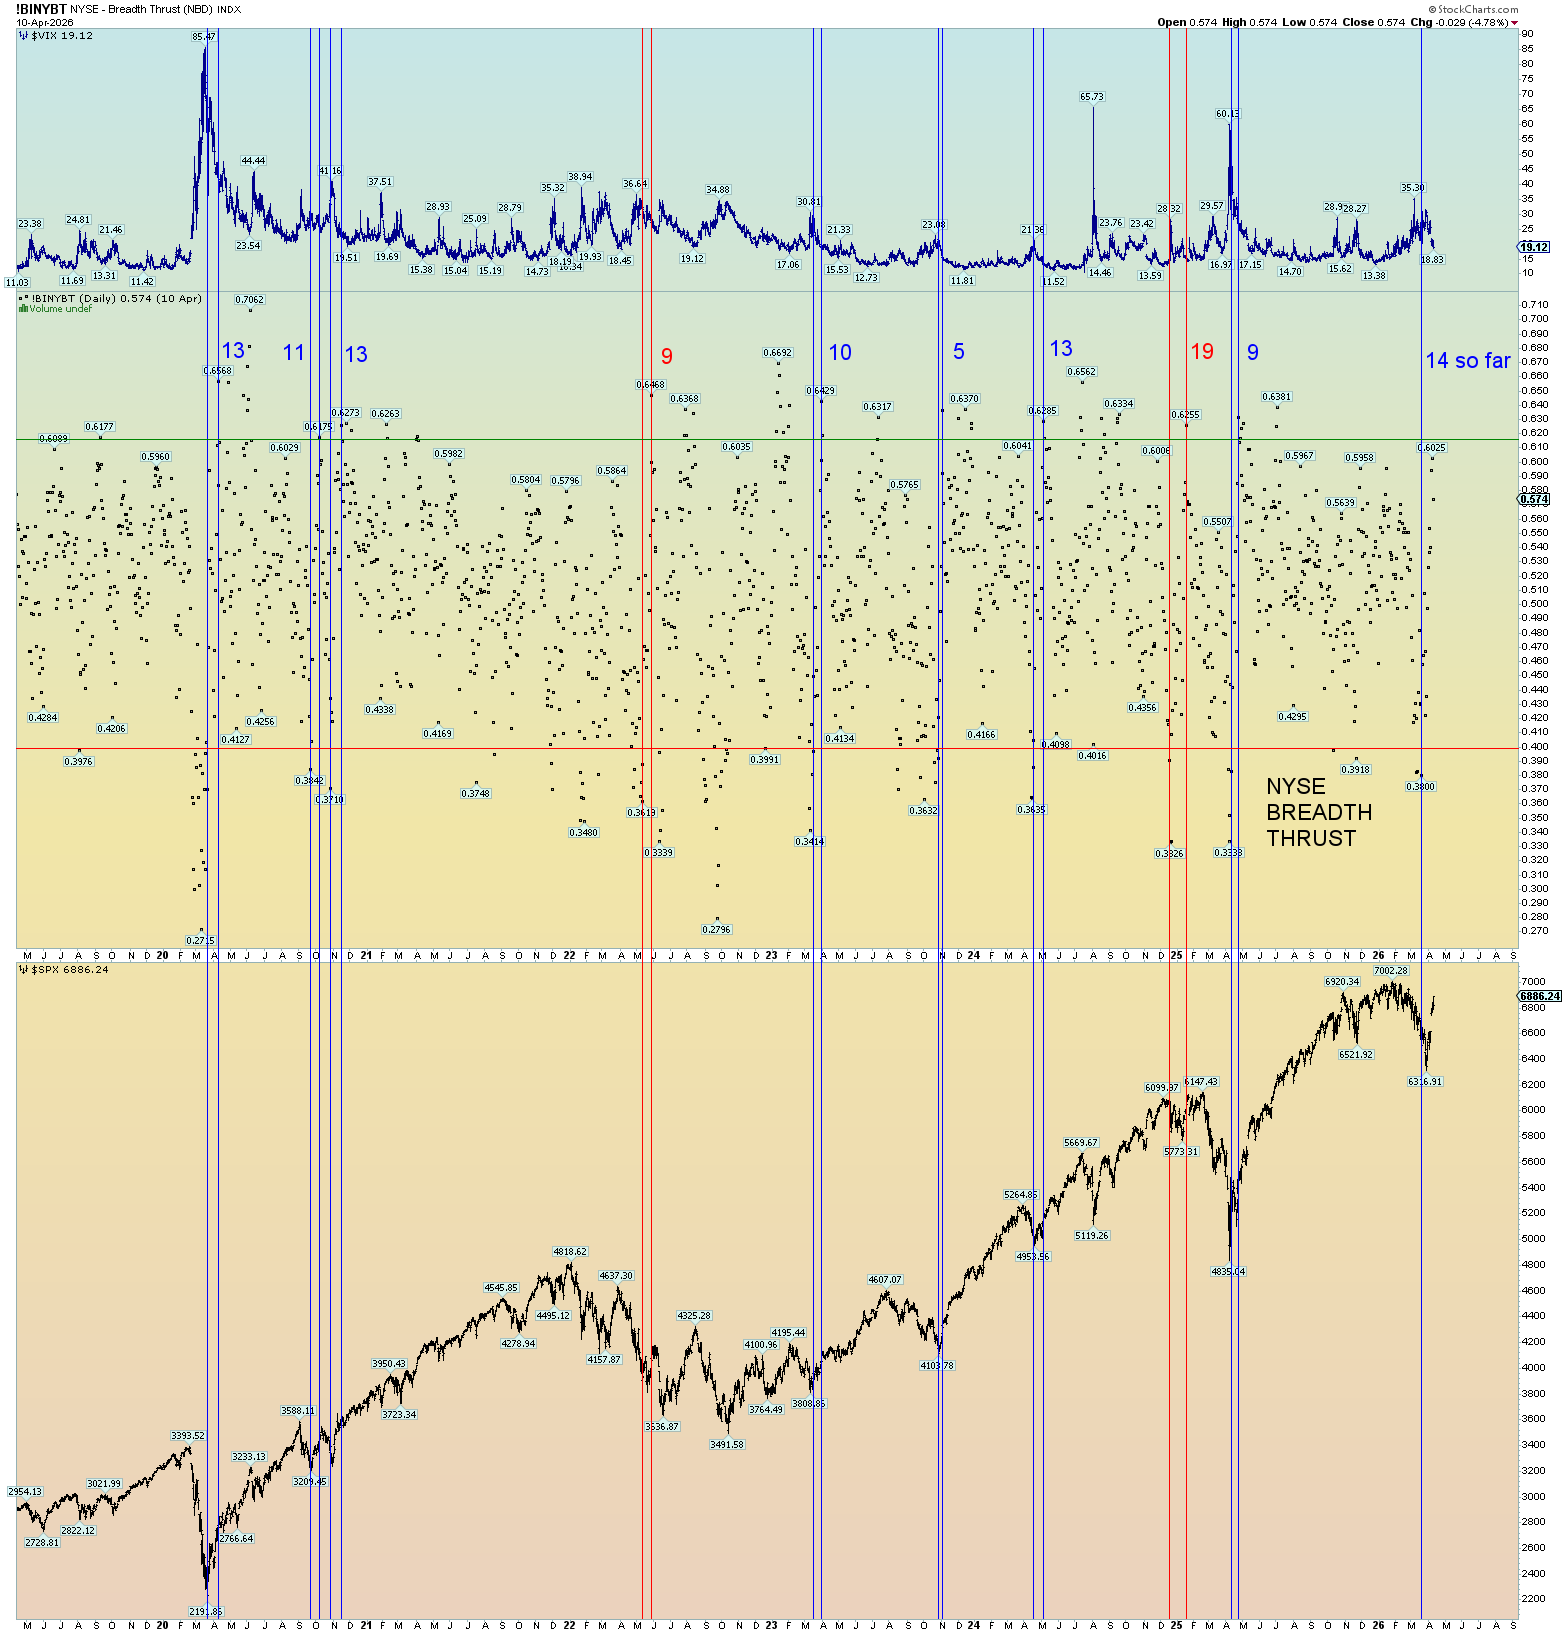
The recent push to all-time highs did not occur with a breadth thrust event per se. 19 days is not really an event. In the past corrections, we have had significant events. So, this aligns with a possible top soon.
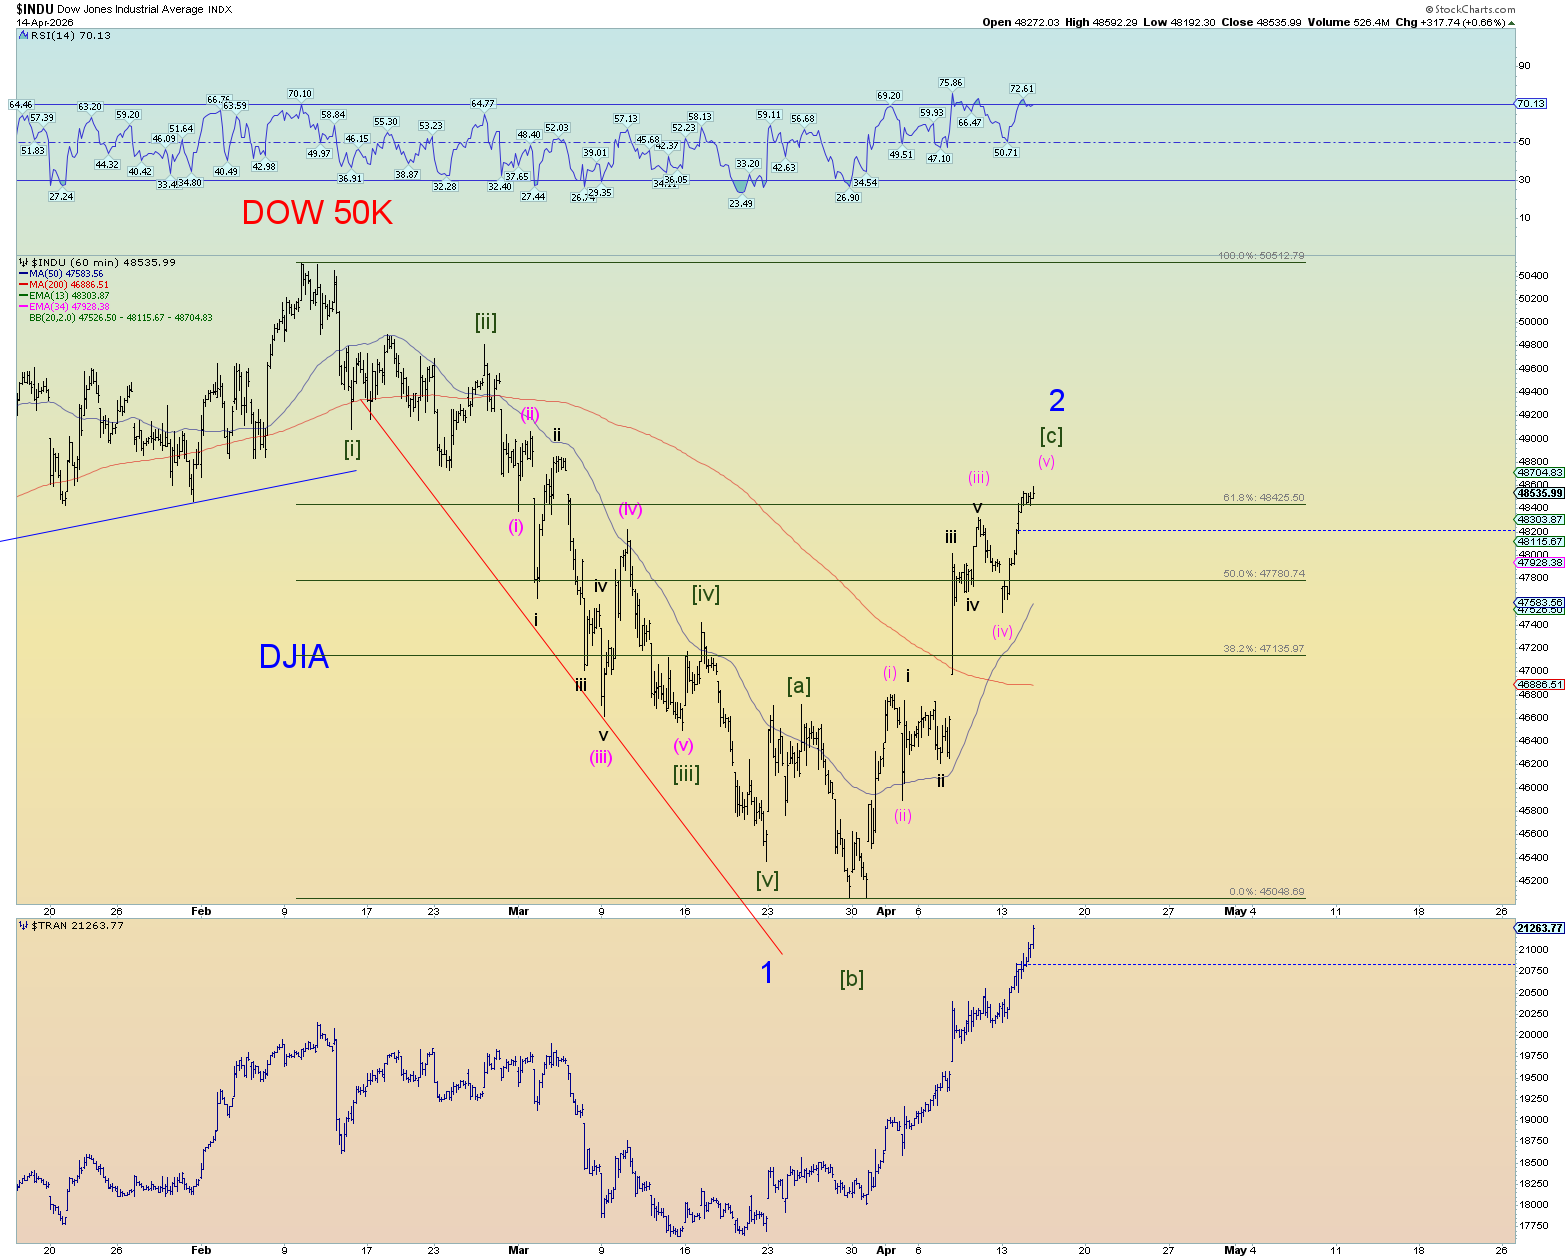
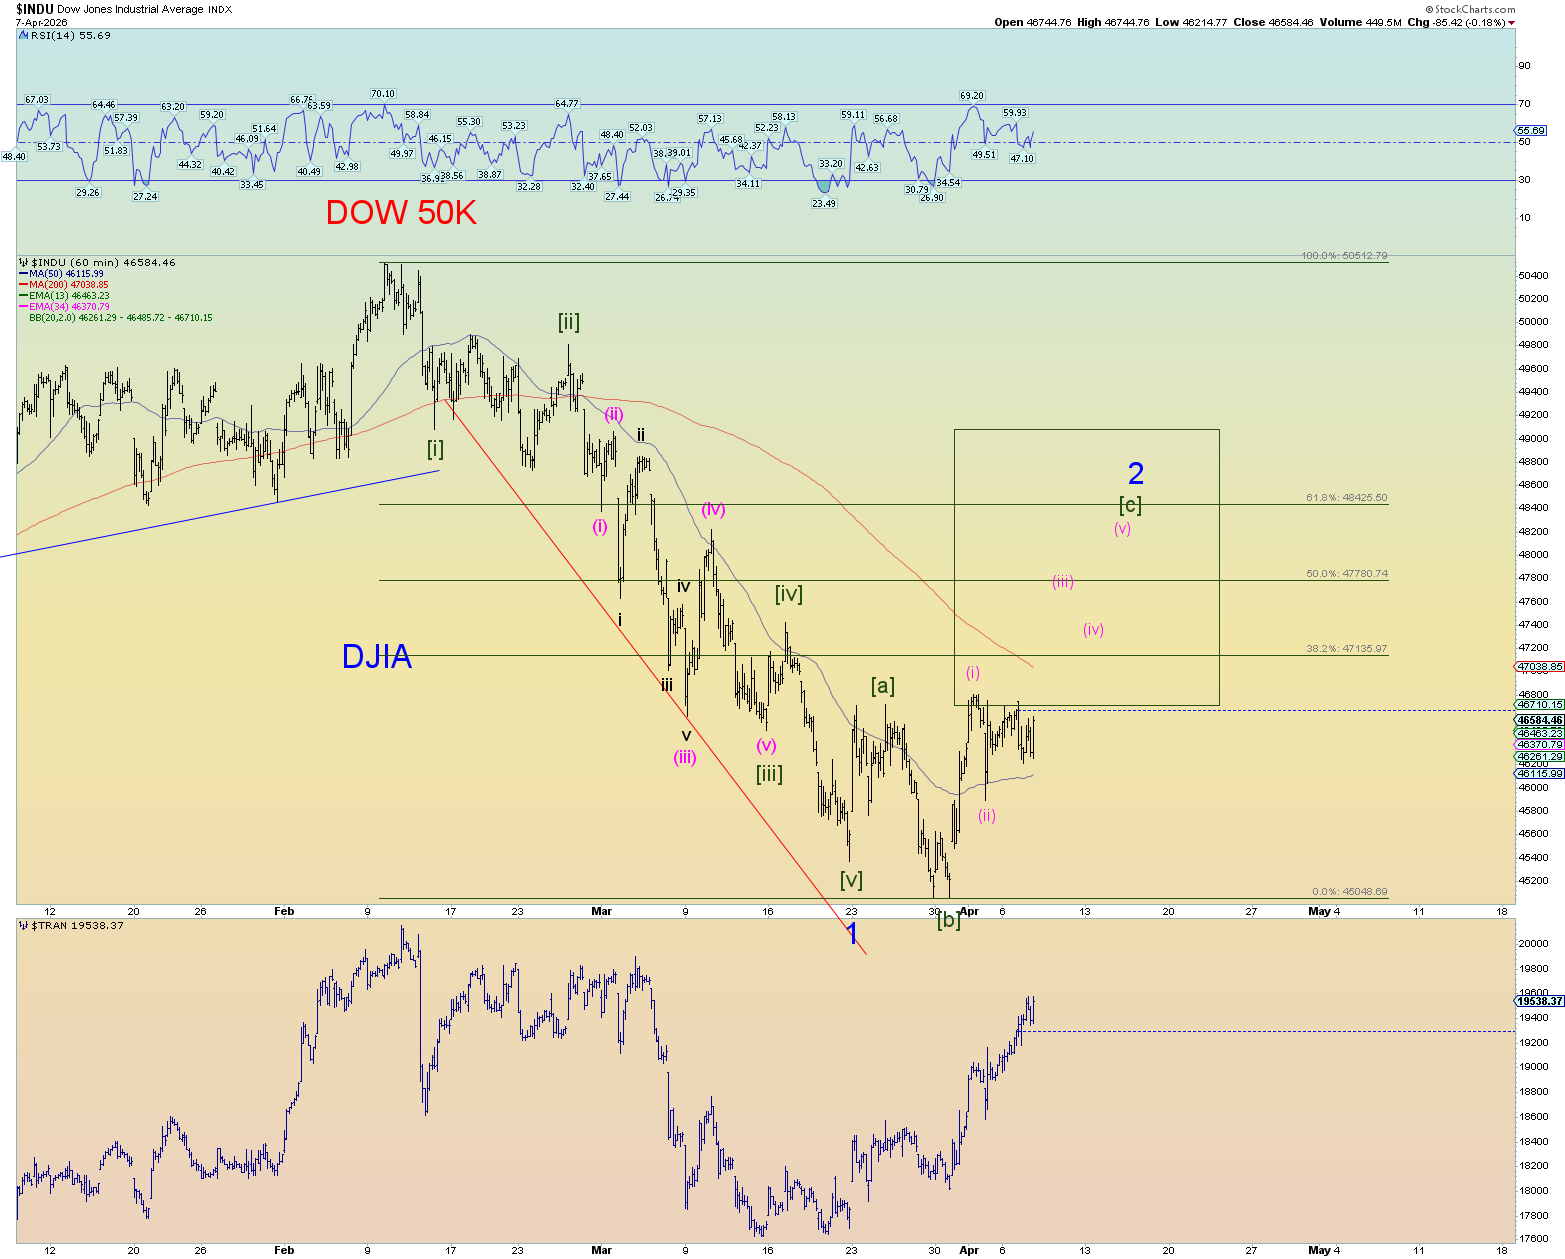
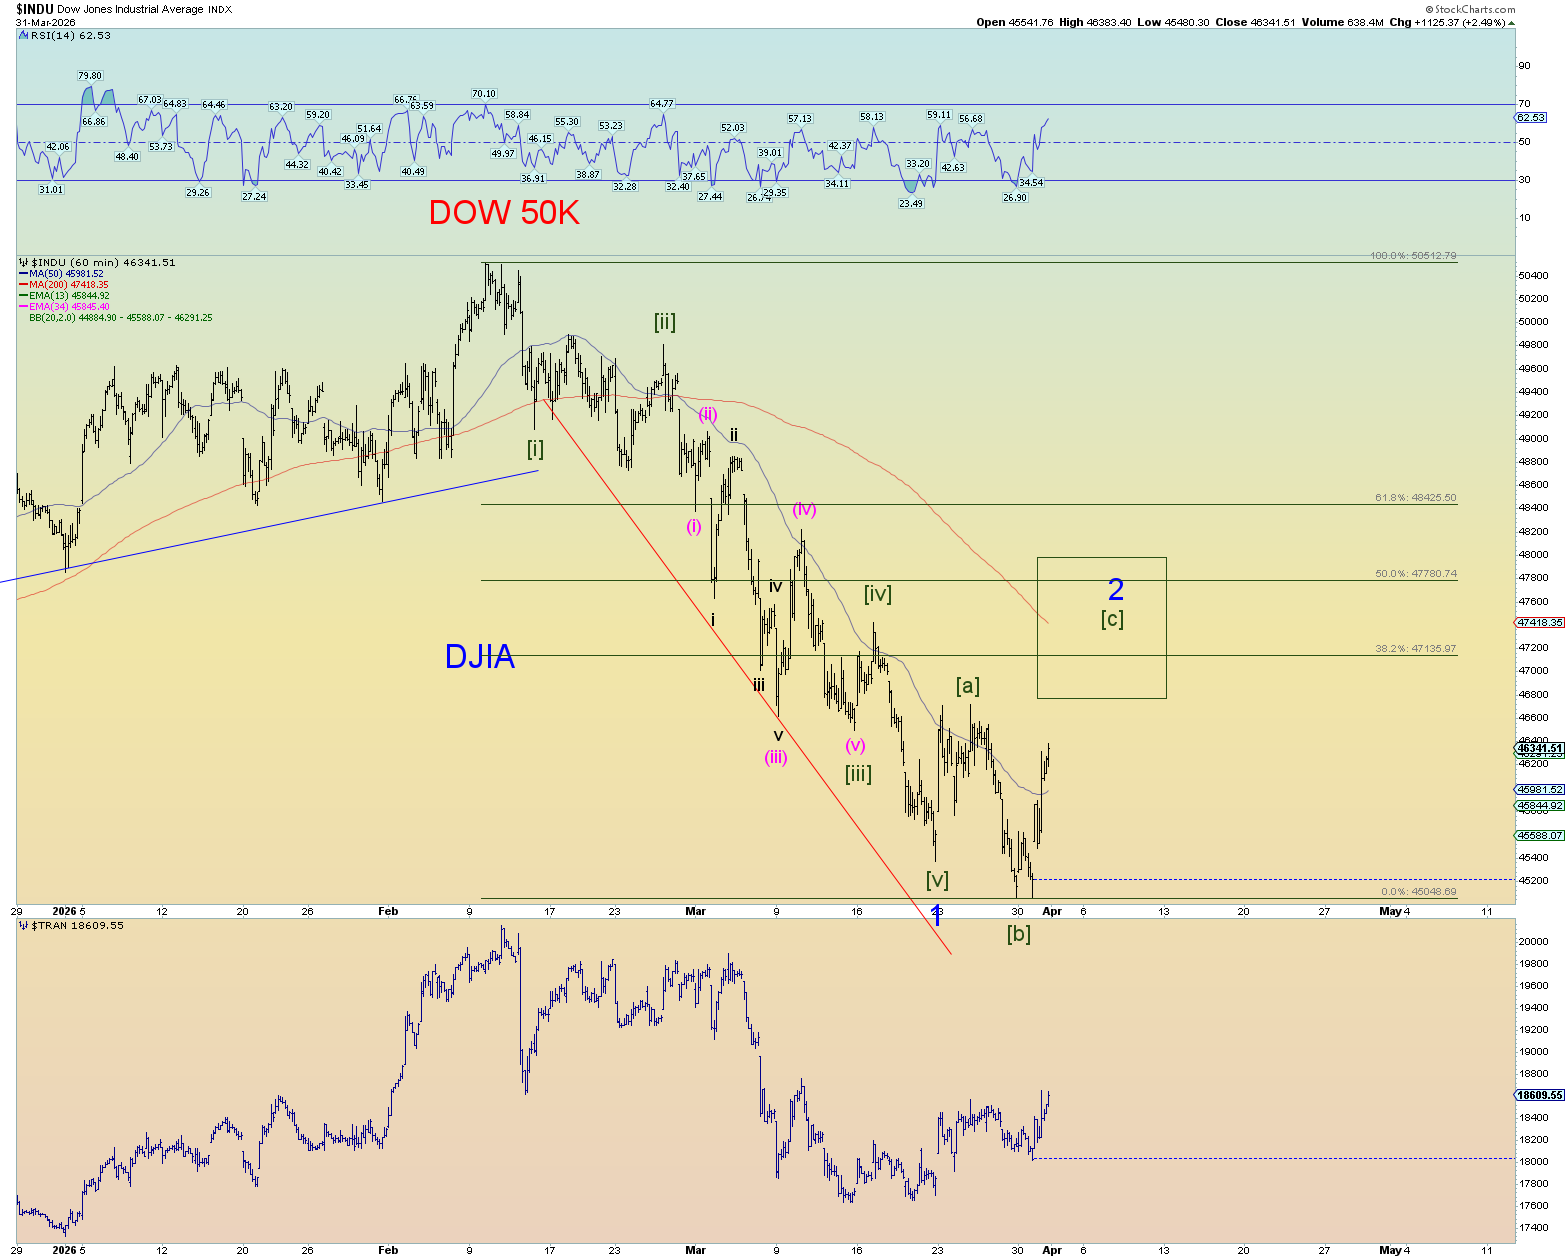
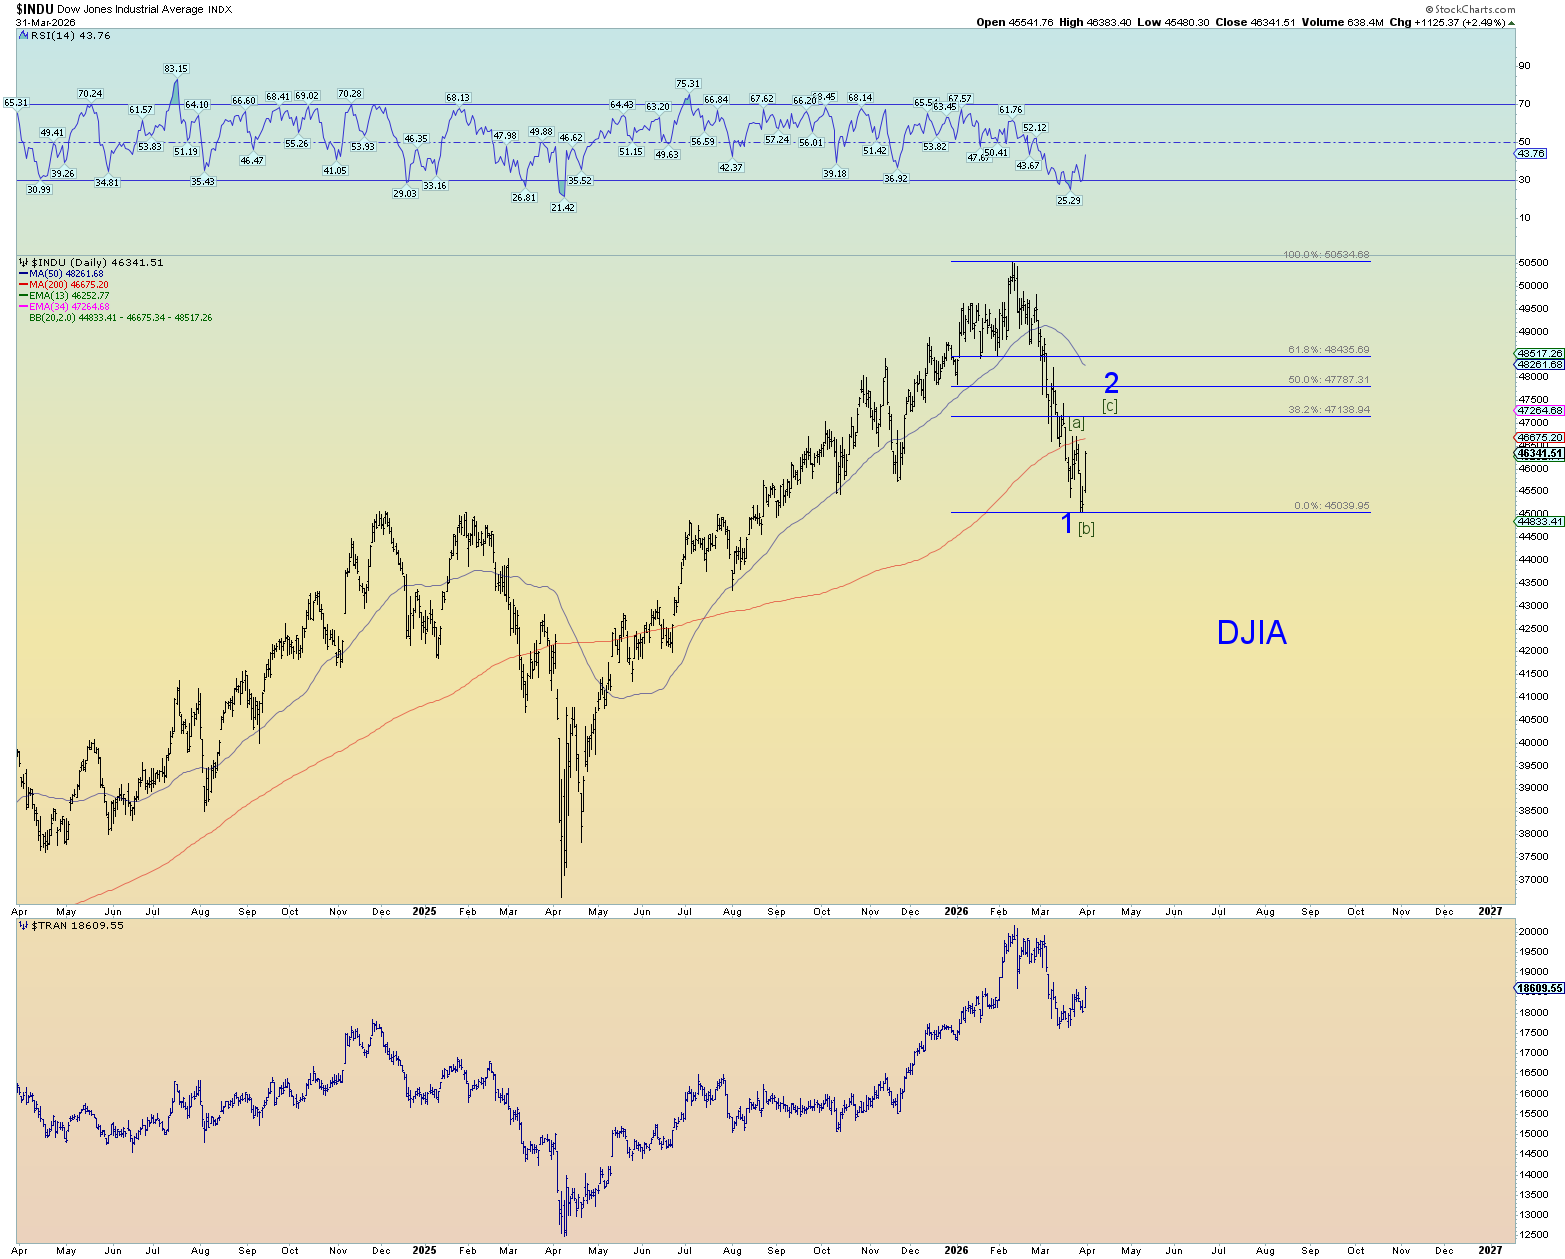
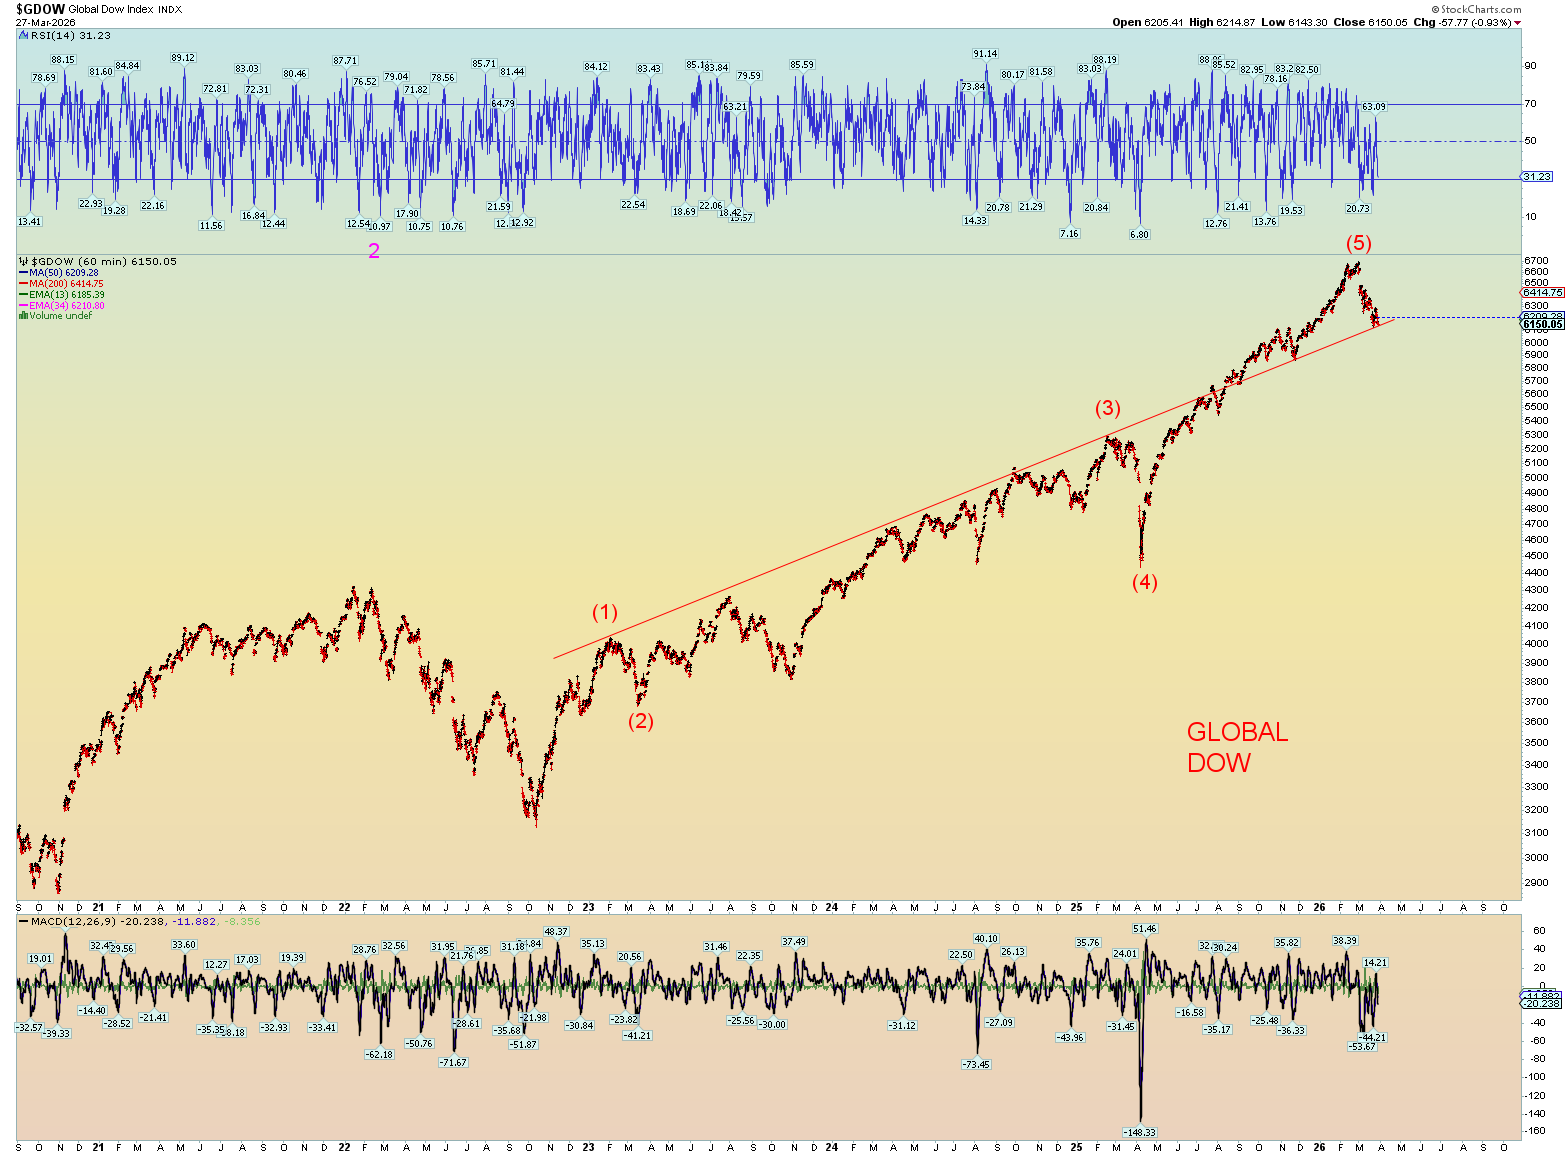
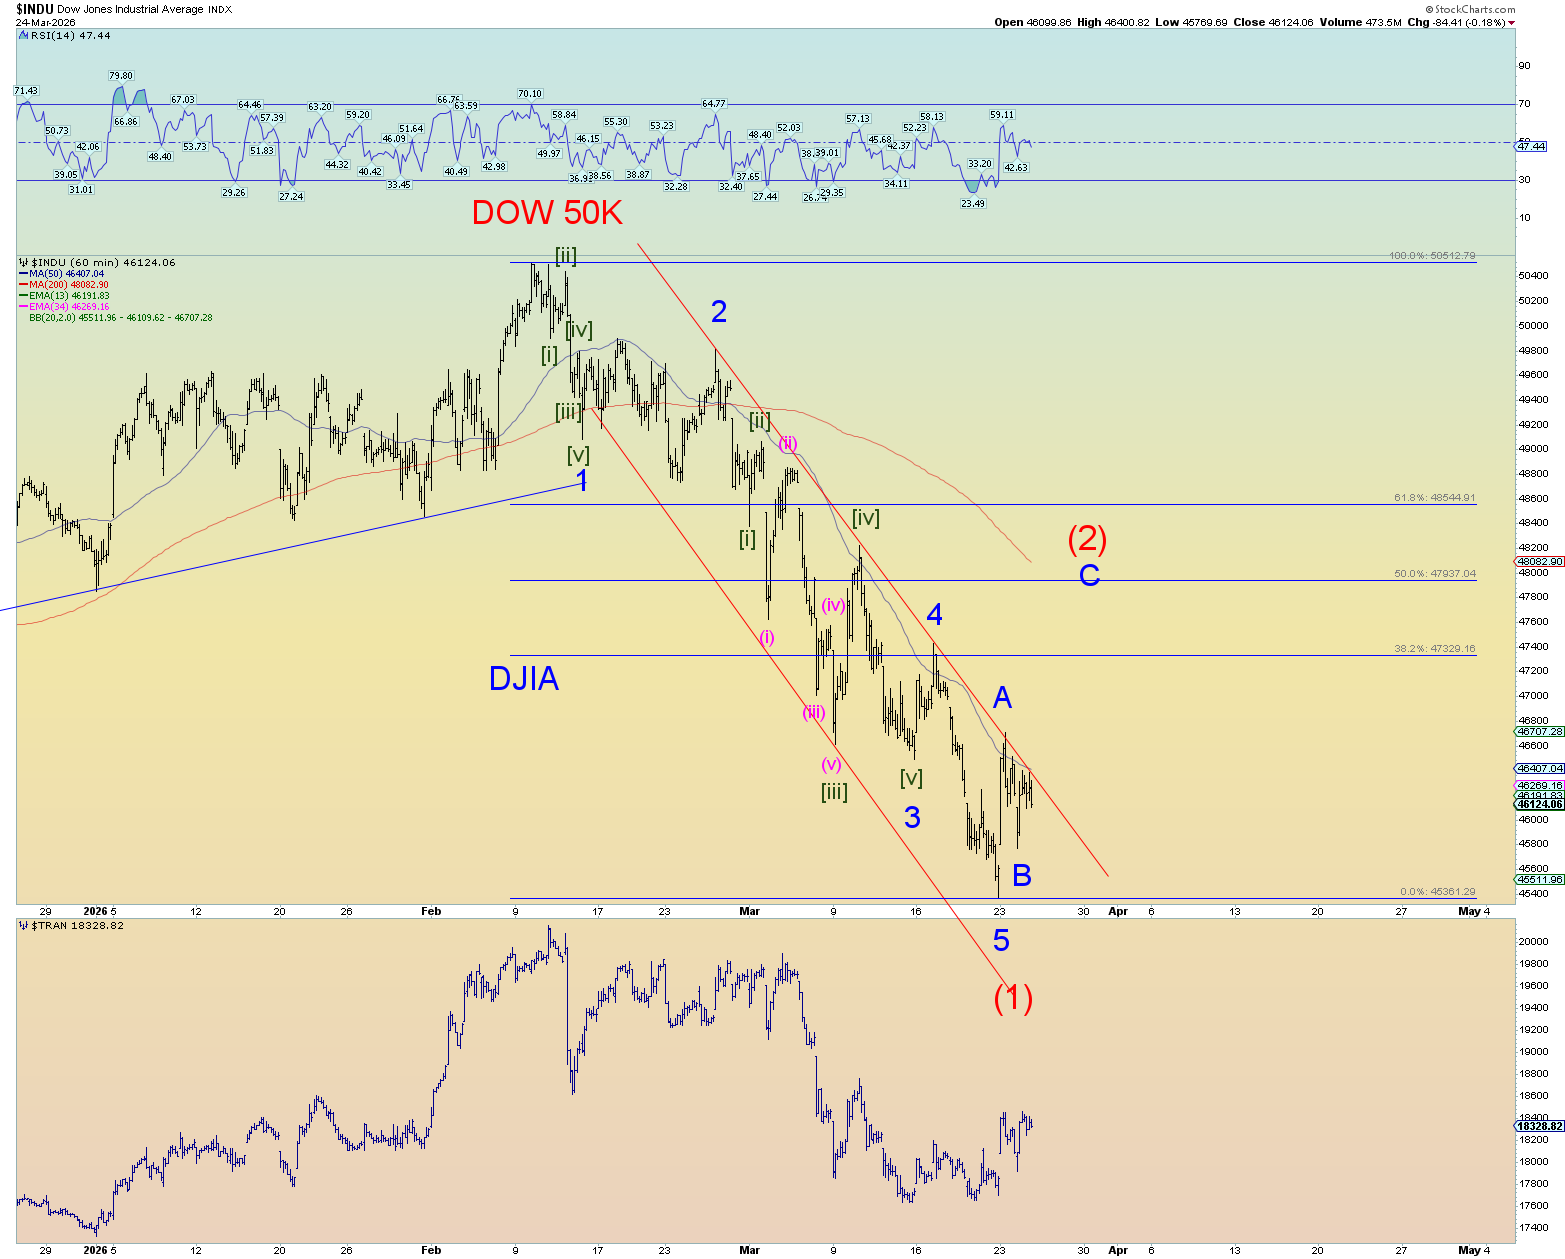
From the DJIA standpoint, this second wave retracement is reasonable.
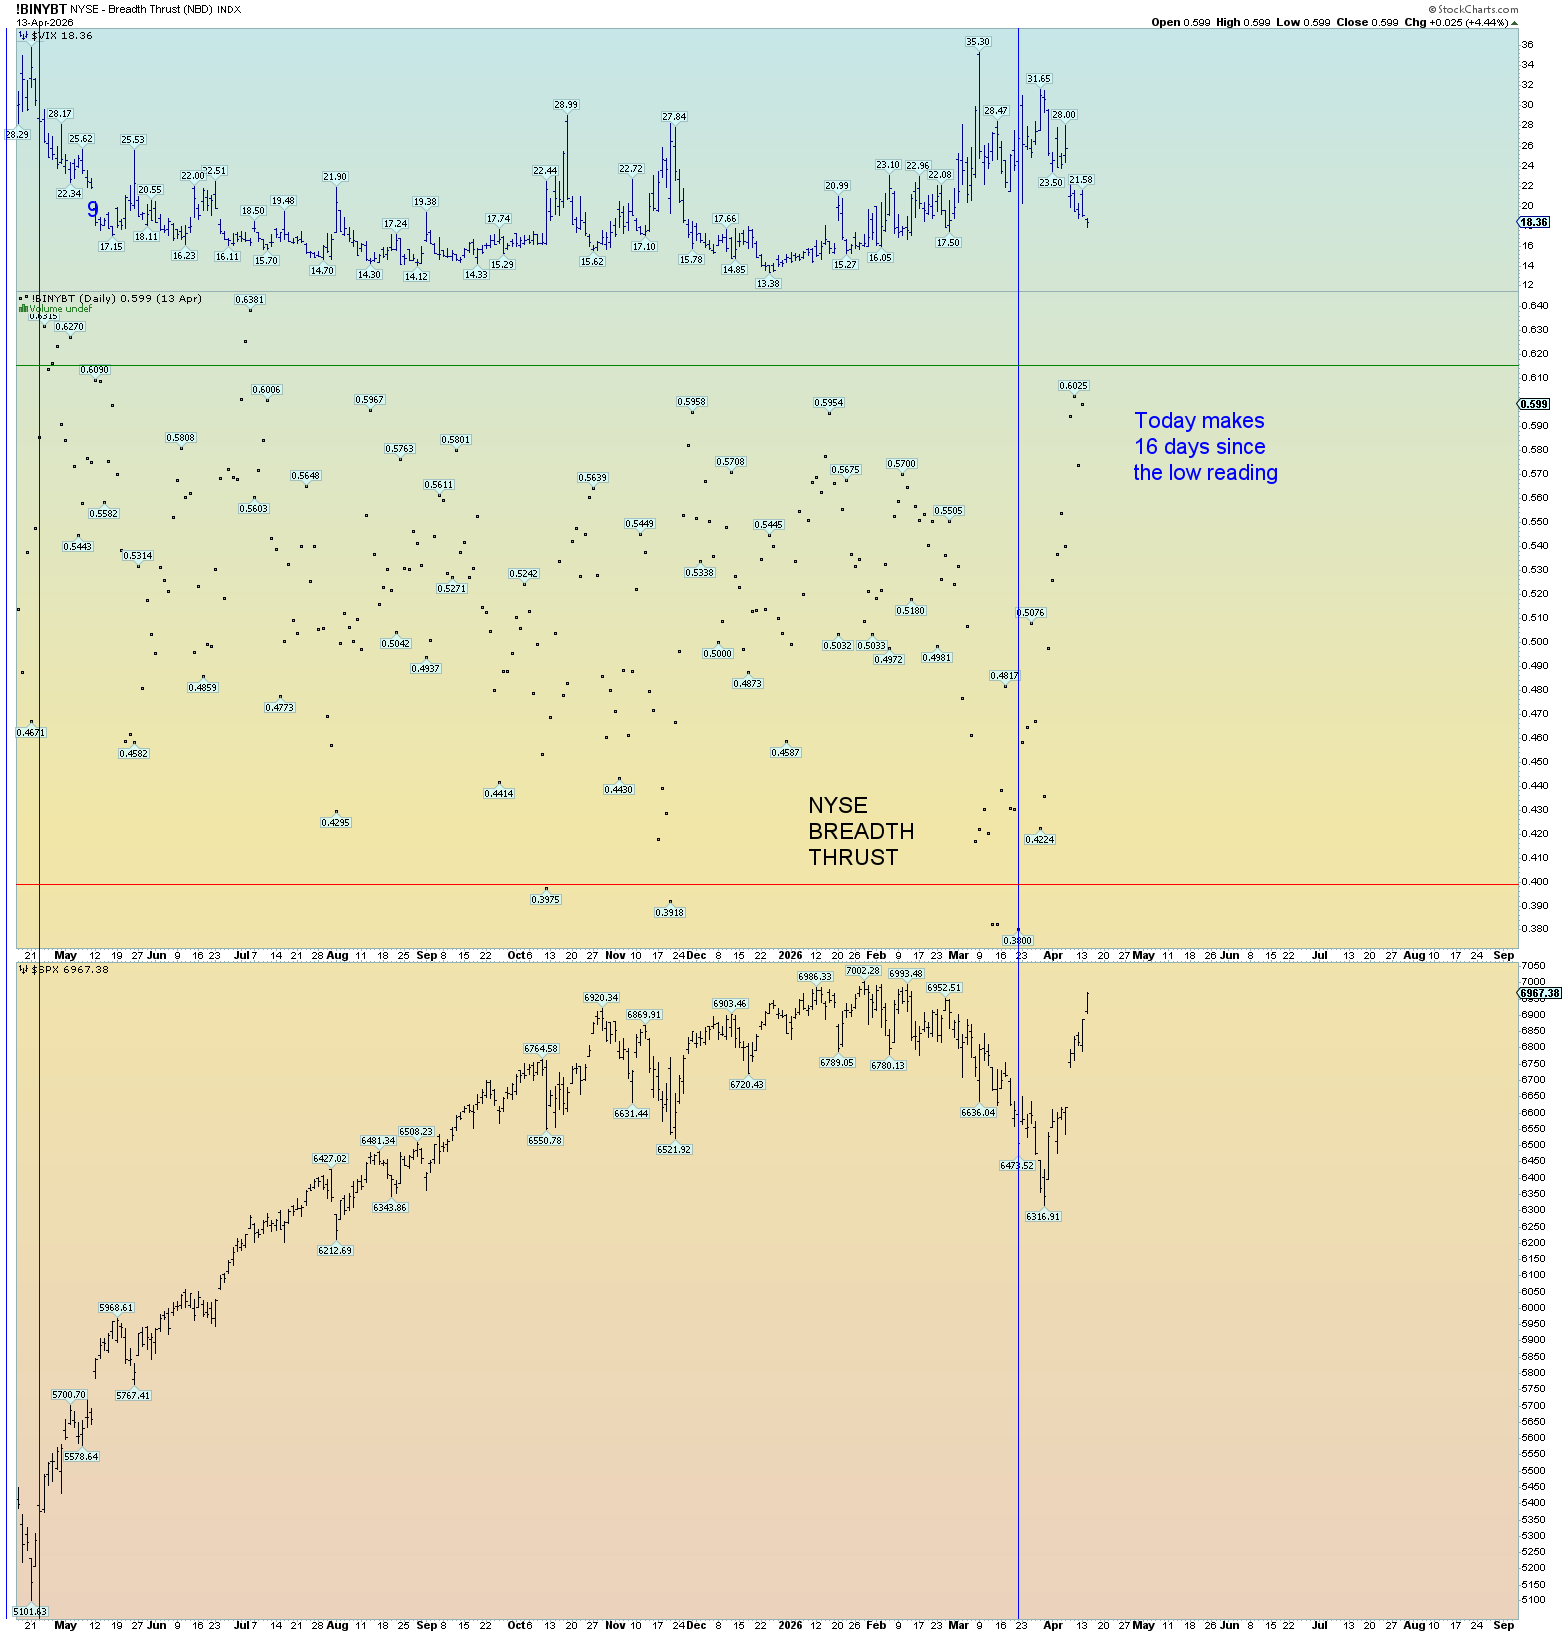
This is reflected in the non-breadth thrust situation on the NYSE. Today is the 16th day. If it finished over 61.5, that is not really a significant “breadth thrust” event. But it’s something. I won’t have the data until tomorrow.
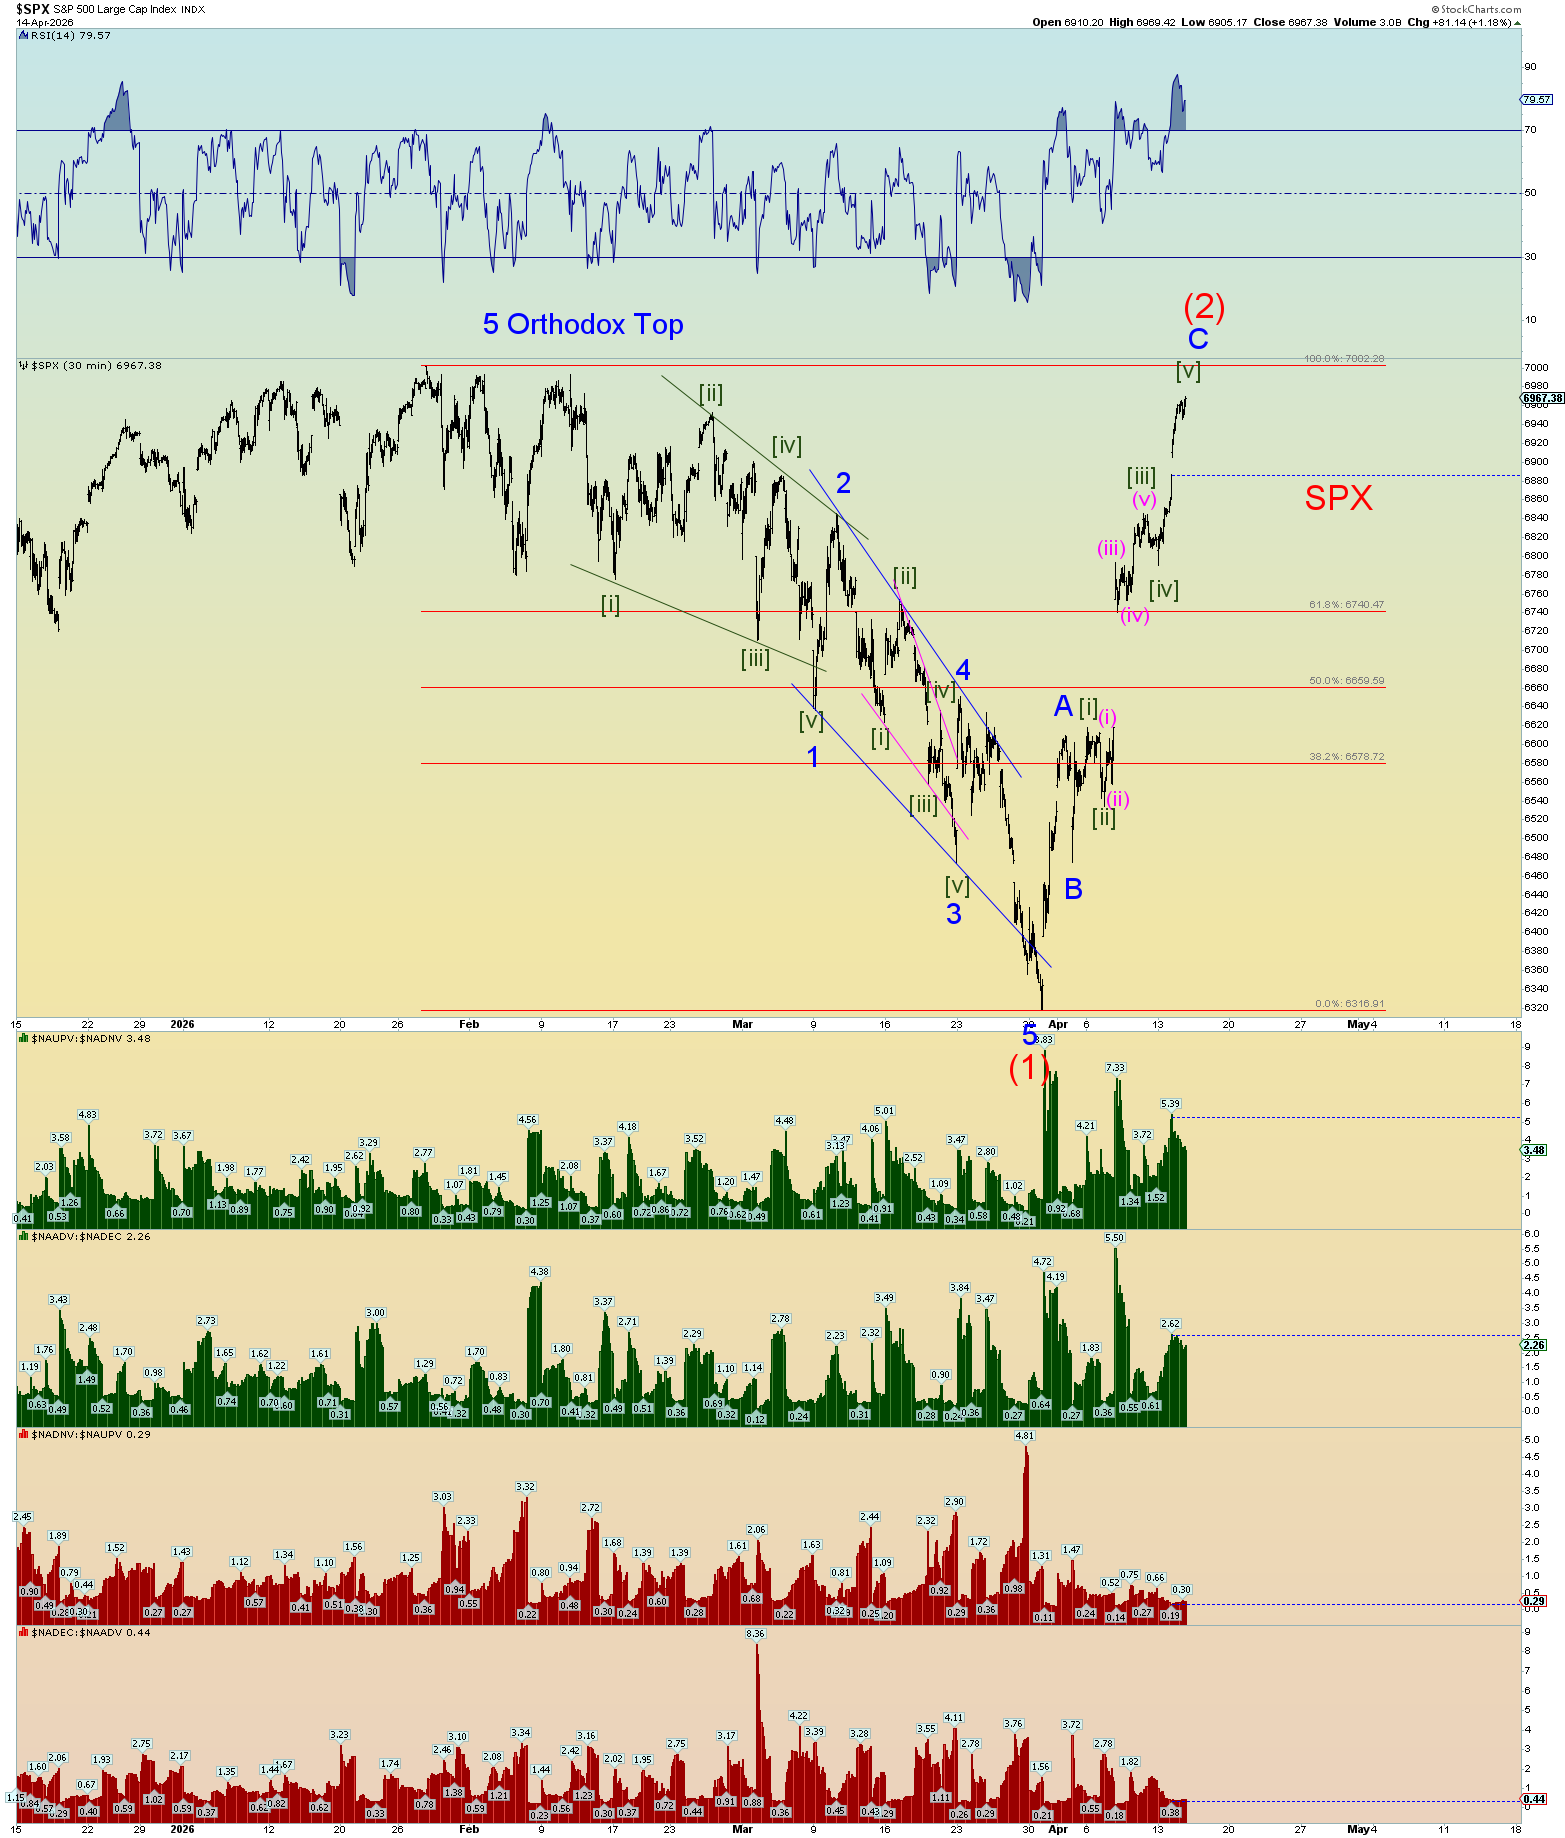
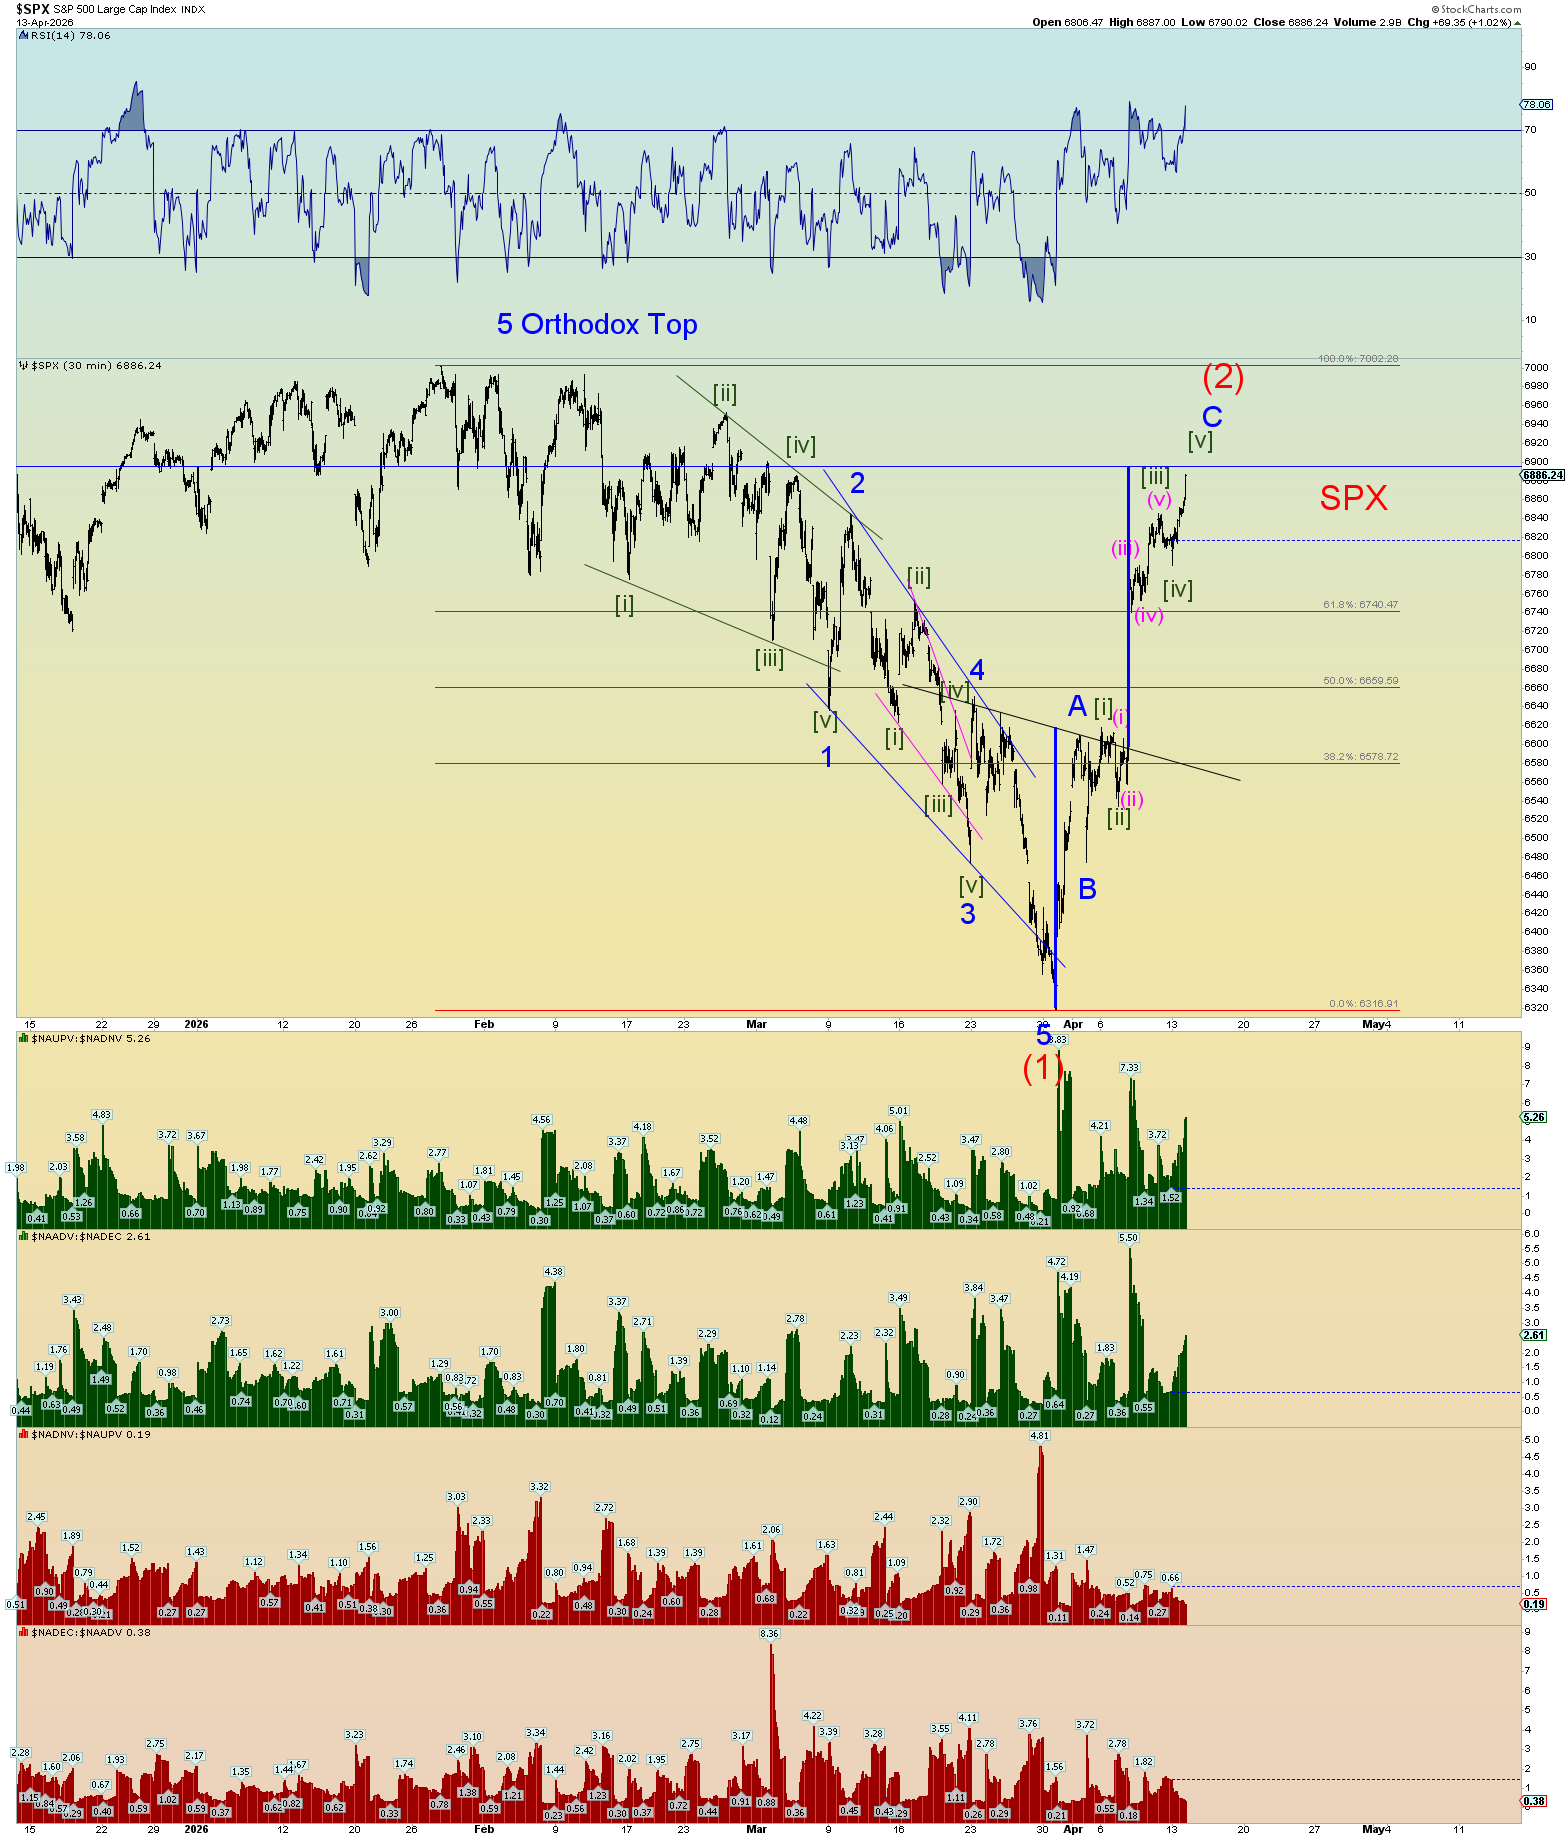
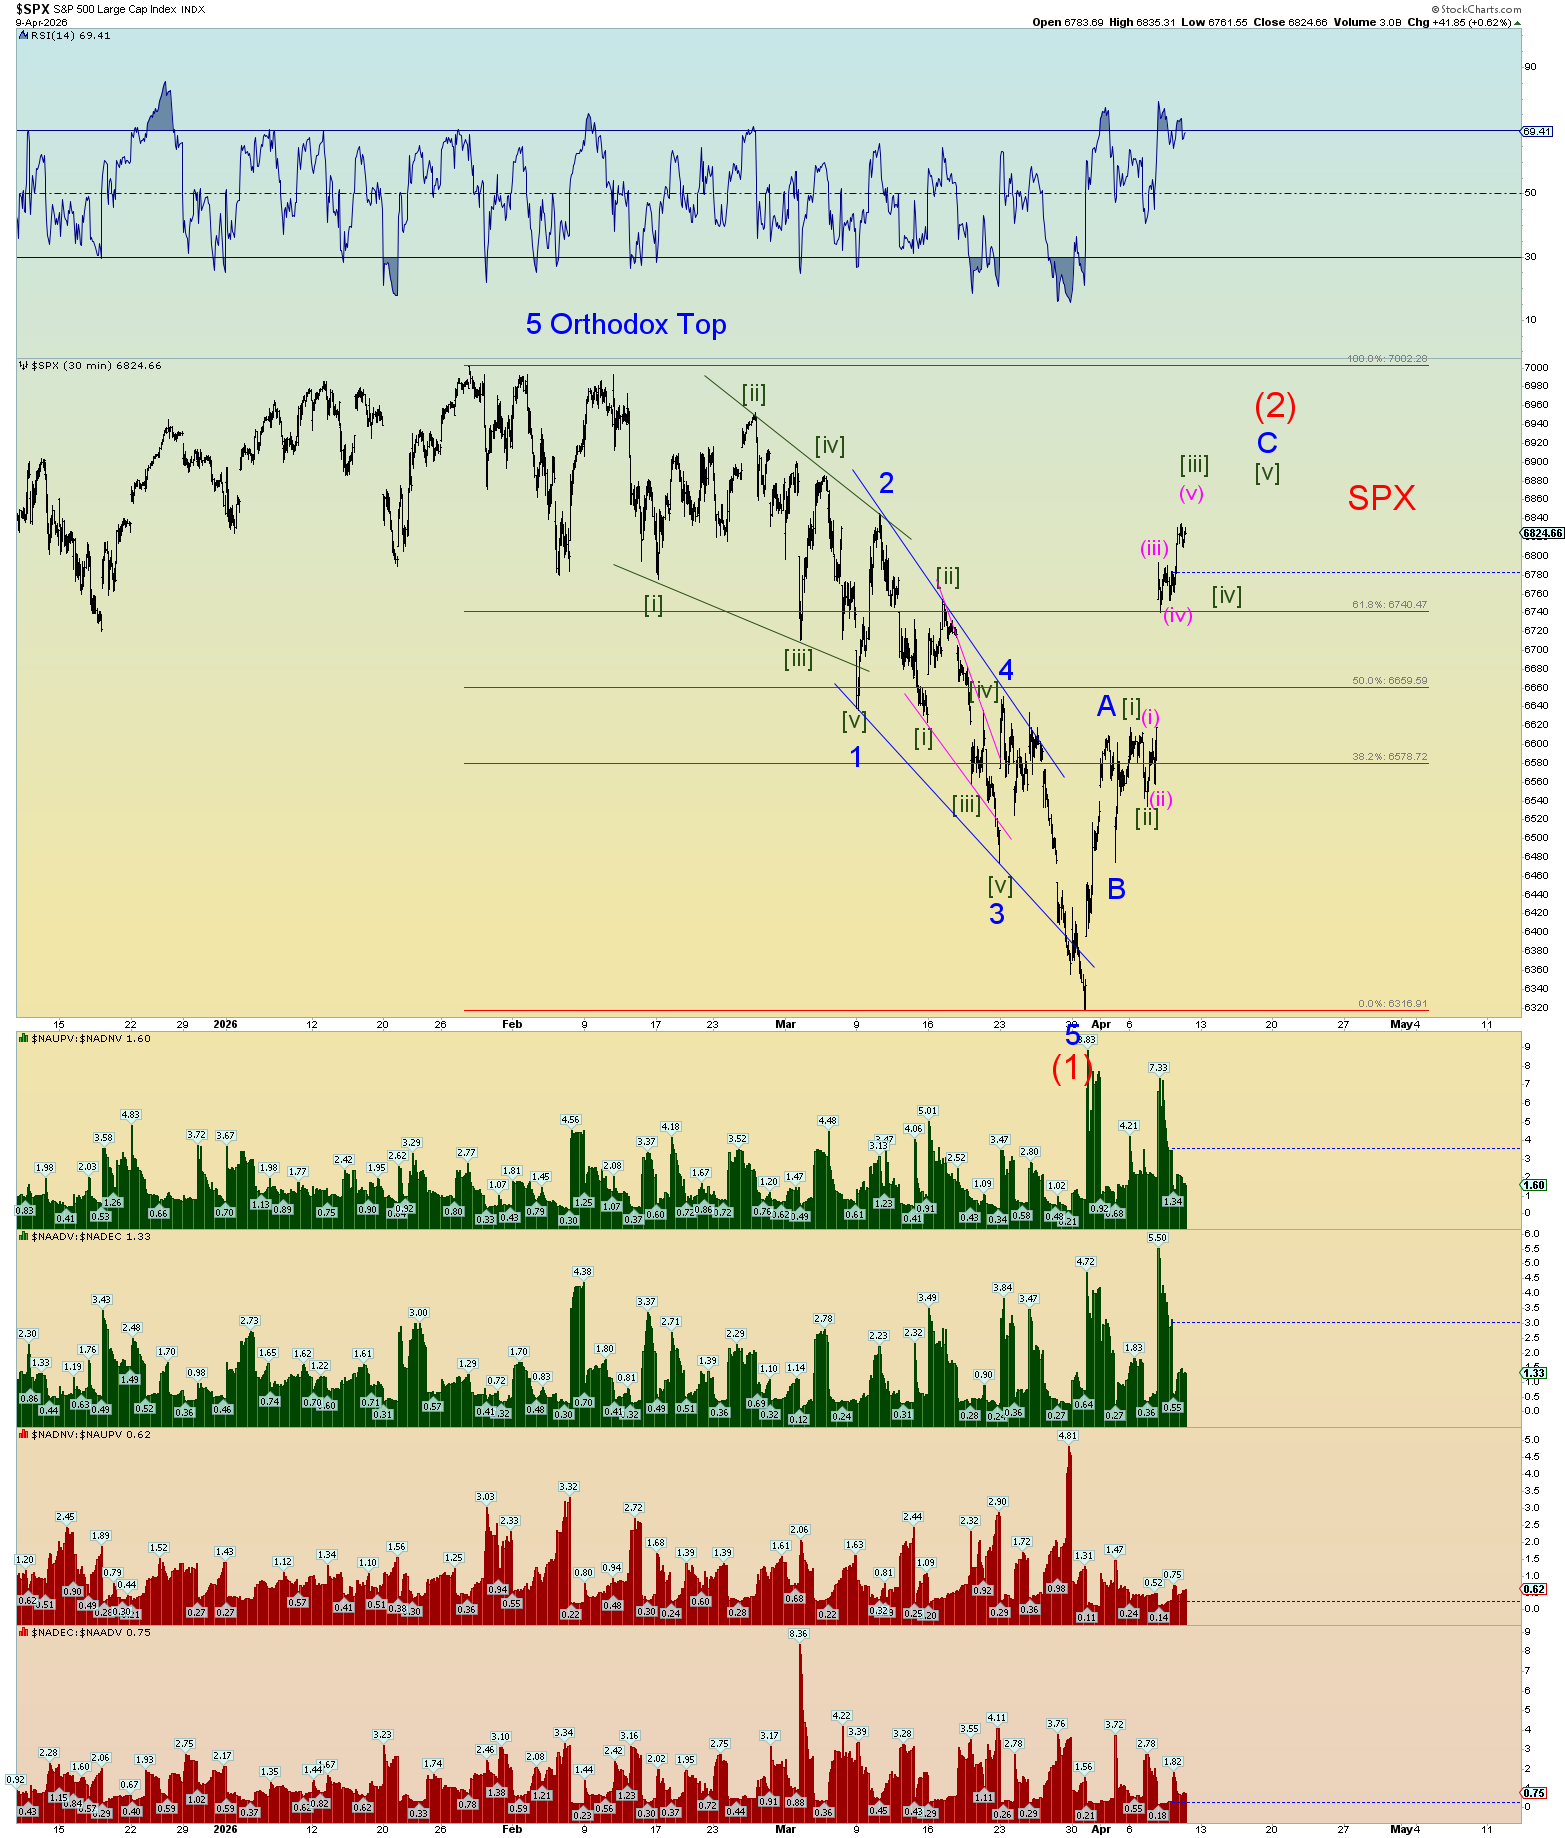
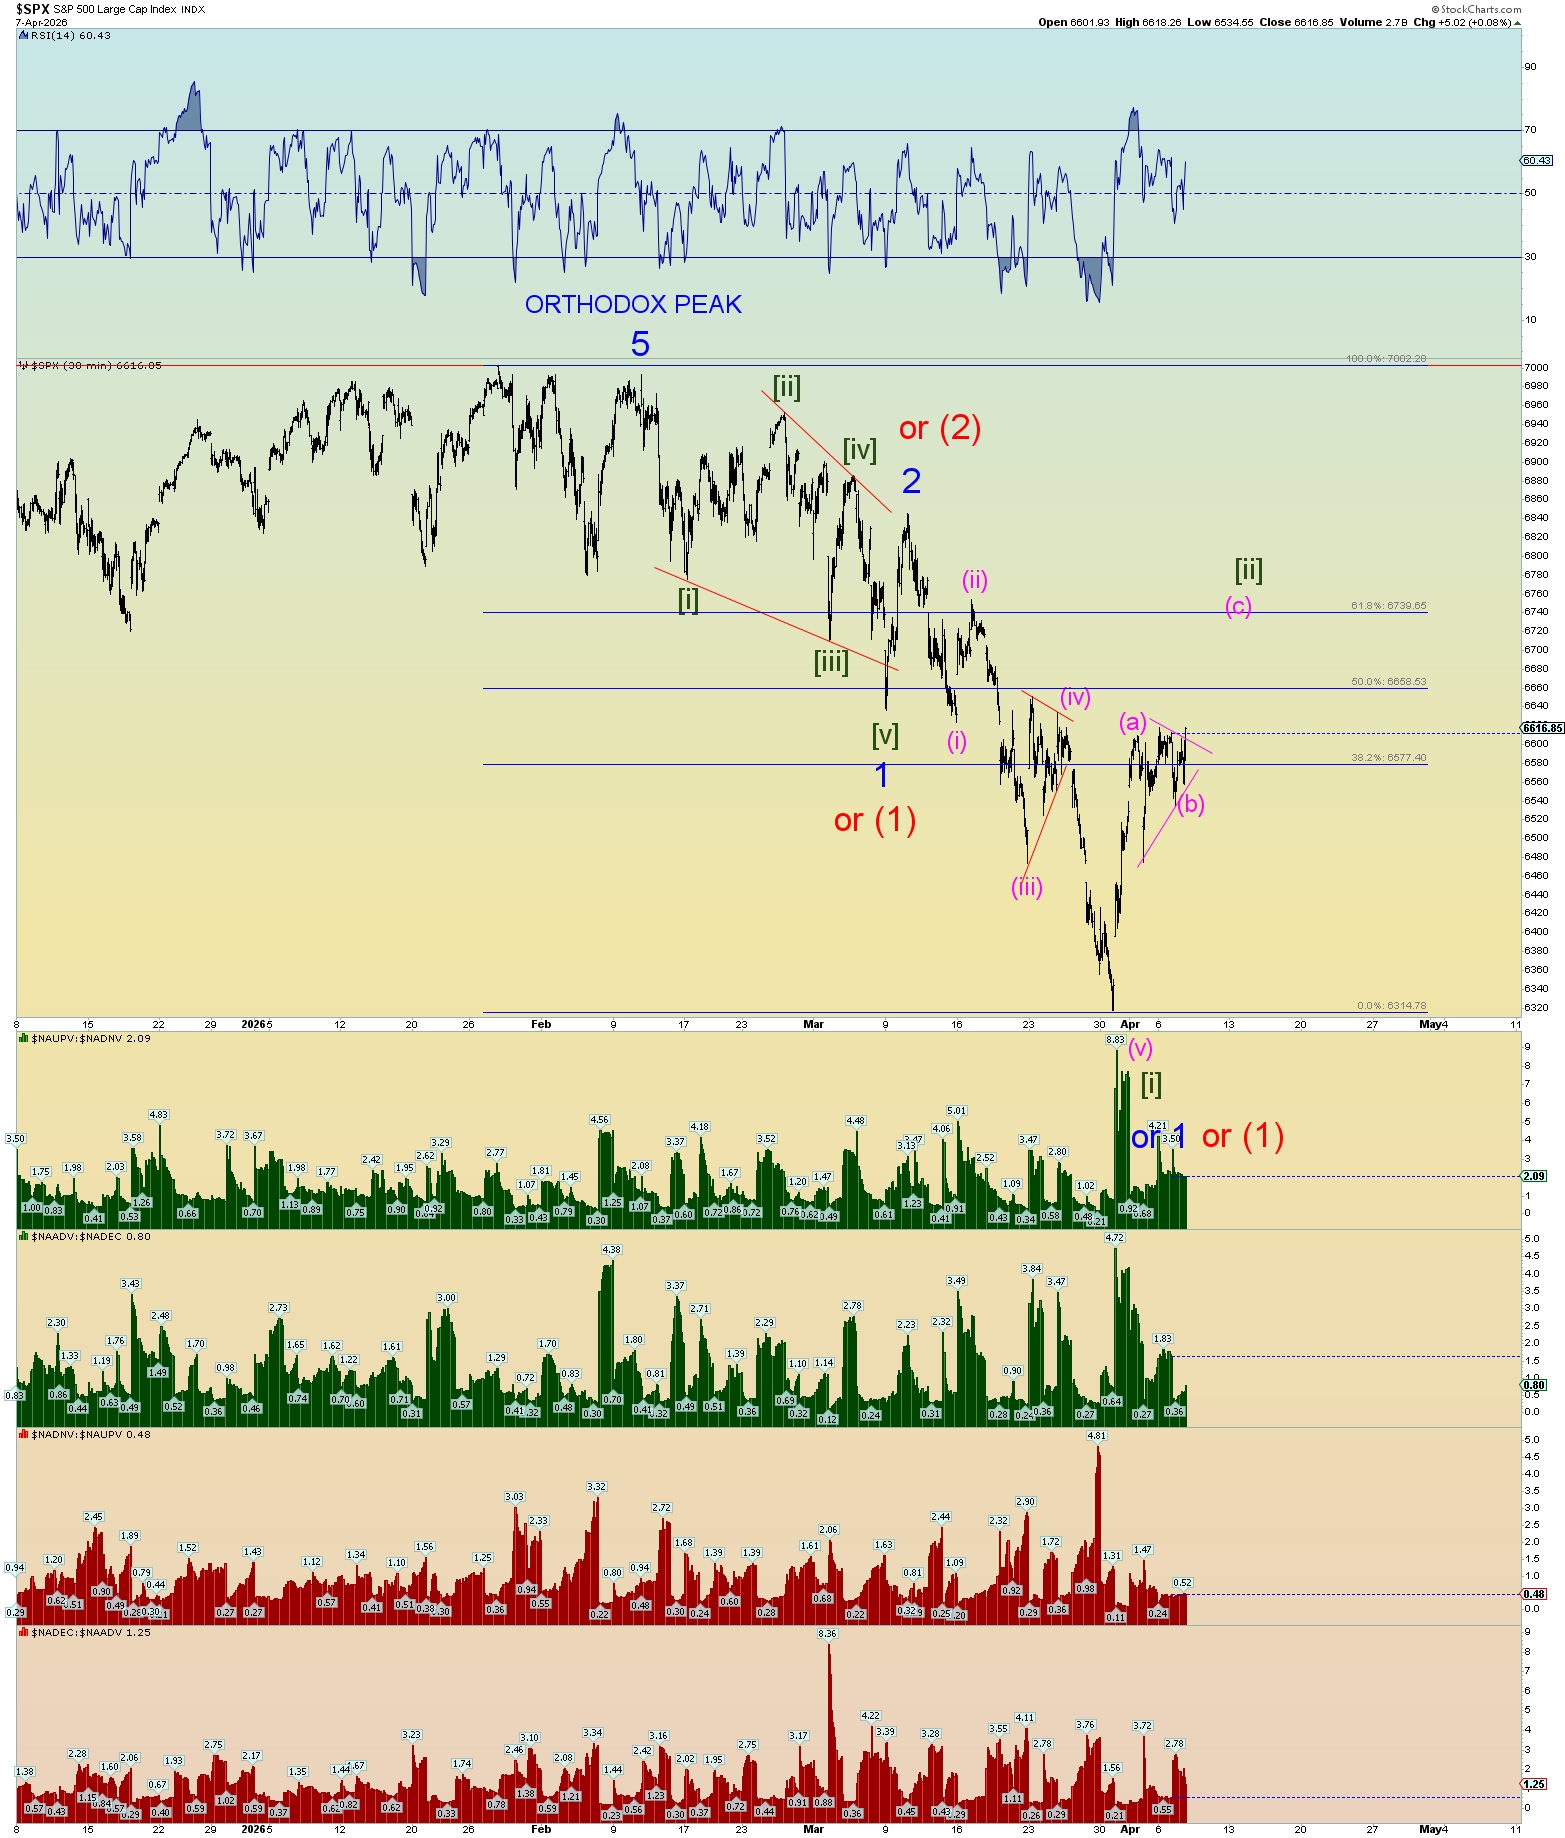
Yeah, we’ve reached the limit for wave (2) up. It’s probably not wave (2) up.
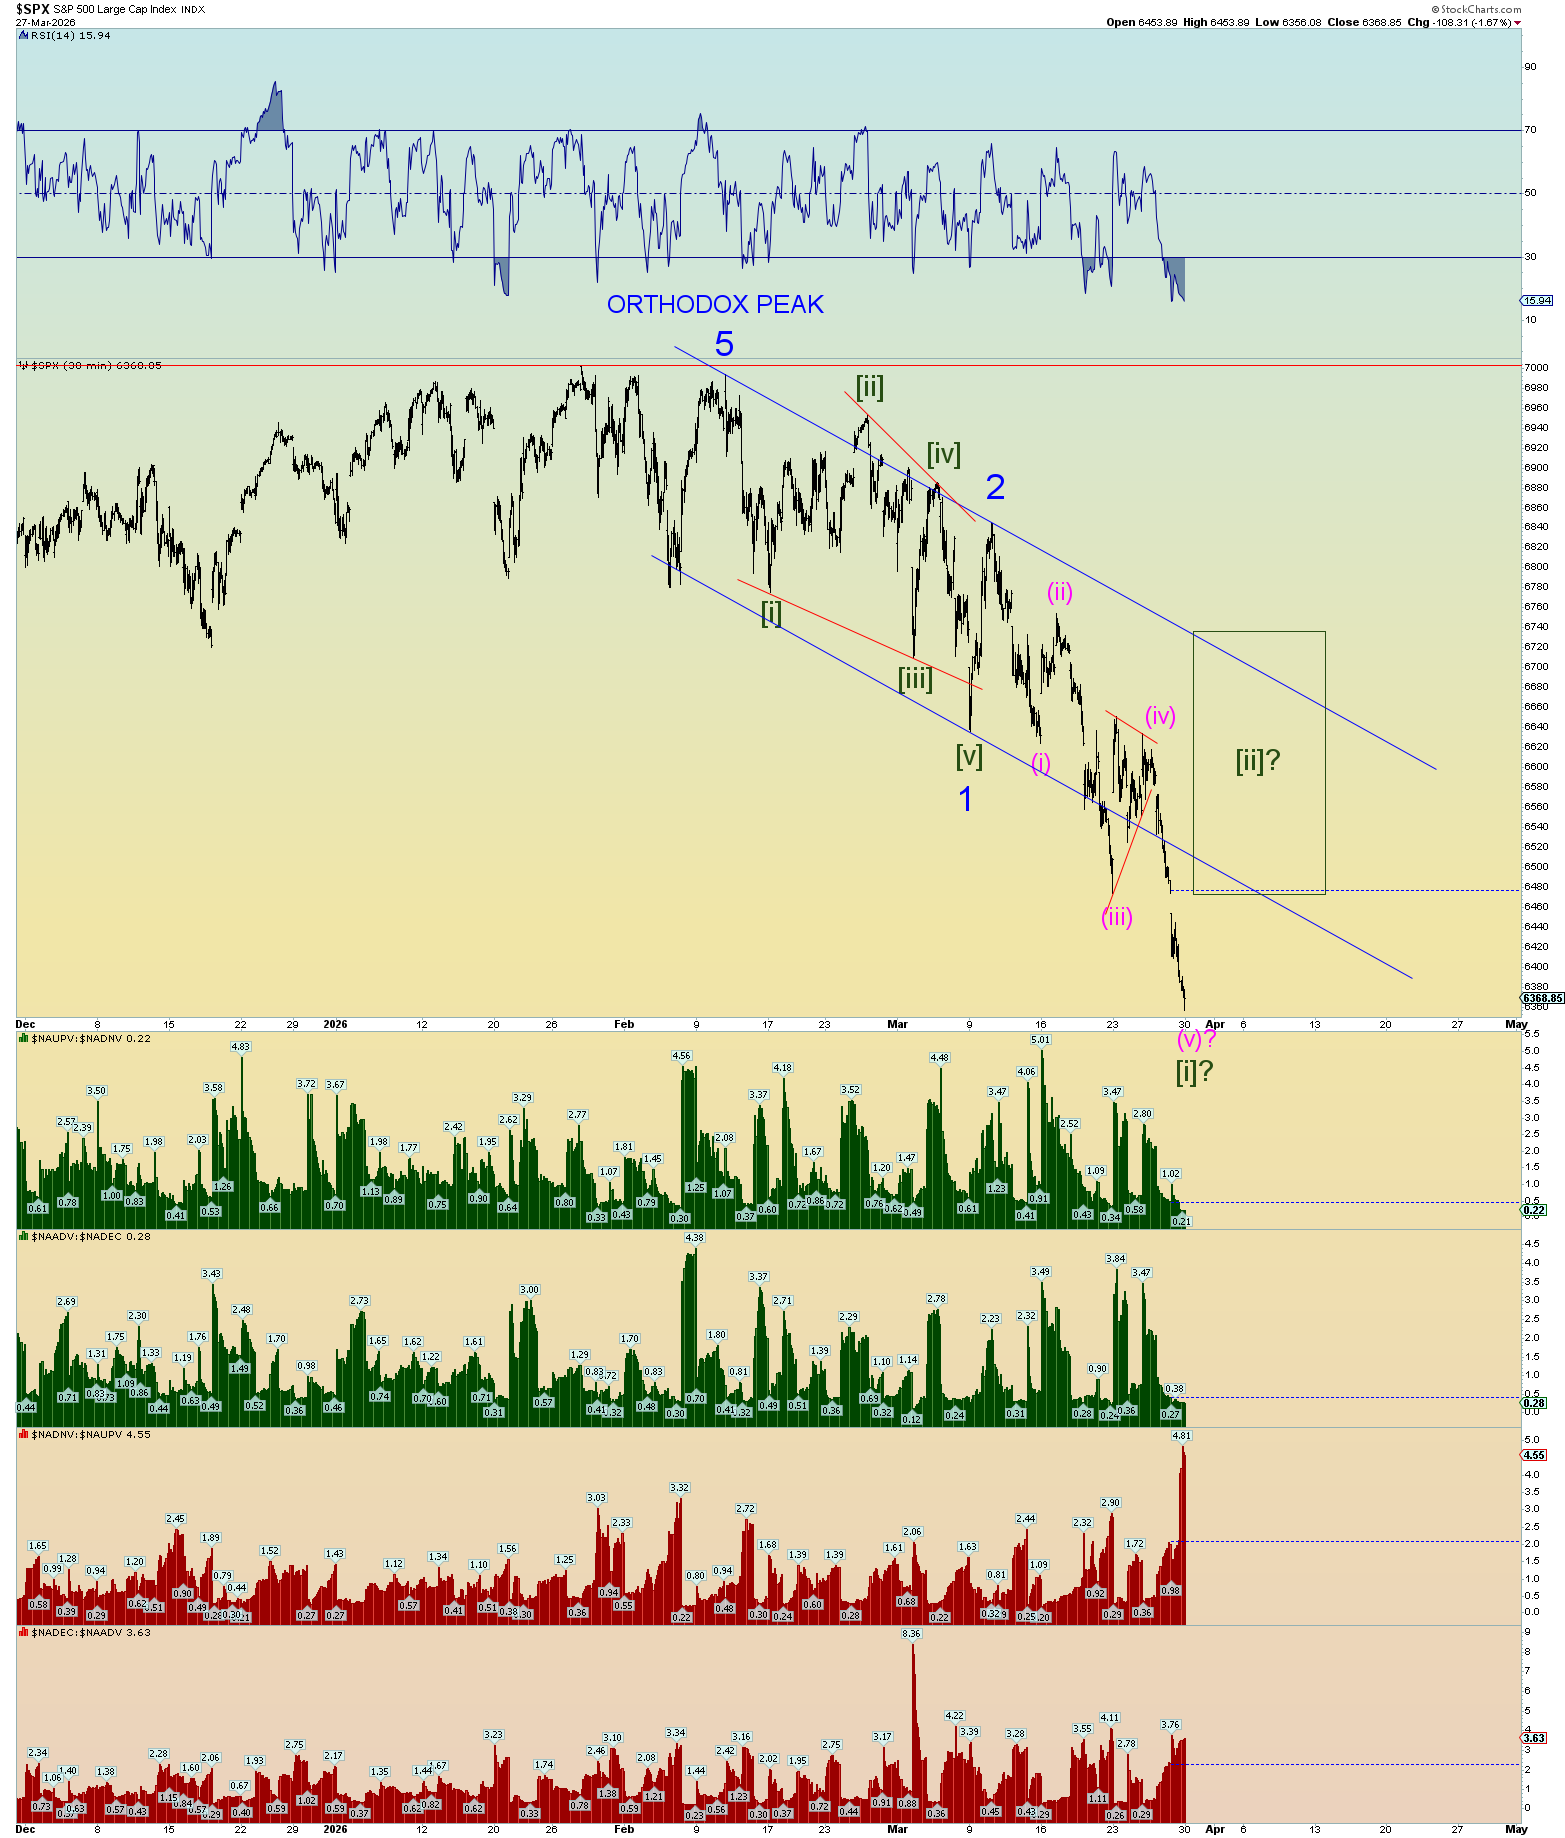
The next best count. I’m just taking a best guess. Another wedge situation. I would think we have underthrow and not overthrow of the upper line. This actually makes the subwaves for wave (1) a nicer combo.
The count is that Intermediate wave (2) is tracing upwards and a new all-time high will not be encountered on the SPX although this doesn’t mean that other indices such as the NASDAQ may in fact record a new high. We shall see. The NASDAQ does not have an impulse down from its October 29 peak. It looks corrective suggesting the all-time highs will be challenged.
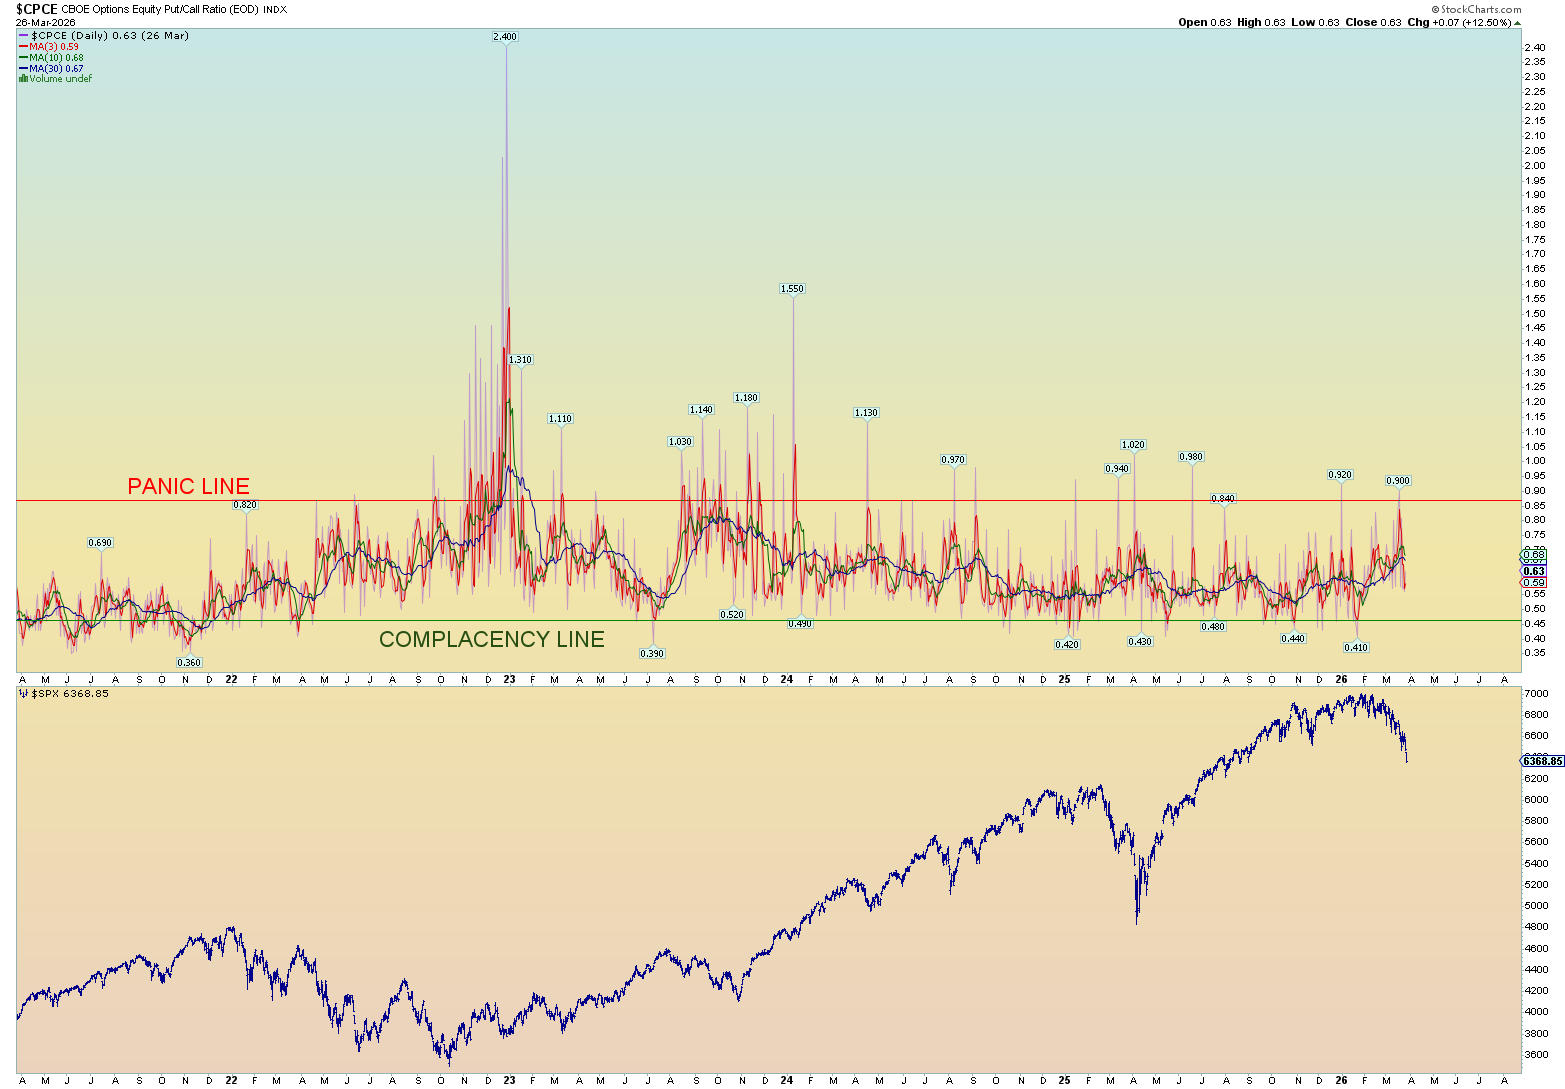
One interesting chart to gauge on how much of this sharp rebound has staying power or not is looking at the NYSE breadth thrust indicator. A movement from beneath .40 to above 61.5 in a short amount of trading days indicate a broad “breadth thrust event” which signals stocks have likely farther to run.
We have yet to have this “event” despite the near vertical climb in record time. Today would be the 15th day since the market was beneath .40. As you can see, the previous events over the last 6 years have been indicative of rally power to carry on.
Much past 13 days and this signal becomes weaker and weaker as a future indicator of rally staying power. I don’t think today was enough to push it over 61.5 (I will not have the data until tomorrow). This still has the earmarks of a very sharp wave (2) that will likely put the fear in future shorts and burn out the rest of the buying power to keep the market afloat. This sets up a truly potential illiquid market and a “flash crash” situation. Short squeezing is going on and once that has fully dissipated, and the bulls realize the world’s economy took a big wound, well, wave (3) down should be historic
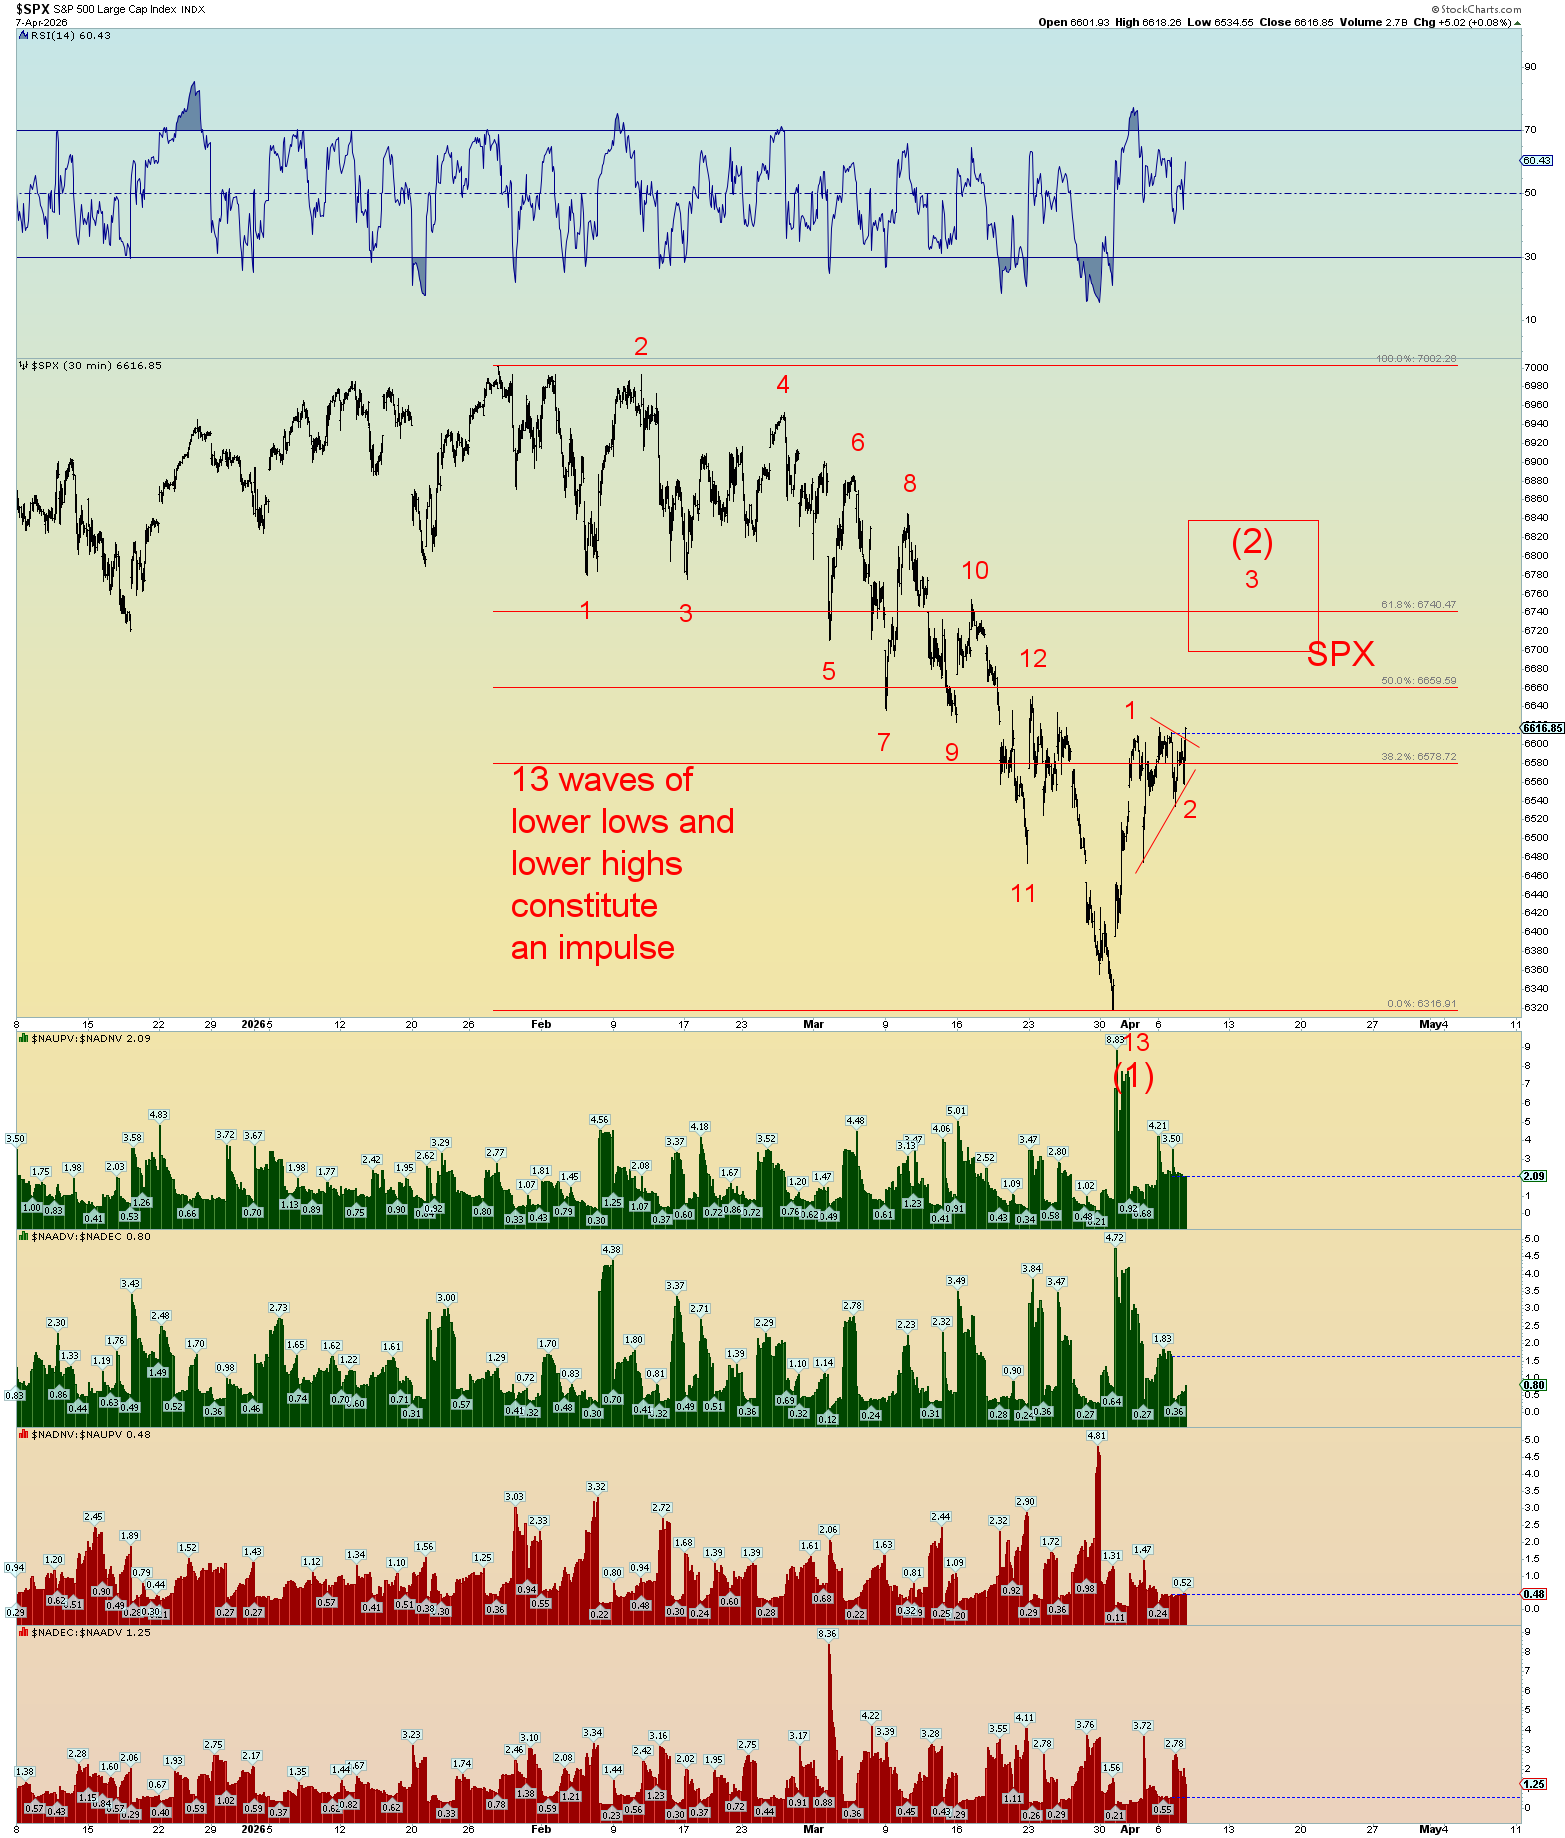
Falling wedges within wedges. I’d say this is what has happened to the stock market. And this squeezy rebound was a natural result. Still seems to have more squiggles to trace out.
Note how important it was for the SPX to gap up over the broken upper long-term wedgeline. (yet another wedge!)
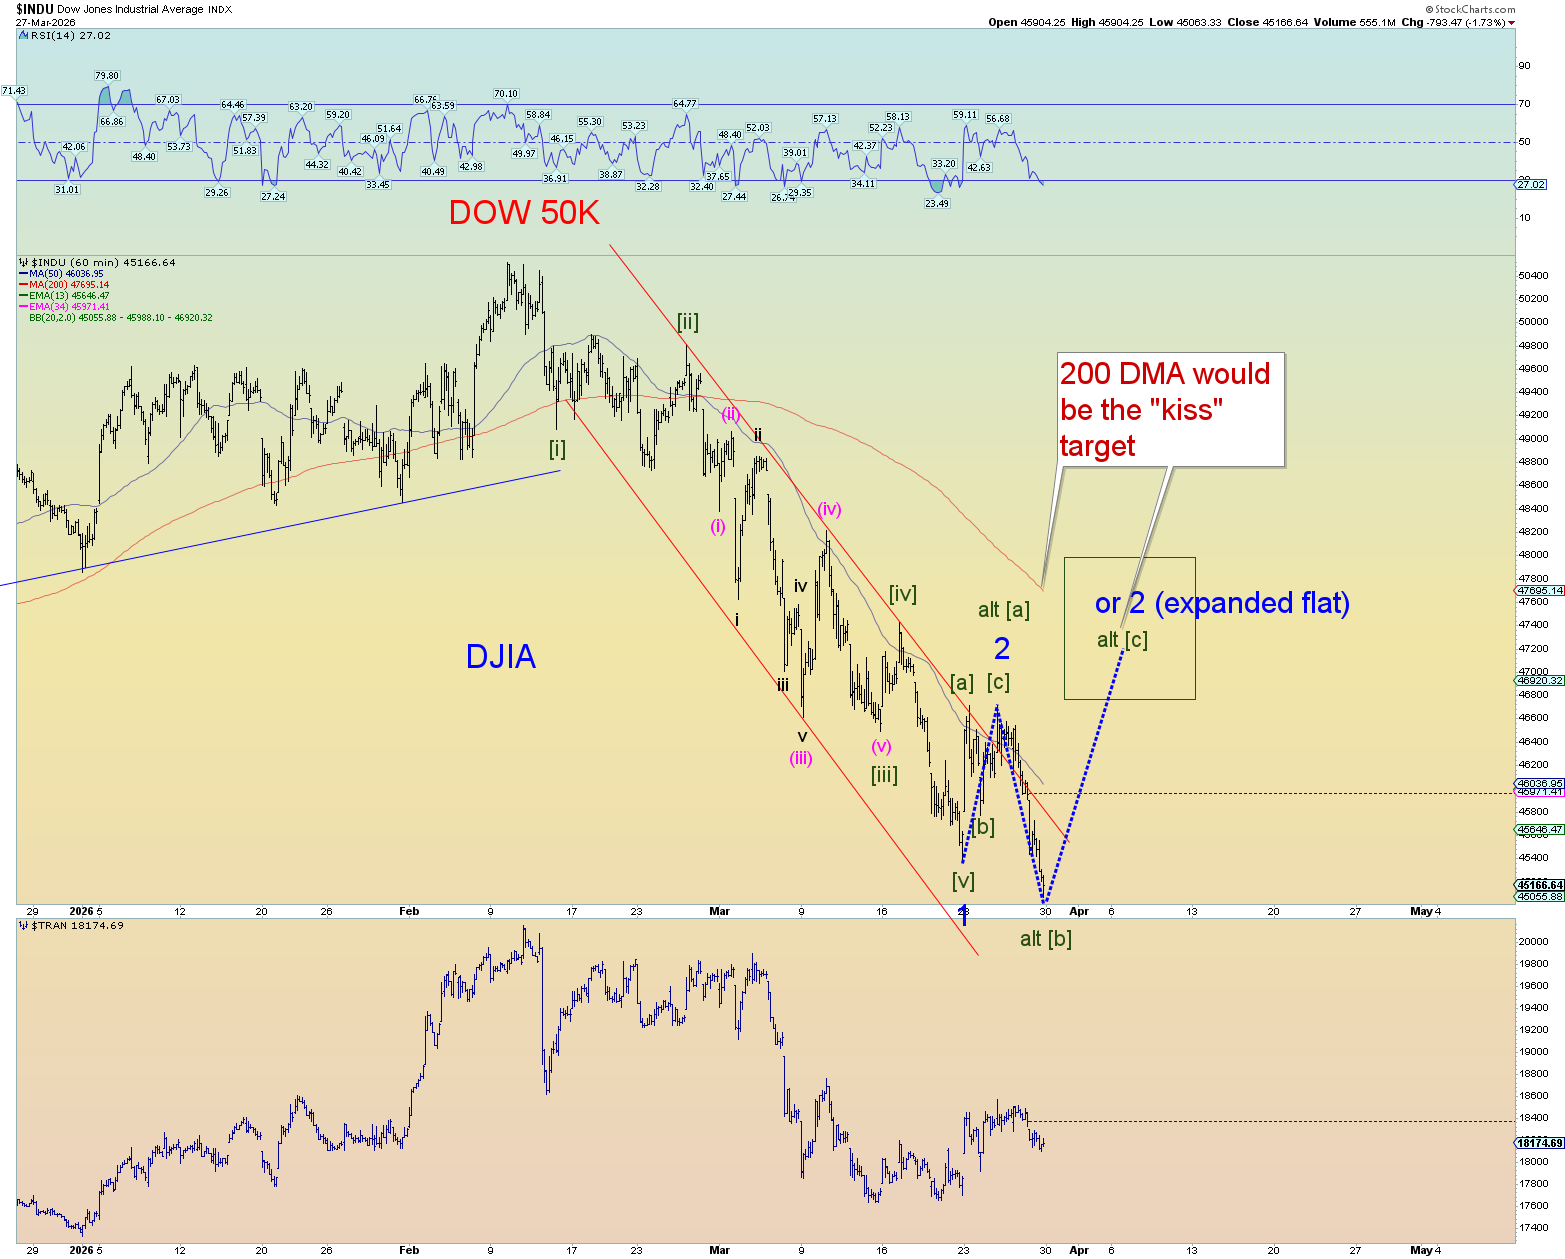
Well, I had a feeling a major up day was right around the corner because the DJIA count suggested it. (I misspoke on the 200 DMA red line on this chart; this is the hourly not the daily. I show the daily next, but the premise still holds, the red line is the goal even on the hourly).
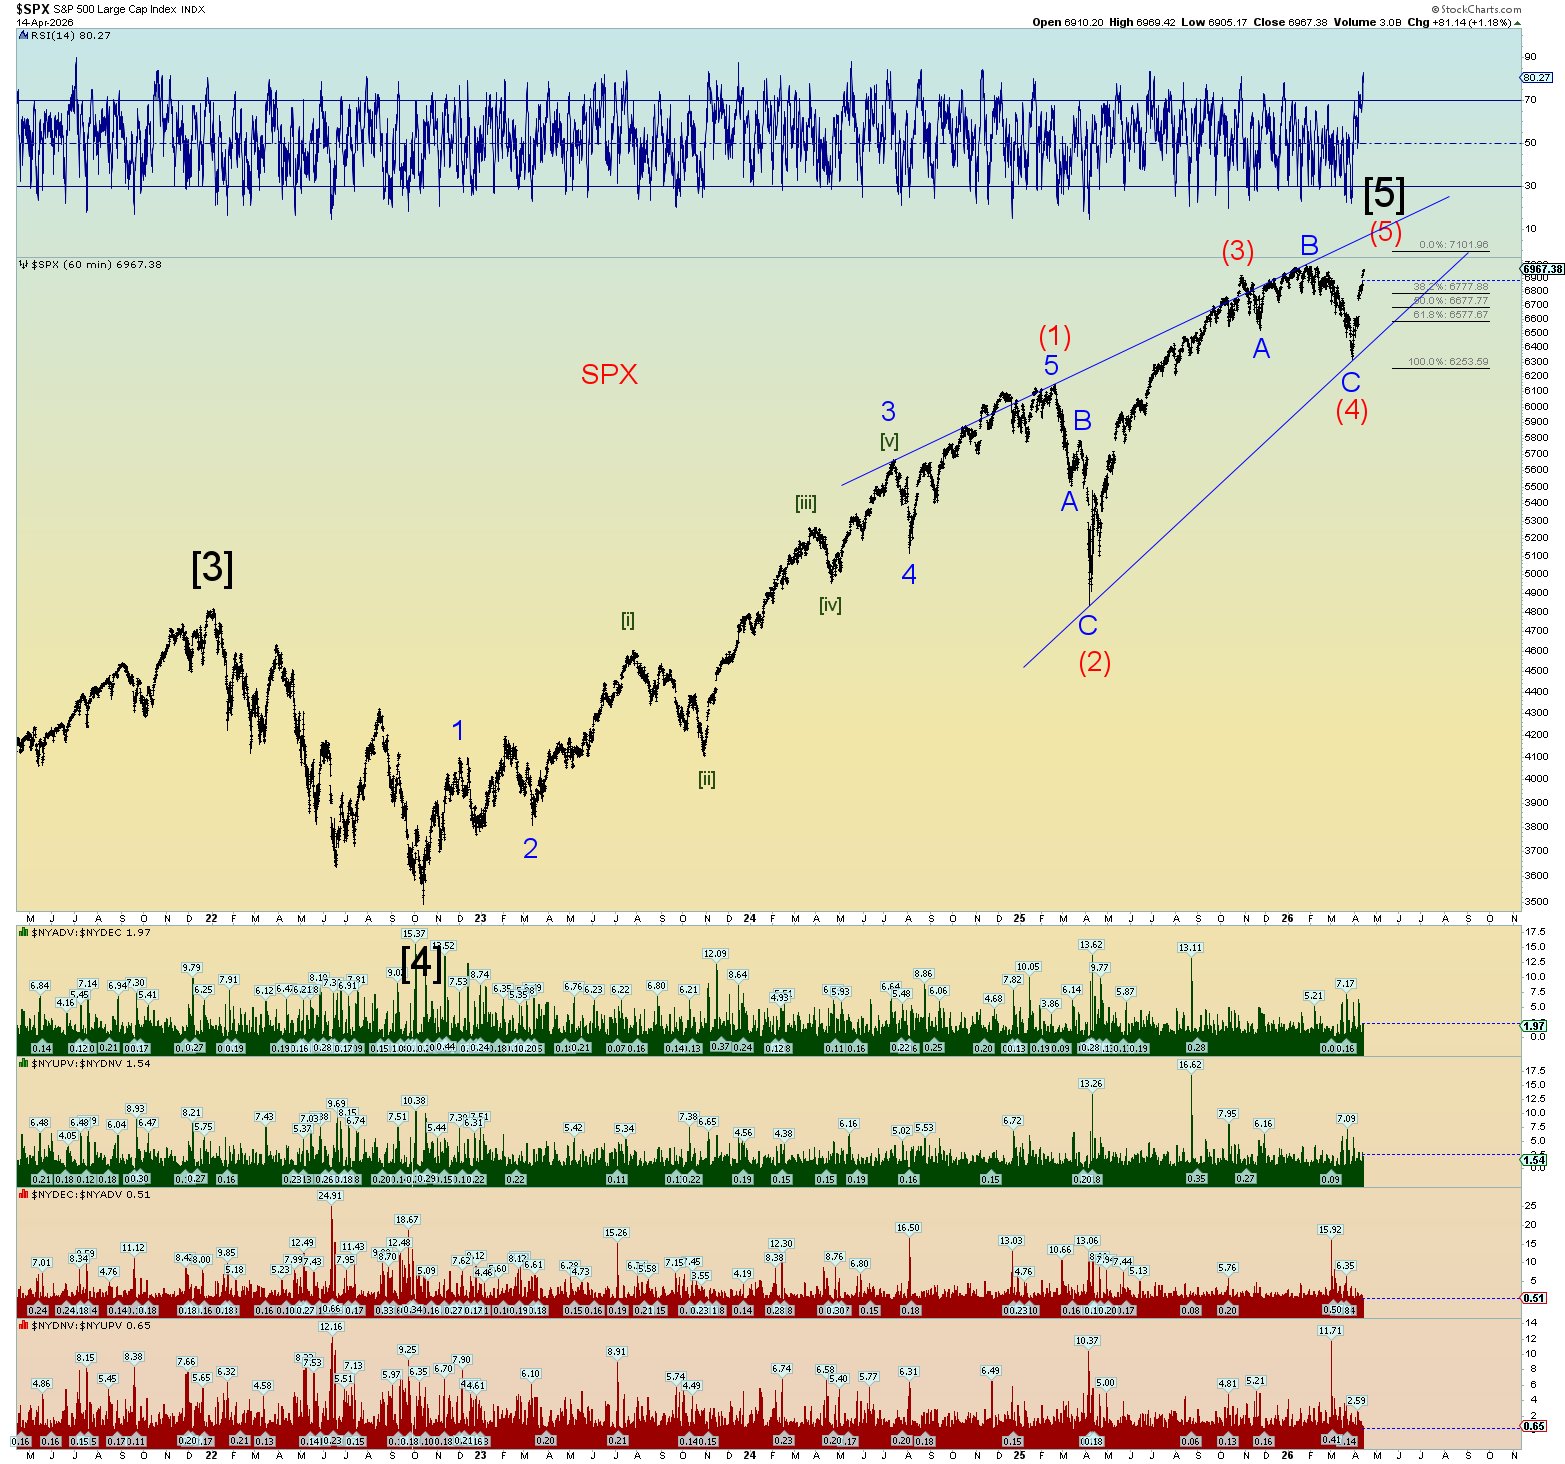
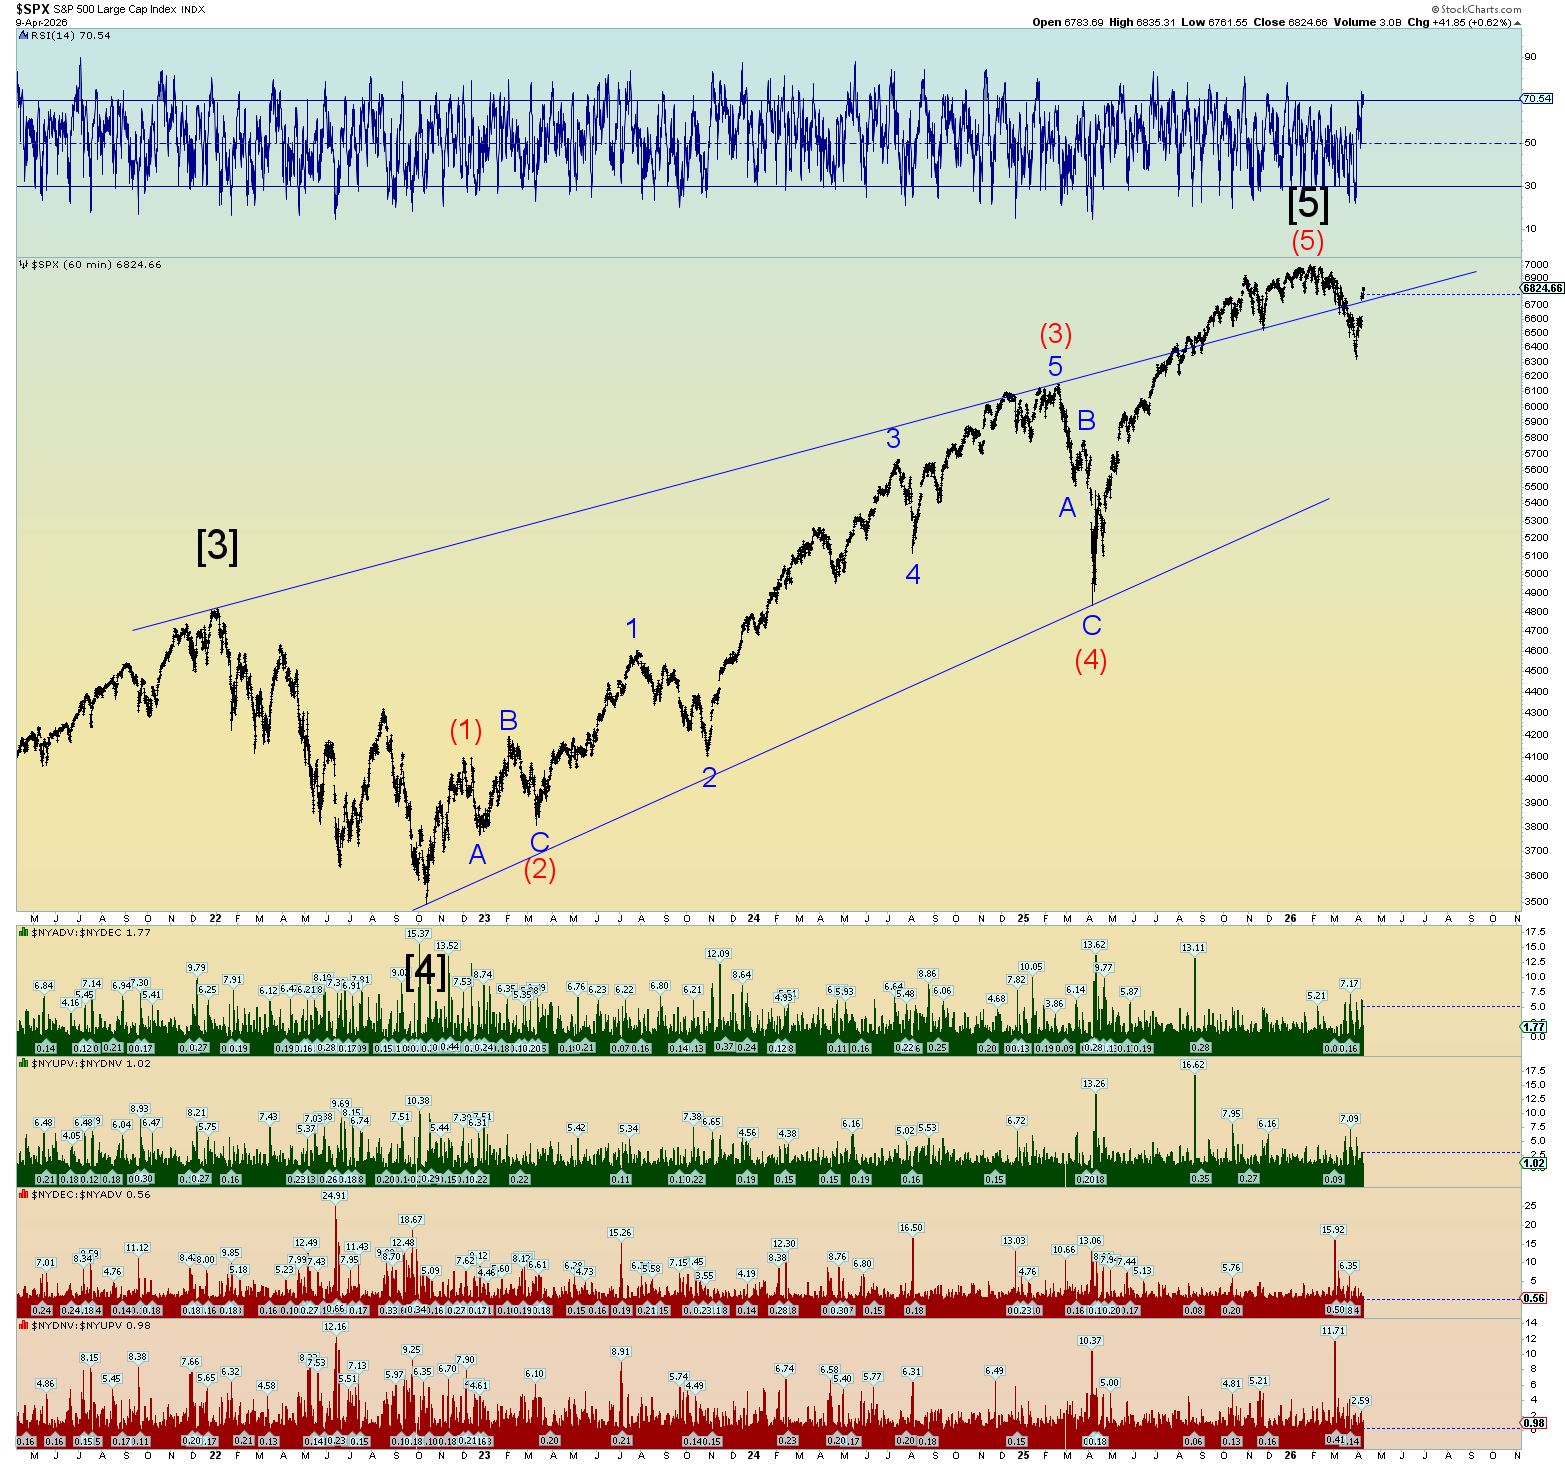
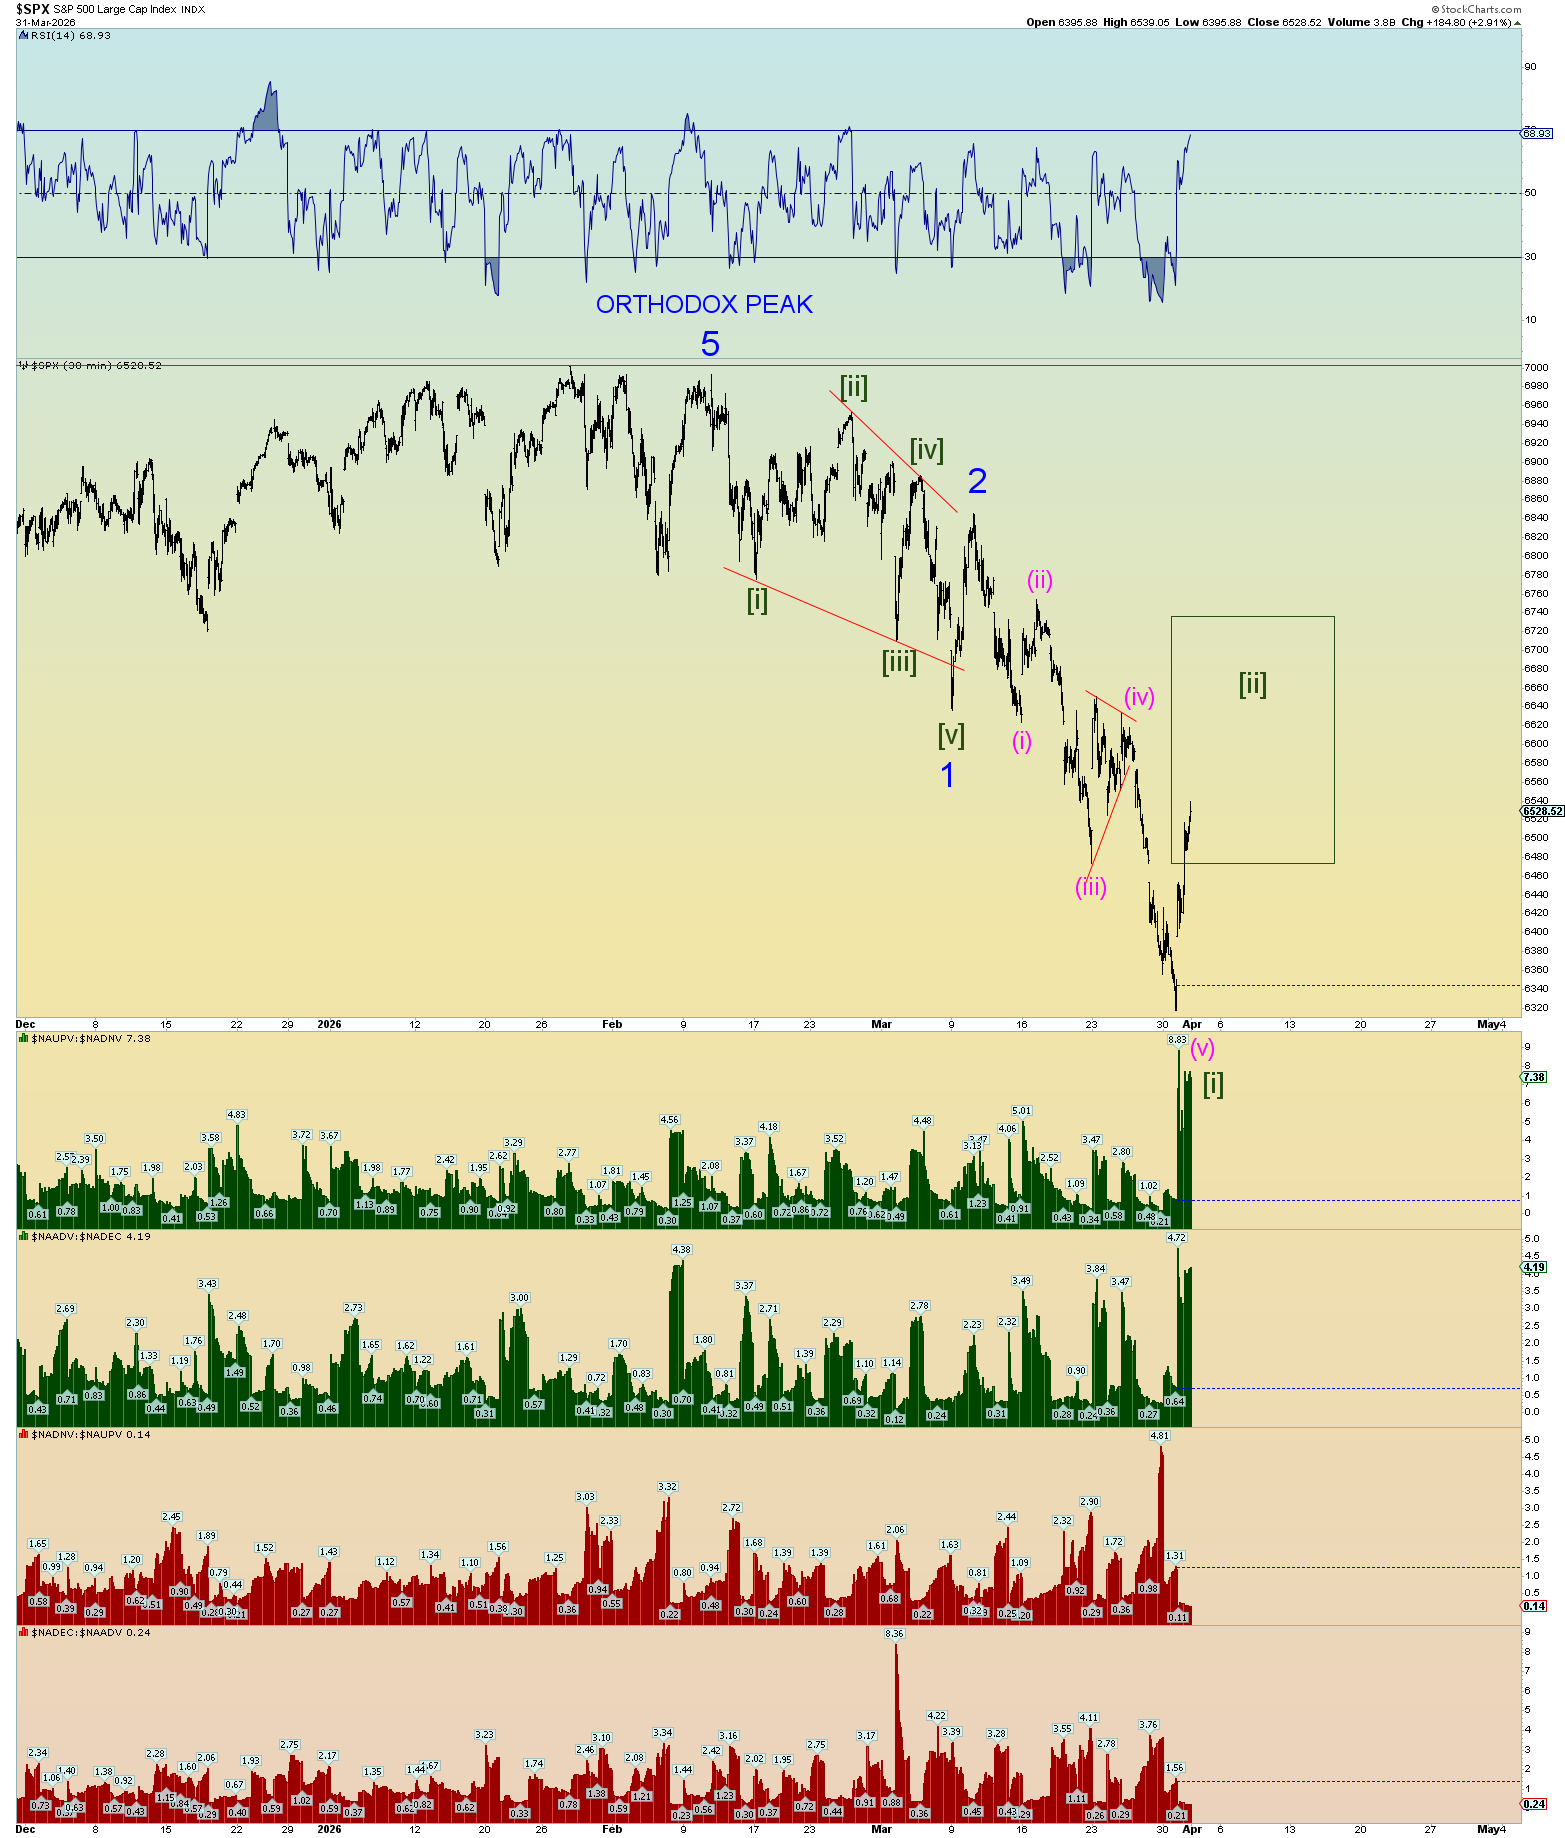
Probably the best count on the SPX. I would expect price overlap with Blue Minor 1. So, there is still much more upside potential. Then it all falls apart. The AI bubble has popped.
The chance for a major stock market crash is here. Elliott Wave International has this rise since 2020 as an ending diagonal triangle with overthrow. And since prices have now decisively broken back underneath the upper wedgeline, a quick collapse to beneath the starting point – Dow 18,000 – is called for. That was the 2020 price low.