Let’s just throw a bunch of labels on there and see what sticks in the end.
Let’s just throw a bunch of labels on there and see what sticks in the end.
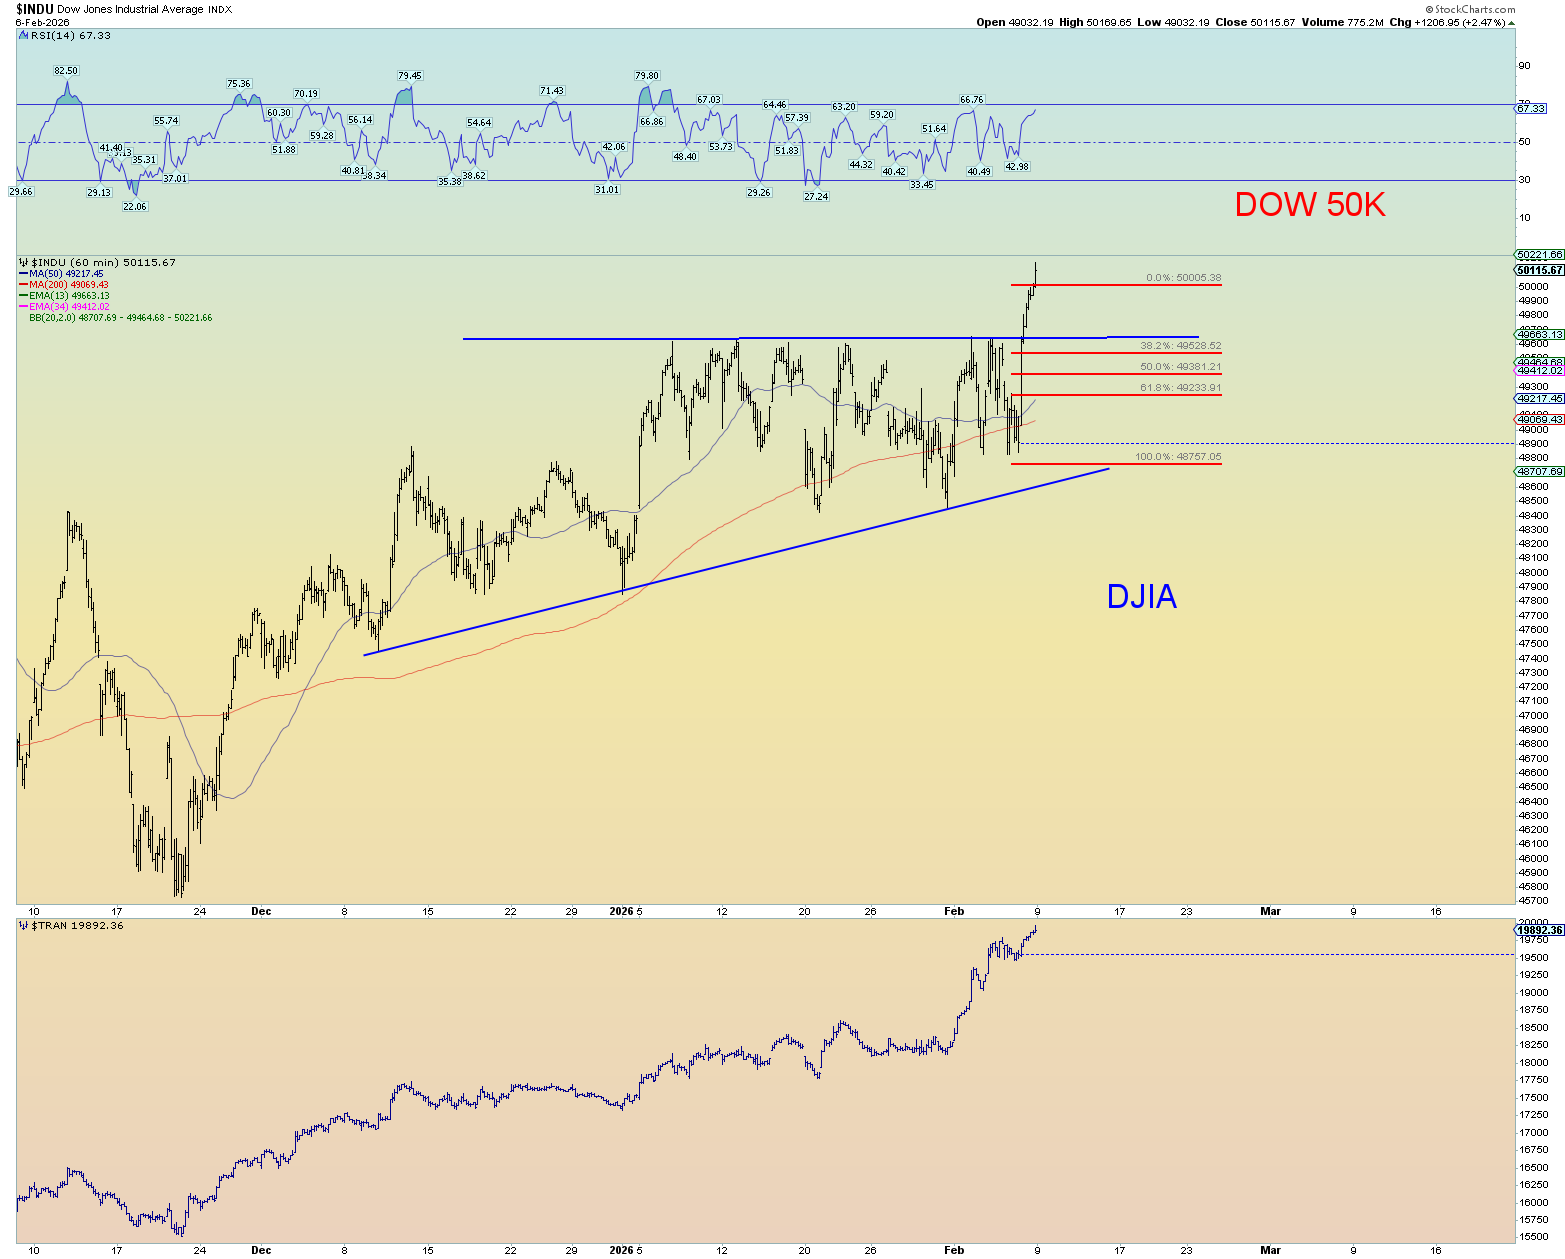
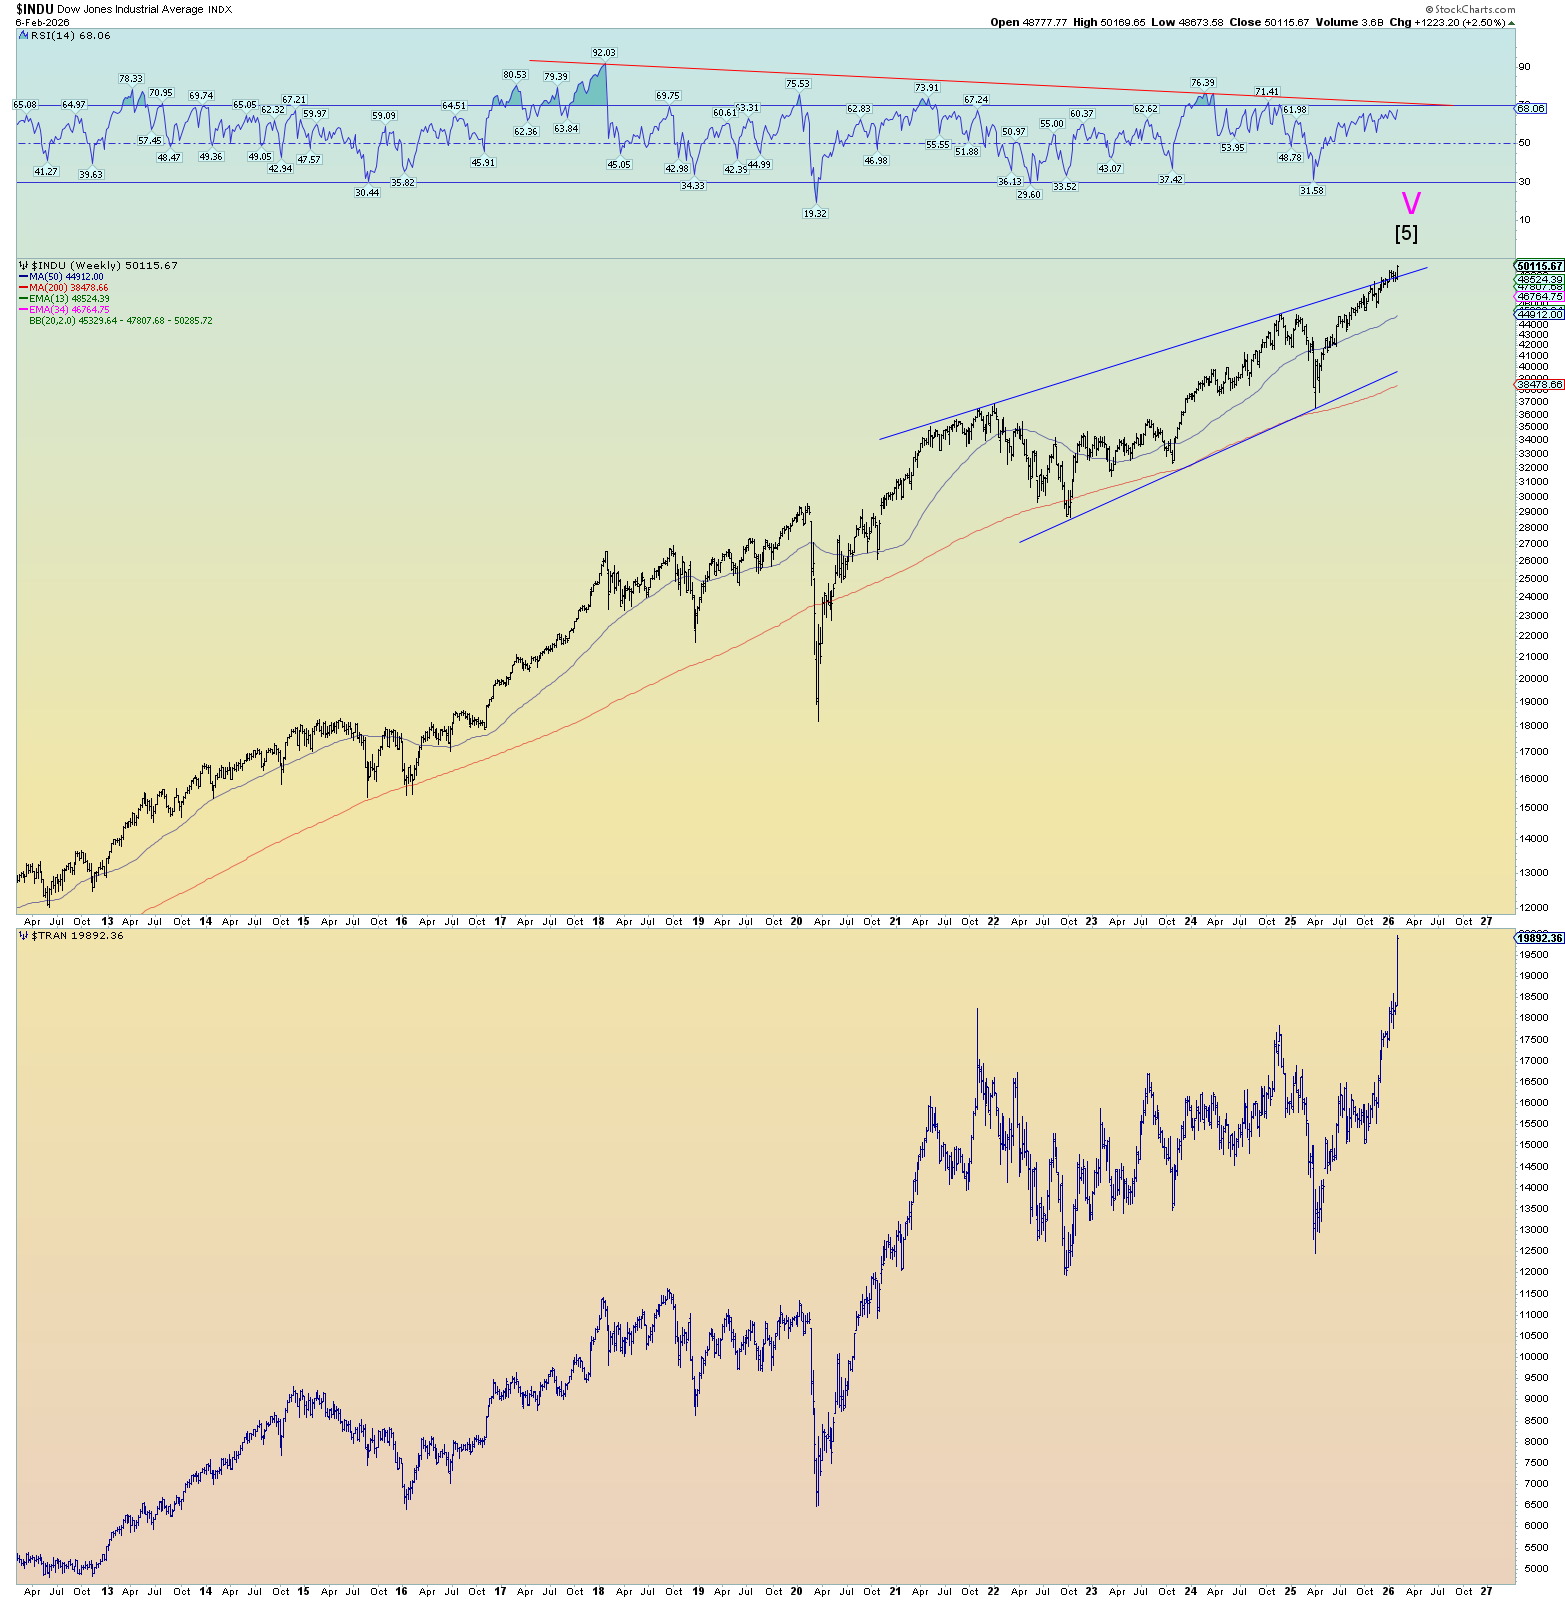
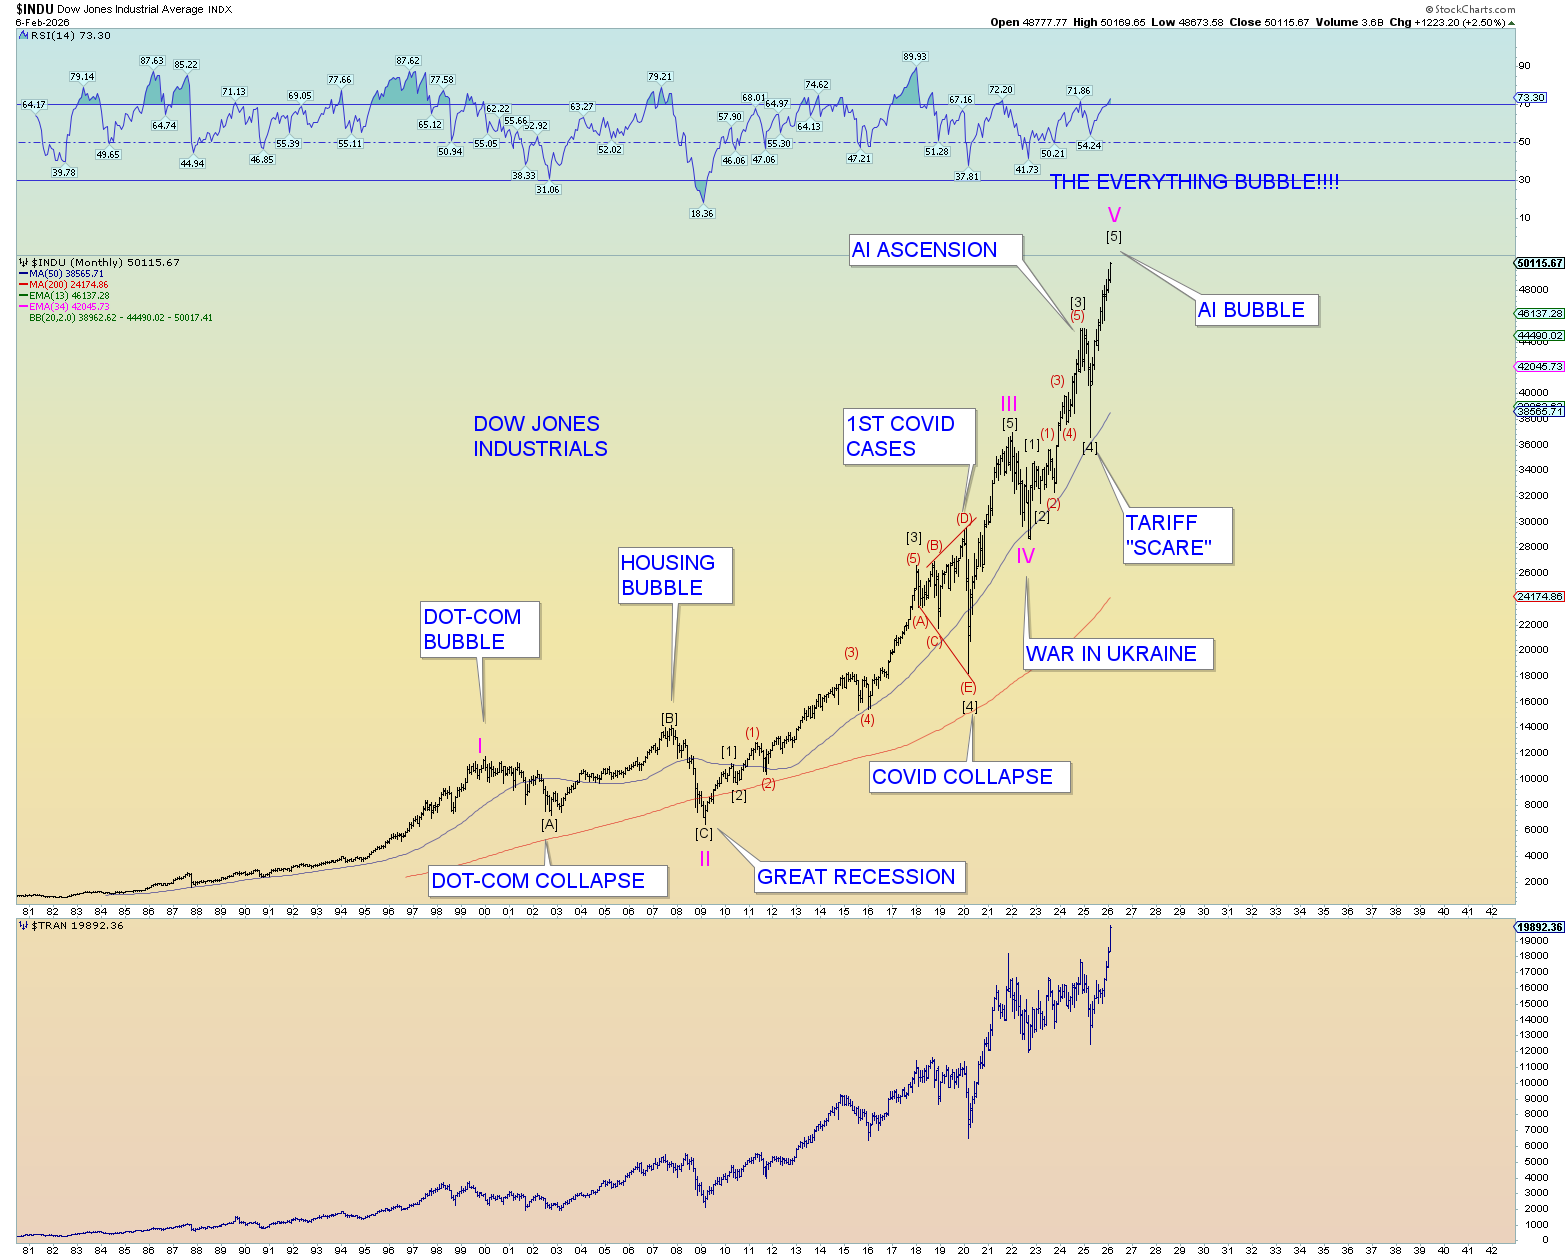
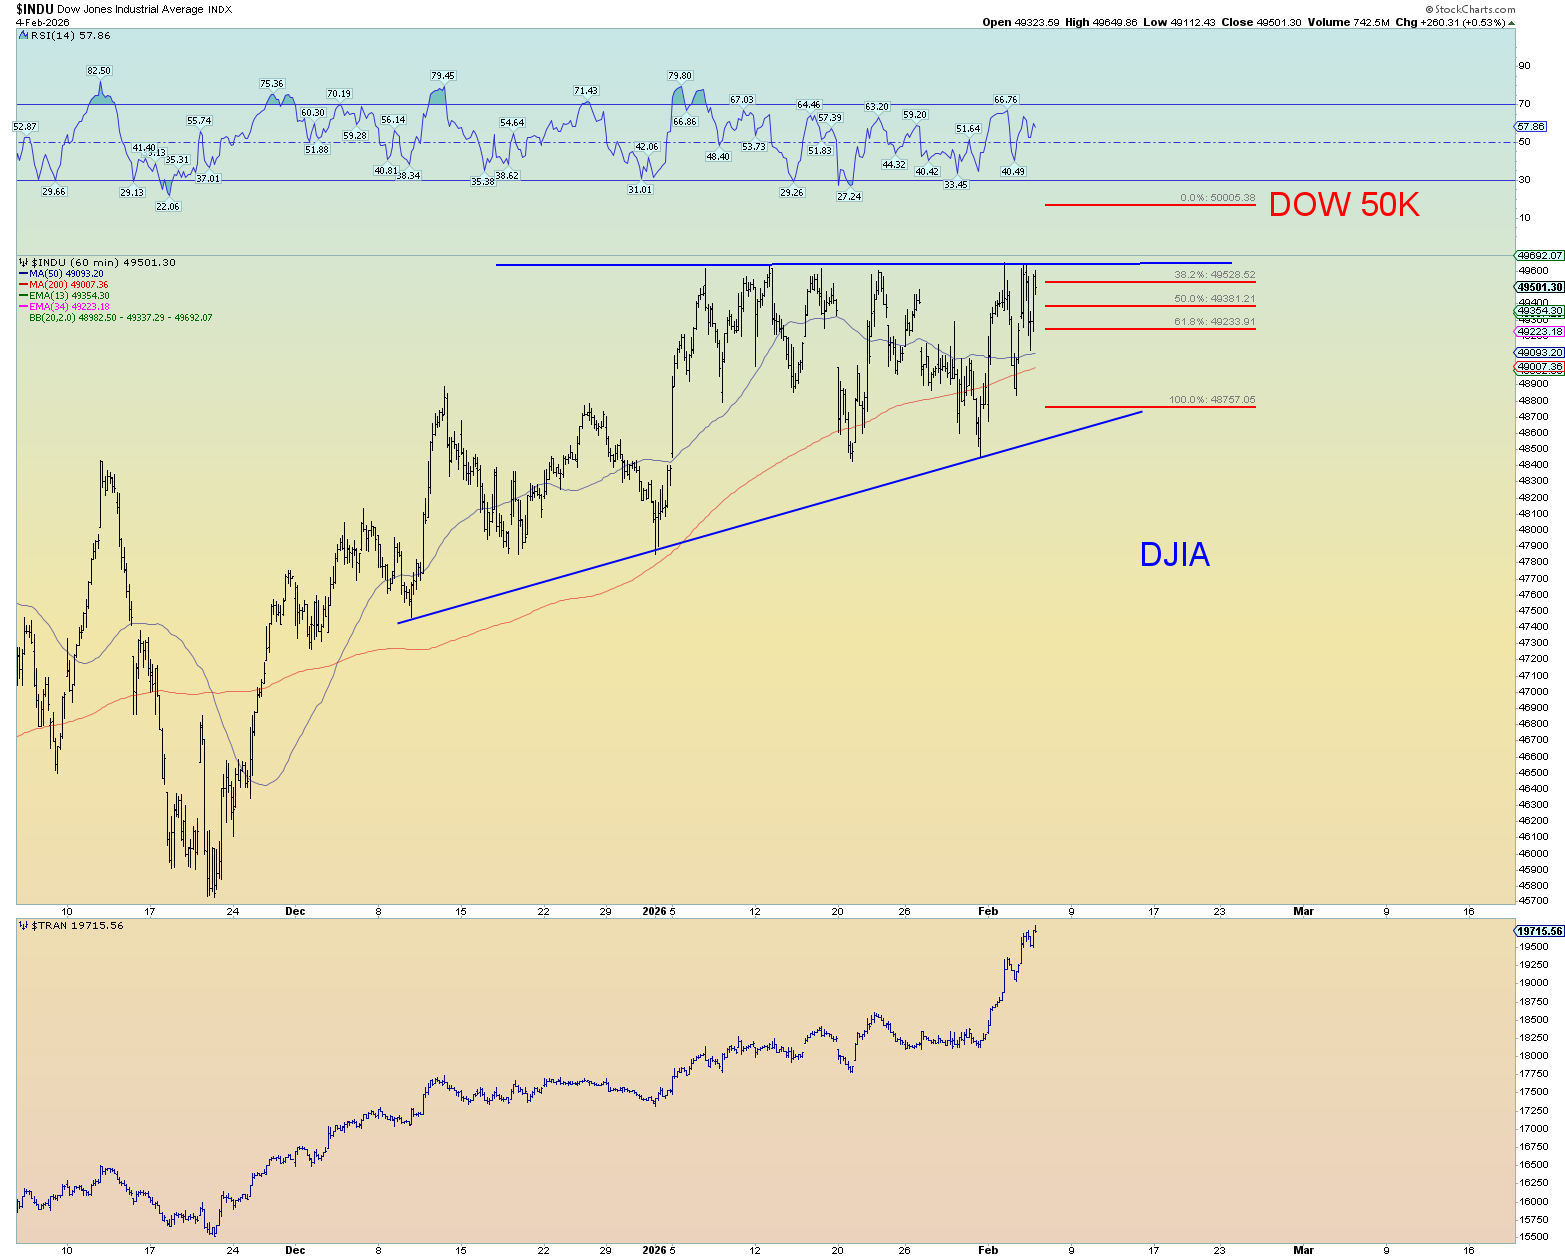
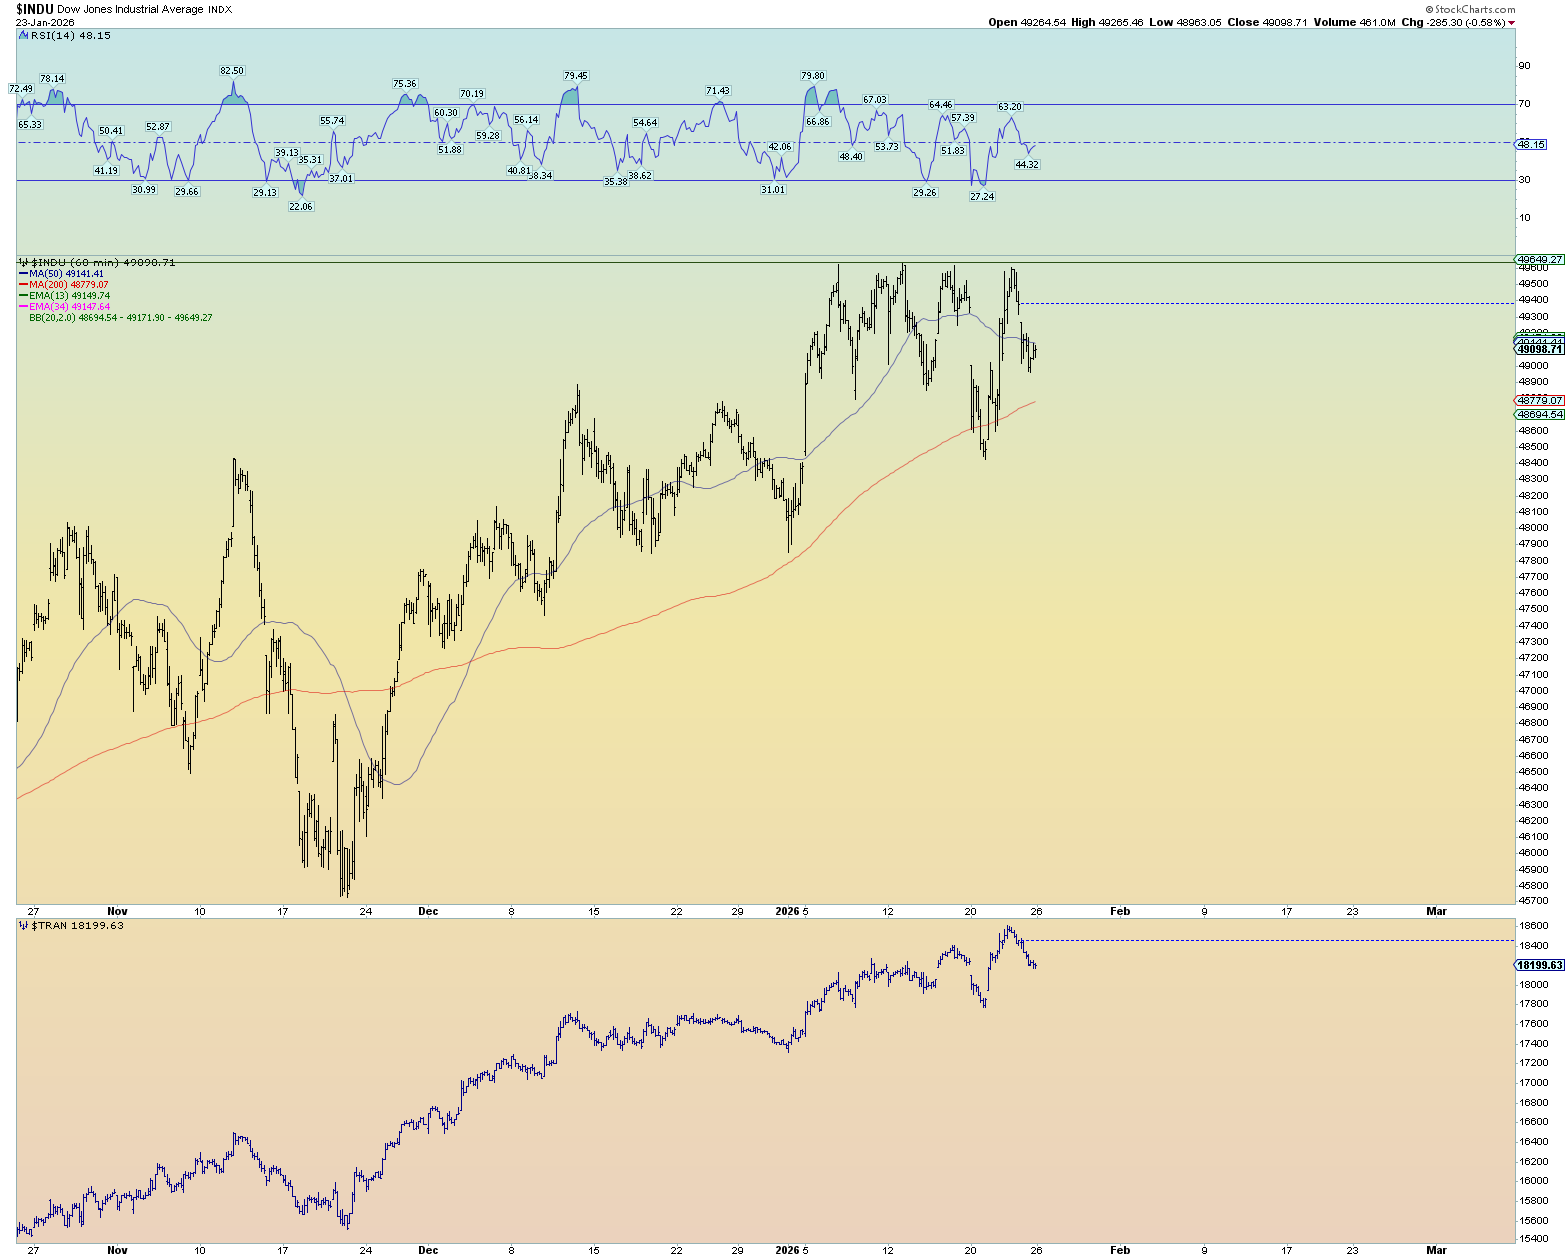
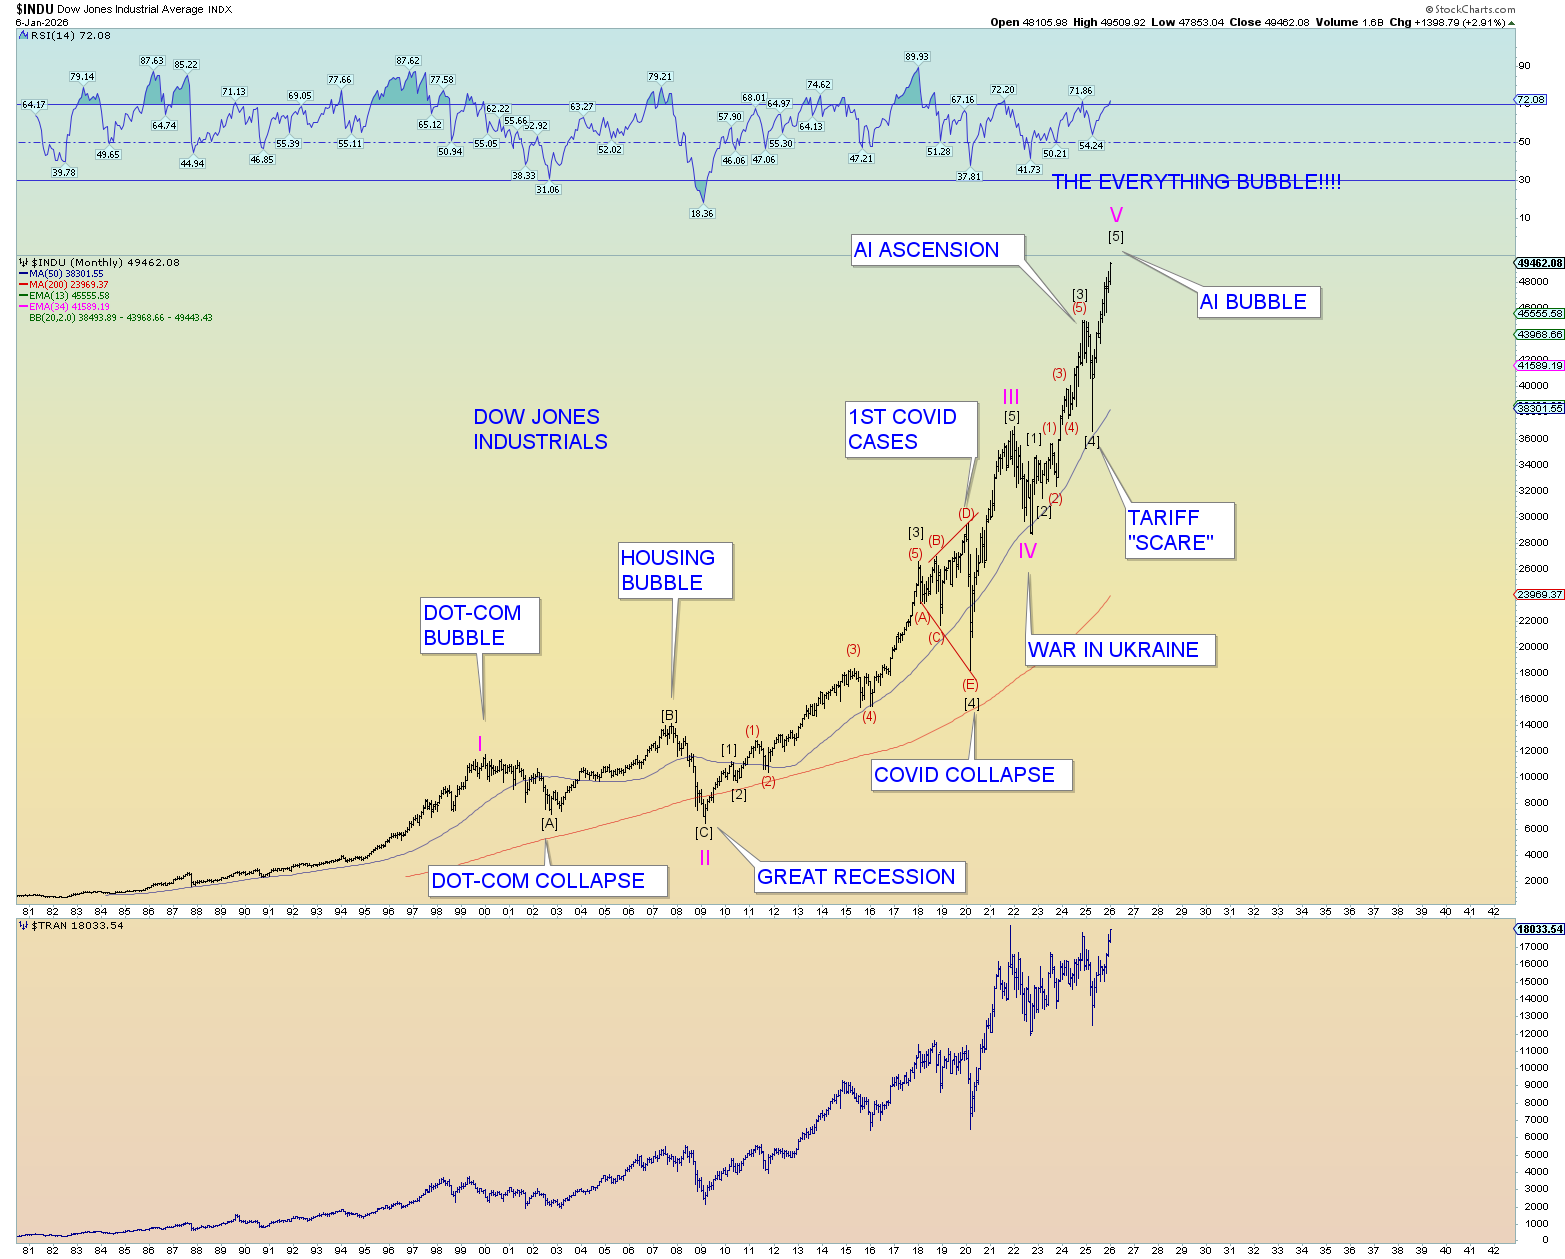
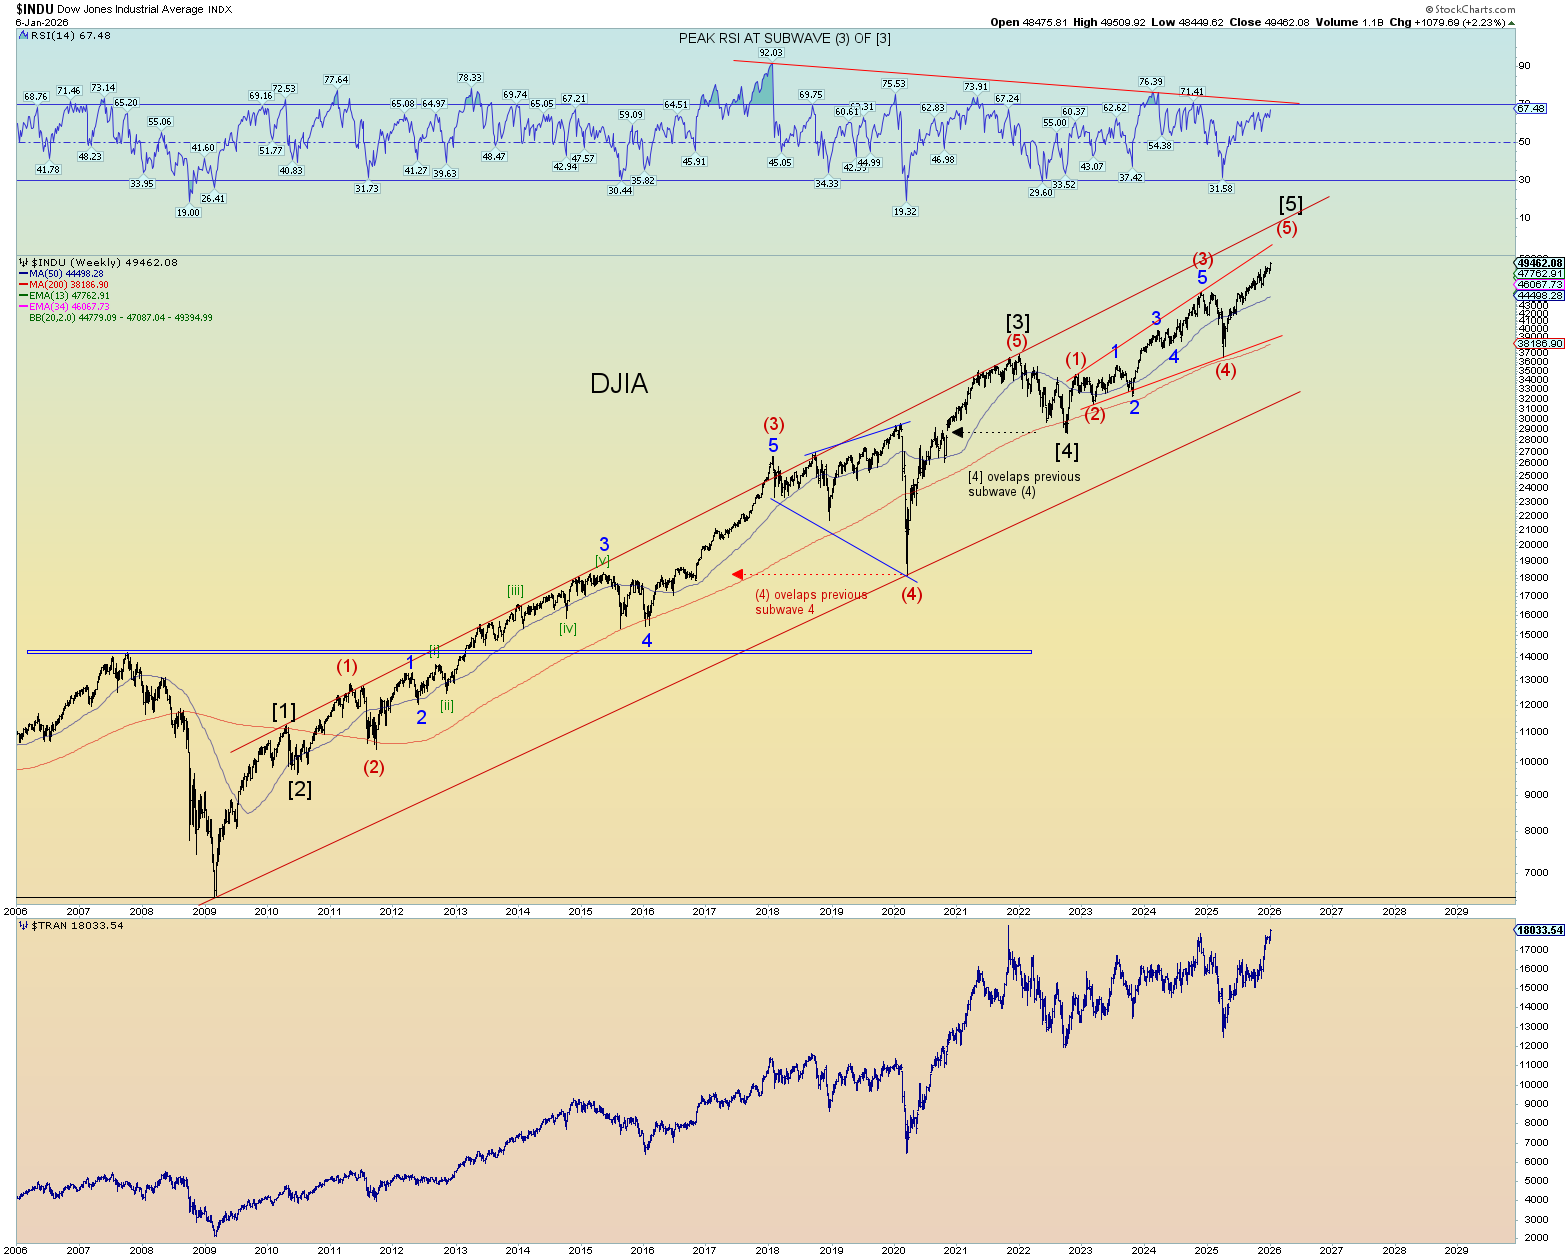
Well, the DOW fulfilled the ascending triangle. 50K DOW! Yeah baby! Anyways, at least we got that over with quickly.
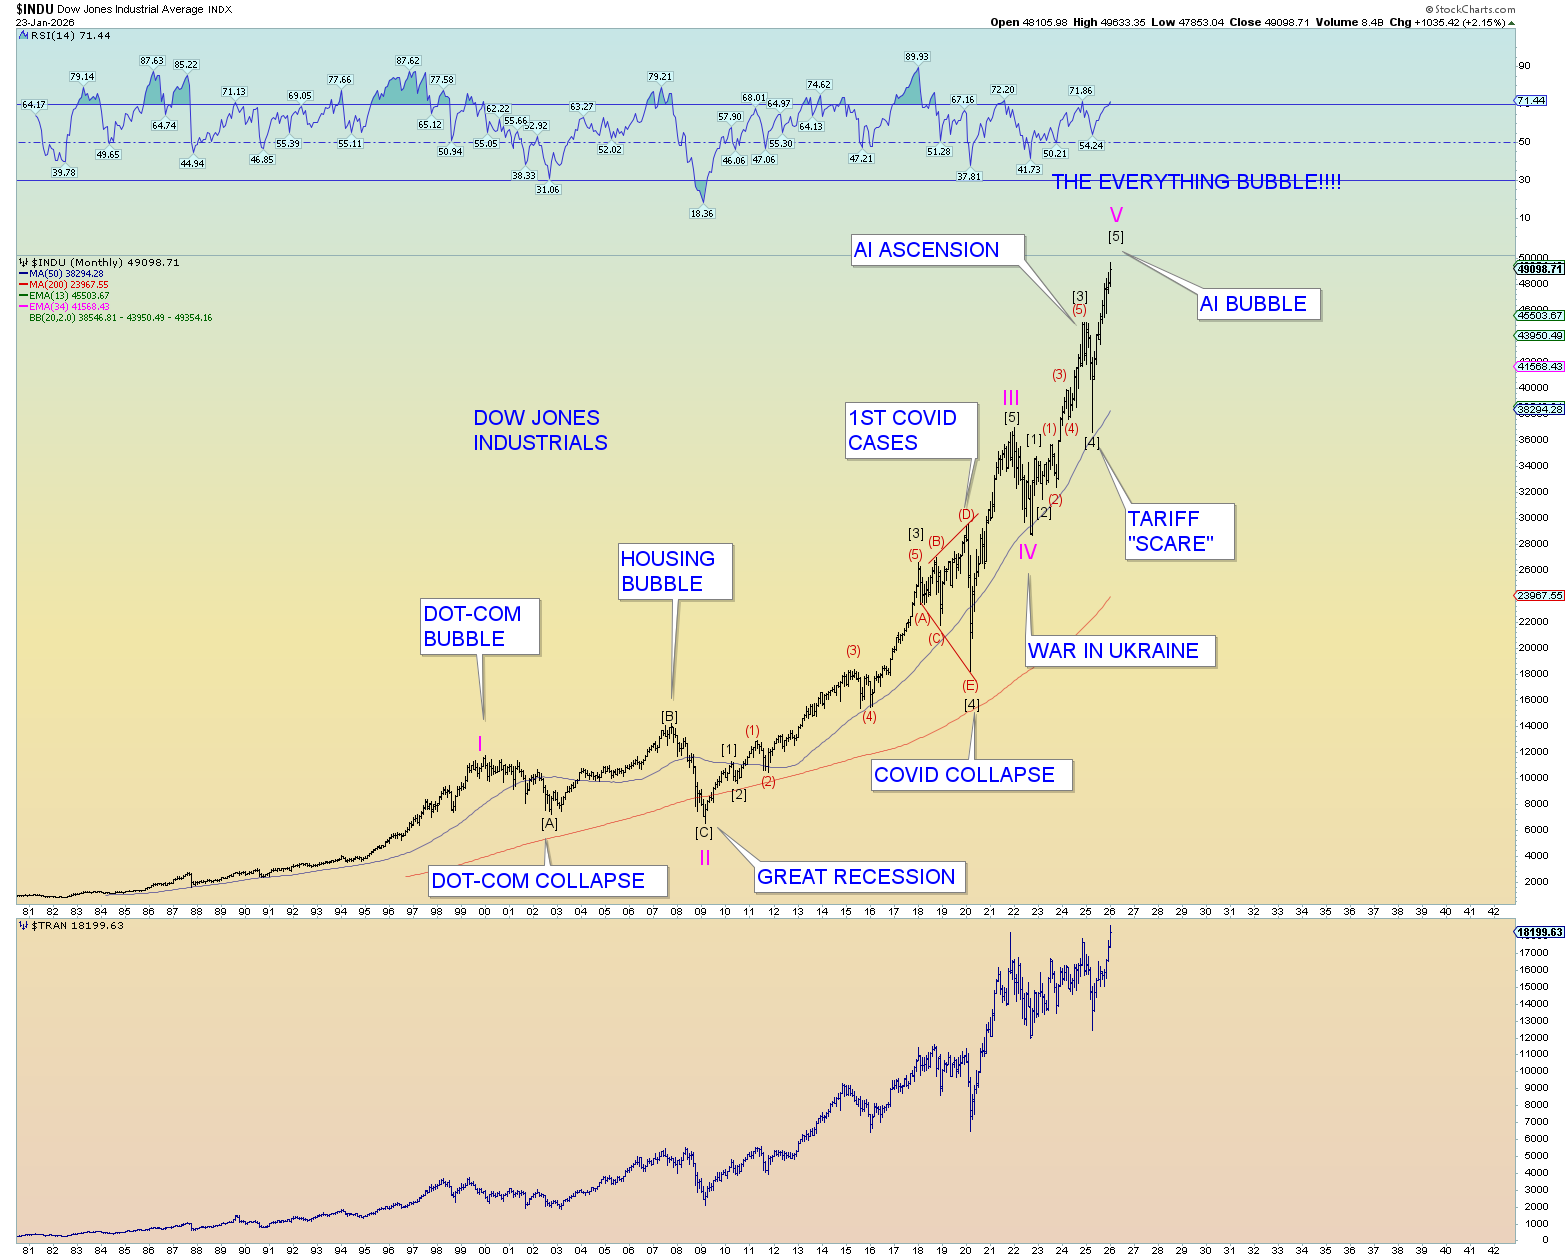
Some think this might be a ginormous ending diagonal wedge with overthrow. Its ok with me.
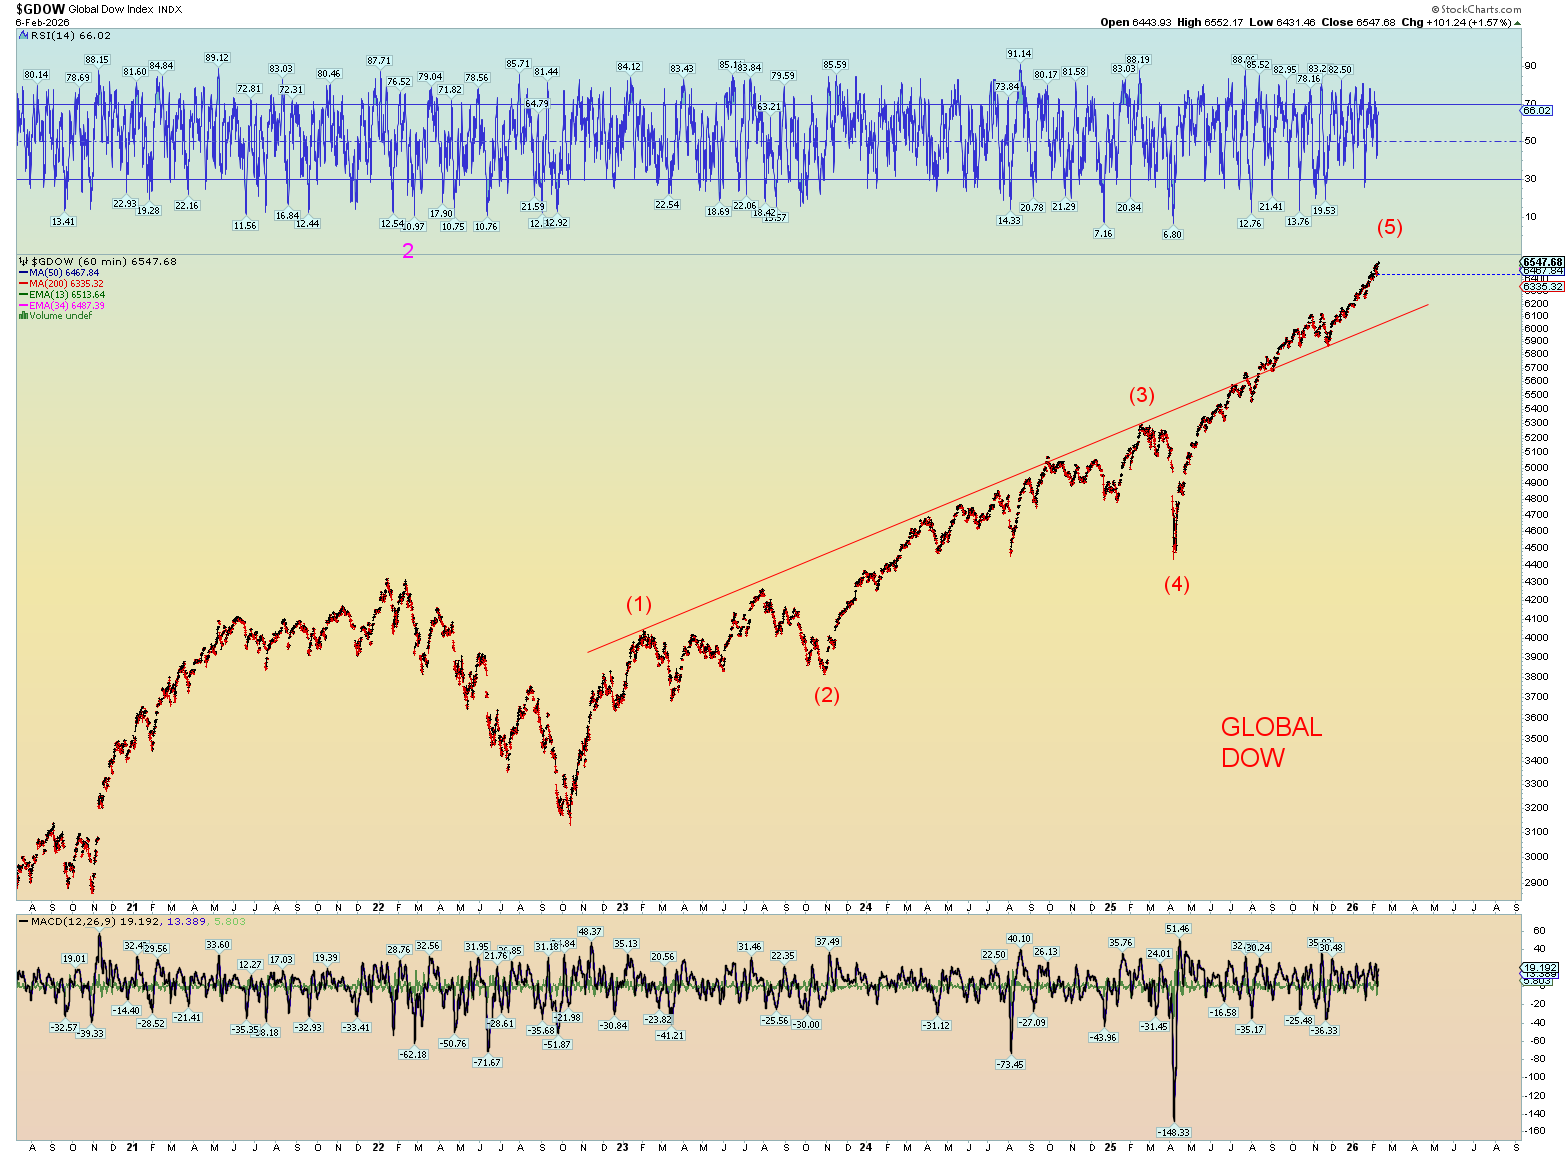
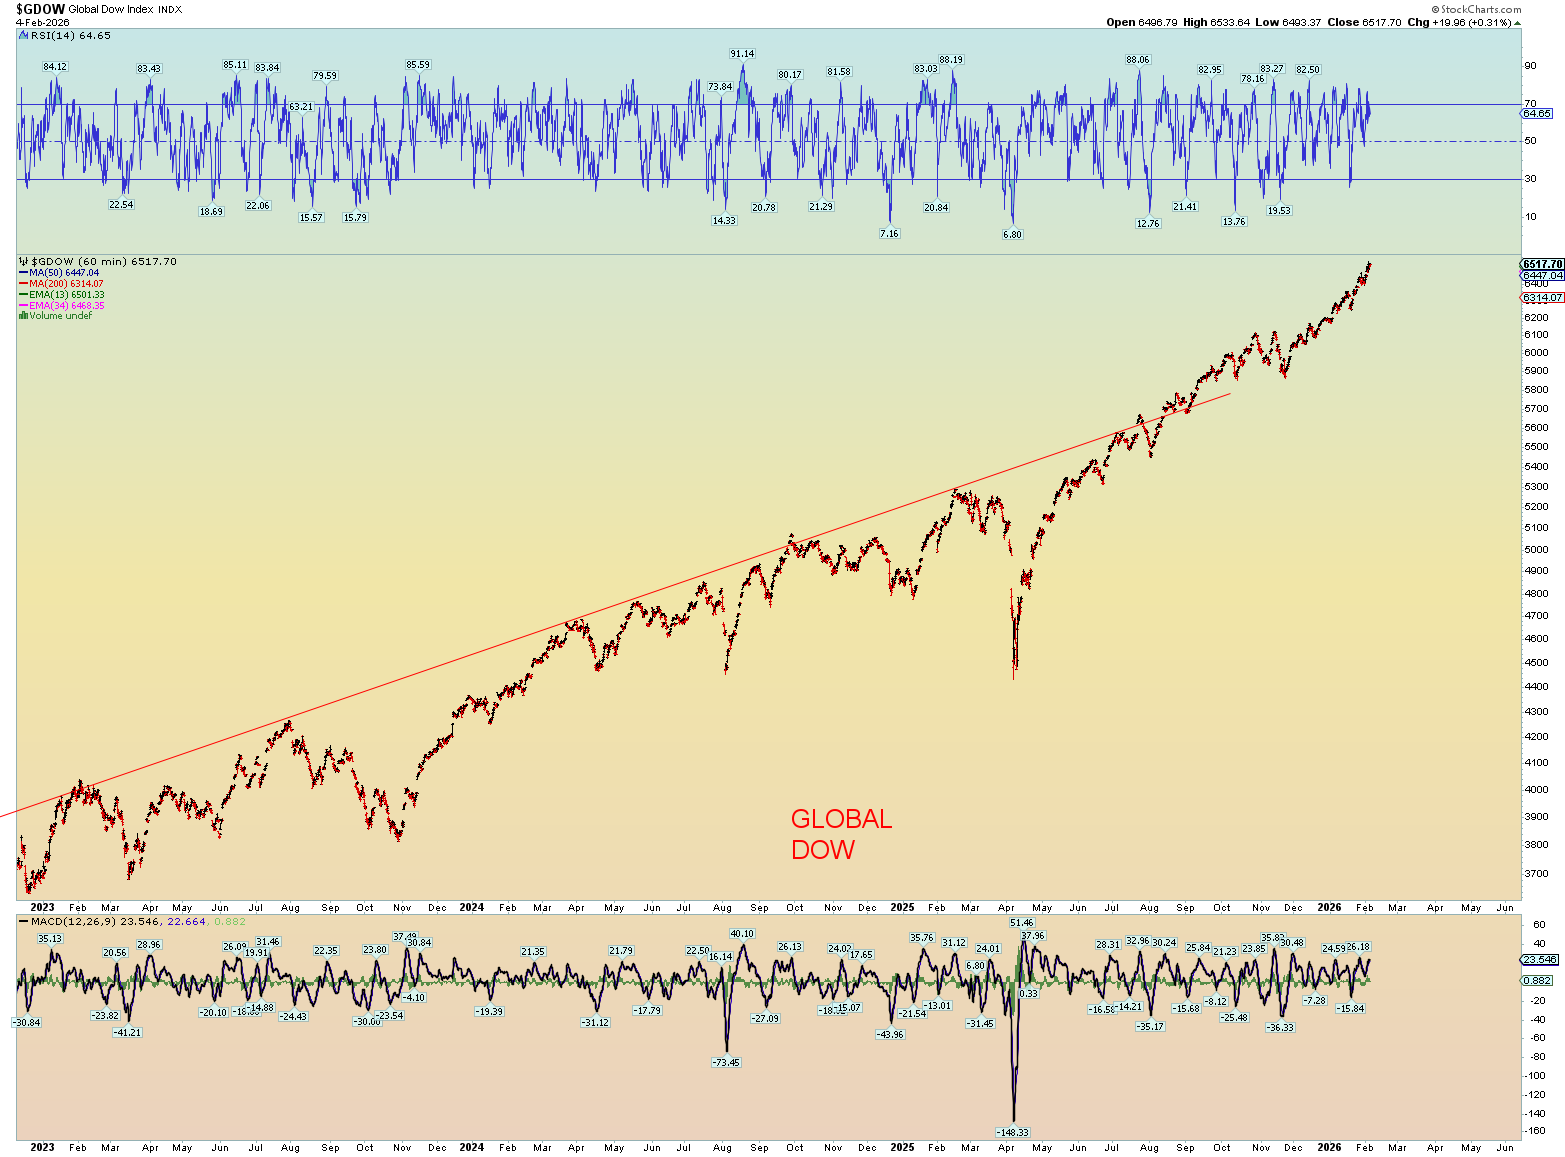
It’s a global phenomenon.

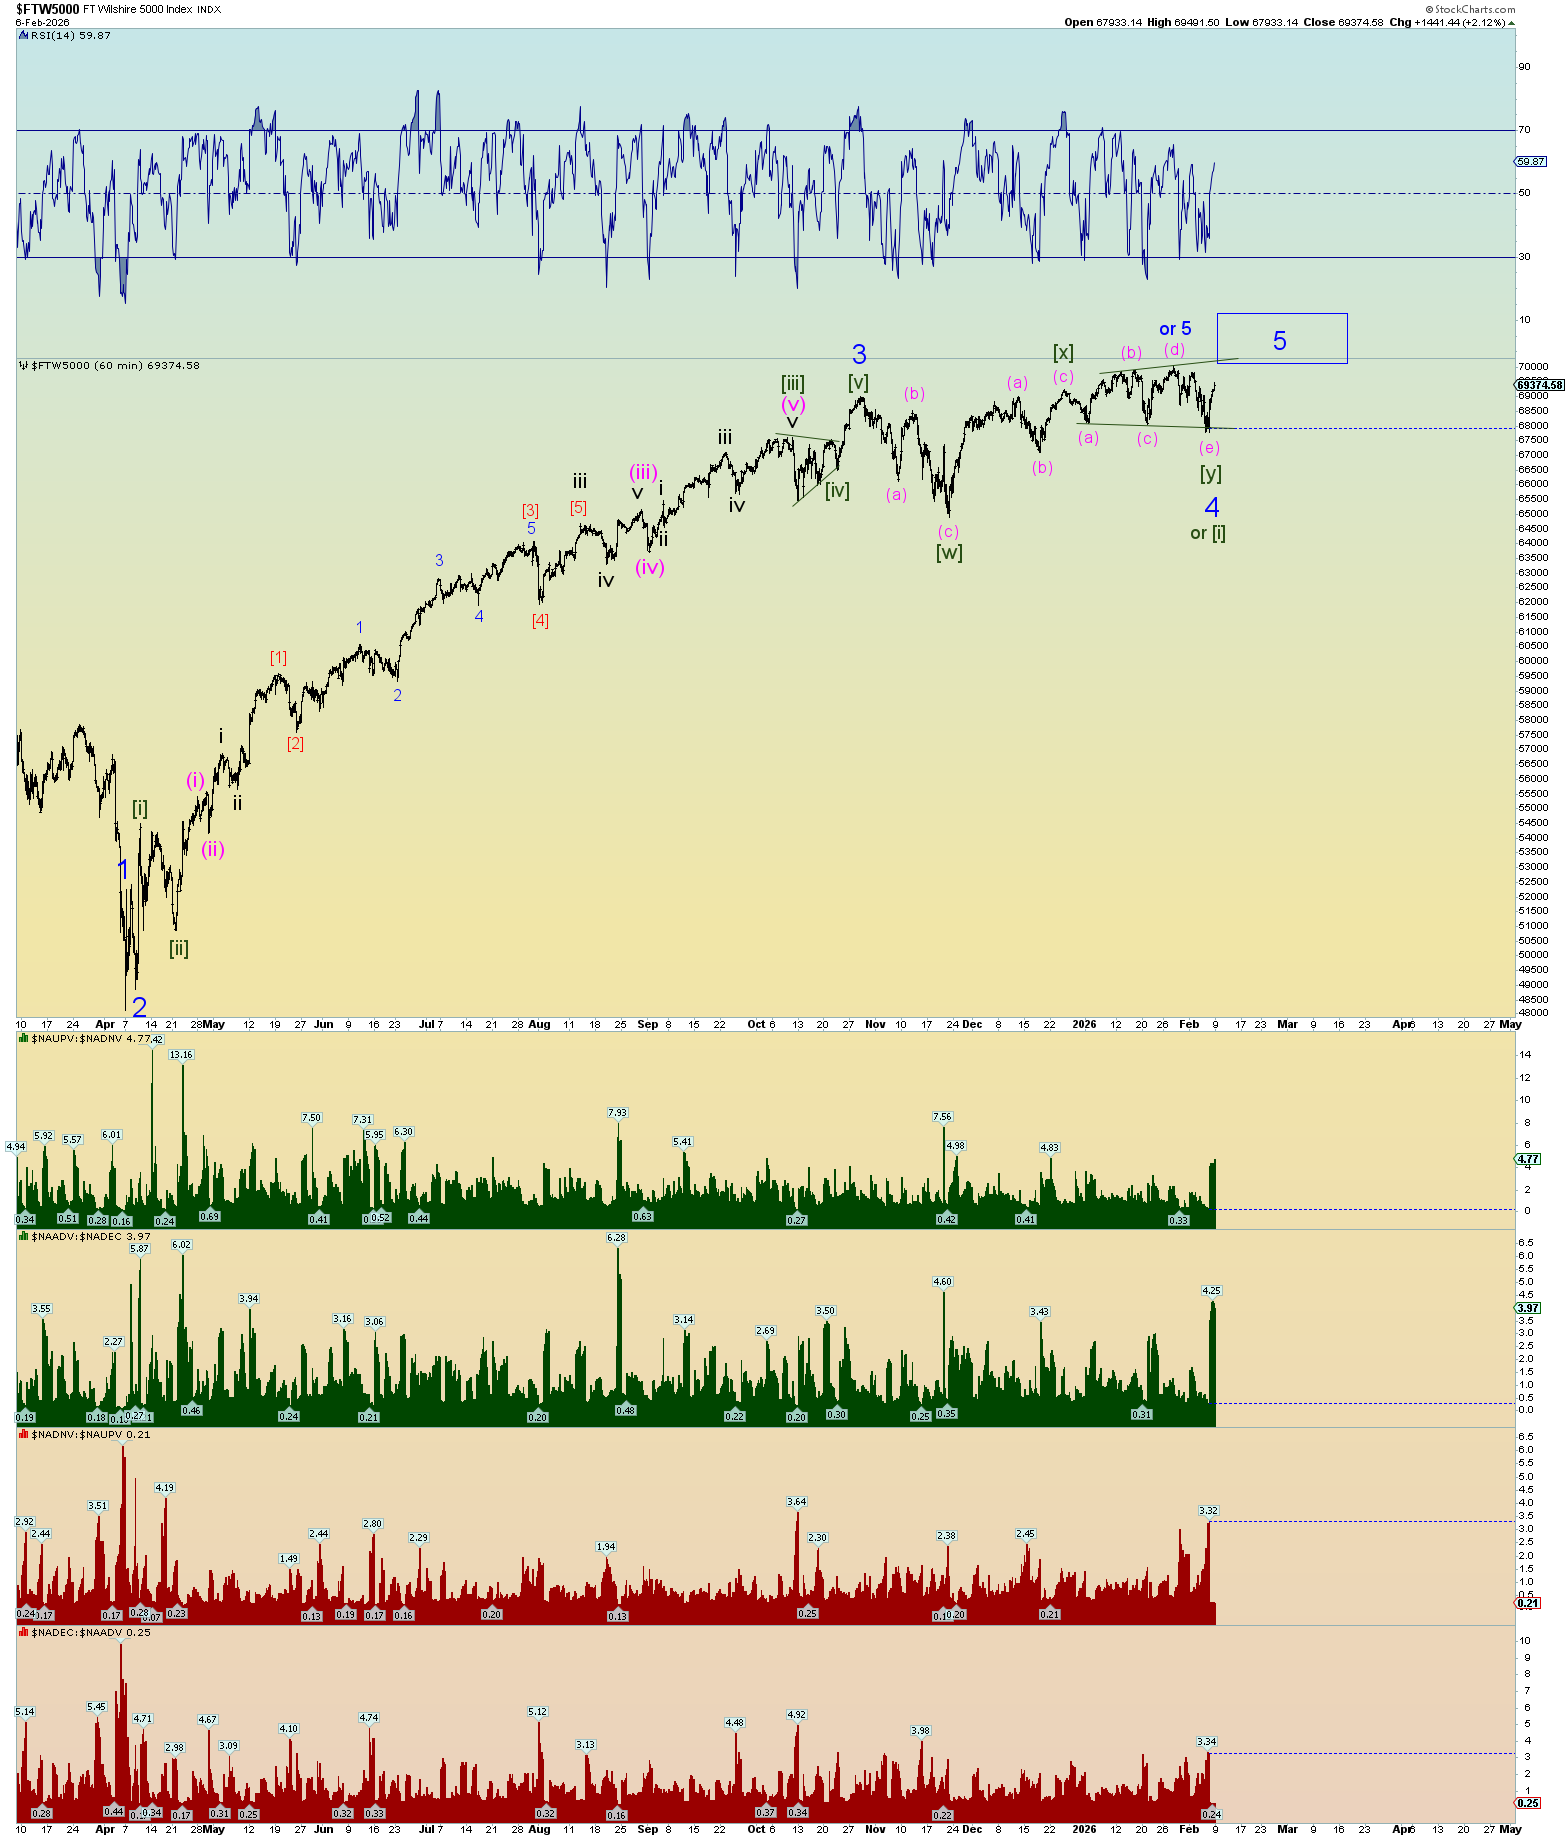
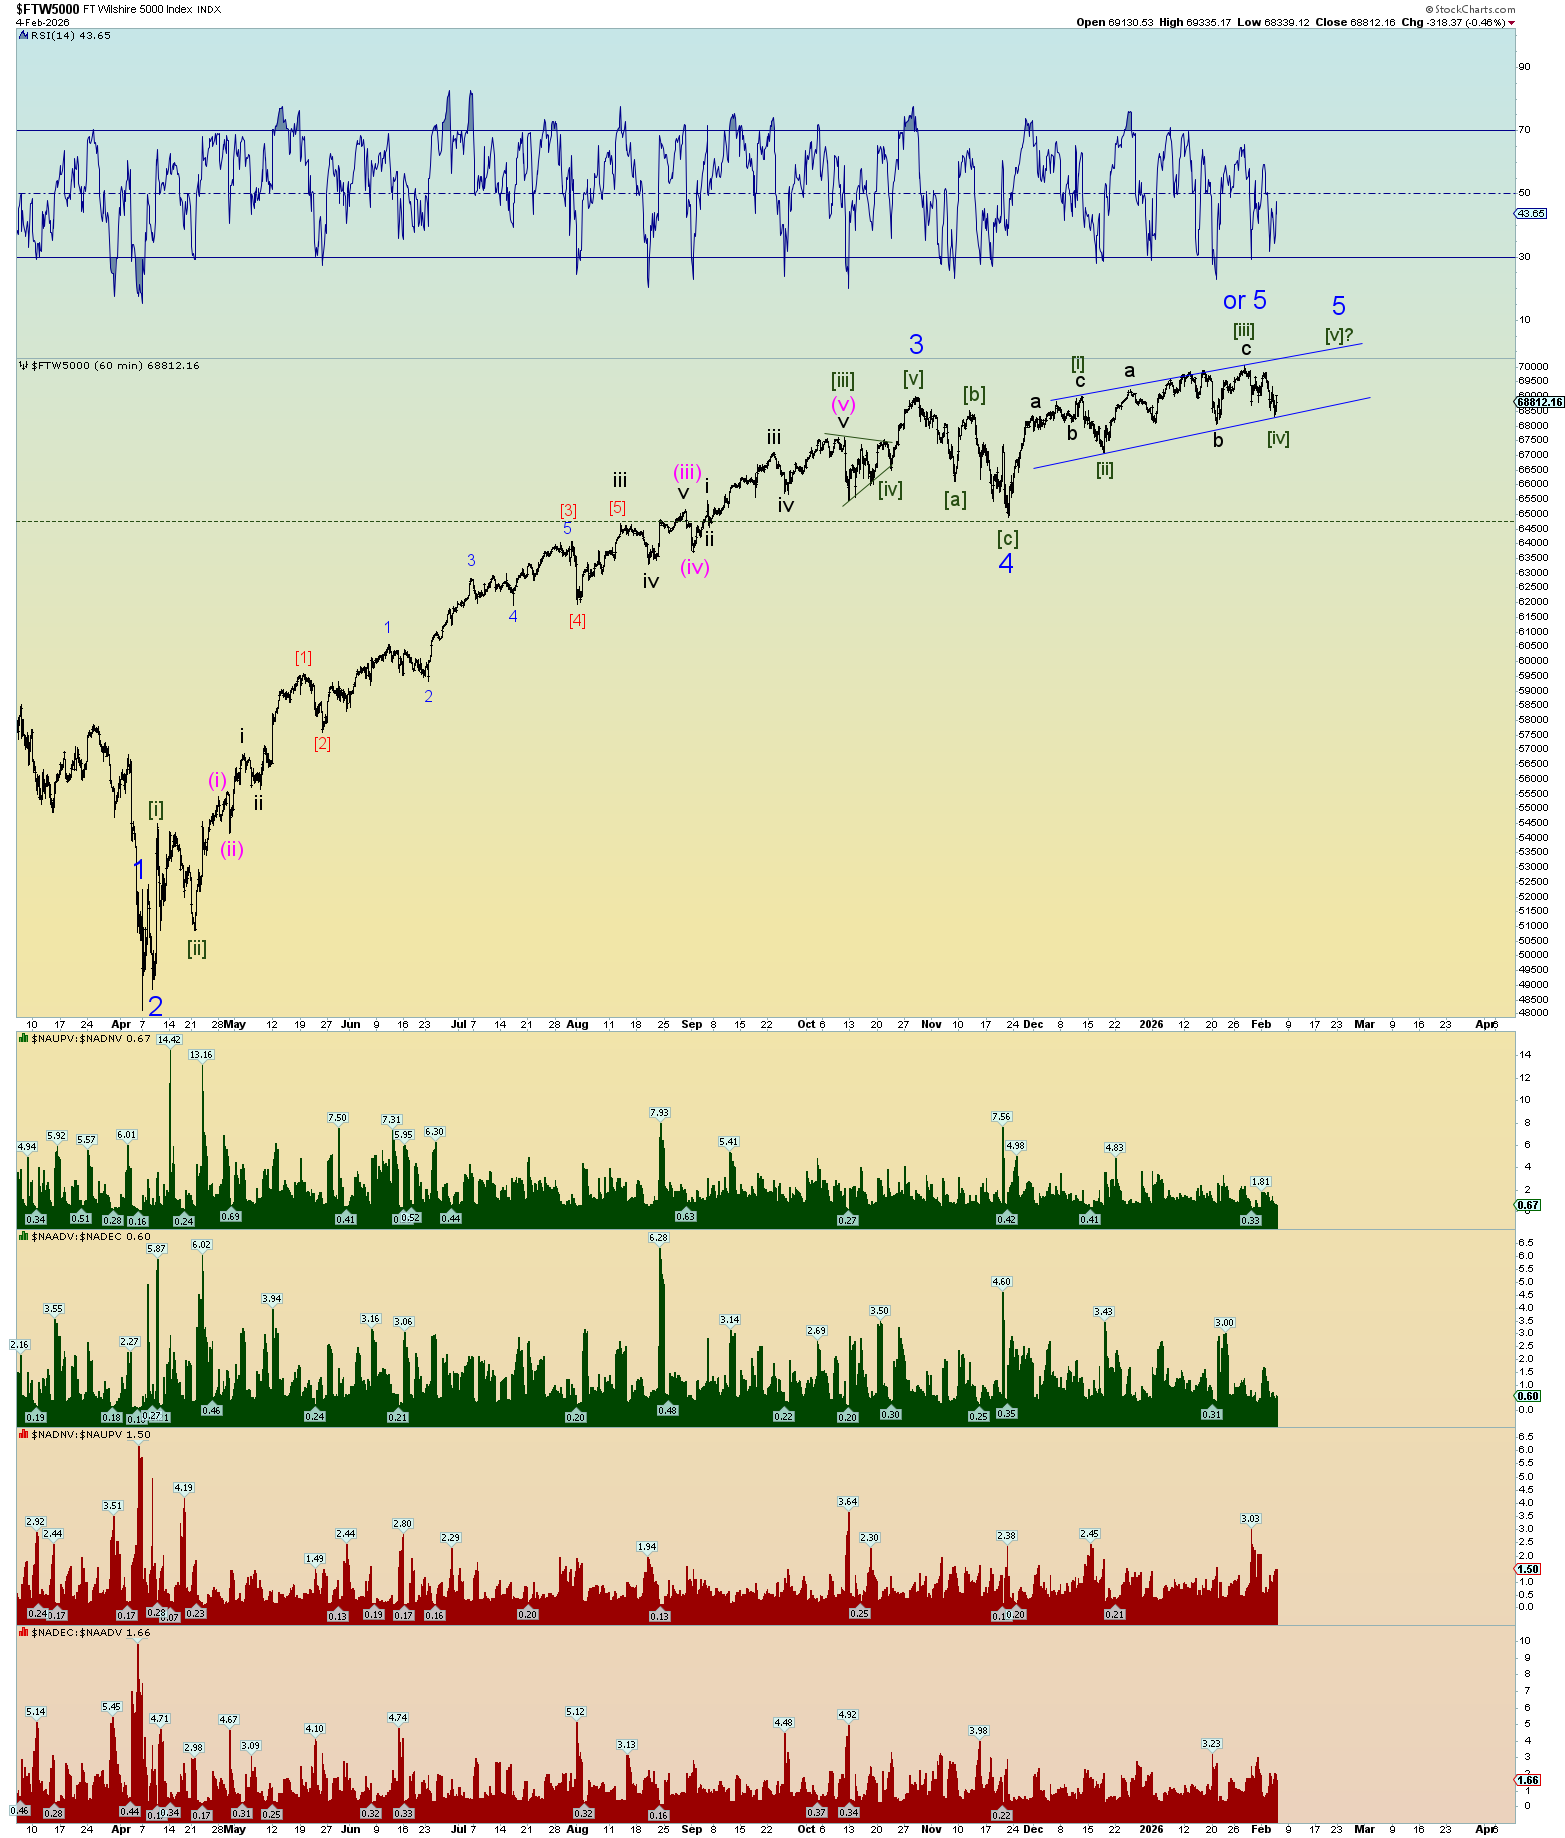
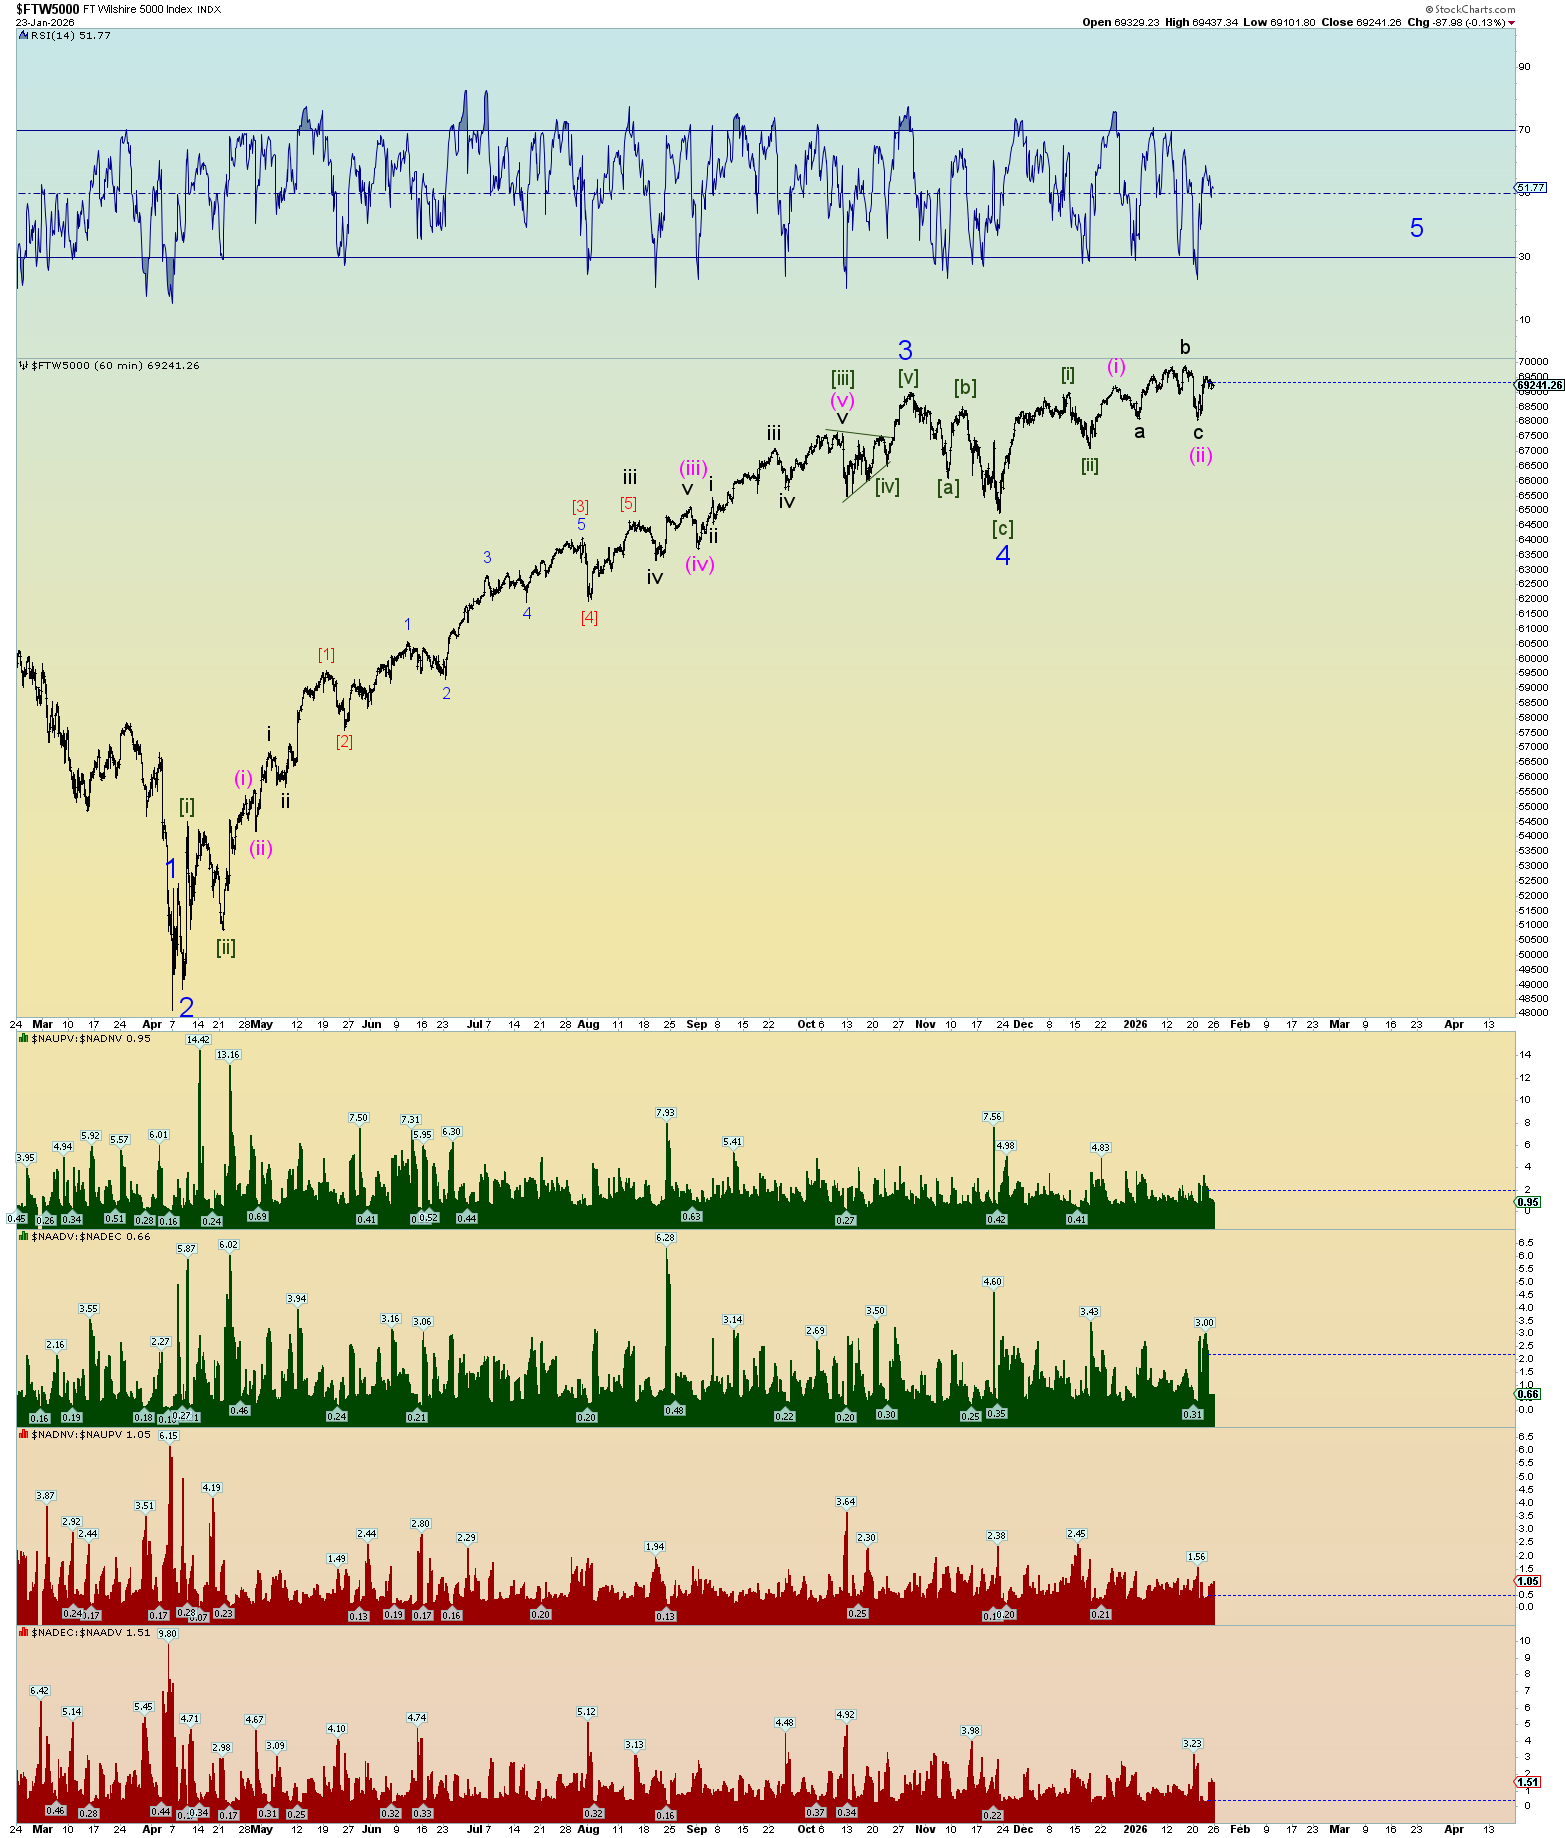
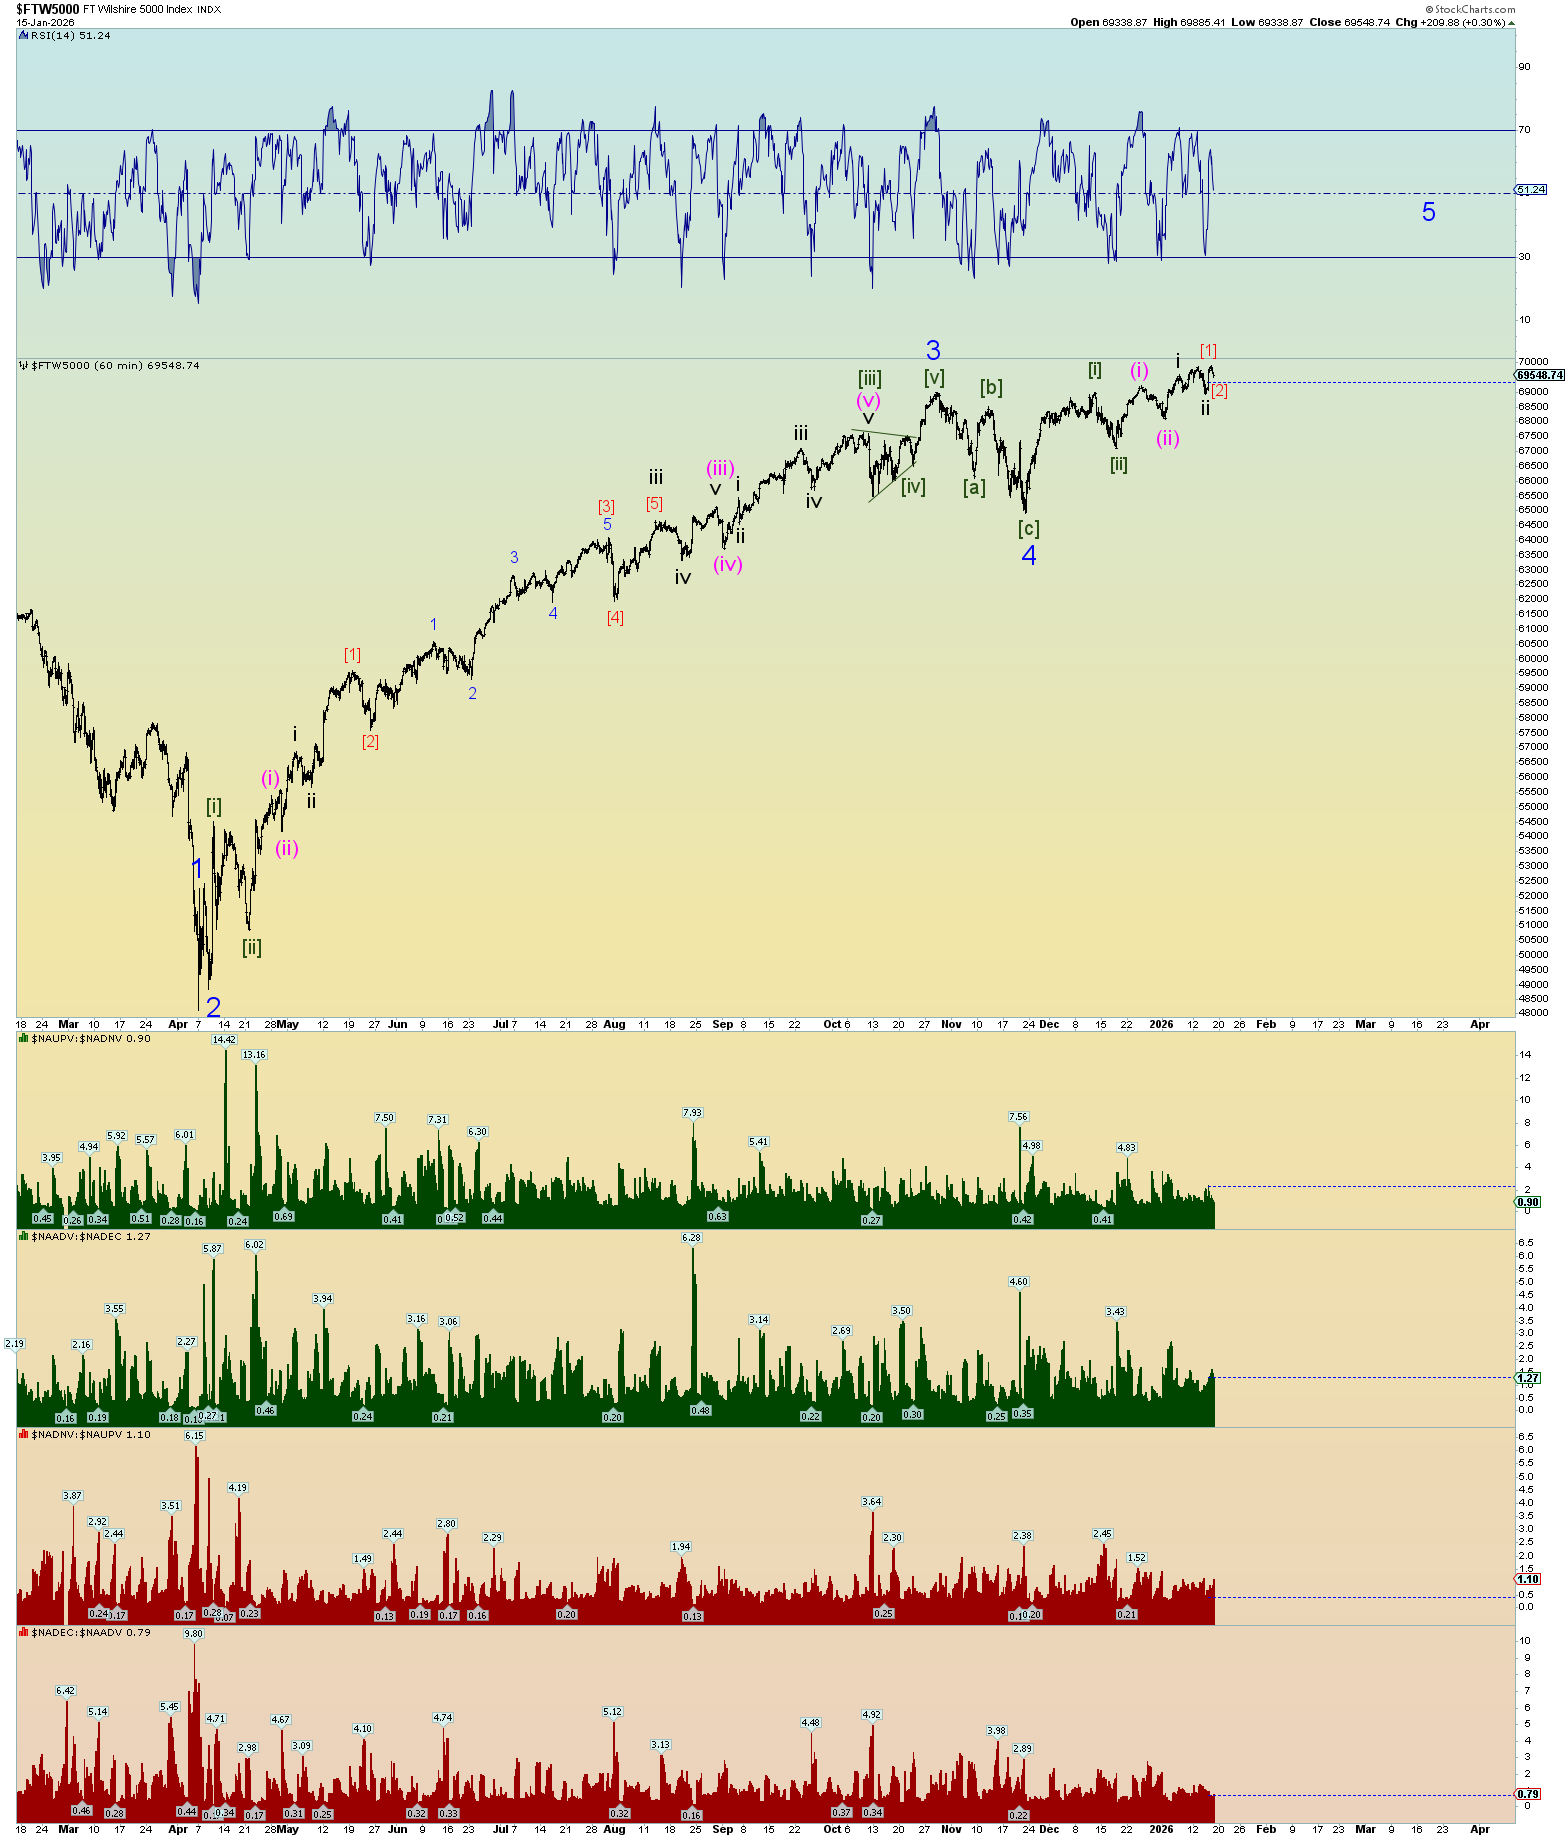
Best count for the Wilshire 5000 (and SPX). I’ll just stop calling an “alt” count and call it and “or” count. But seriously, the proposed ending diagonal has not panned out in terms of “exhaustion” and a quick price collapse as a result. Nope. That’s why I posted the 3-3-3 Minor 4 count last night because it seemed to me the market may have played her hand. But yet at about 19:15 EST last night futures were down about a half a percent, and I thought, well, the ending diagonal collapse is coming. And then I thought, well, these things have a habit of working themselves out by the market opening. And so, it did.
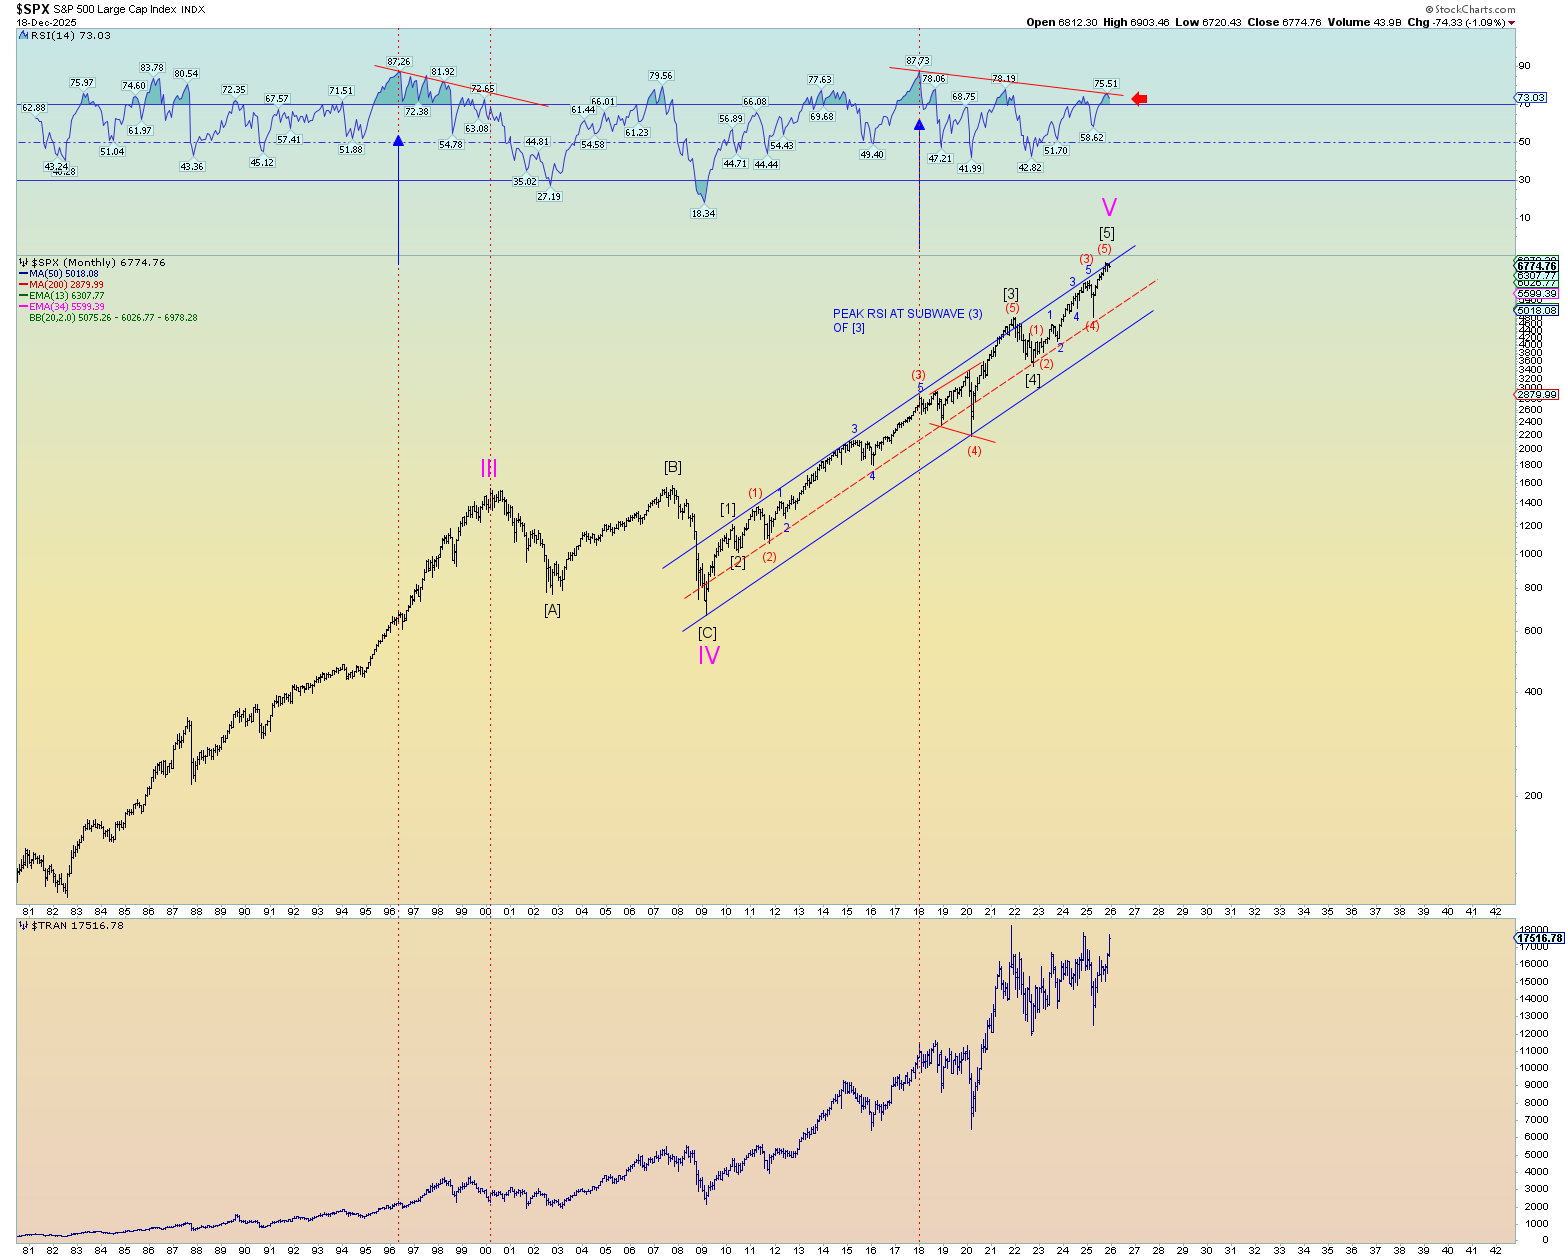
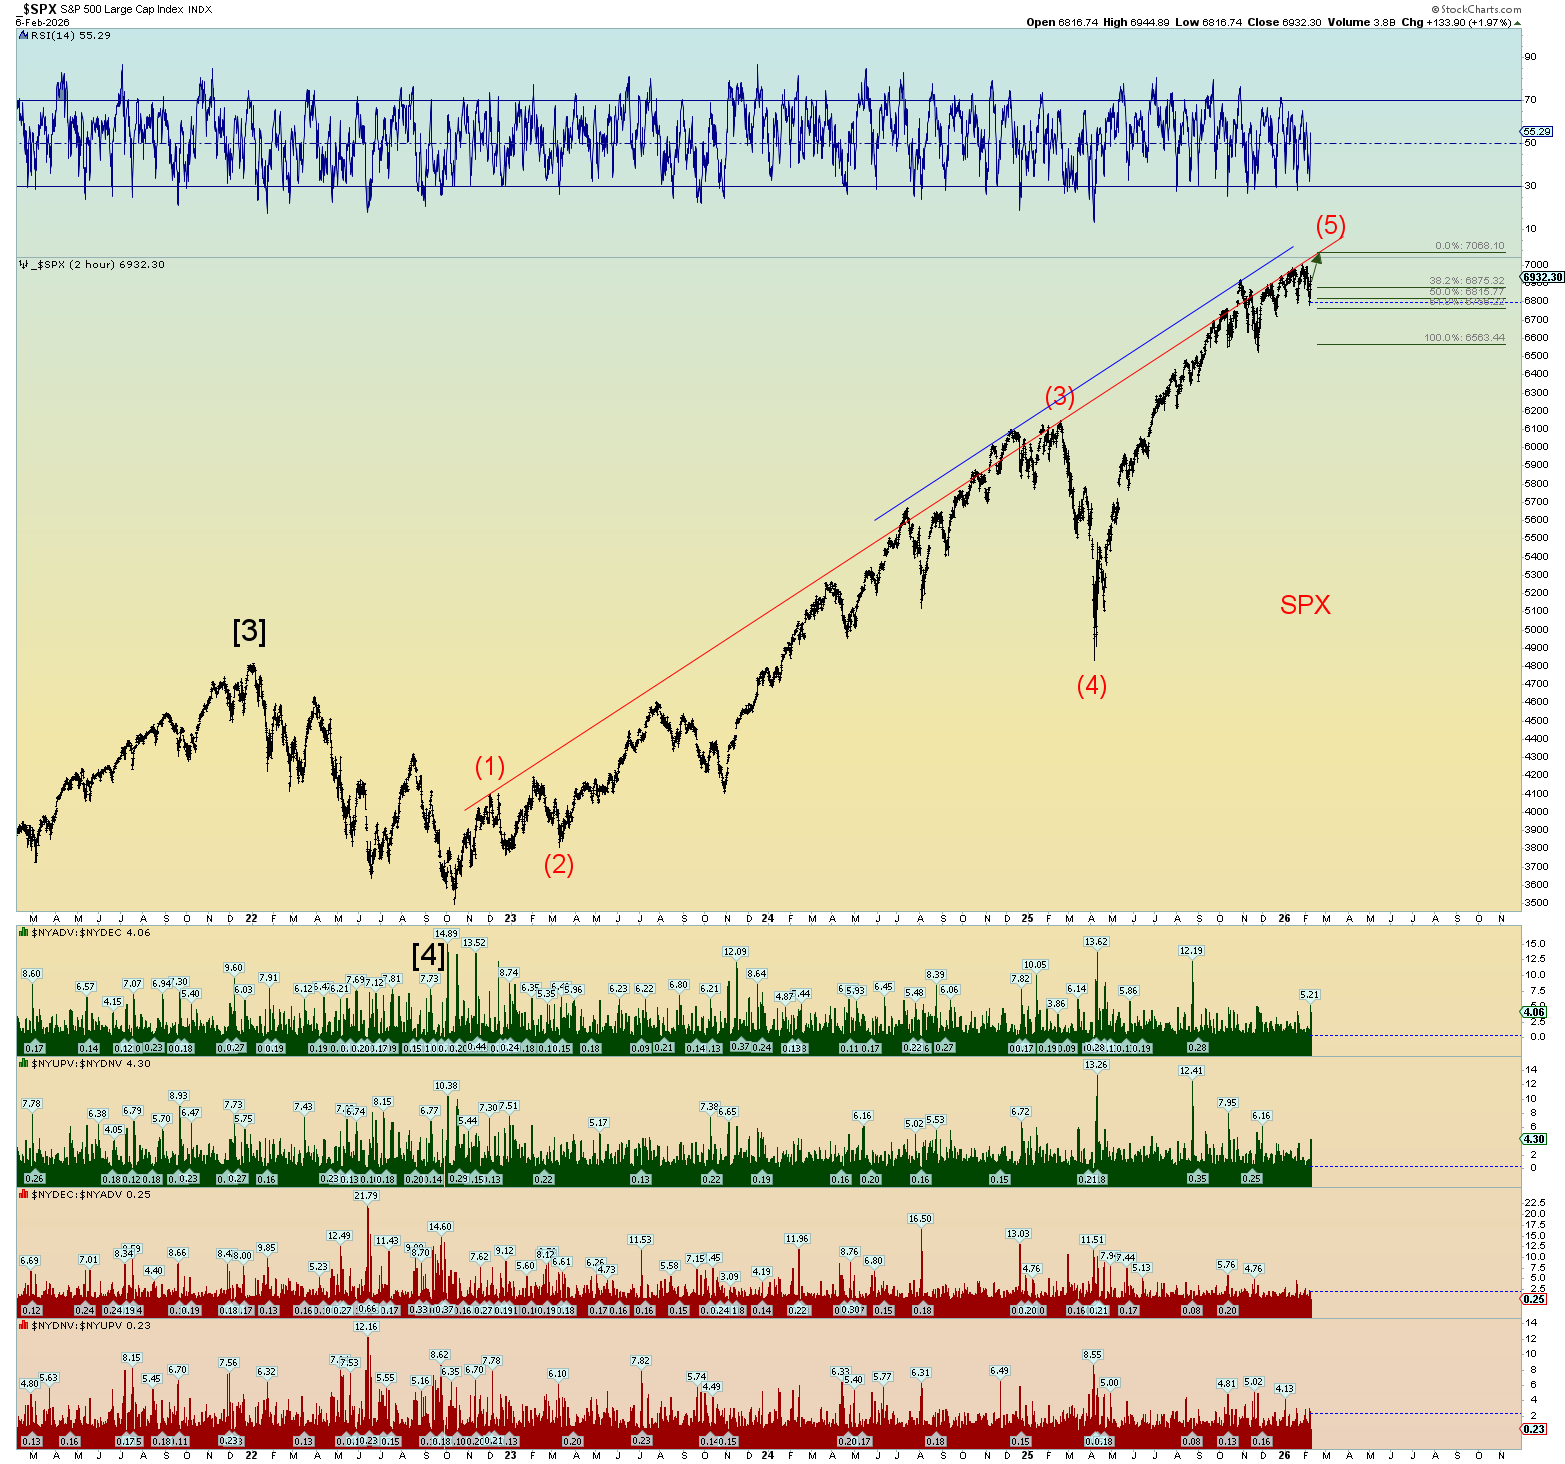
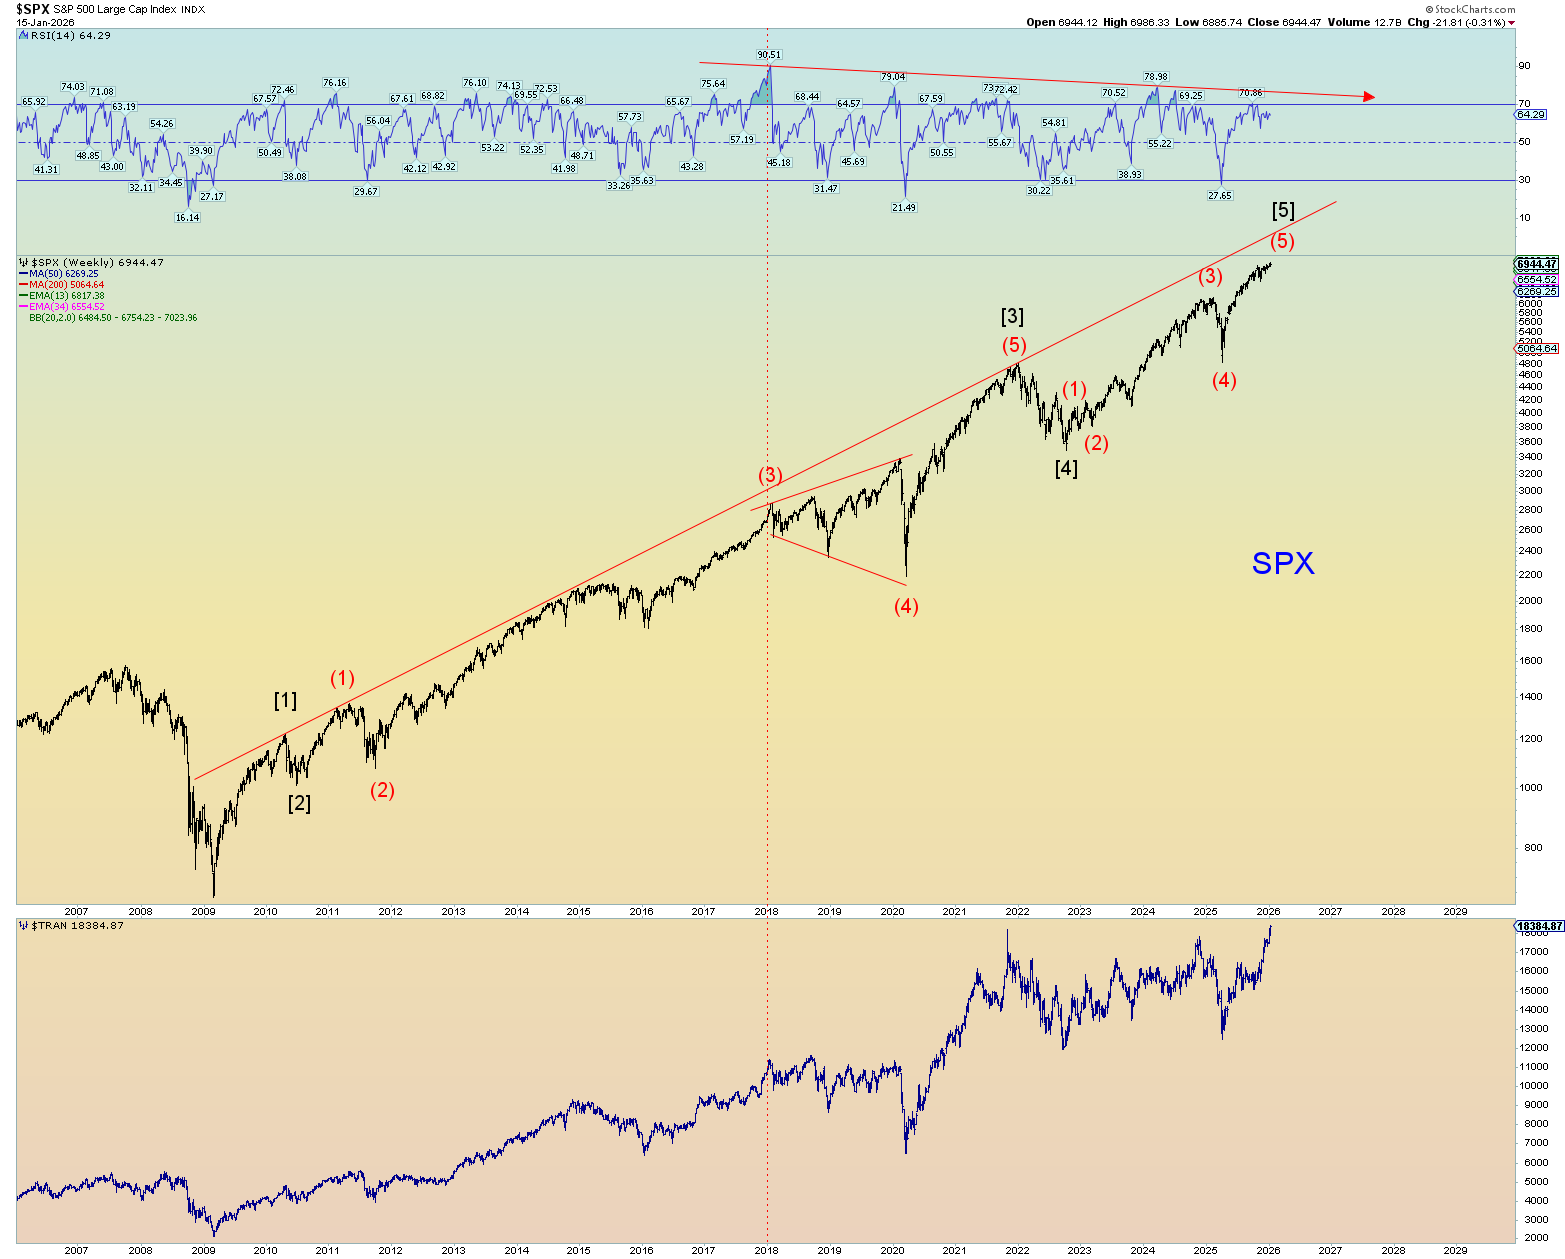
The SPX long term trendline. A hit upon it is probably the simplest of things.
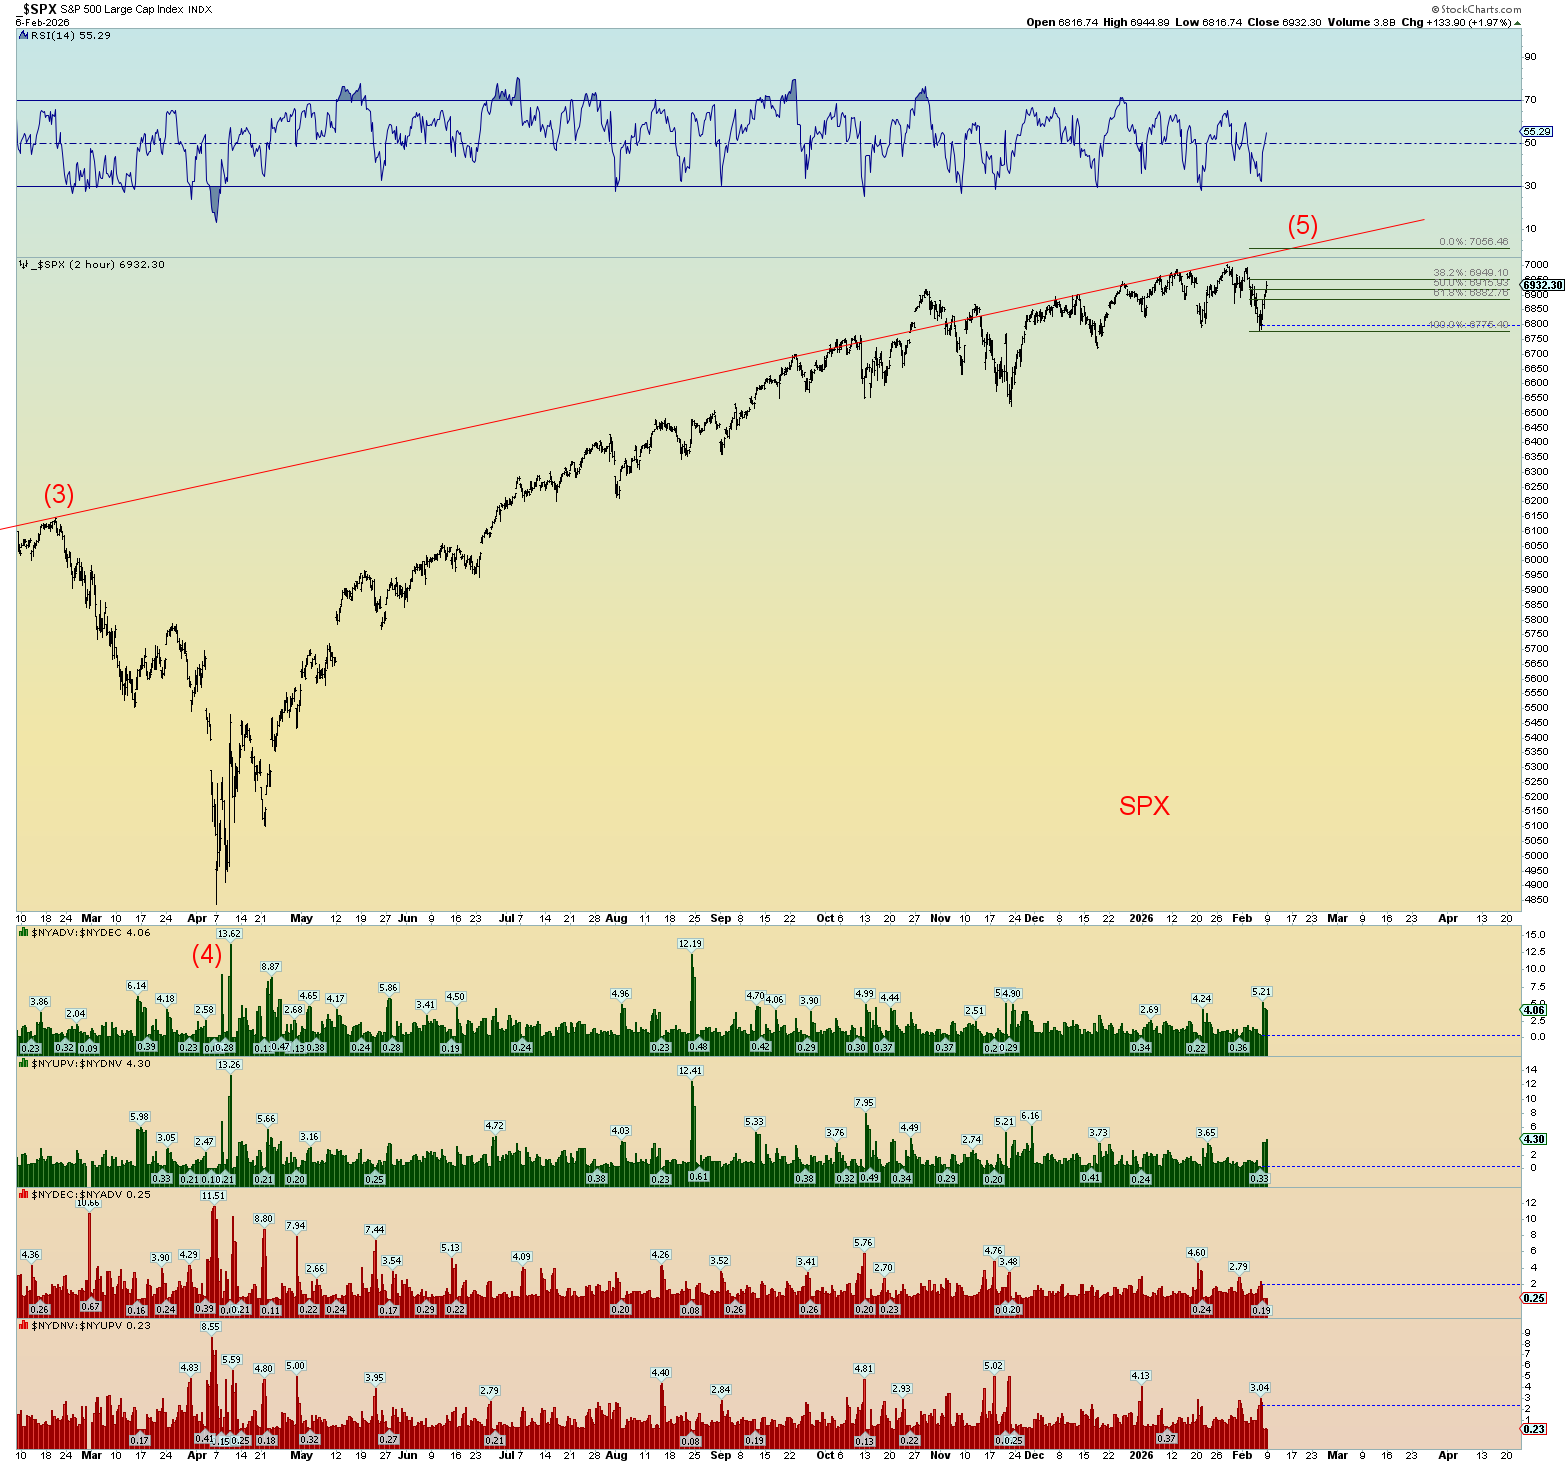
Zoomed in we can see the next likely strike.
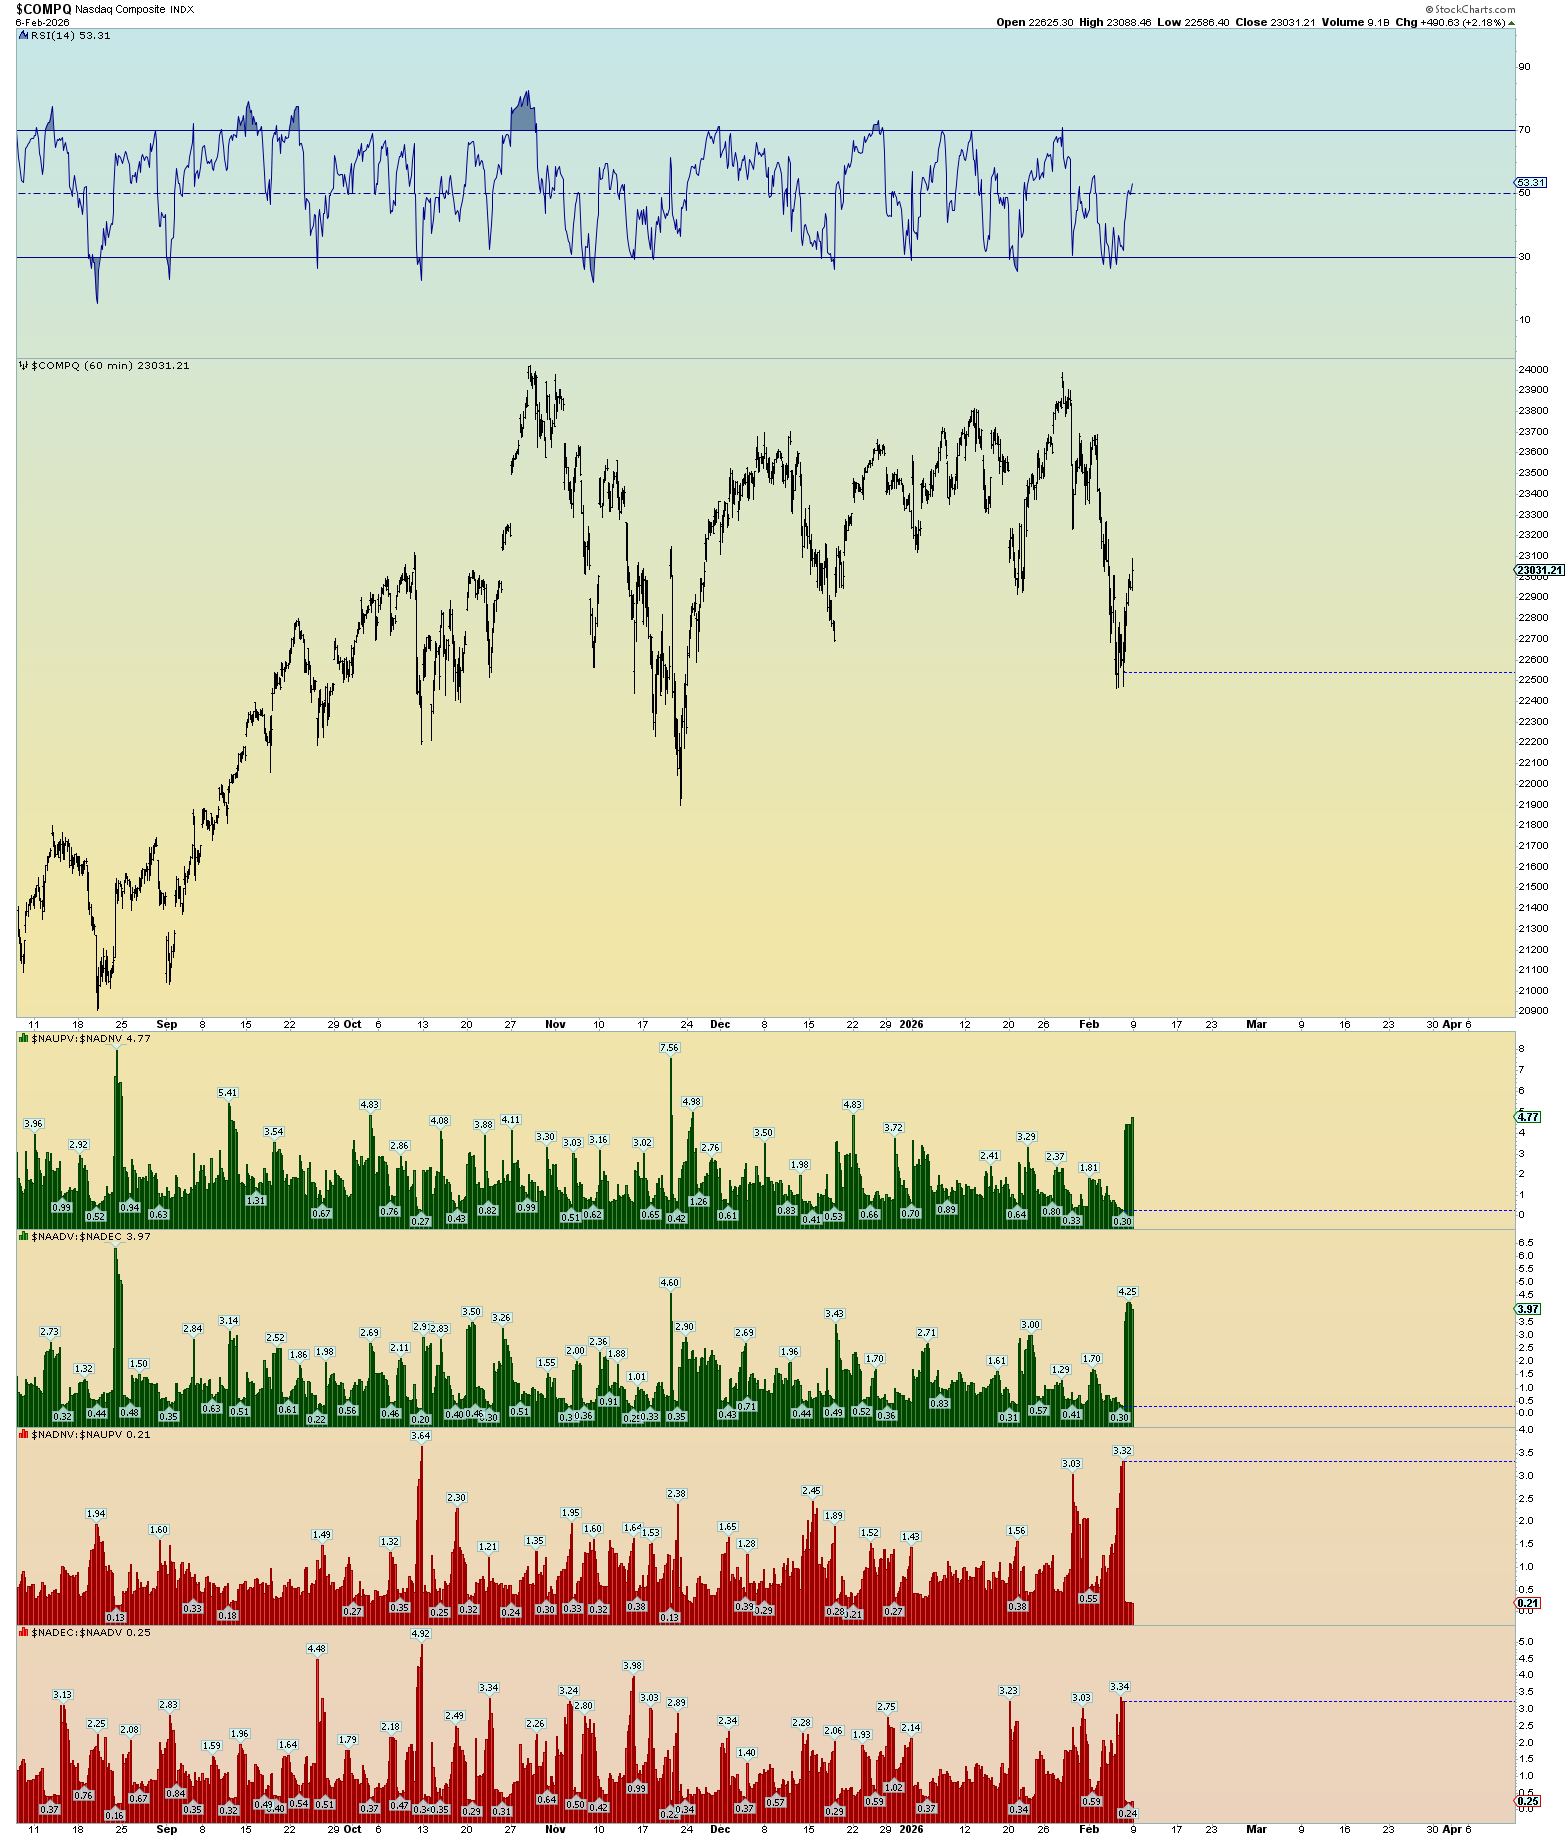
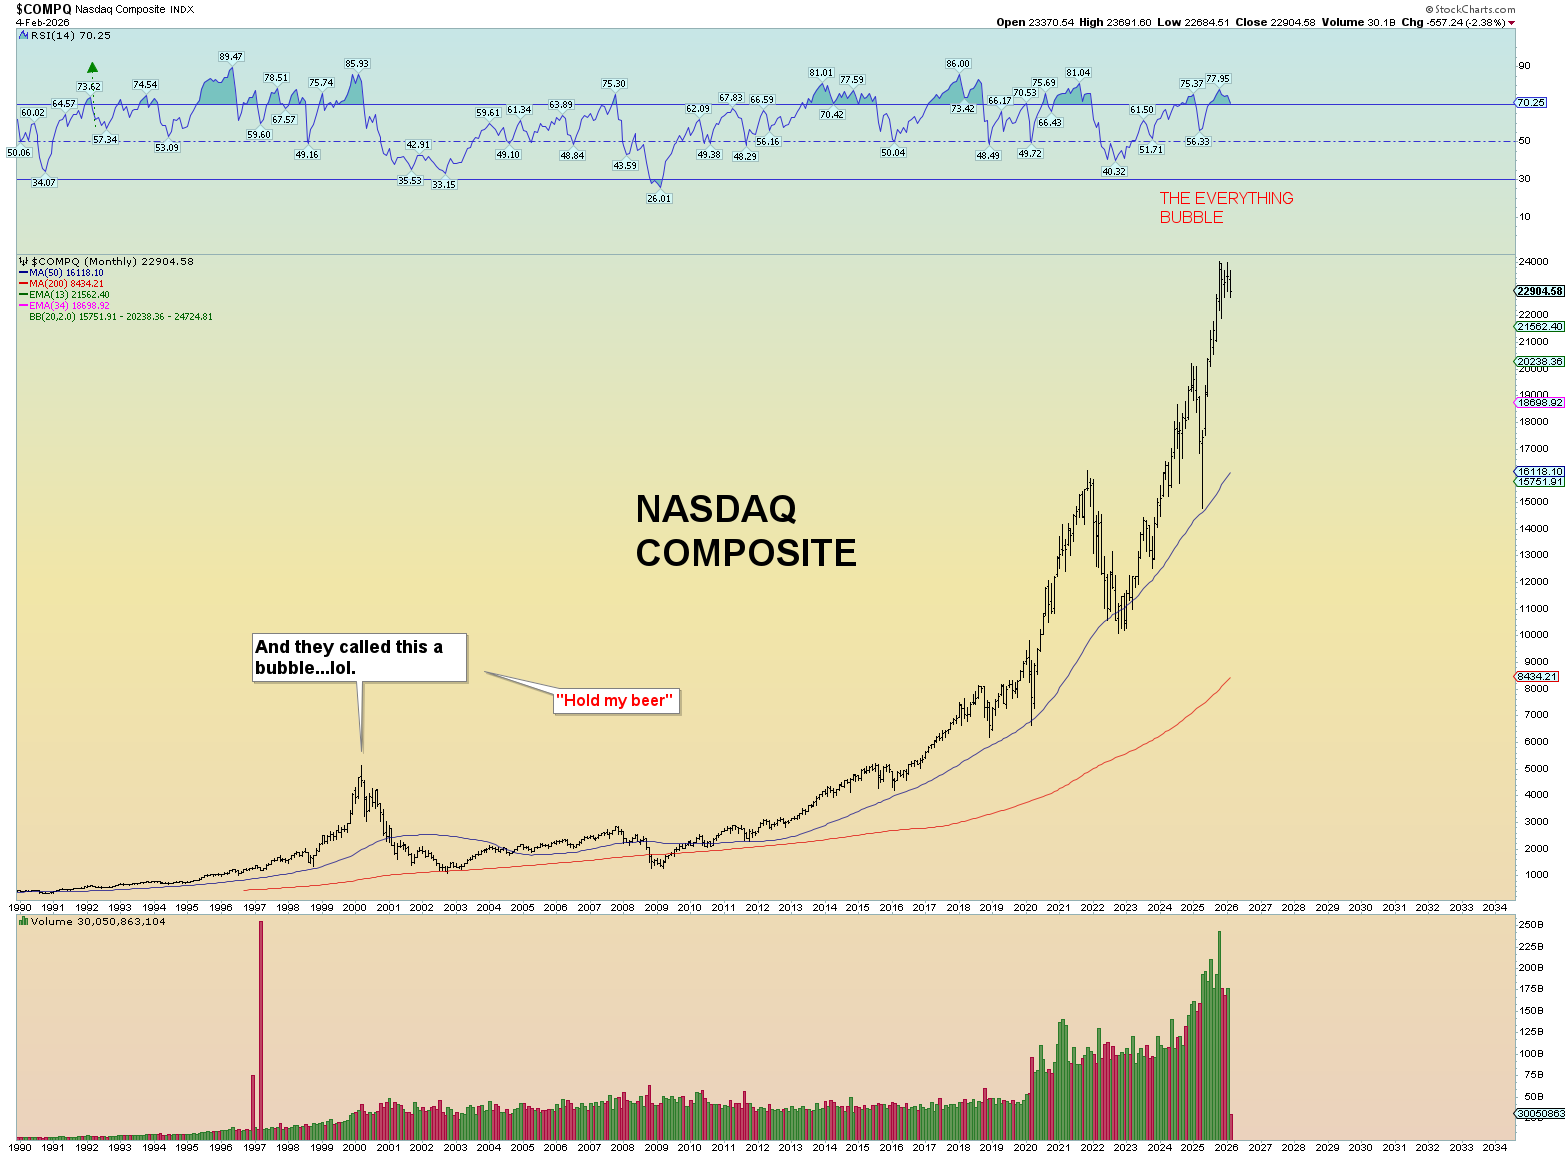
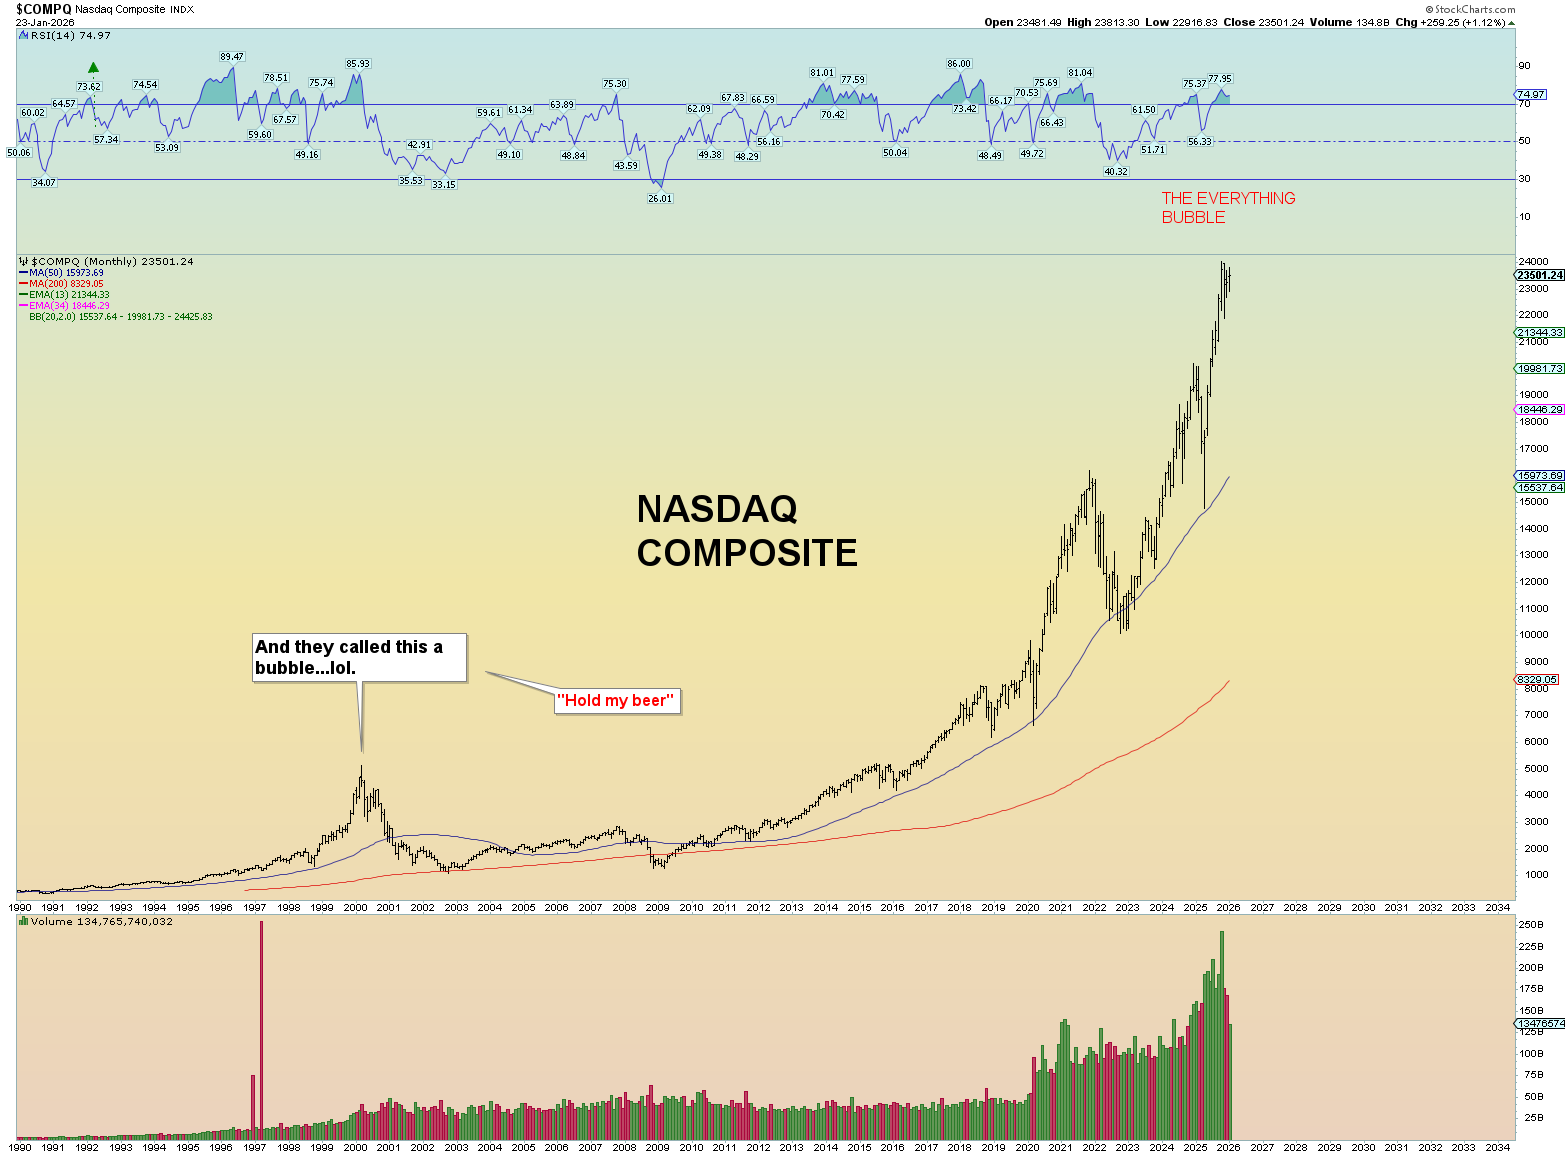
This is not to say that all is well. The COMPOSITE is lagging badly.
Yet it is a global phenomenon.
The everything bubble.
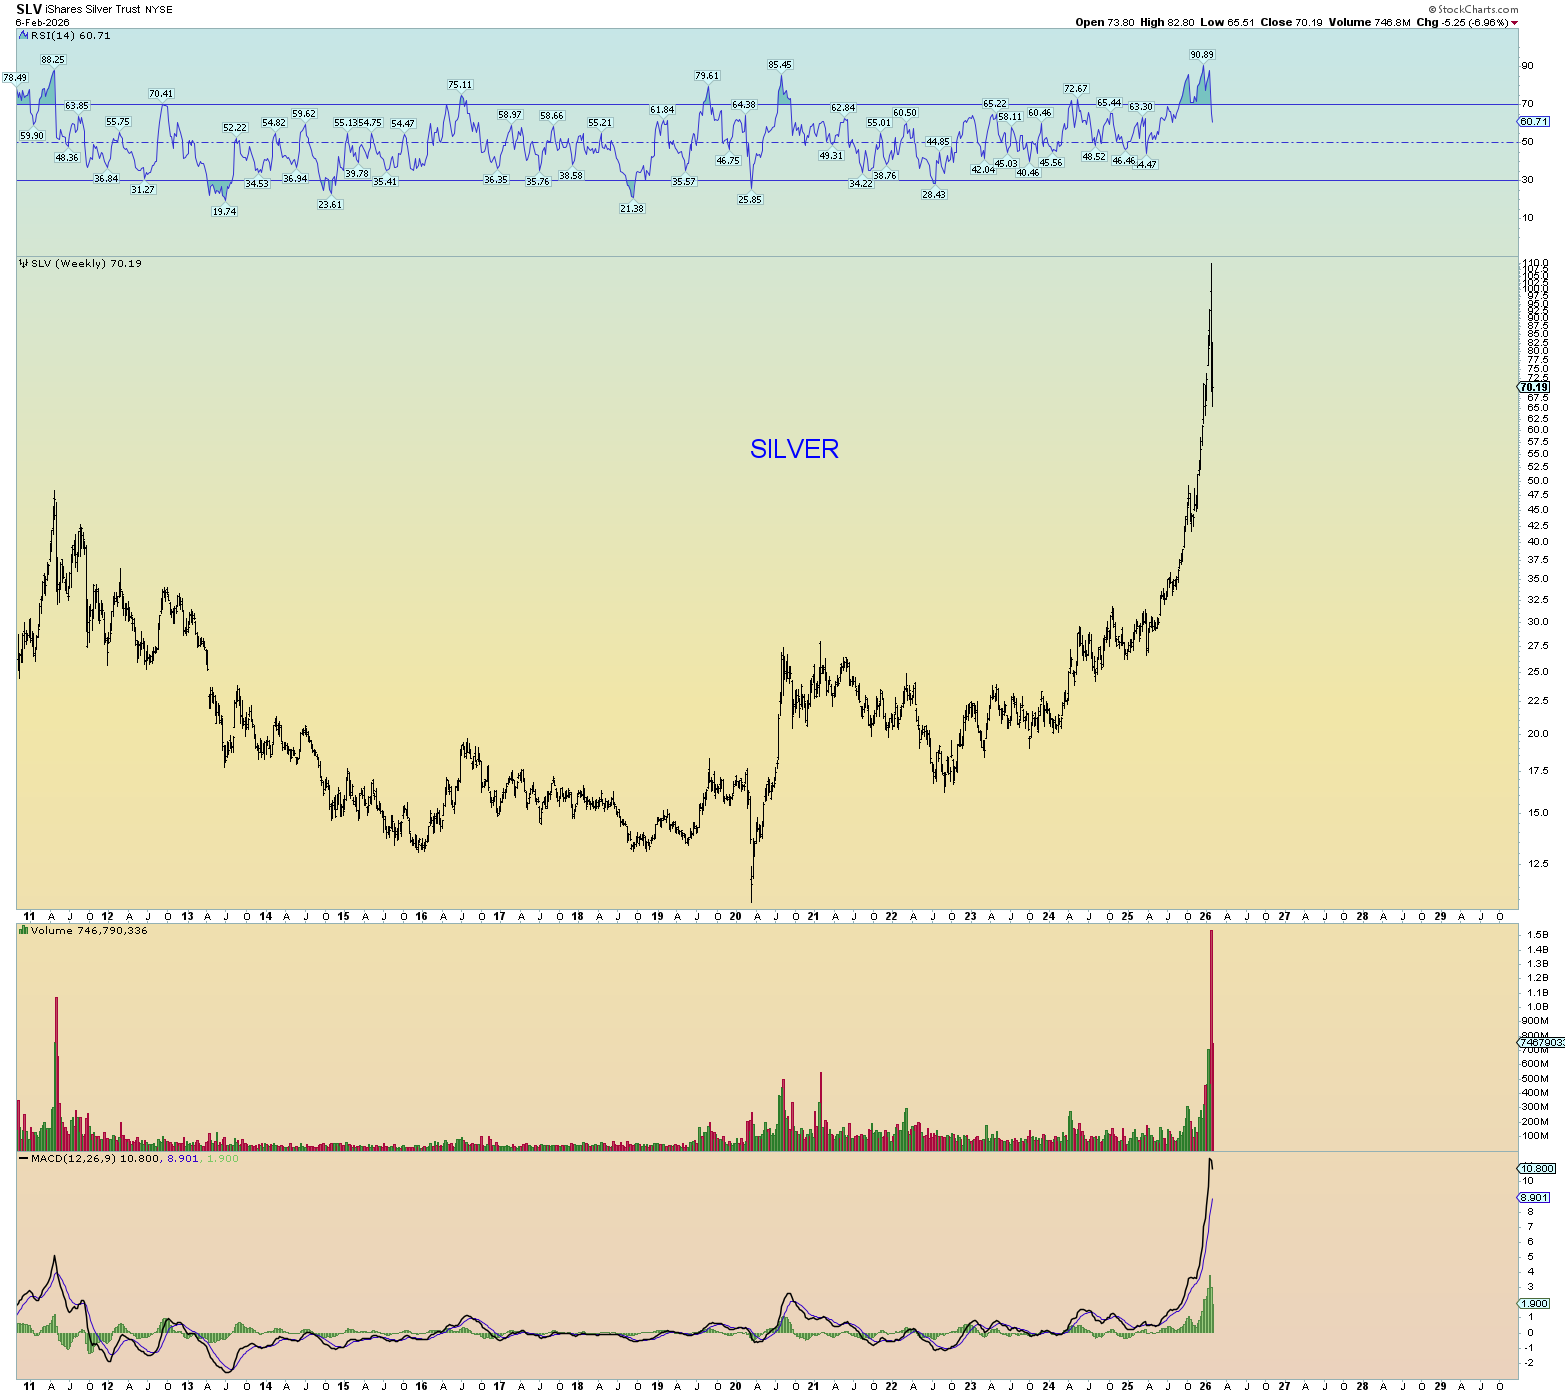
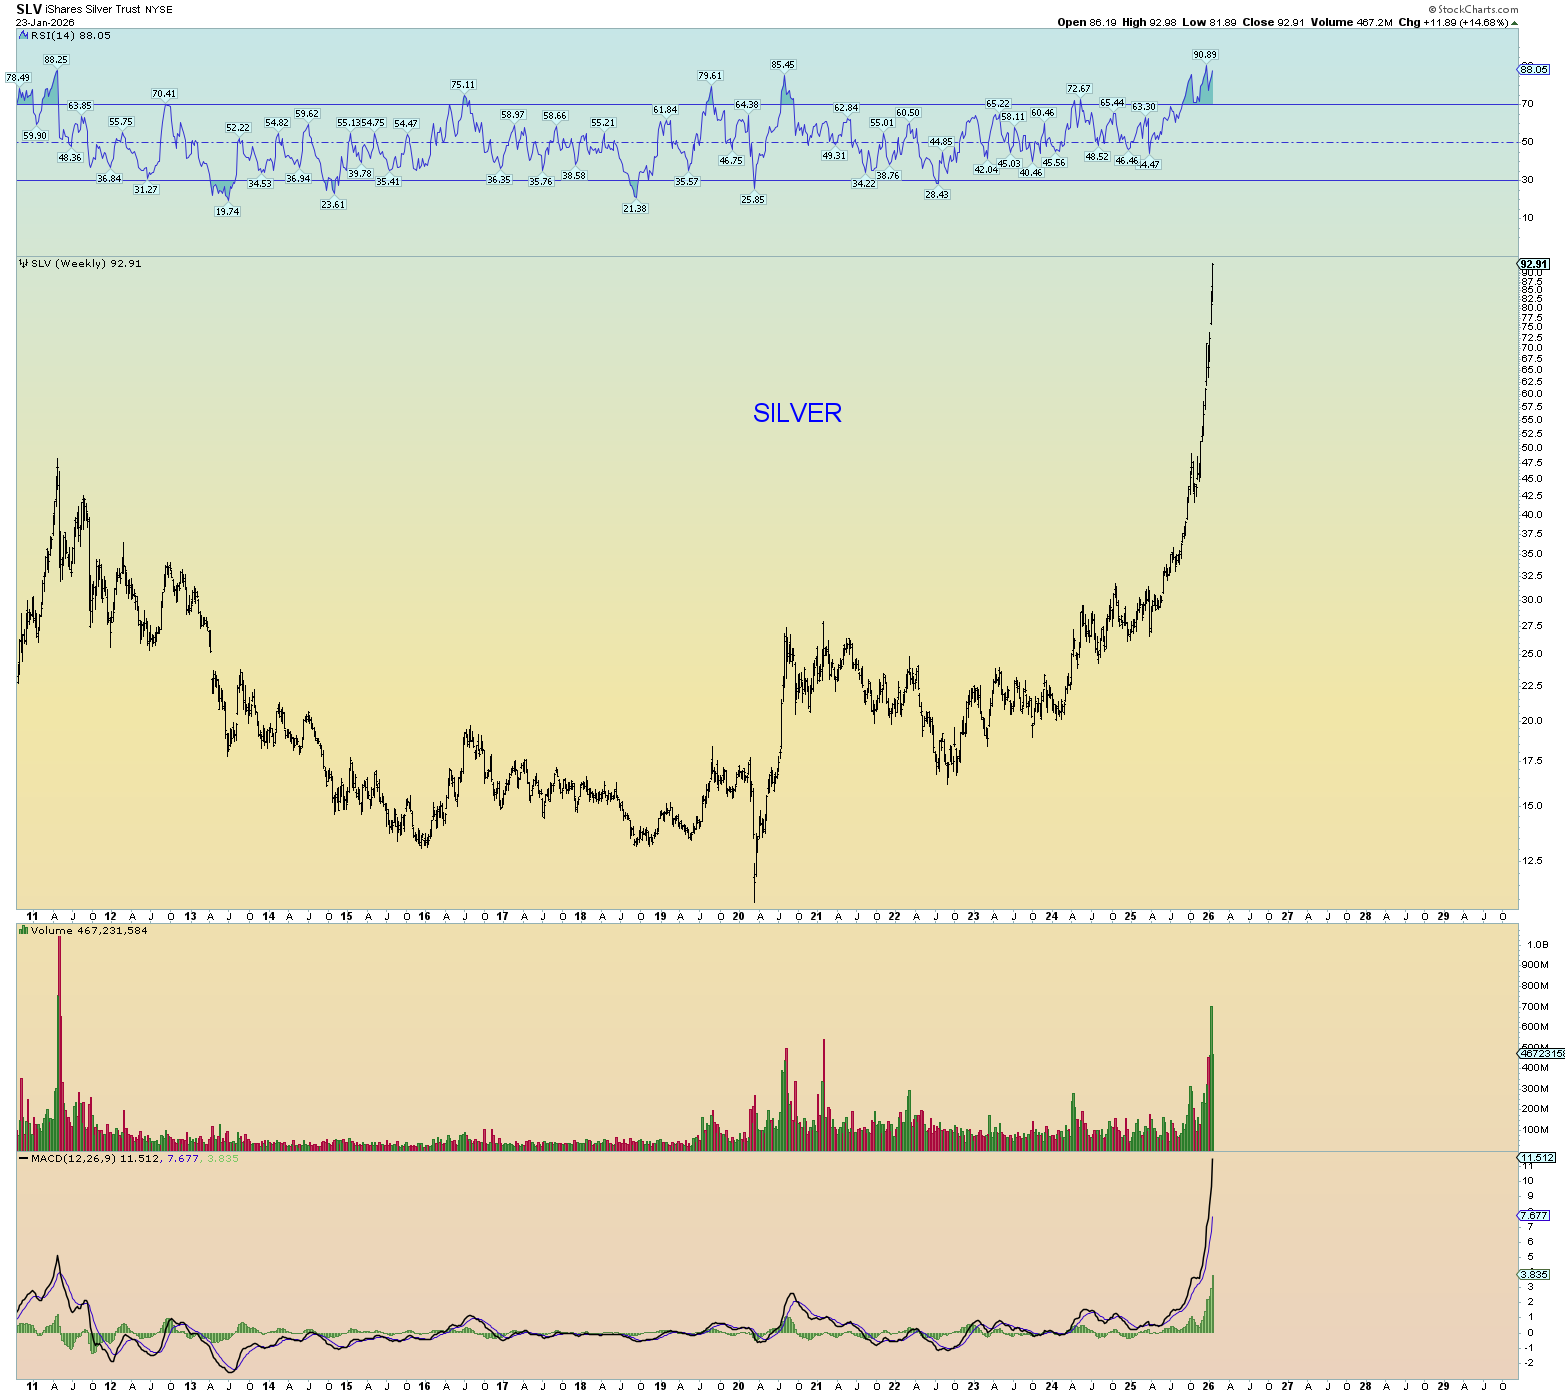
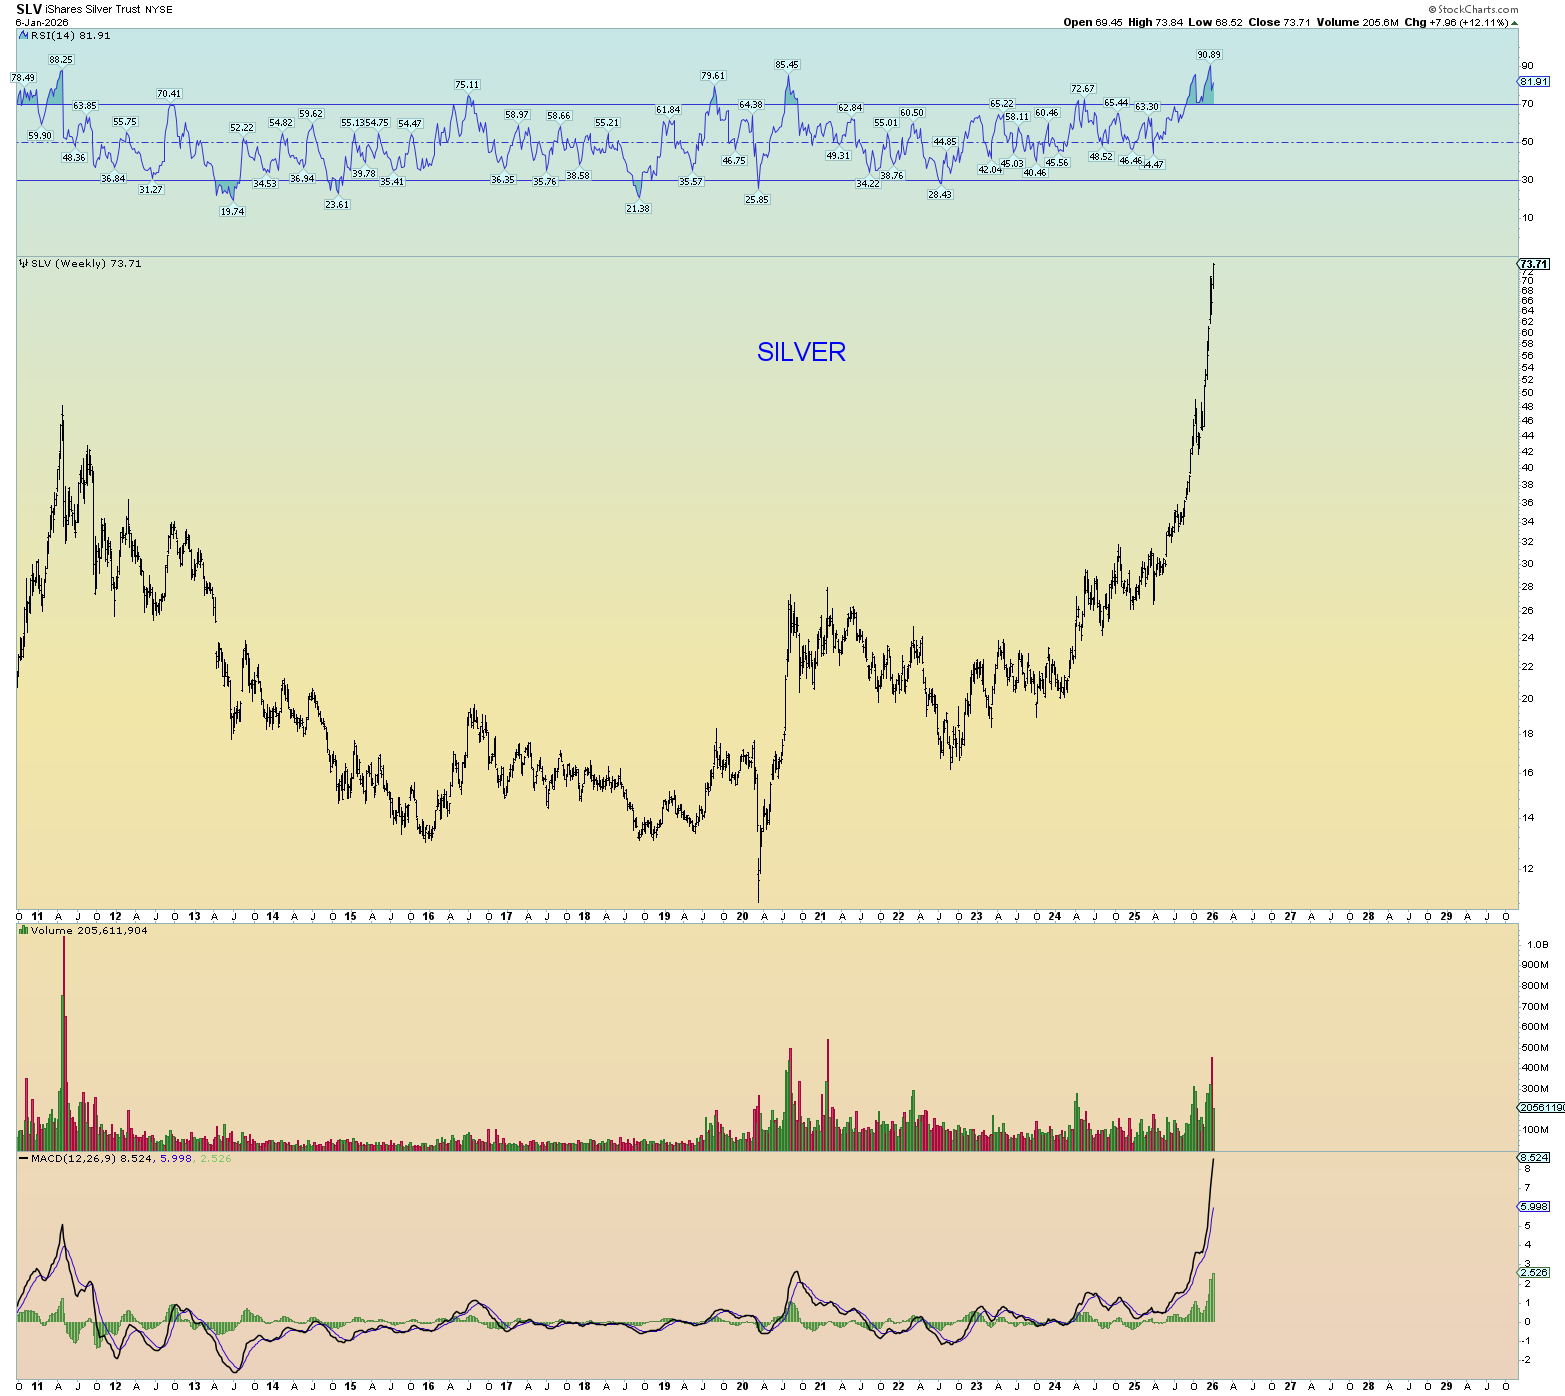
Talking heads saying historic collapse in silver. I rather say a historic dagger to the heart of the global financial system. Consider this the first dagger thrust up. Plunging deep into the fiat system and pulling back to consolidate and then thrust again in due time.
FOR THE BEARS:
The waves have been strange. If there was an ending diagonal triangle at the top – and that today was merely a relief rally – perhaps this was a result of a falling wedge.
An ending upwards triangle followed by a leading down triangle.
These kinds of counts are exciting. Because they demand quicker resolution. In other words, a very bad Monday/Tuesday to retrace this entire rise back beneath and making a lower low. After all, the DOW finished over 50K. How many of the rich do you think said to themselves, “I’m selling it all if it finishes at 50K DOW.”
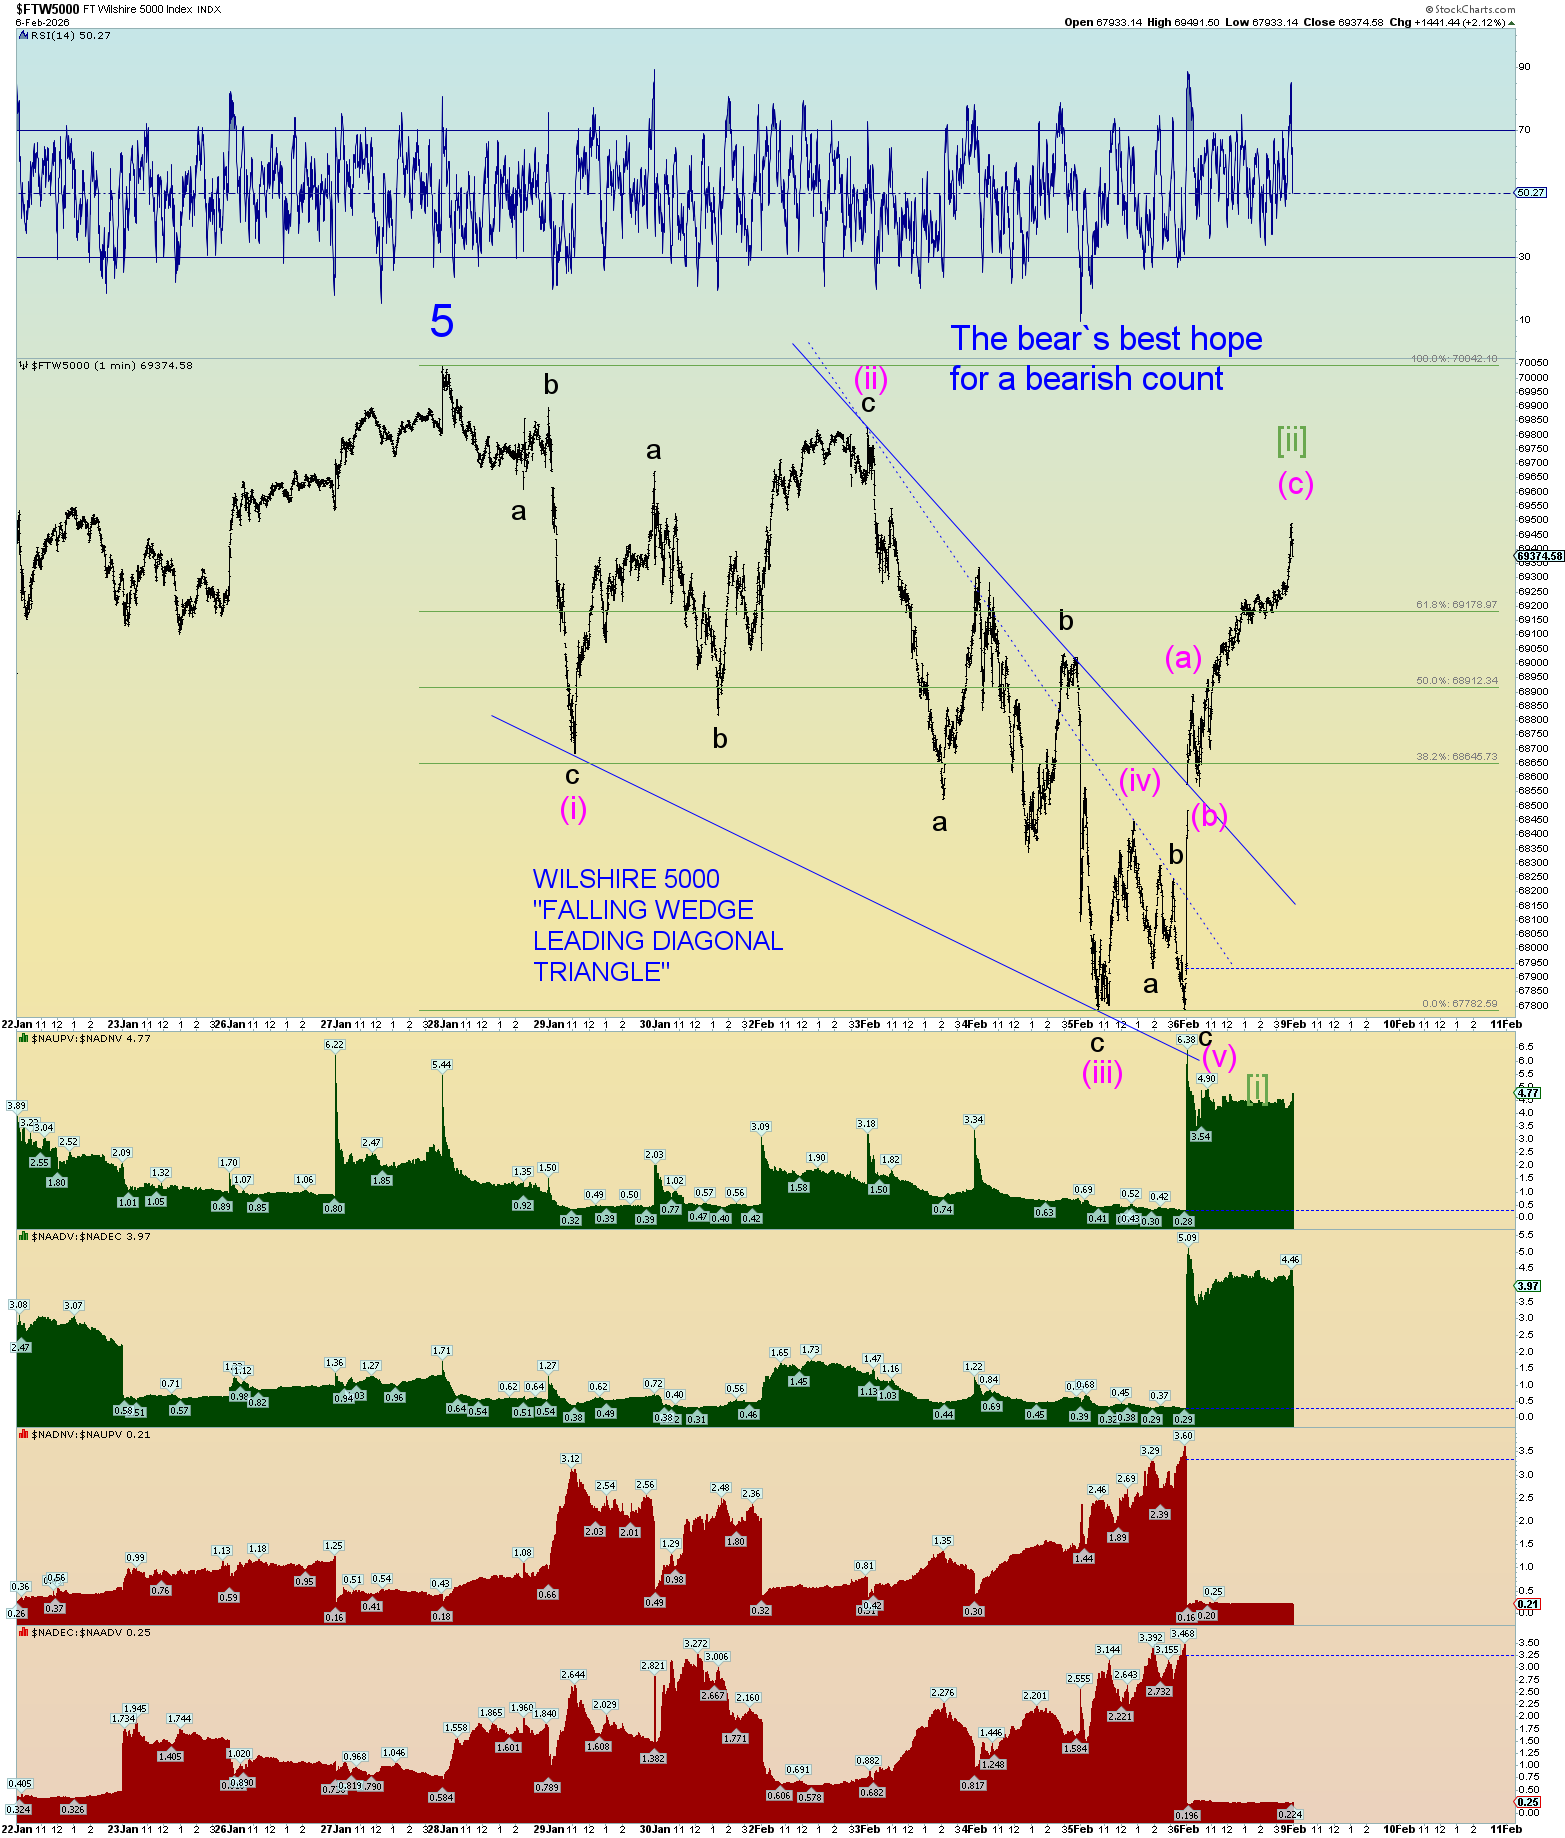
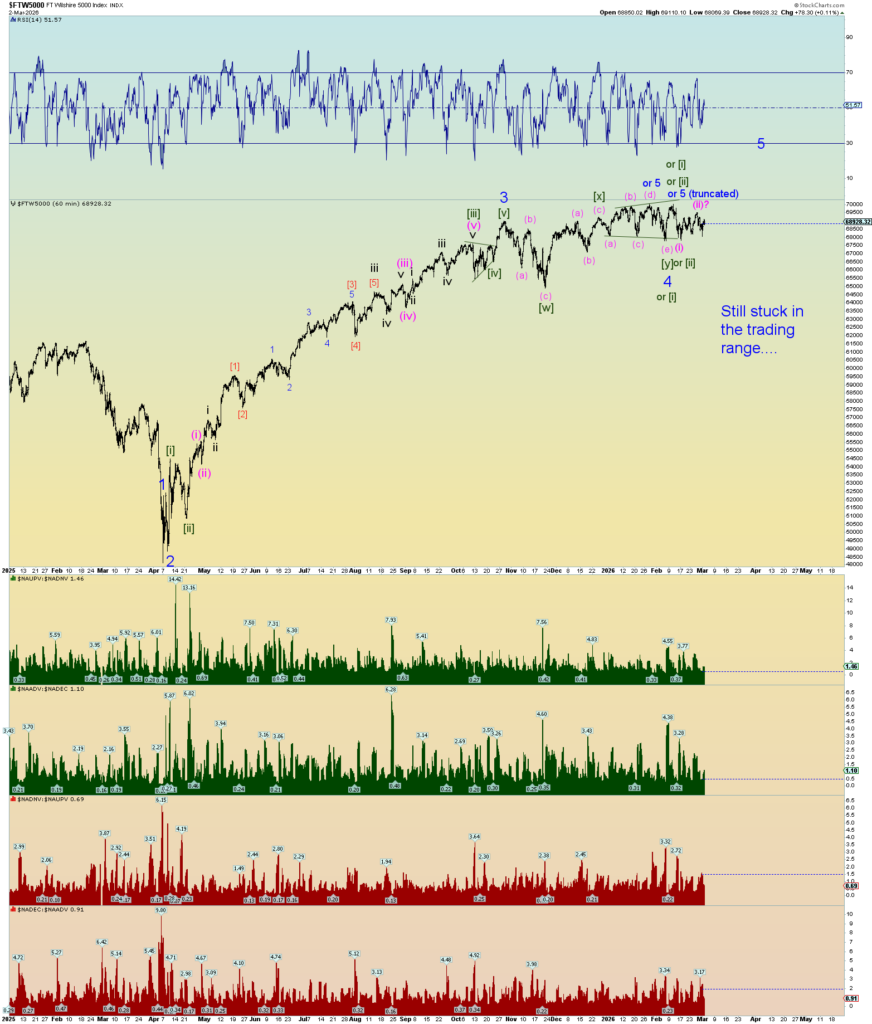
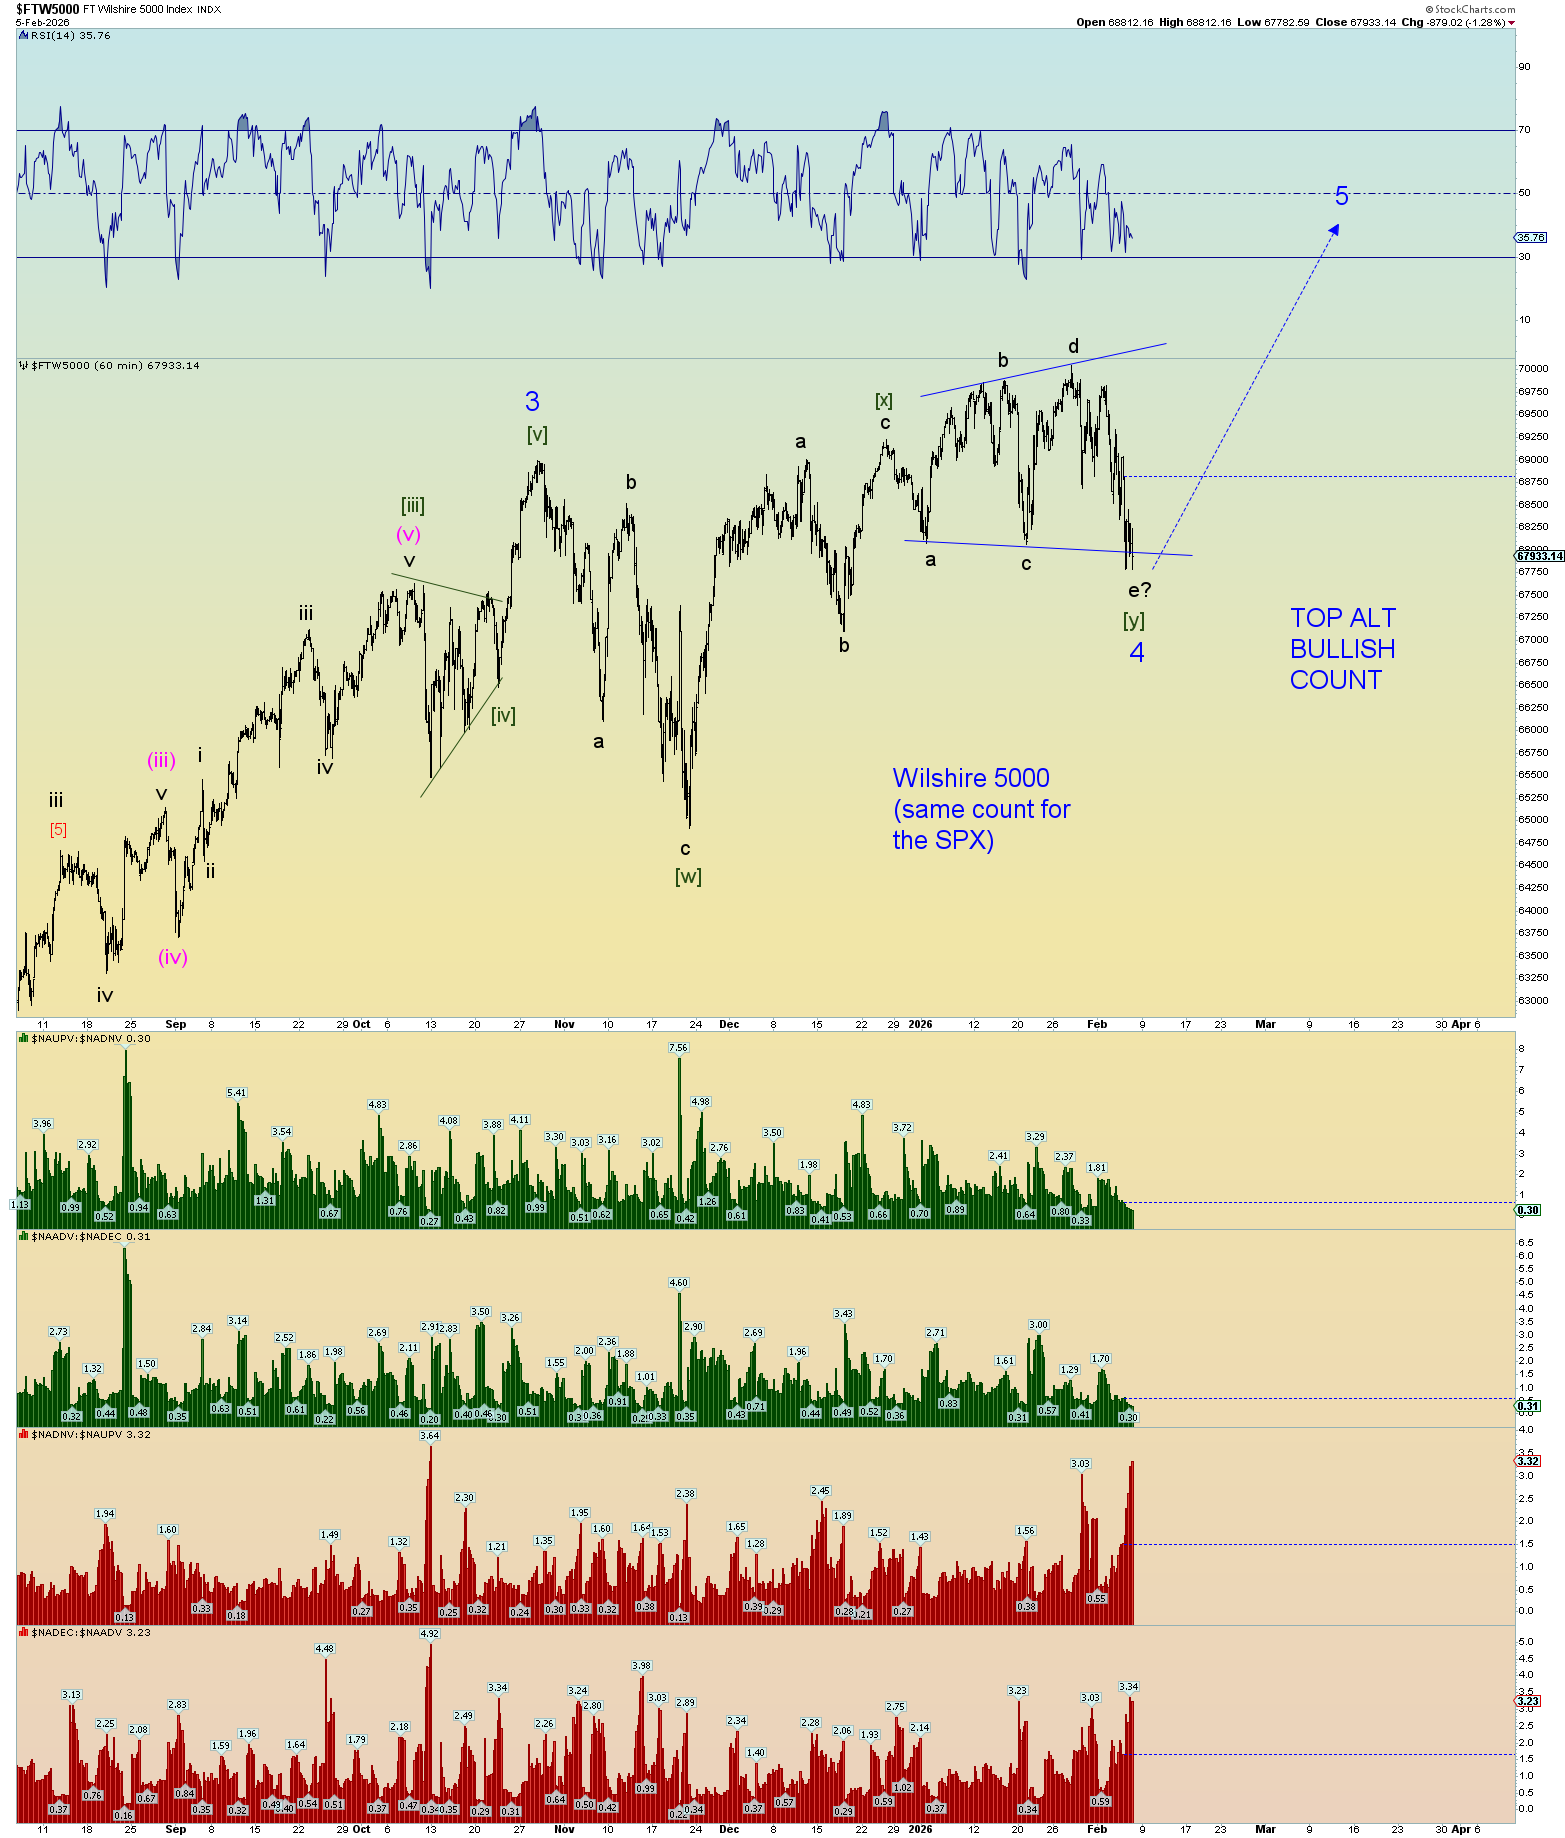
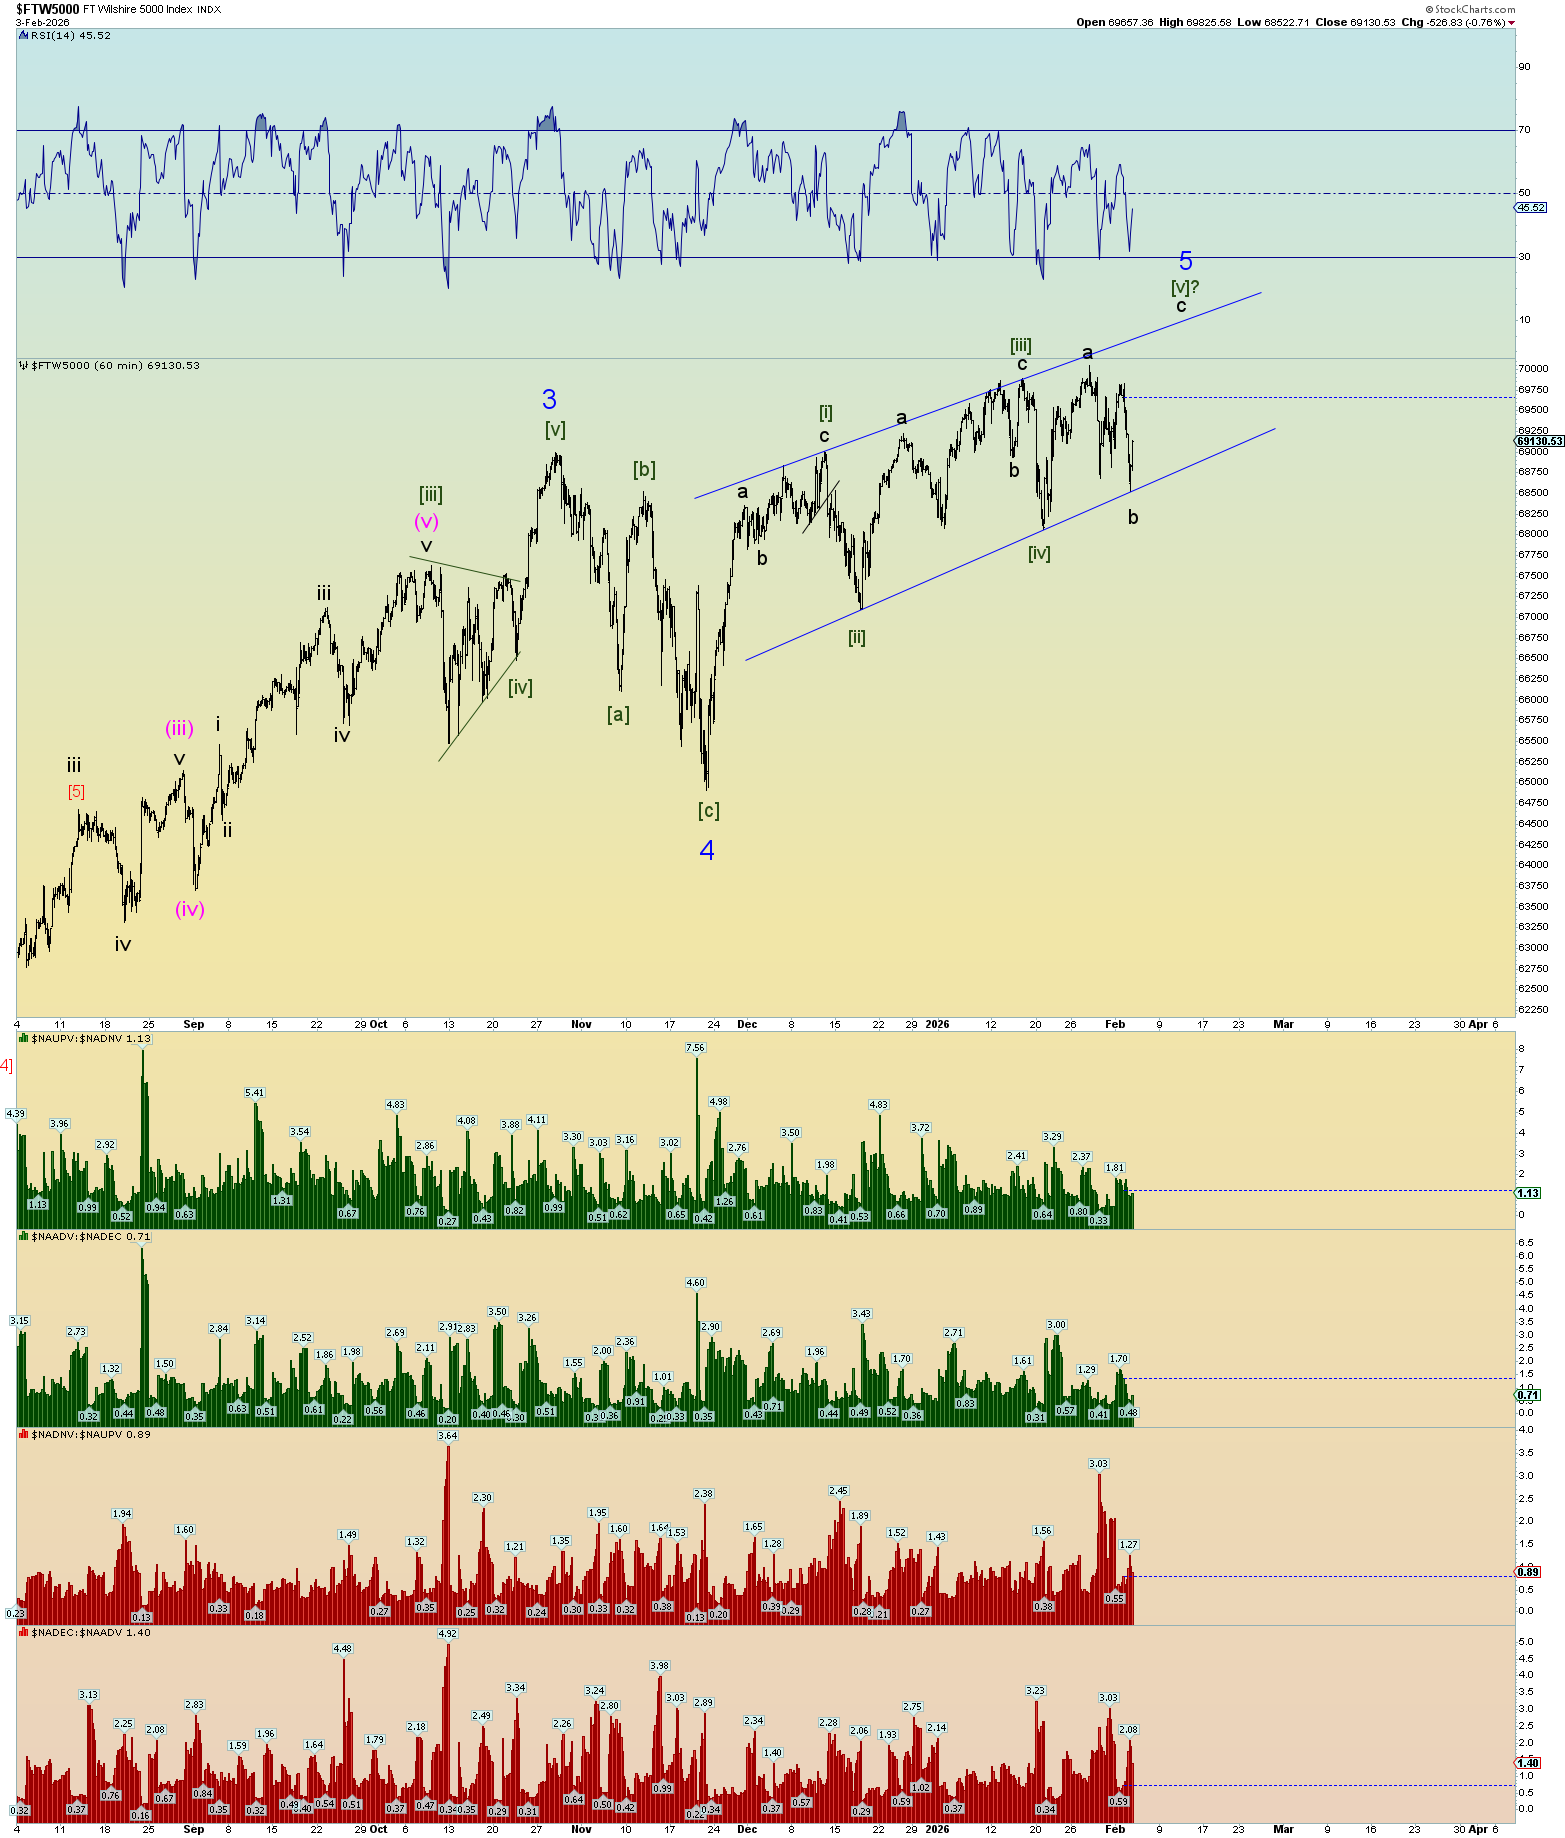
Across the board selling today and crypto and silver got hammered. Because of the further price drop today and the overall negative price action everywhere one looks, the best wave count for the Wilshire 5000 (and SPX) is that the ending diagonal triangle ended last week and it’s been just a bunch of shakeouts just prior to the bottom falling out.
This does make a really nice count. Choppy overlapping finish at the end. To confirm the count implies a quick selloff to beneath the late November 2025 Blue Minor 4 low. Same holds true for the SPX.
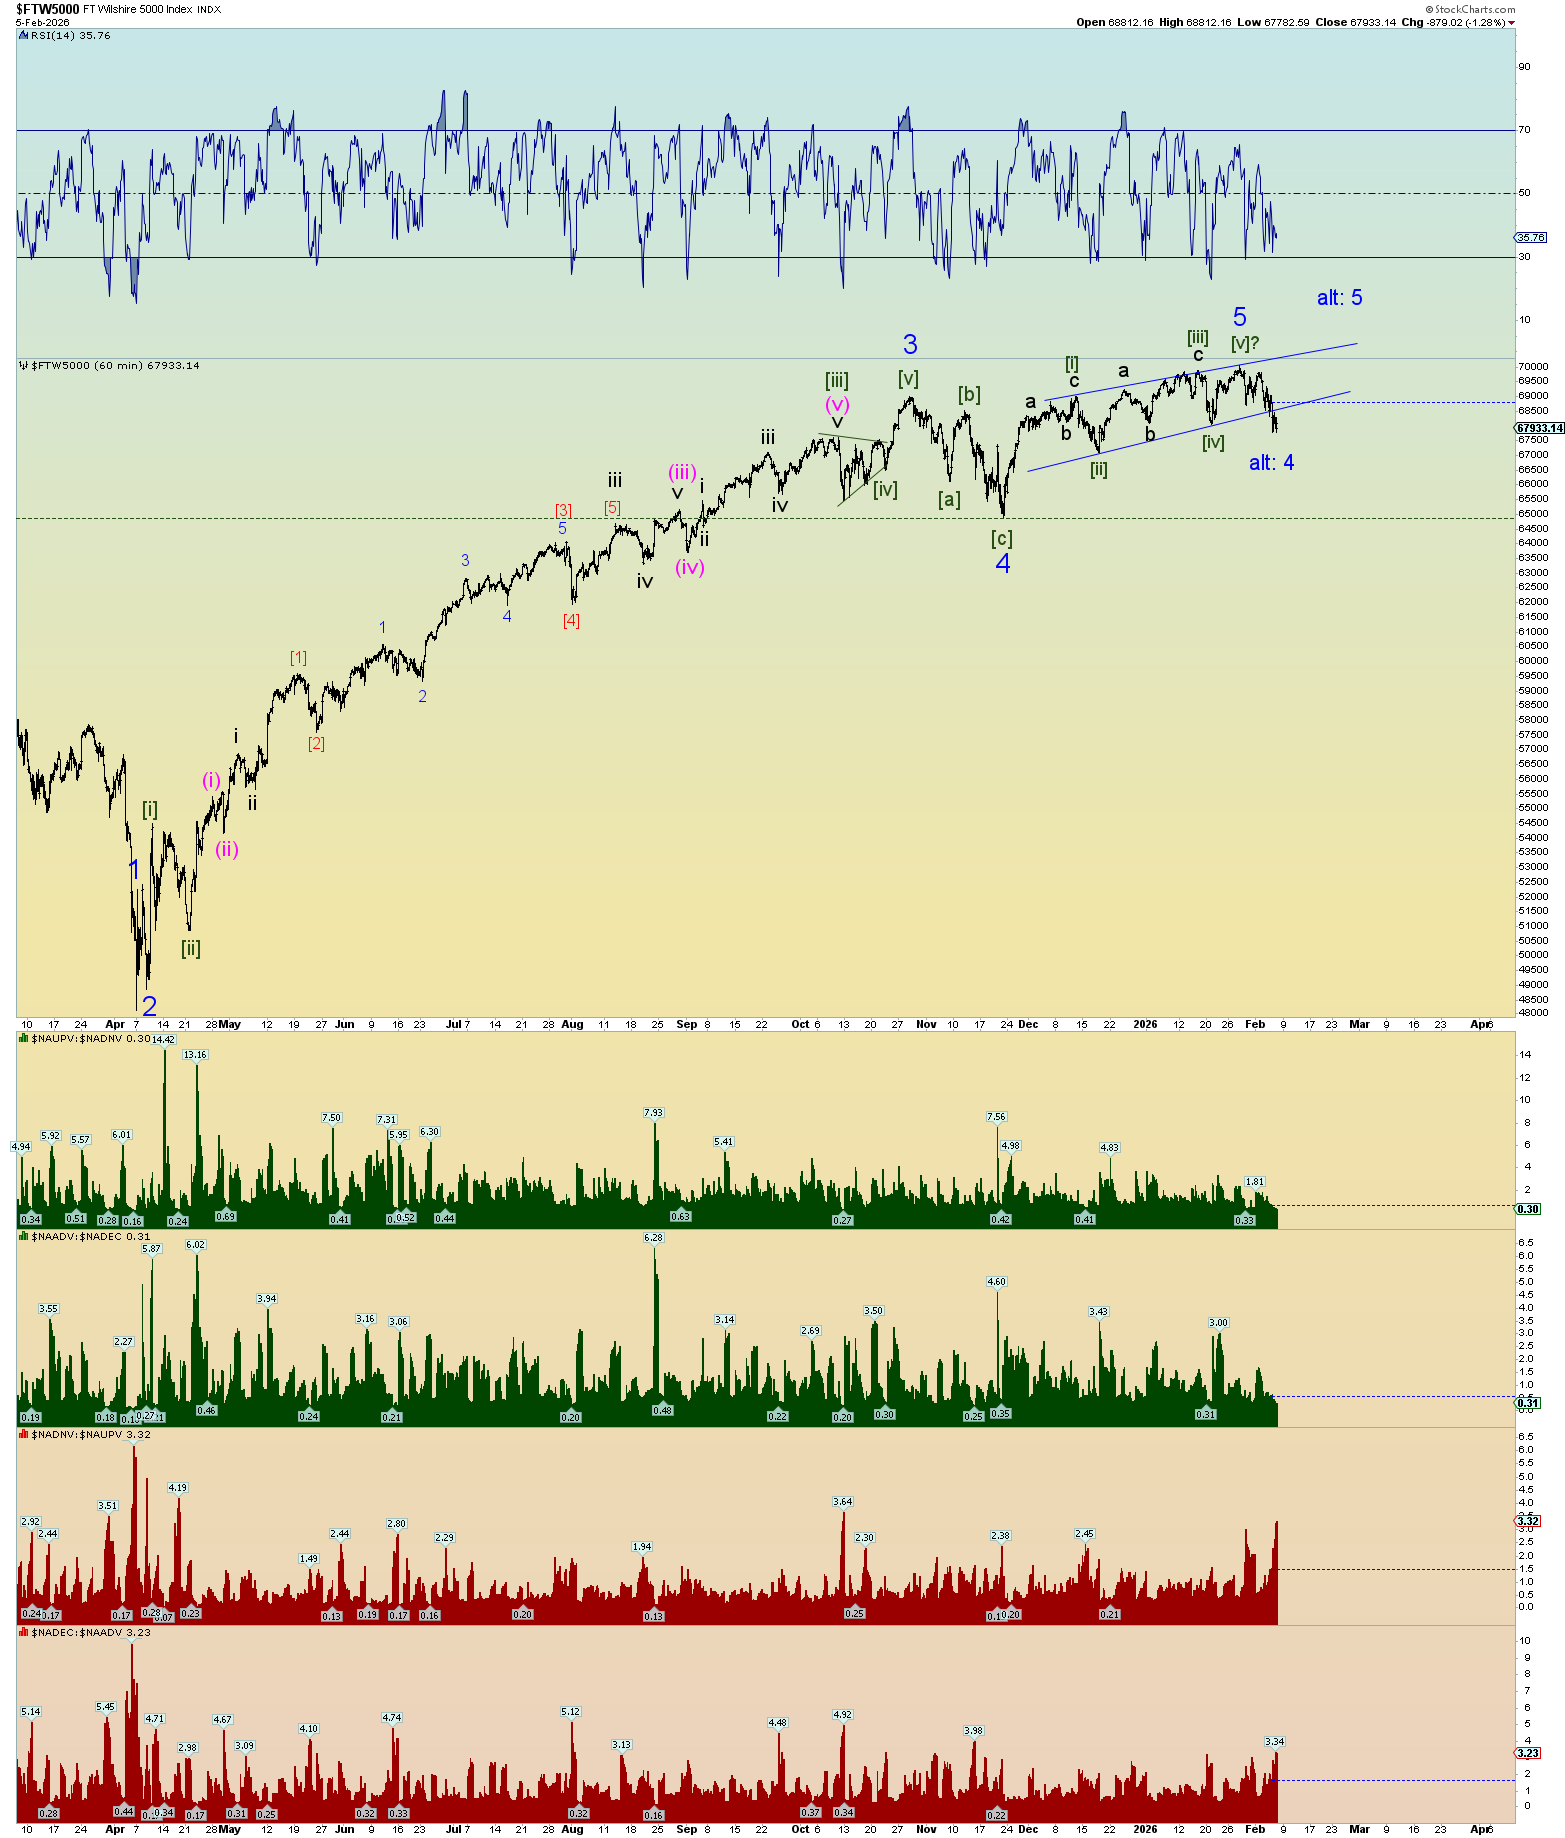
However, there is an interesting alternate count that cropped up today. This would be known as a complex corrective, a 3-3-3 sideways count that stretches out time rather than price. zigzag – zigzag – expanding triangle structure.
Again, there really is no more room for this to be a valid count, so I wanted to show it tonight. We always want to prepare for the best alternate with a valid count.
I’m not really rooting either way, just that I hope this entire mess resolves itself one way or another finally.
Afterall, the DOW is still ok for an ascending triangle:
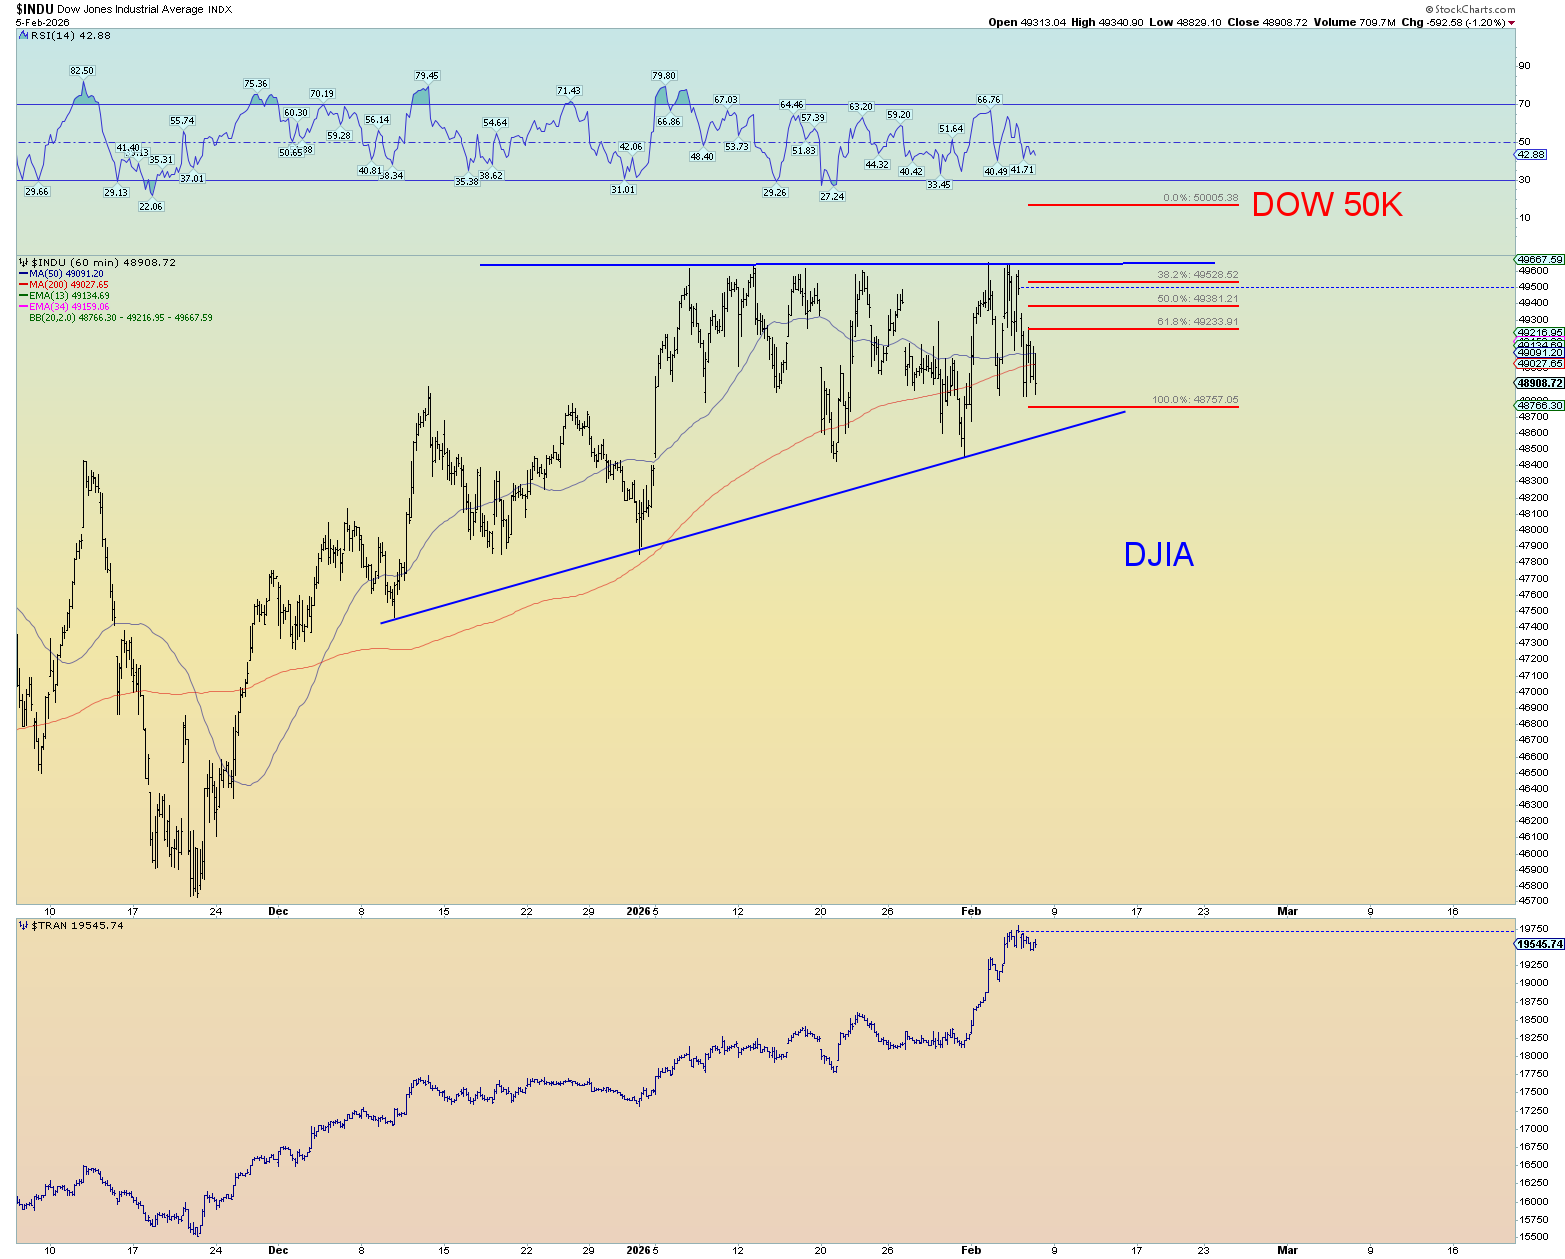
The Composite is starting to break down. The DOW is holding near highs and an ending diagonal triangle on the Wilshire 5000 has yet to be ruled out.
The DOW has a distinct ascending triangle pattern. It is one reason to think we still get an upside pop overall out of the market. I just don’t see how the market makes and ALL_TIME high near DOW 50,000 and not finish the job. I think it’ll finish the job before it’s all over. That’s a bit over a 1% move up from today’s close.
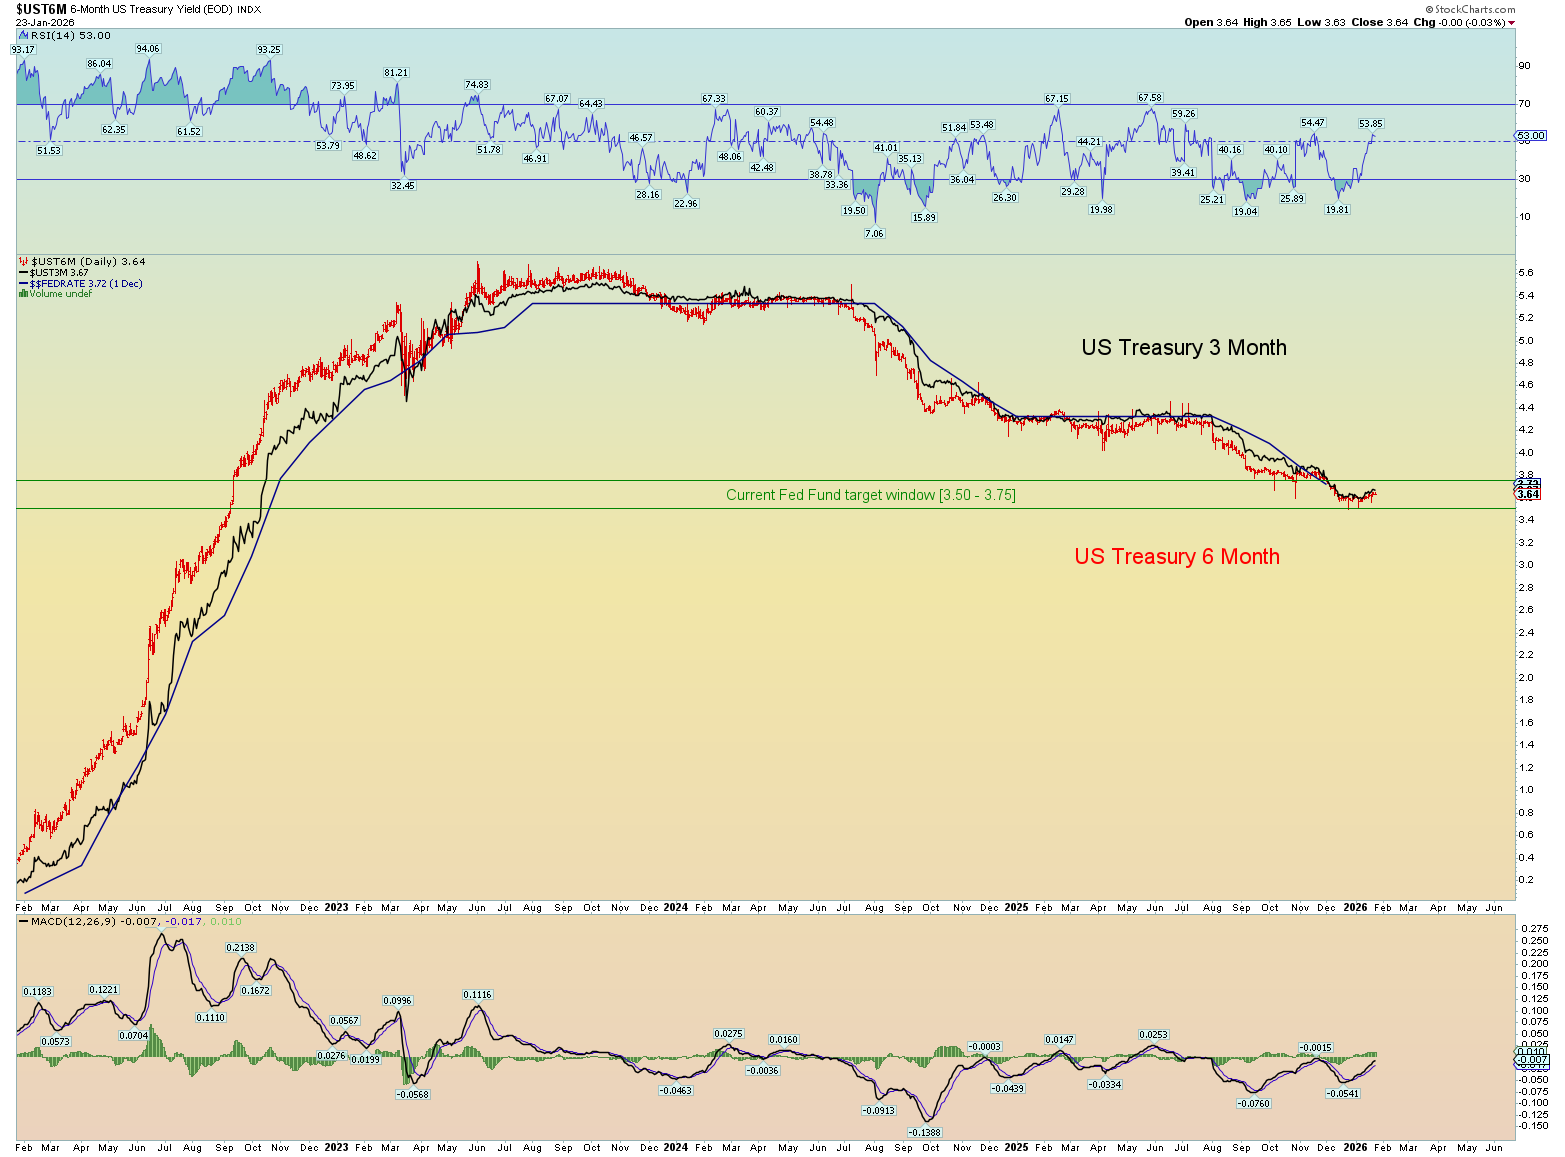
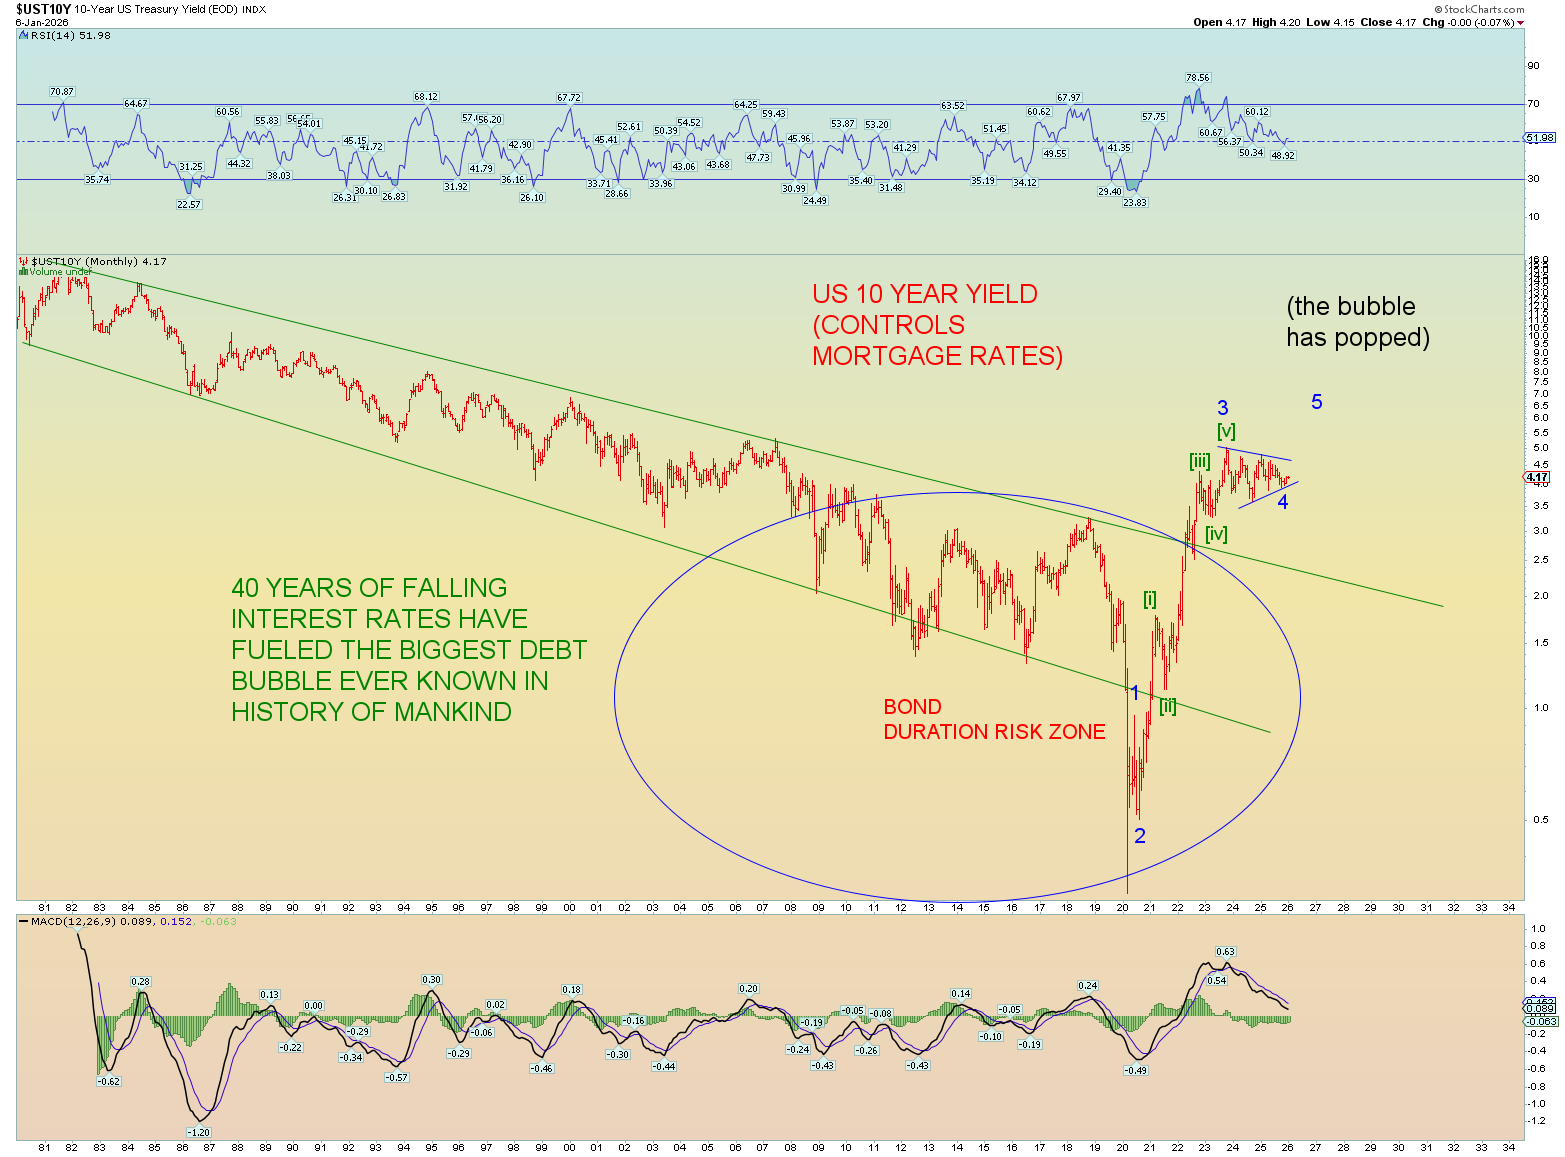
Yields are starting to show life to the upside. It would be more than due. That will be of course a disaster for mortgage’s etc.

Short term rates are not signaling anything at the moment.

5 monthly candles in a row for the NASDAQ Composite that are near a top. From strong hands to weak. Still overbought on the monthly!
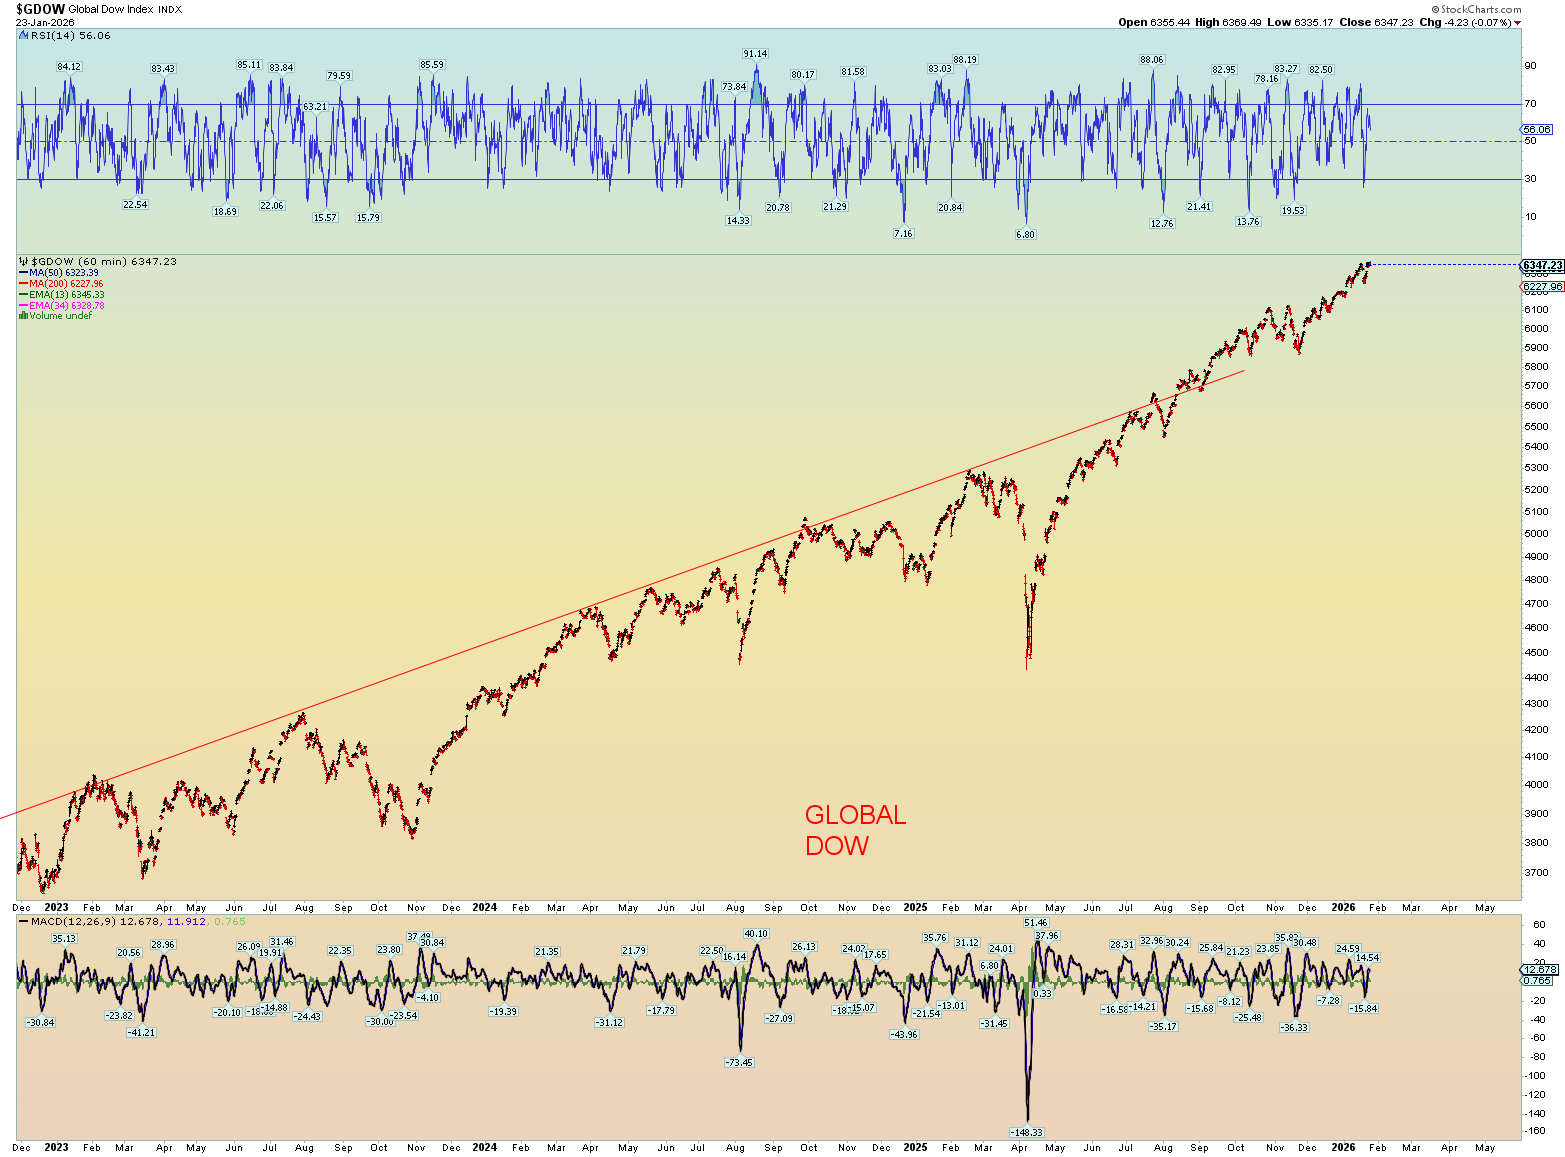
GLOBAL DOW TO THE MOON
The market has yet to resolve itself. Either an ending diagonal triangle is still in play or it’s not. Either the market finally breaks out into “upside surprise” or not. Either the top is in, or not. Below presents 2 variations on the ending diagonal triangle (assuming it hasn’t already finished for which there is a valid count). But I suspect the market is not yet done although plenty of signs of cracking.
2nd variation of the EDT:
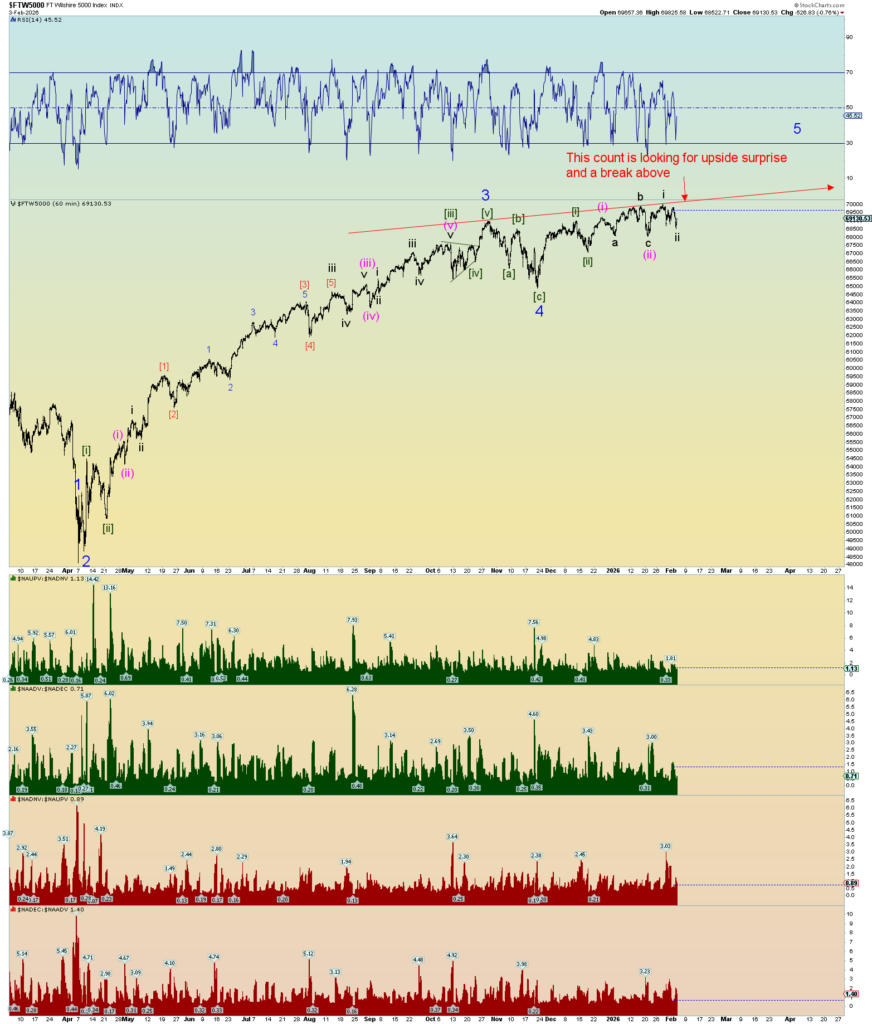
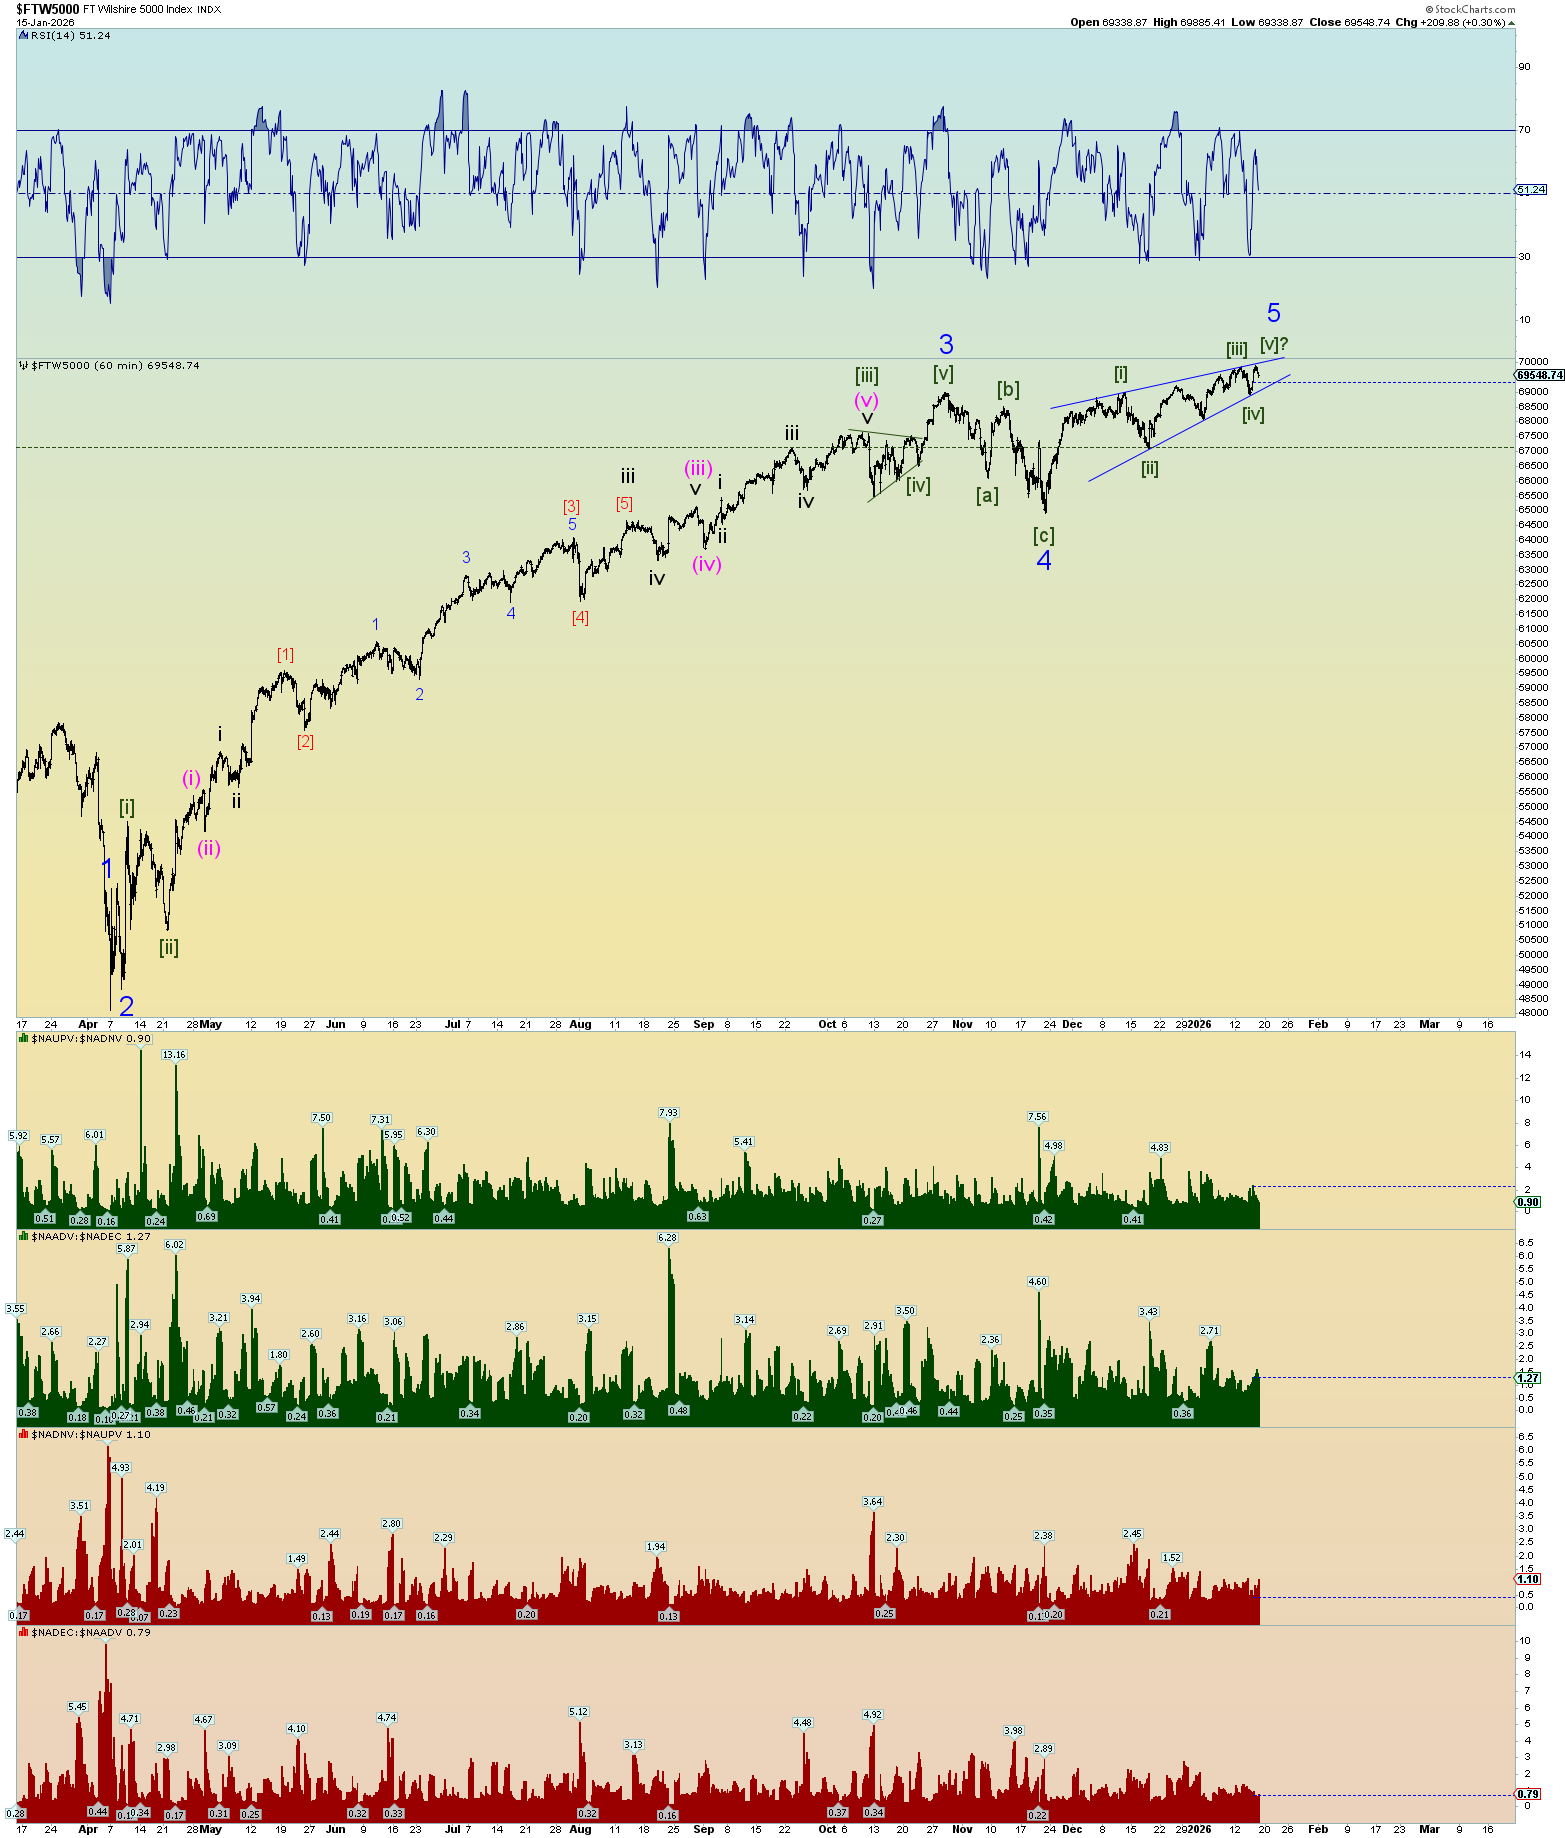
And there is a valid series of “ones and twos”…which implies the market will continue holding up for at least another month or so. This count is very close to “upside surprise” in a “third of a third” wave. A break upwards and hold over the upper trendline will be the key to this count. I suspect this is probably what the market will do. The mania goes on. Even so, the entire sideways struggle since September could be strong hands selling into weak hands (retail). There is certainly evidence for that.
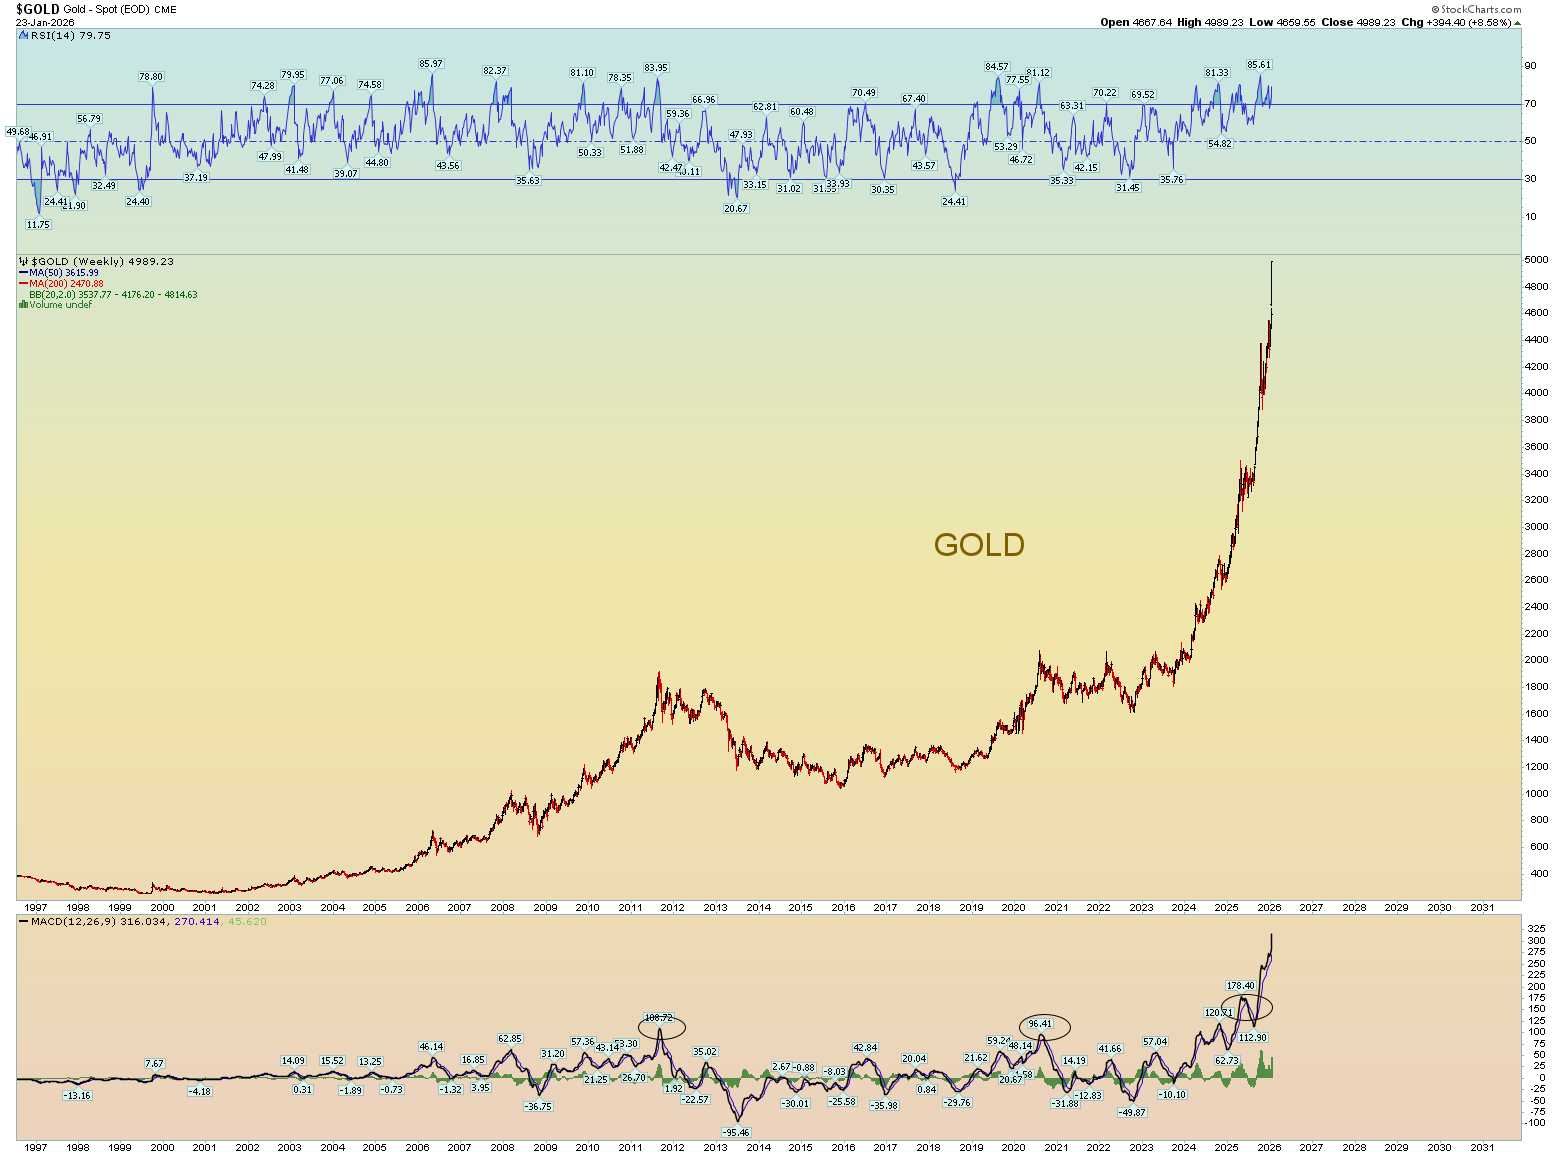
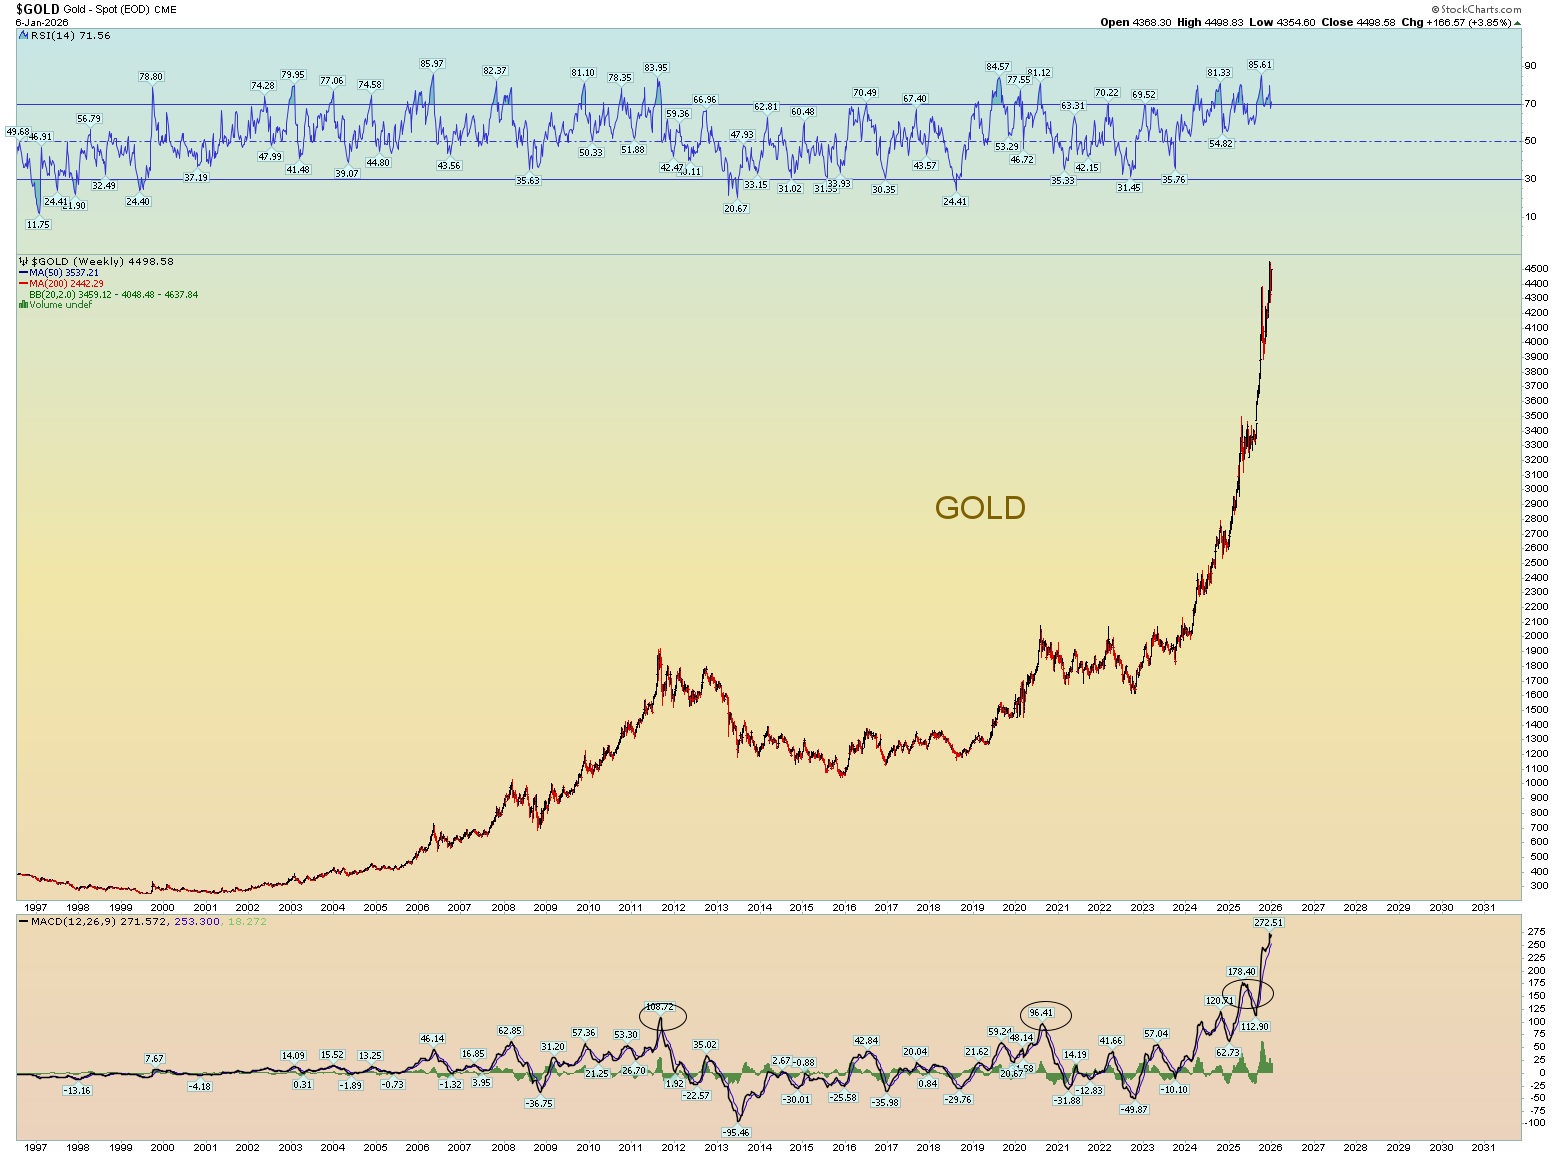
Historic moves with Gold and Silver. It seems cracks are surely forming in the global fiat financial system. Of course, the paper gold/silver markets are leveraged probably 100-1 and no doubt full of fraud. And politically, governments can outlaw the holding of gold (and now silver) as Roosevelt did in the 1930’s. But the rapid price moves up indicate that the global financial system is coming under stress that the major banking powers are not used to. What it all means from here, I’m not sure. But sentiment on Gold and silver remains historically highly elevated. Everyone seems to wait on a large pullback, but when that comes, the pullback might last several months and/or years.
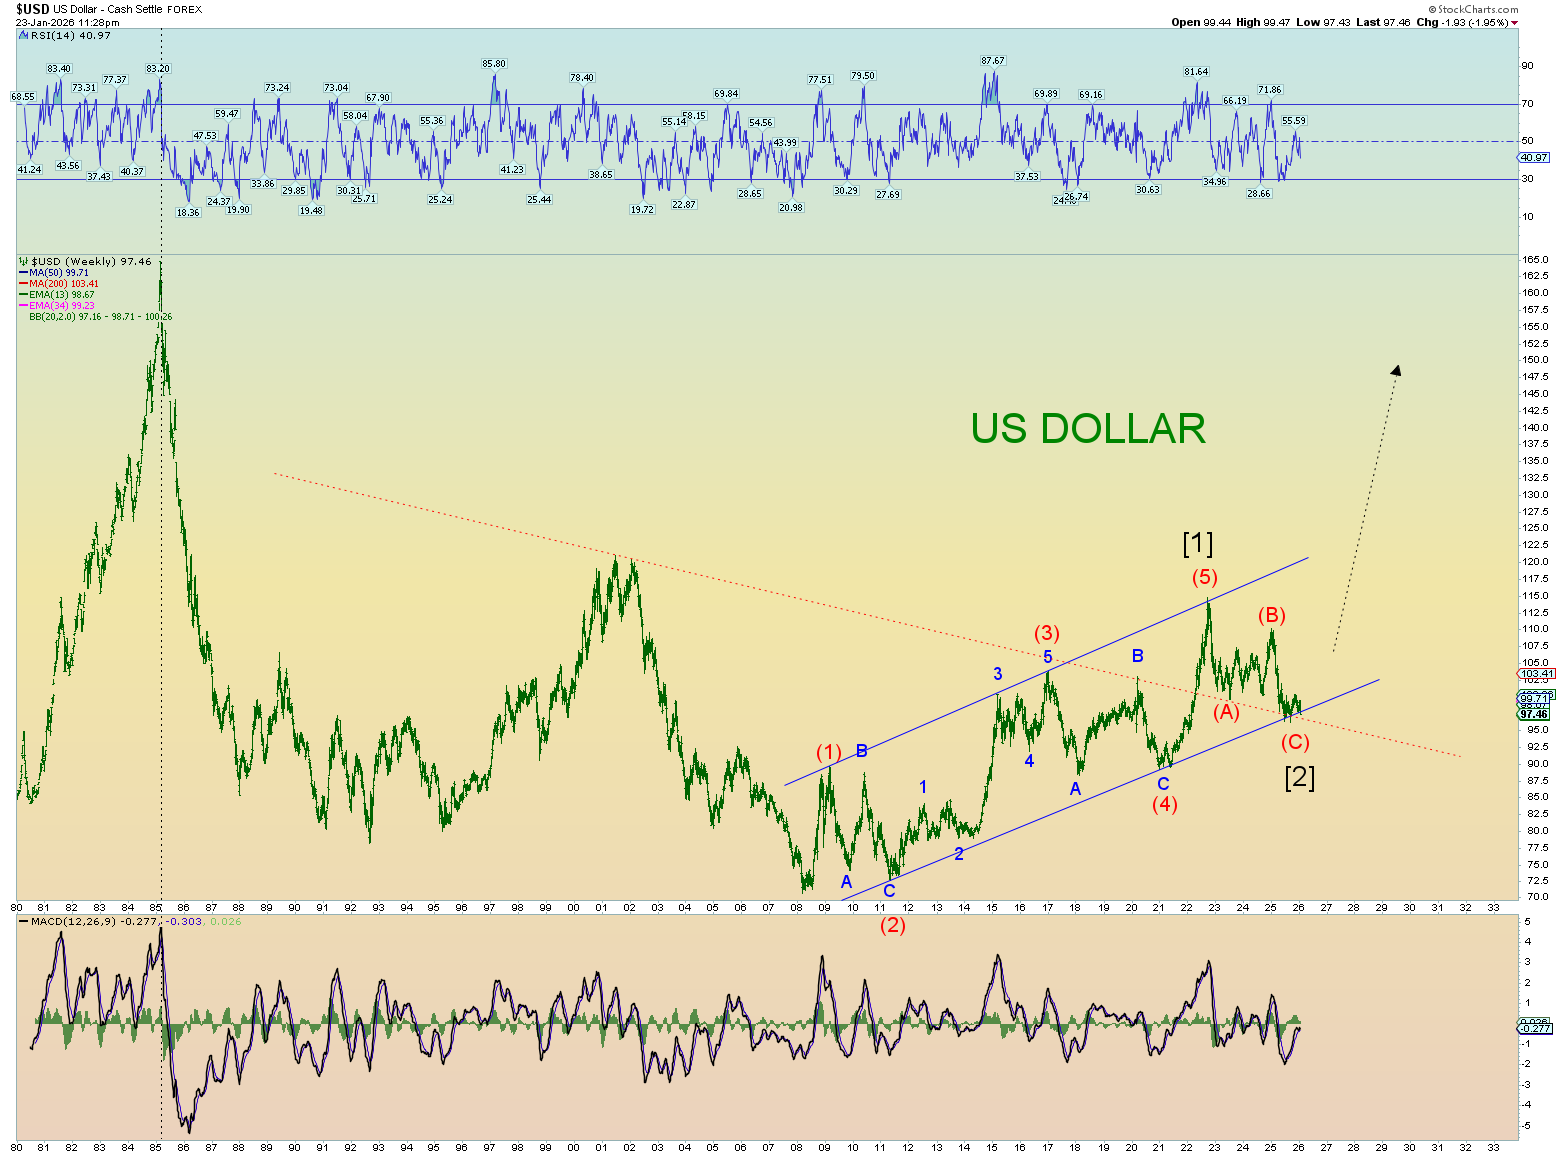
Of course, everyone always says this means the “death of the dollar” (as if any other global fiat currency is any better!). I’ve always said it is the underlying bonds –that are redeemed into dollars (or whatever) – will collapse first. I mean, isn’t this obvious? No one goes around buying food, eggs and fuel in bond payments. No, they sell their bond holdings and redeem them with dollars first. Then they buy eggs, food and fuel…
So, the bonds are worth less than dollars. Both are paper promises that cannot be filled. But we don’t sell dollars into bonds, the market is setup to do the opposite.
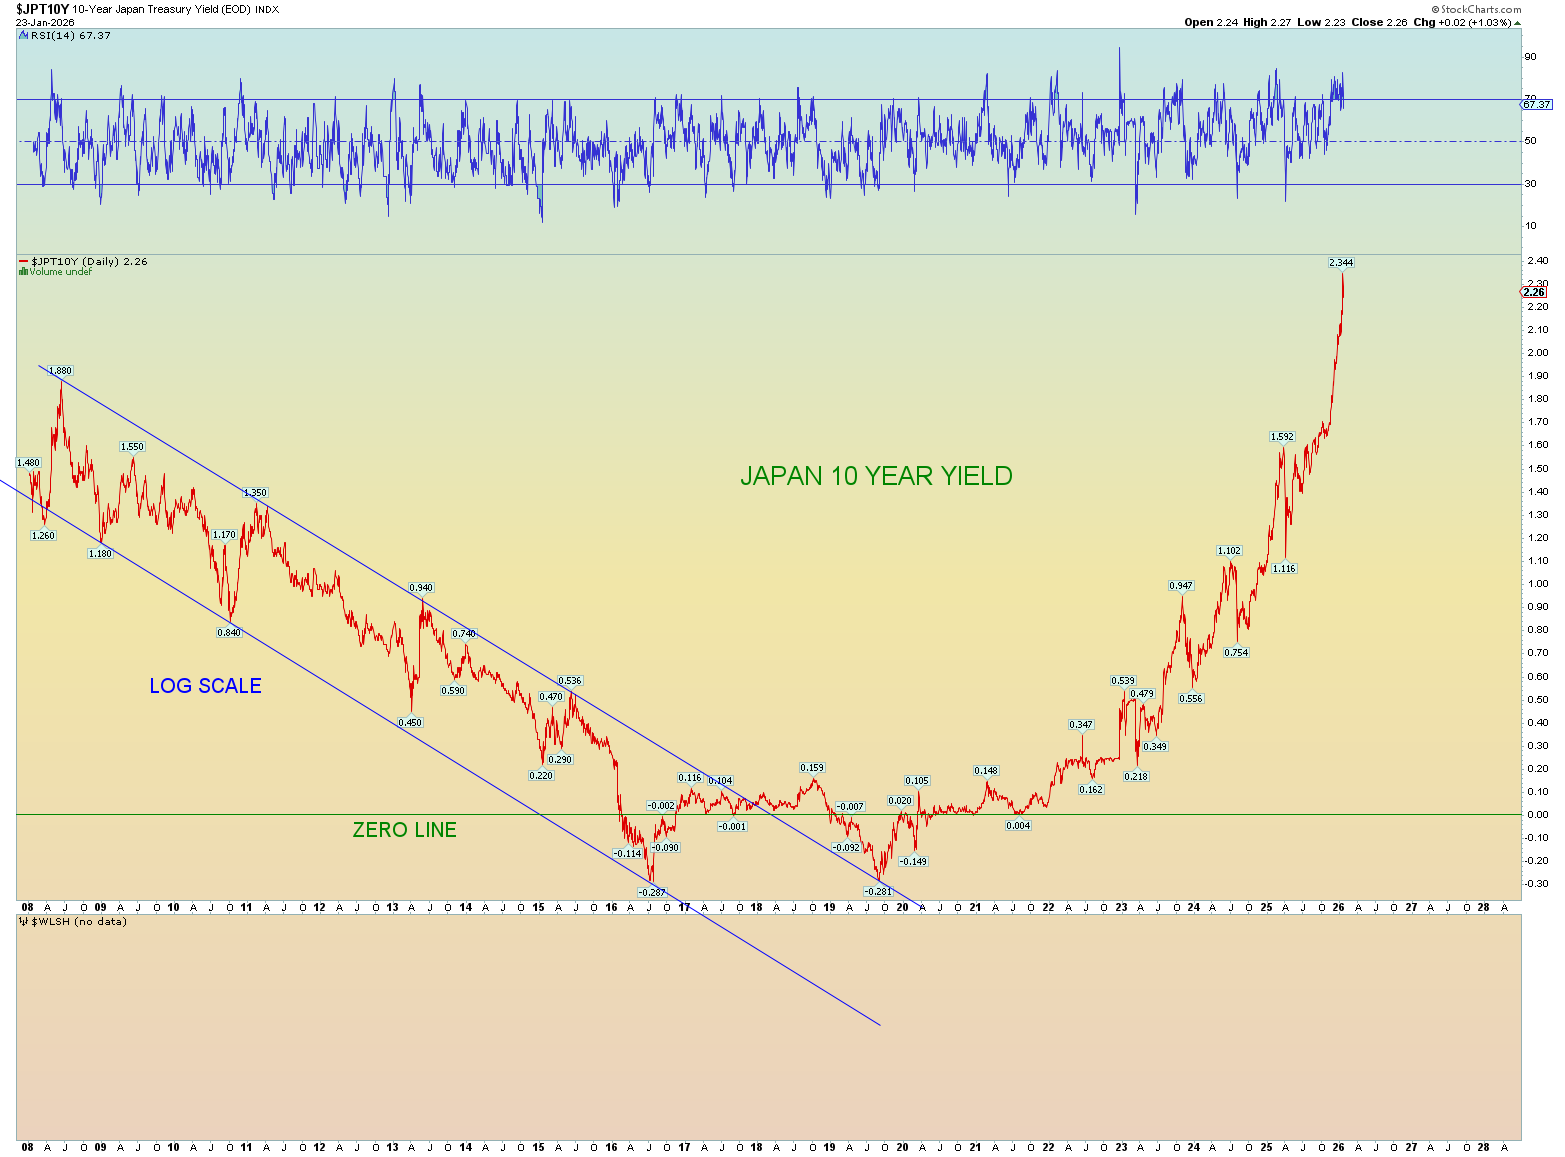
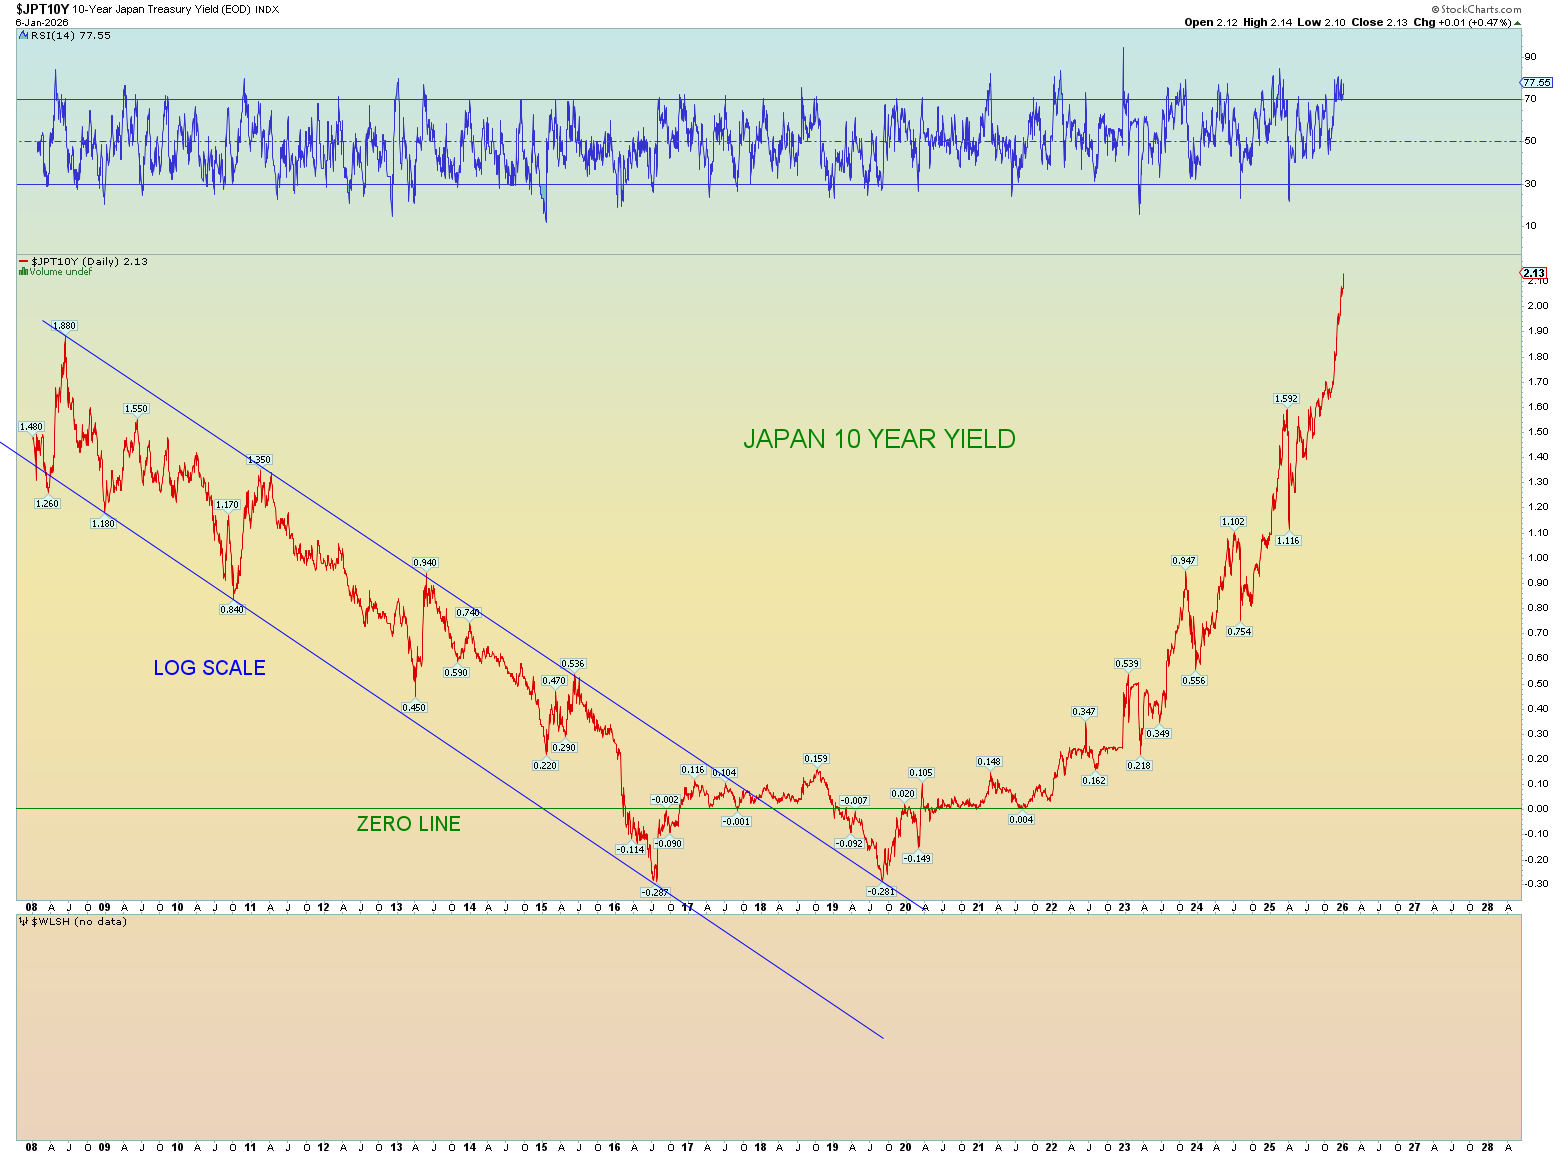
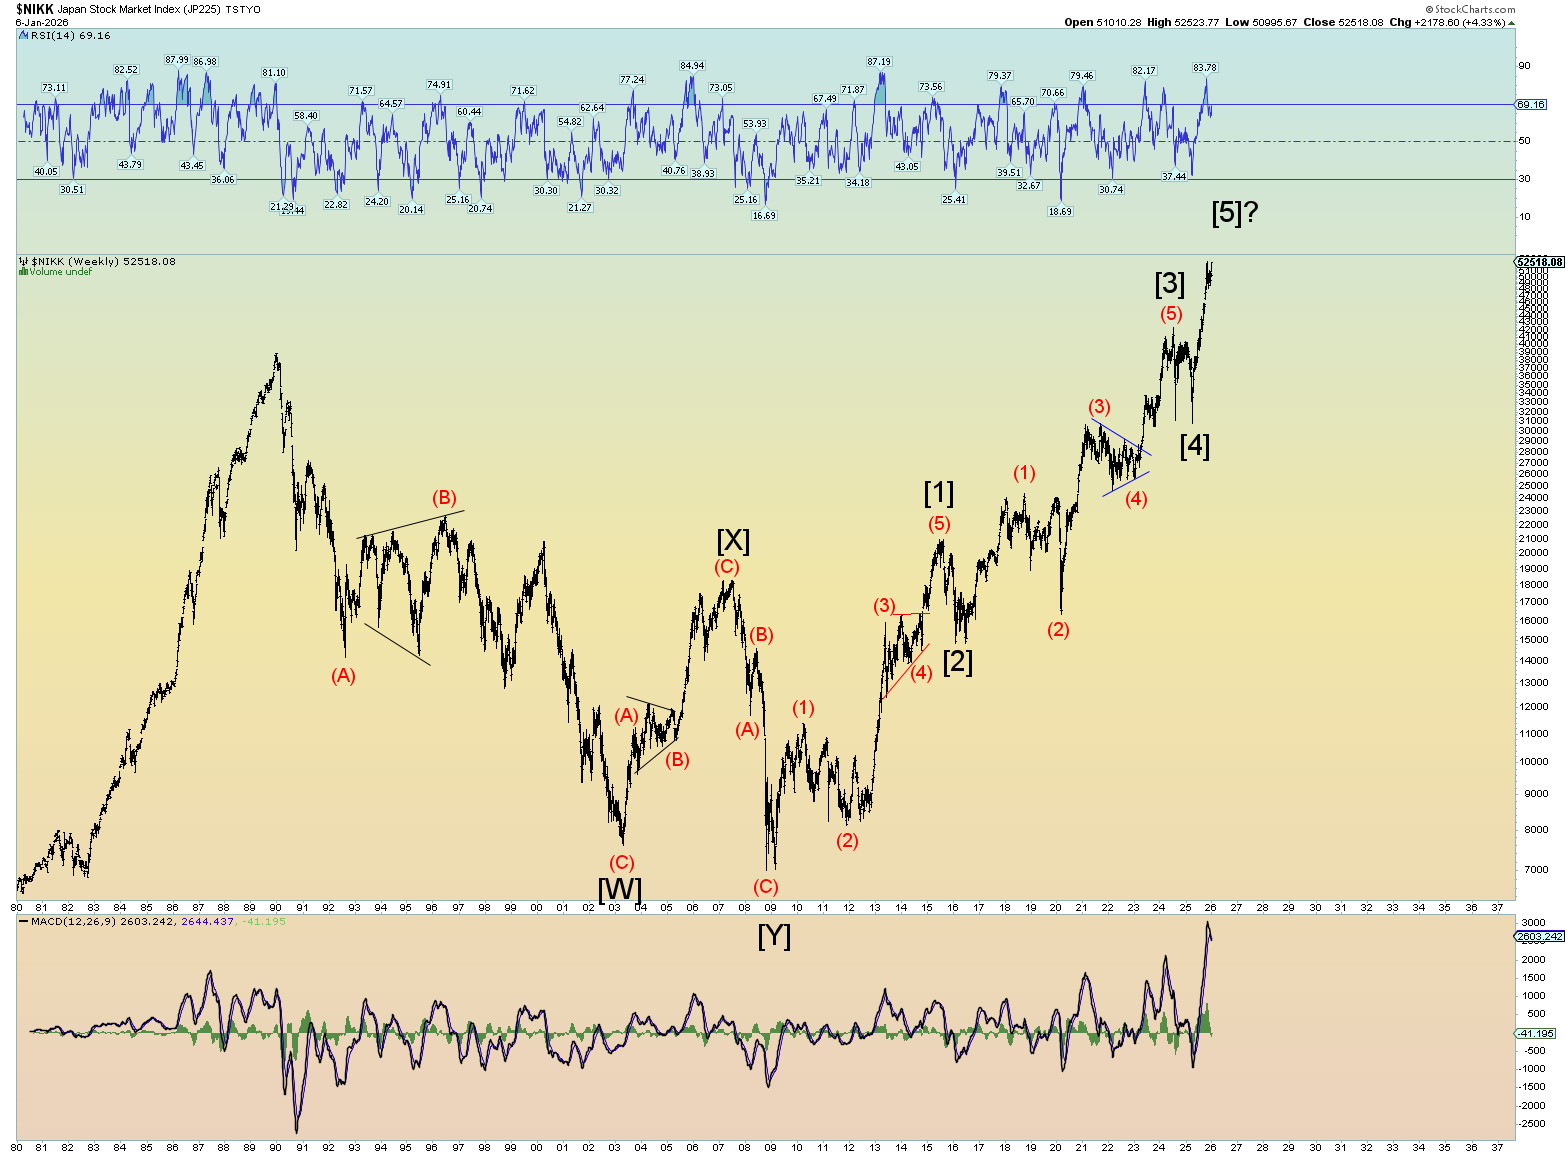
Lots of bond stress in Japan. They have gone the deepest and the longest into bond fiat hell. Therefore, they might be the canary in the coal mine concerning the coming global collapse.
Don’t look at the price of fiat currencies…they are all trash comparing each to each other…but look at the underlying bonds that prop up those currencies. The bonds will fail first. I’m not saying that the fiat currencies will not also fail…just that there is an order of breakage. That is how the system is setup. It is a global credit system. Credit = money. The failing credit collapses first.
WAVE COUNTS
The ending diagonal triangle may still be in play:
The other count (and I’m not sure which will win out) is a series on ones and twos in wave 5 and we will have “upside surprise” soon next week. This is kind of a weird looking count.
Industrials now taking 3 stabs at breaking out.
The following 2 charts so differing degrees of wave count, but overall, that doesn’t affect the “peak count”.

NASDAQ floundering at the top for 4 months:
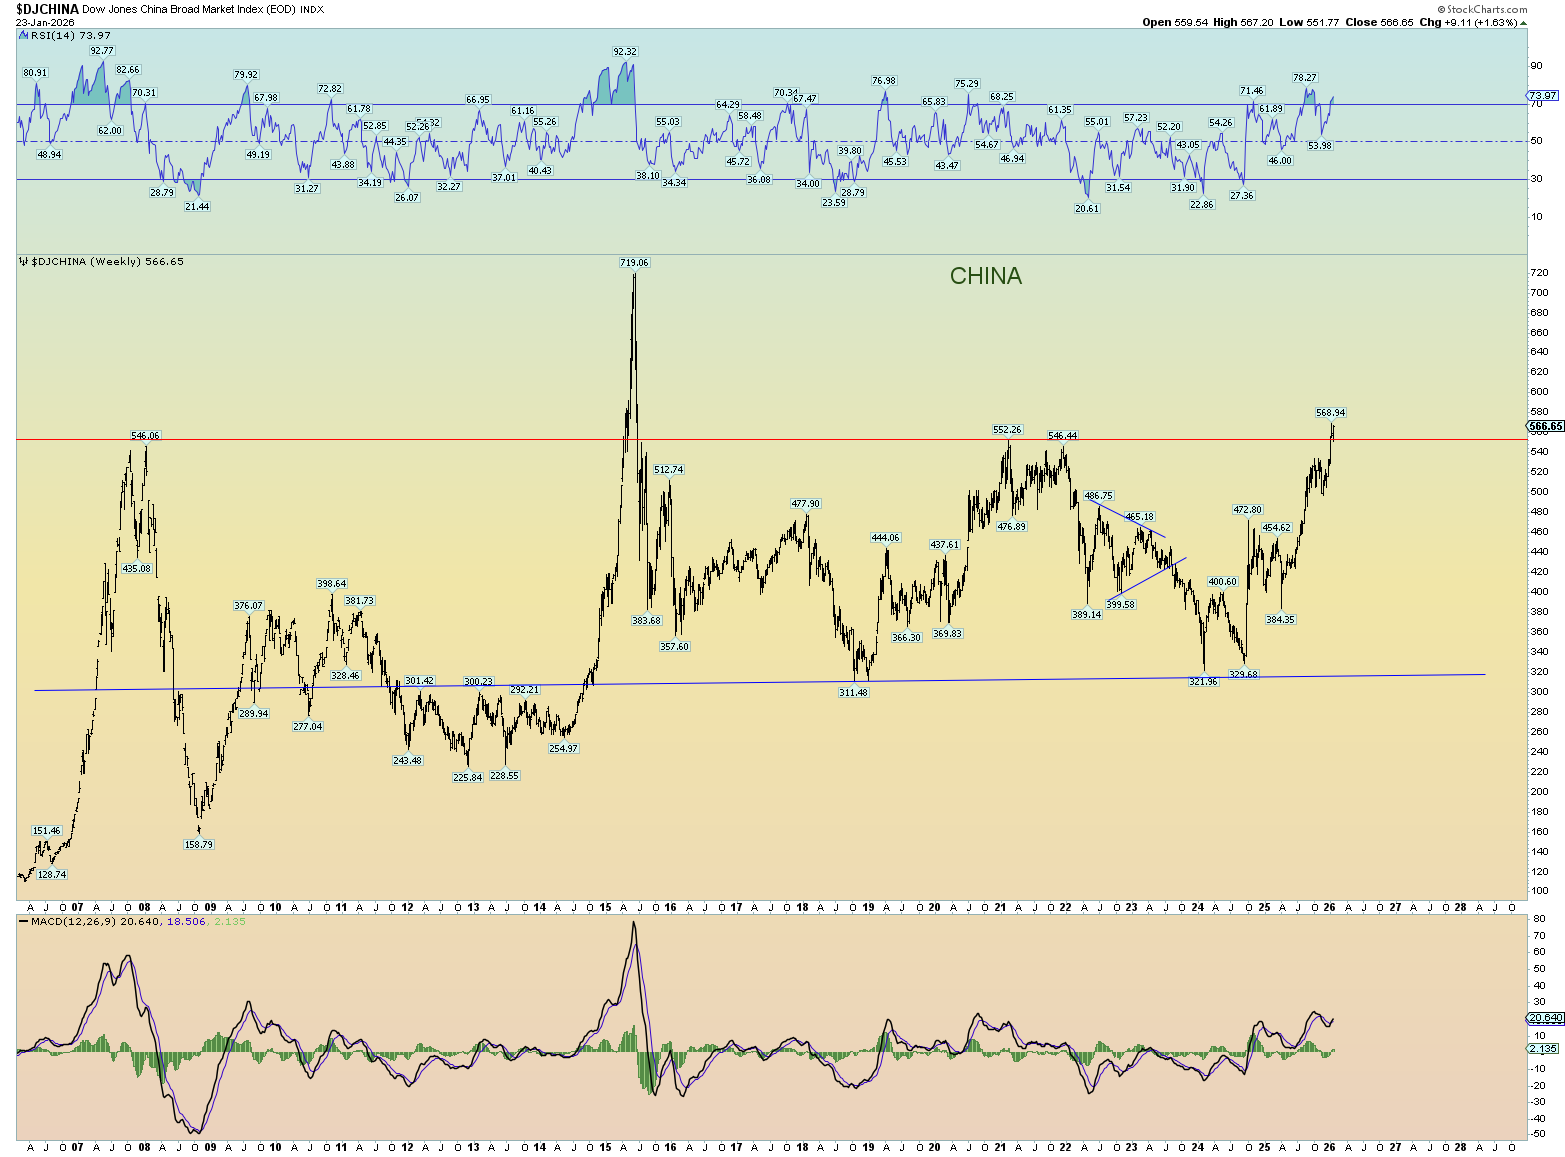
China:
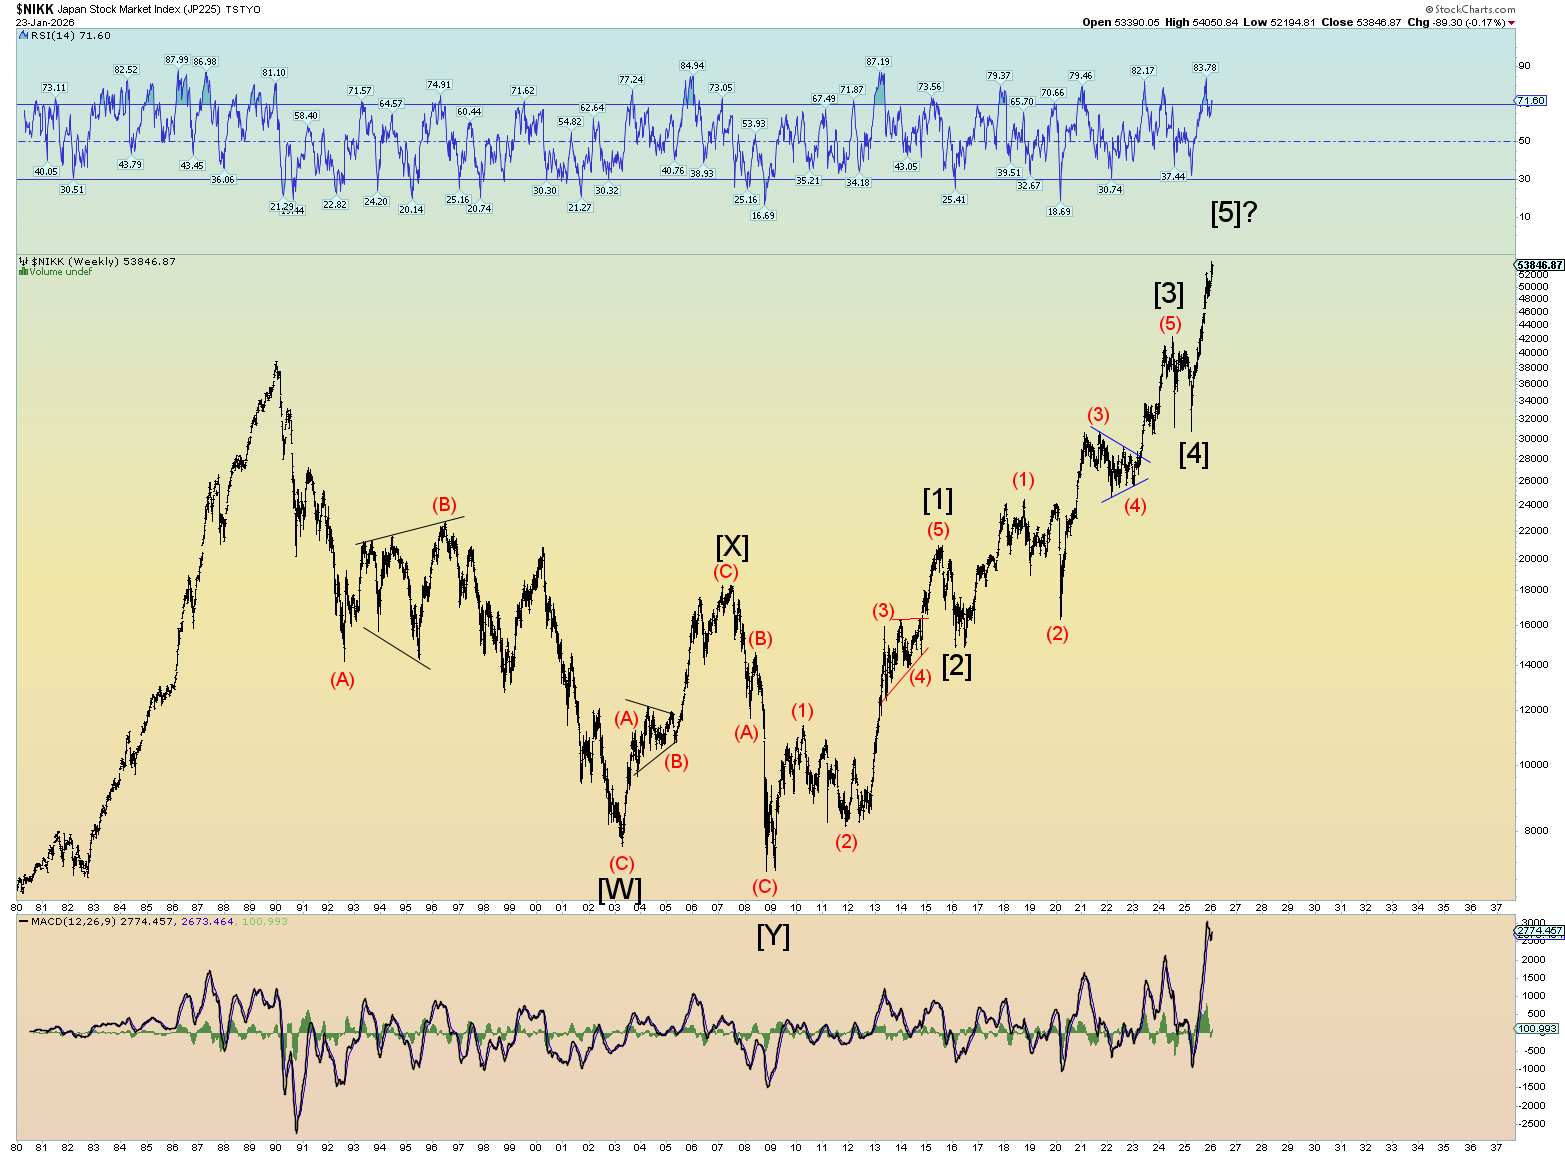
Very nice count on Japan!
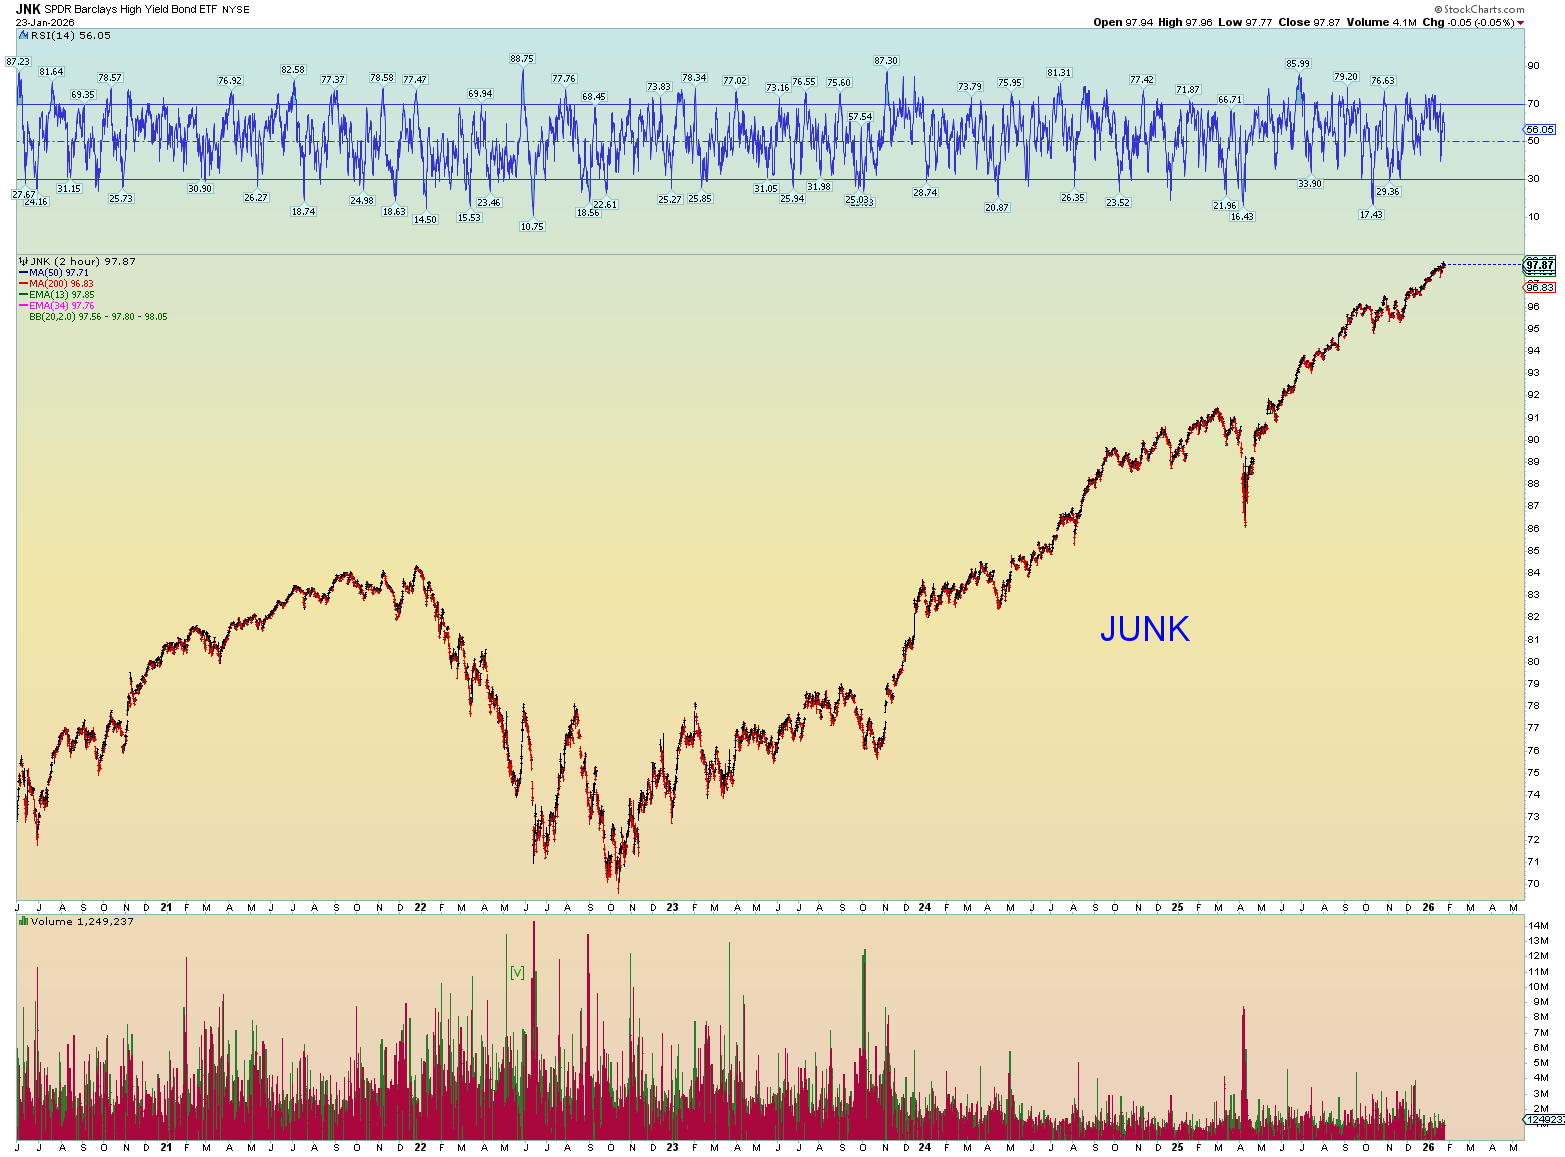
All-time highs in junk debt. No fear here!
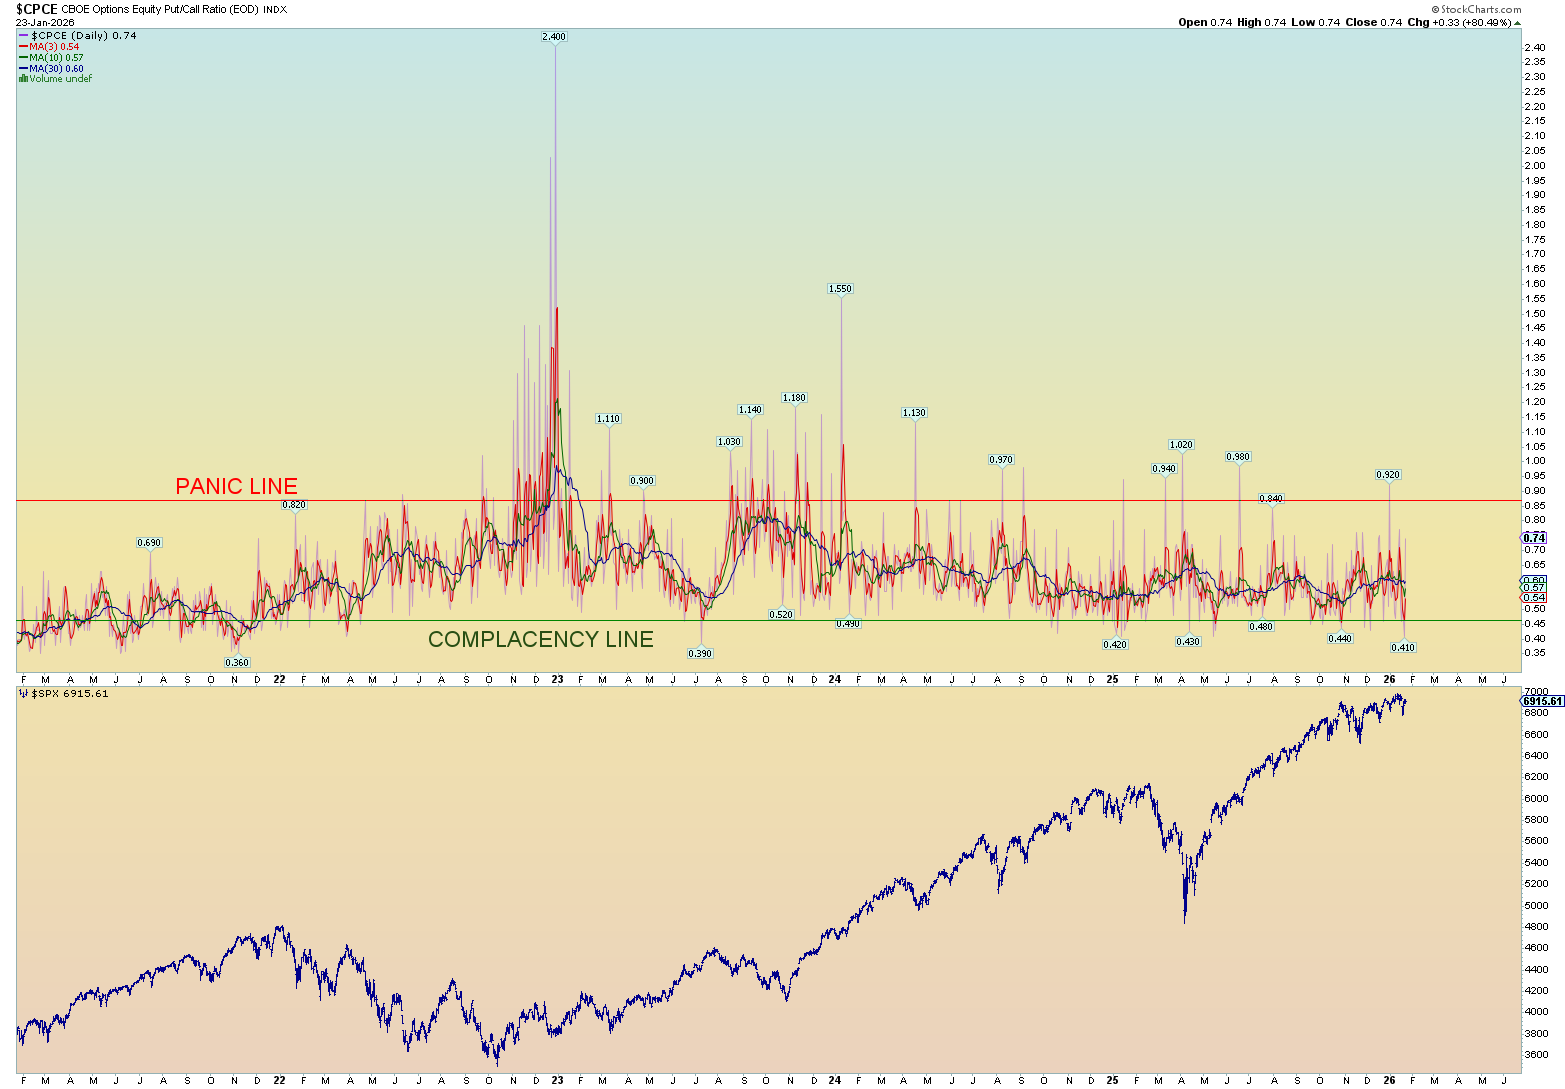
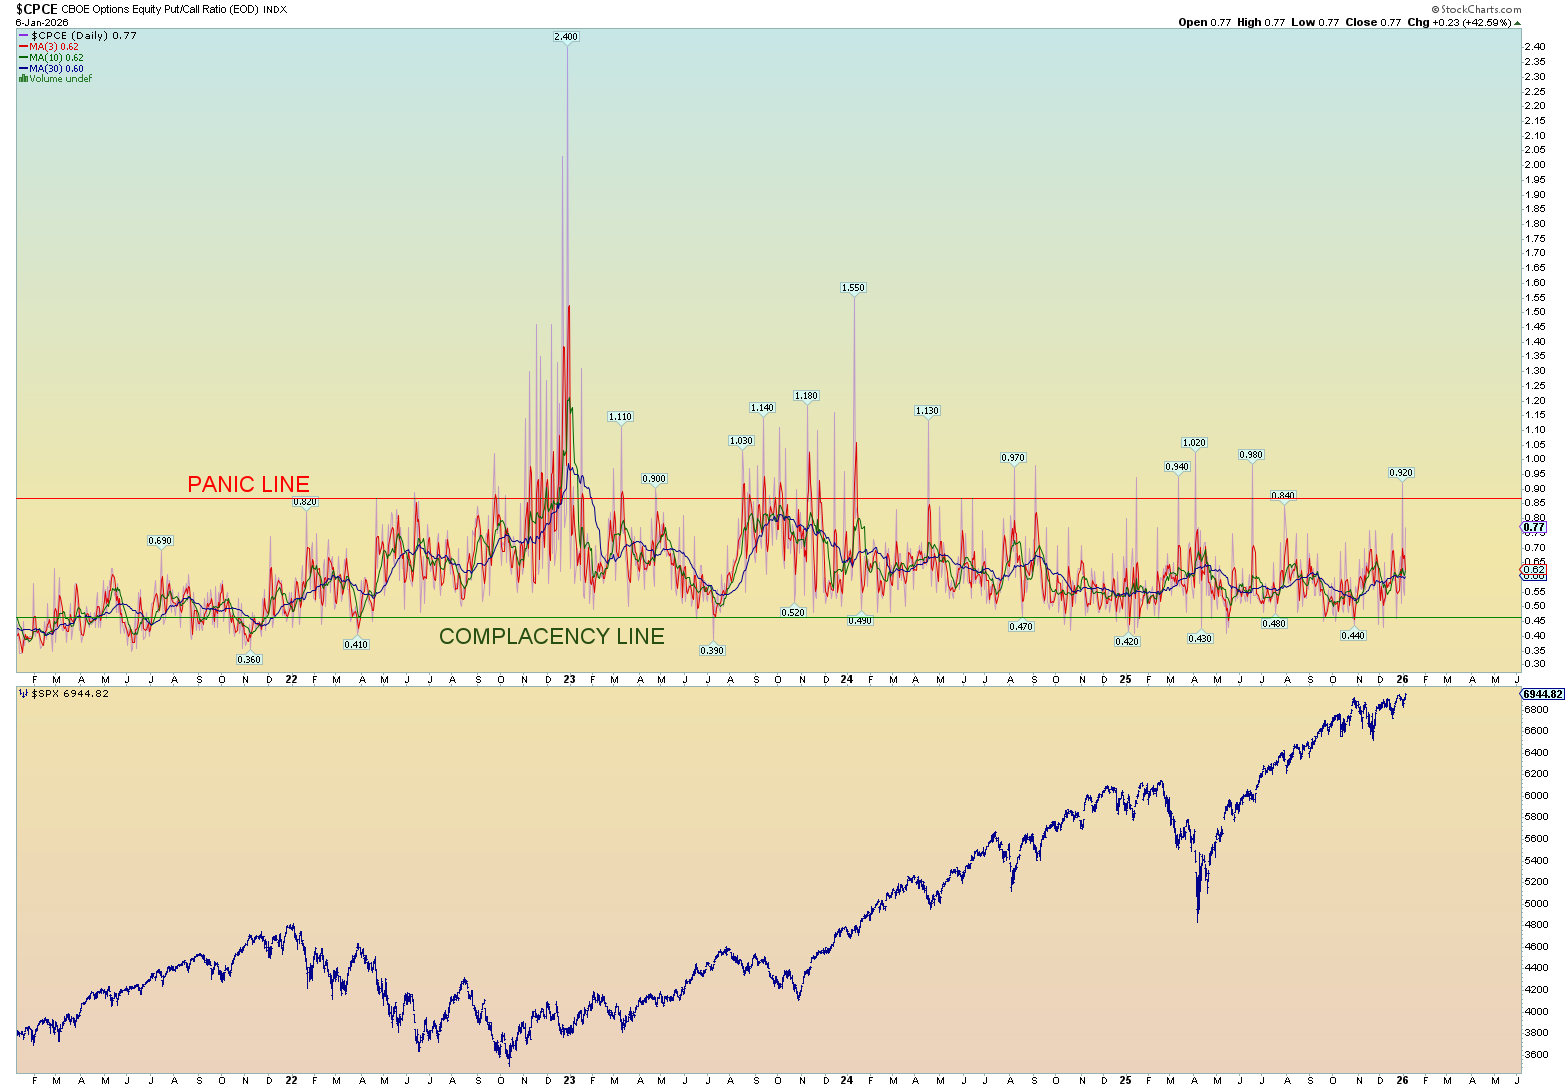
Please note what they do, not what they say. The CPCE hasn’t had hardly ever had a bearish day in many, many months. Still not real panic.

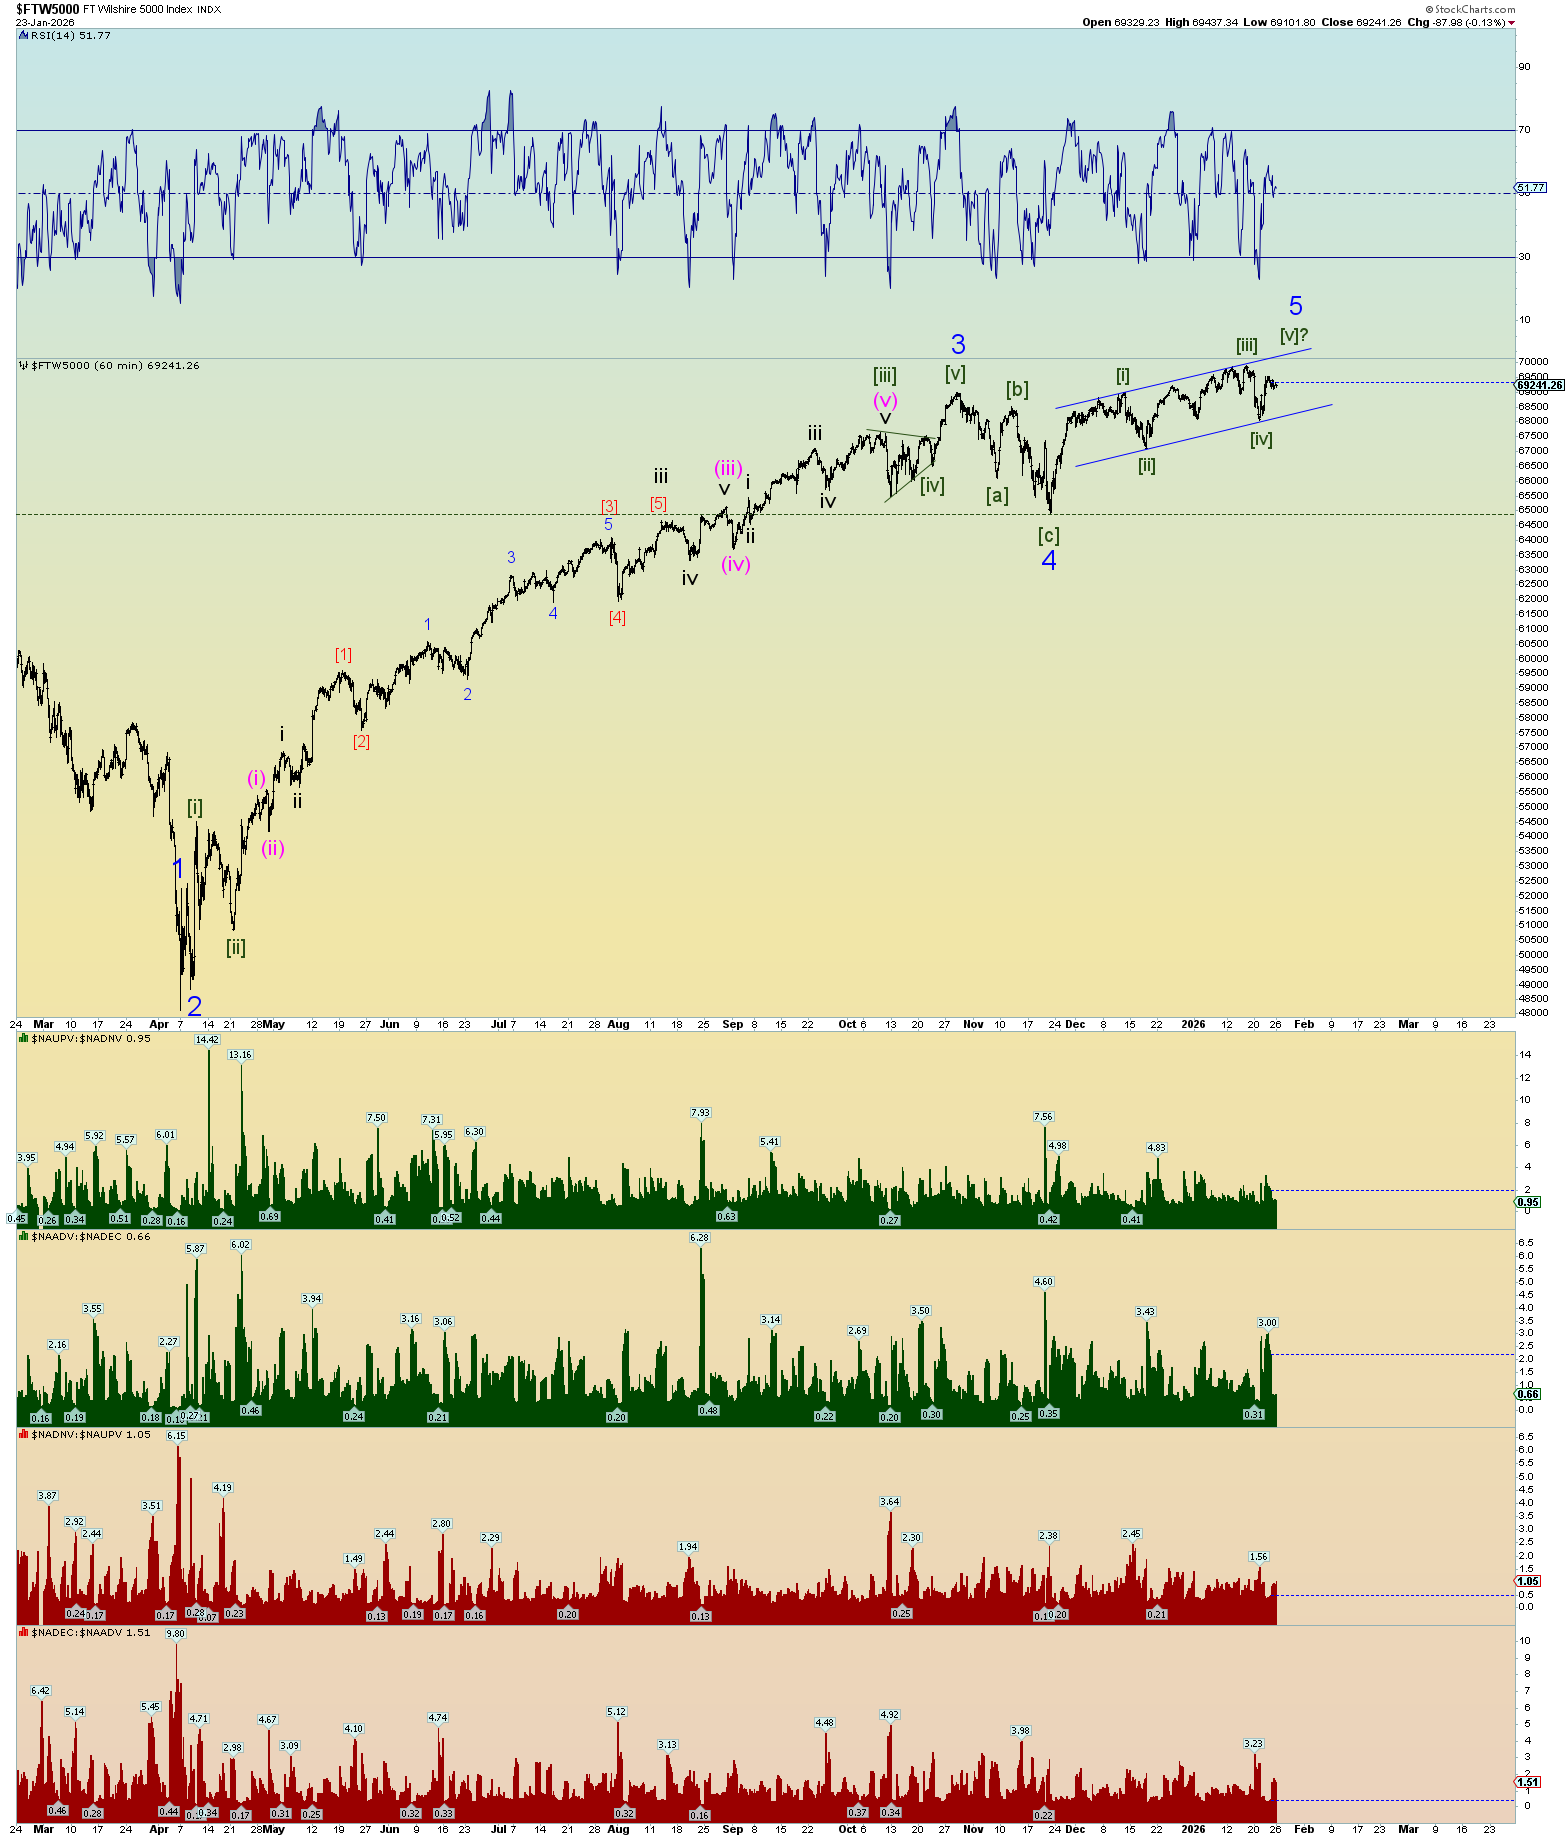
The potential ending diagonal triangle is still a possibility. But the primary count calls for an “upside surprise” in a third of a third.
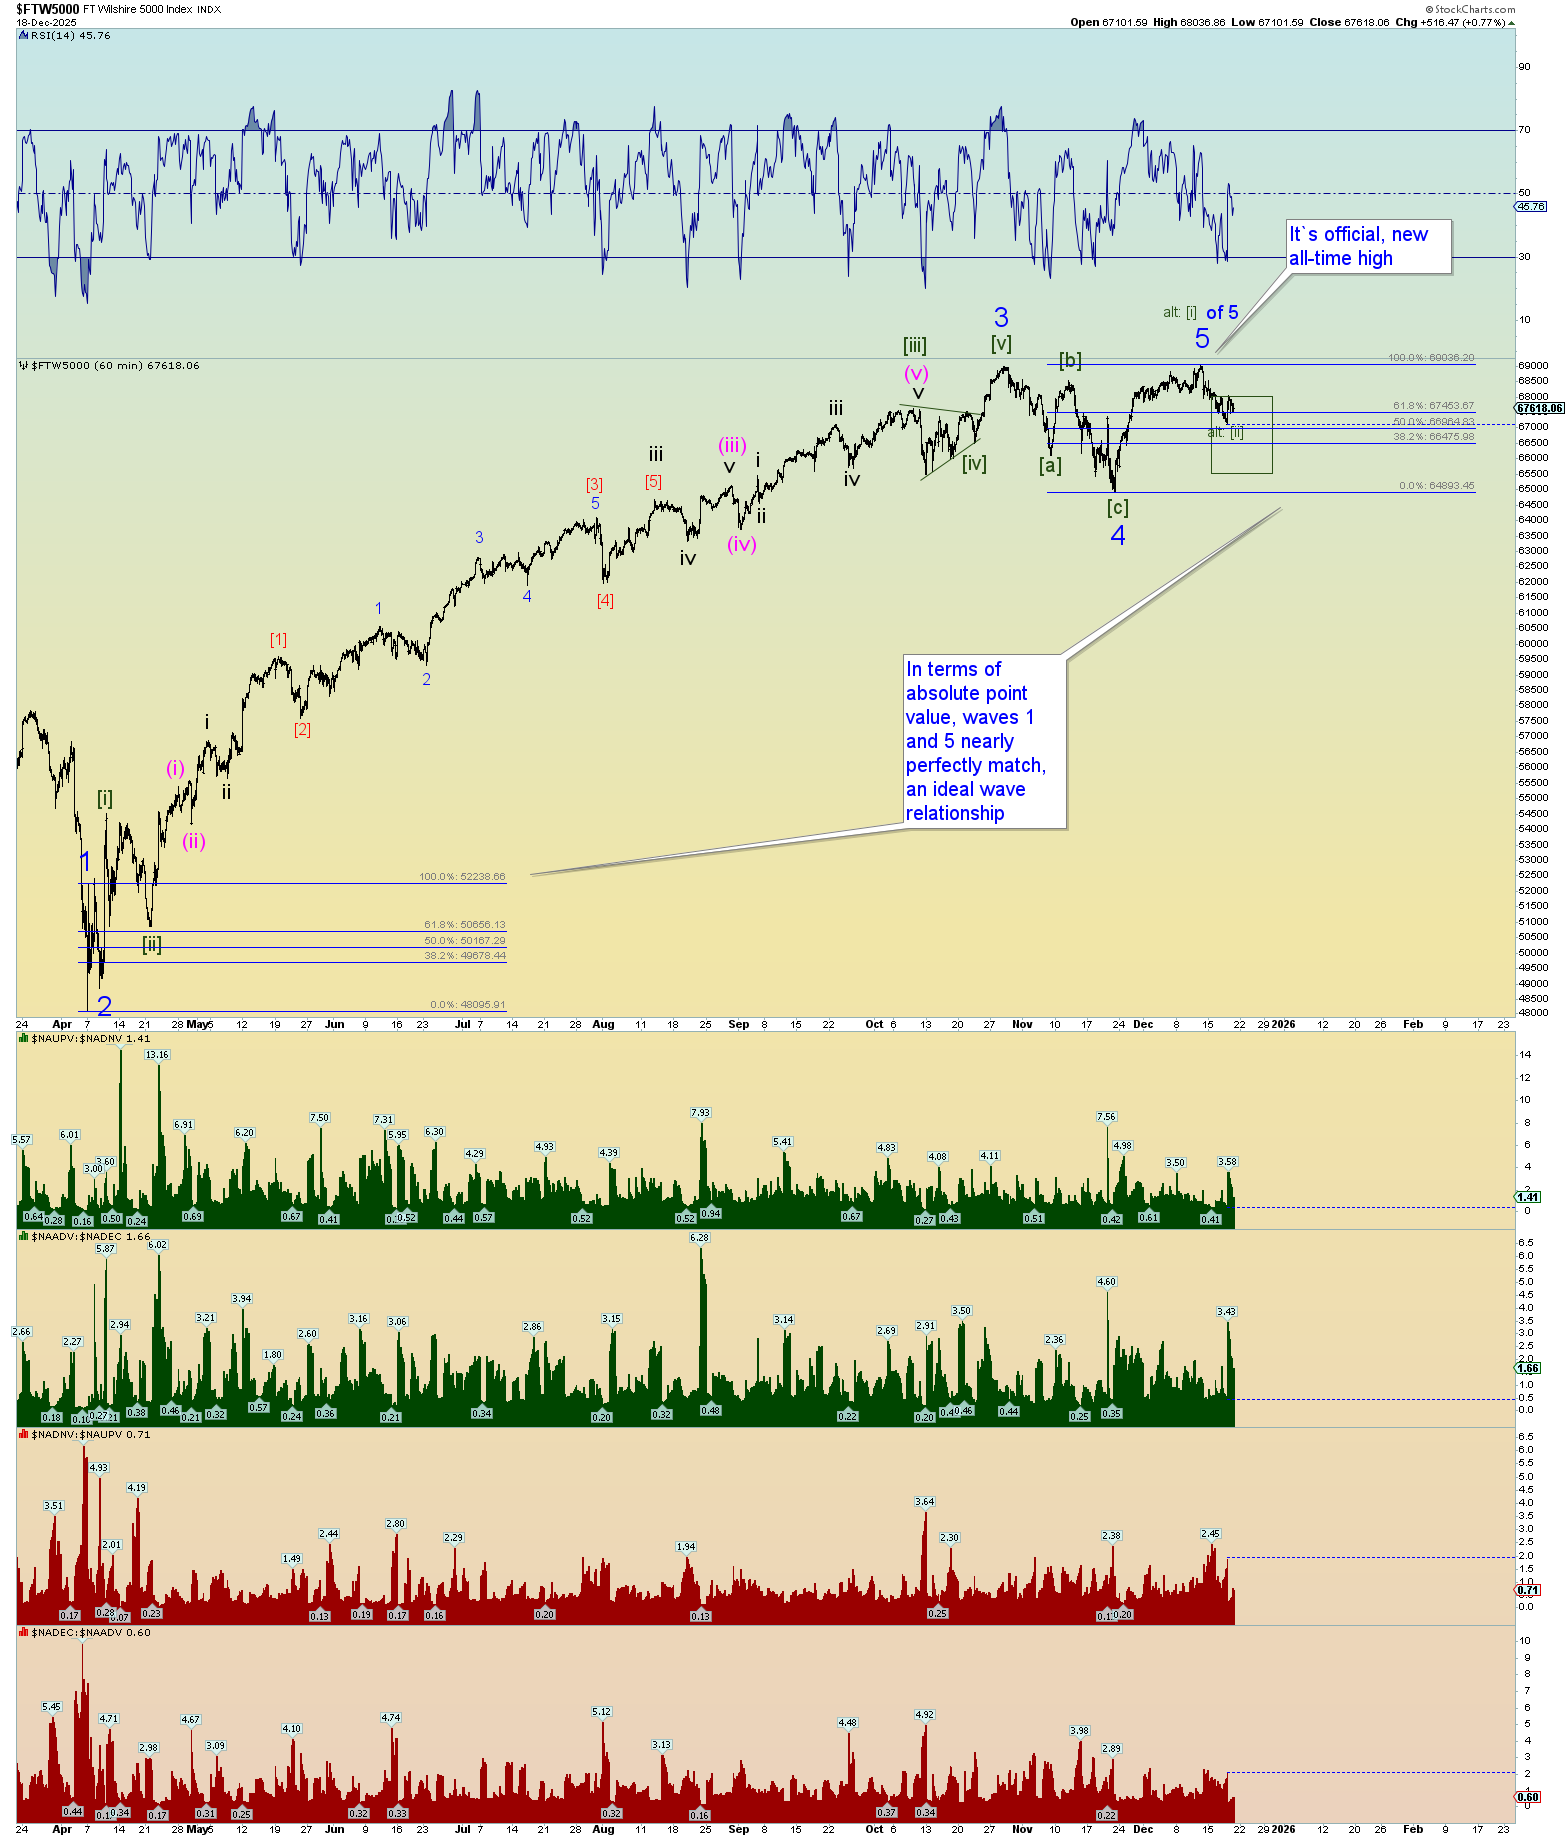
The top alt might have made its high today. Yes, today was a new all-time high in the Wilshire 5000. There is even room for another pop up out of the gate tomorrow but then it would have to reverse.
Sooner or later this long-winded bull count will end in spectacular fashion. The freak moves of Gold and Silver seem appropriately timed for this ending.
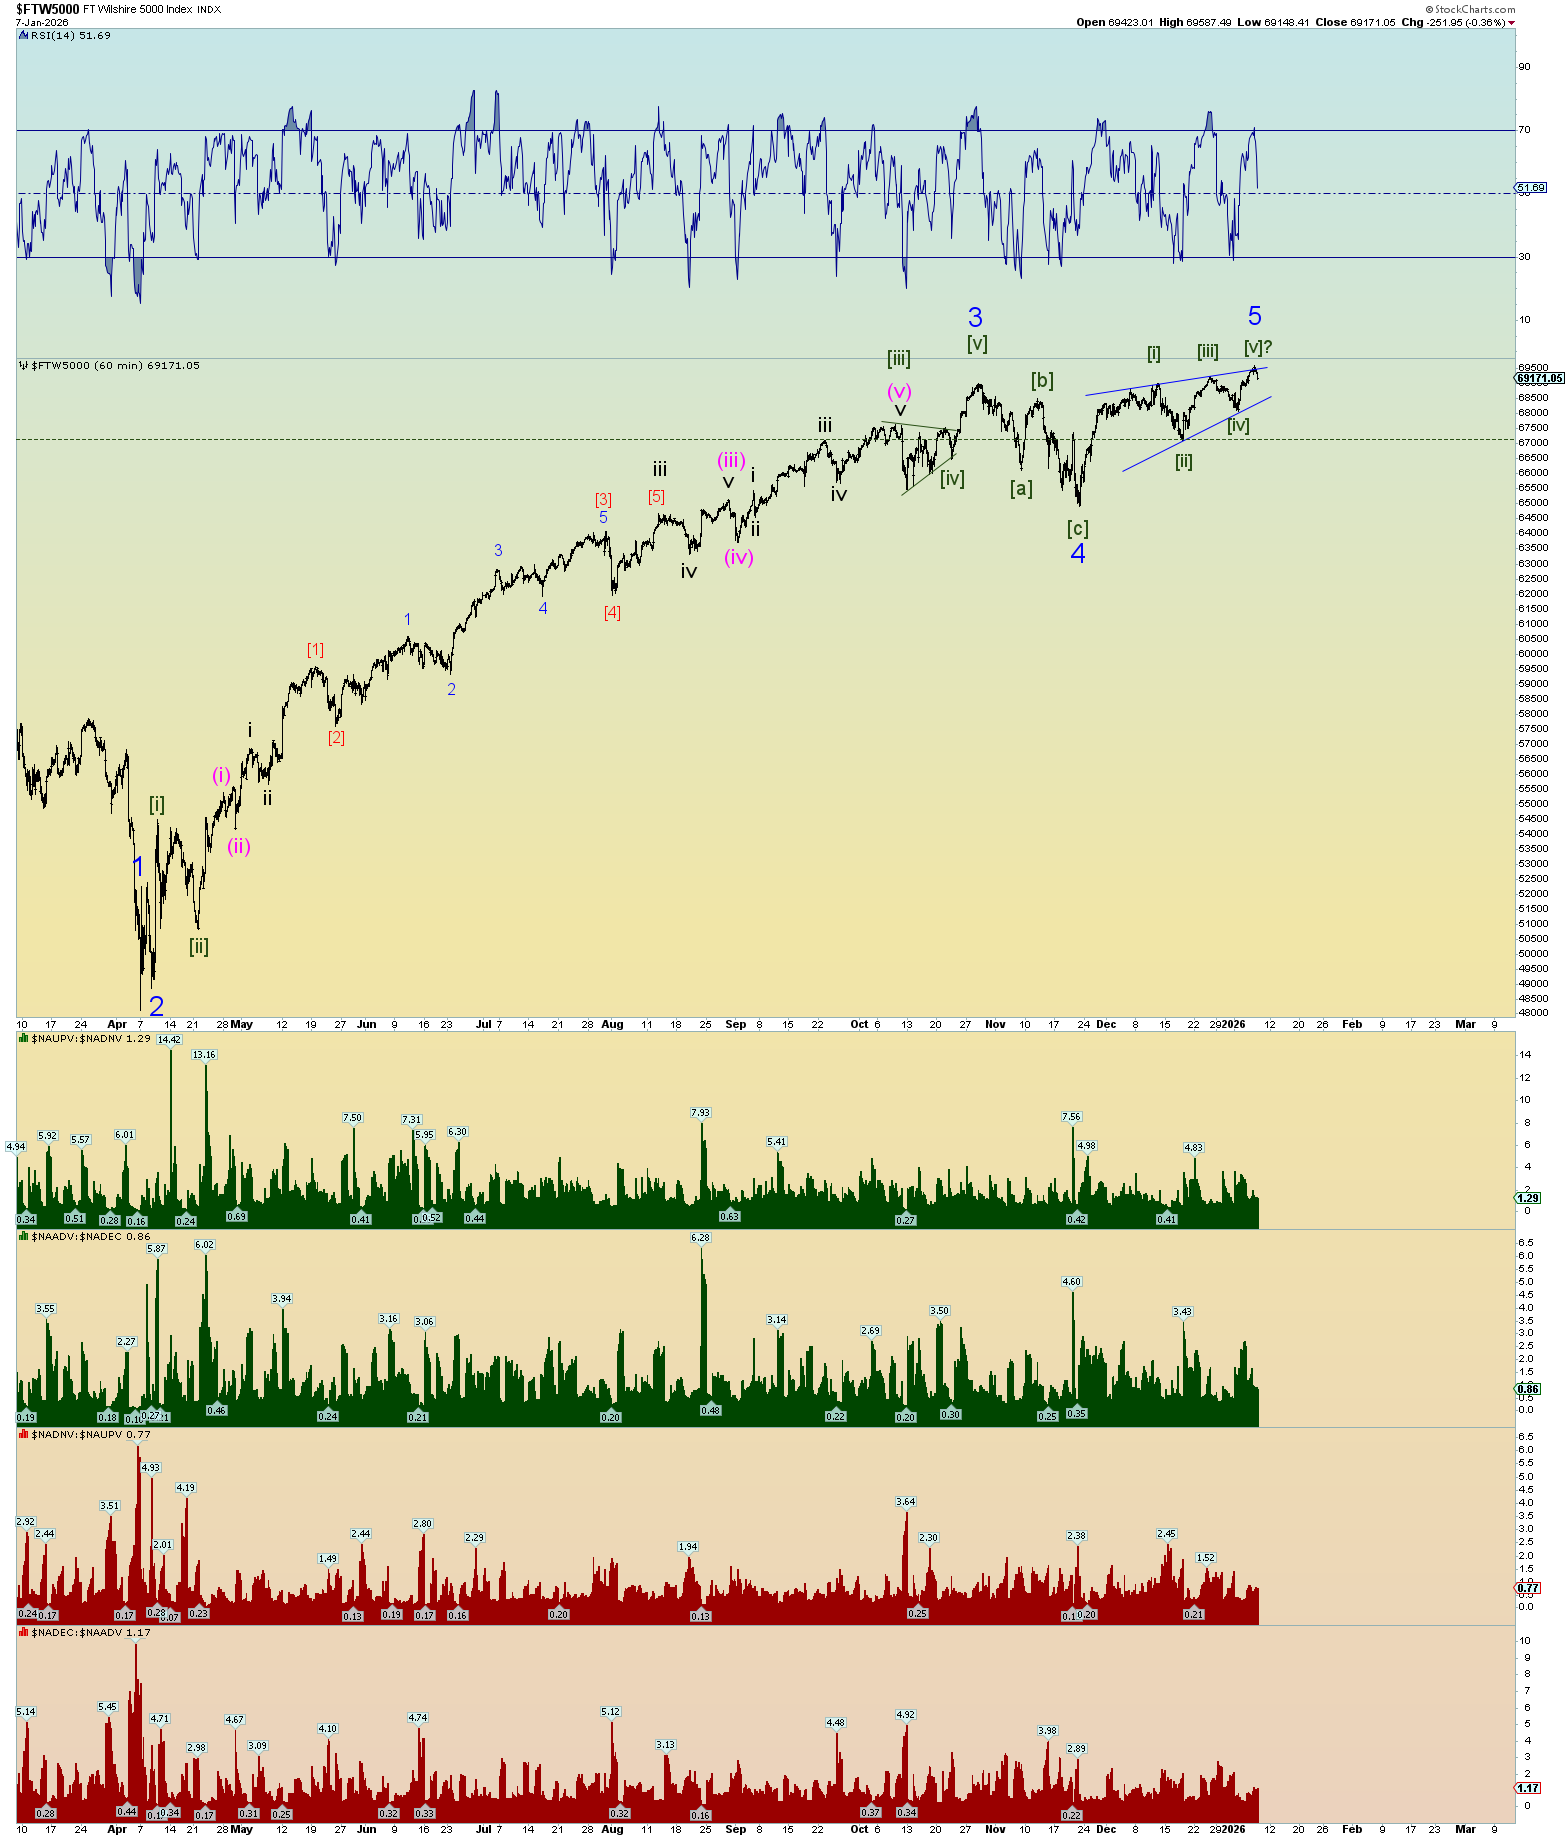
Well, the curious ending diagonal triangle pattern has perfectly topped over the trendline (as was suggested in yesterday’s update) and has gone under.
If this is the true pattern, expect a quick price collapse to beneath blue Minor 4.
So, we got that going for us. But these never seem to work out. Otherwise never mind. We’ll know tomorrow.
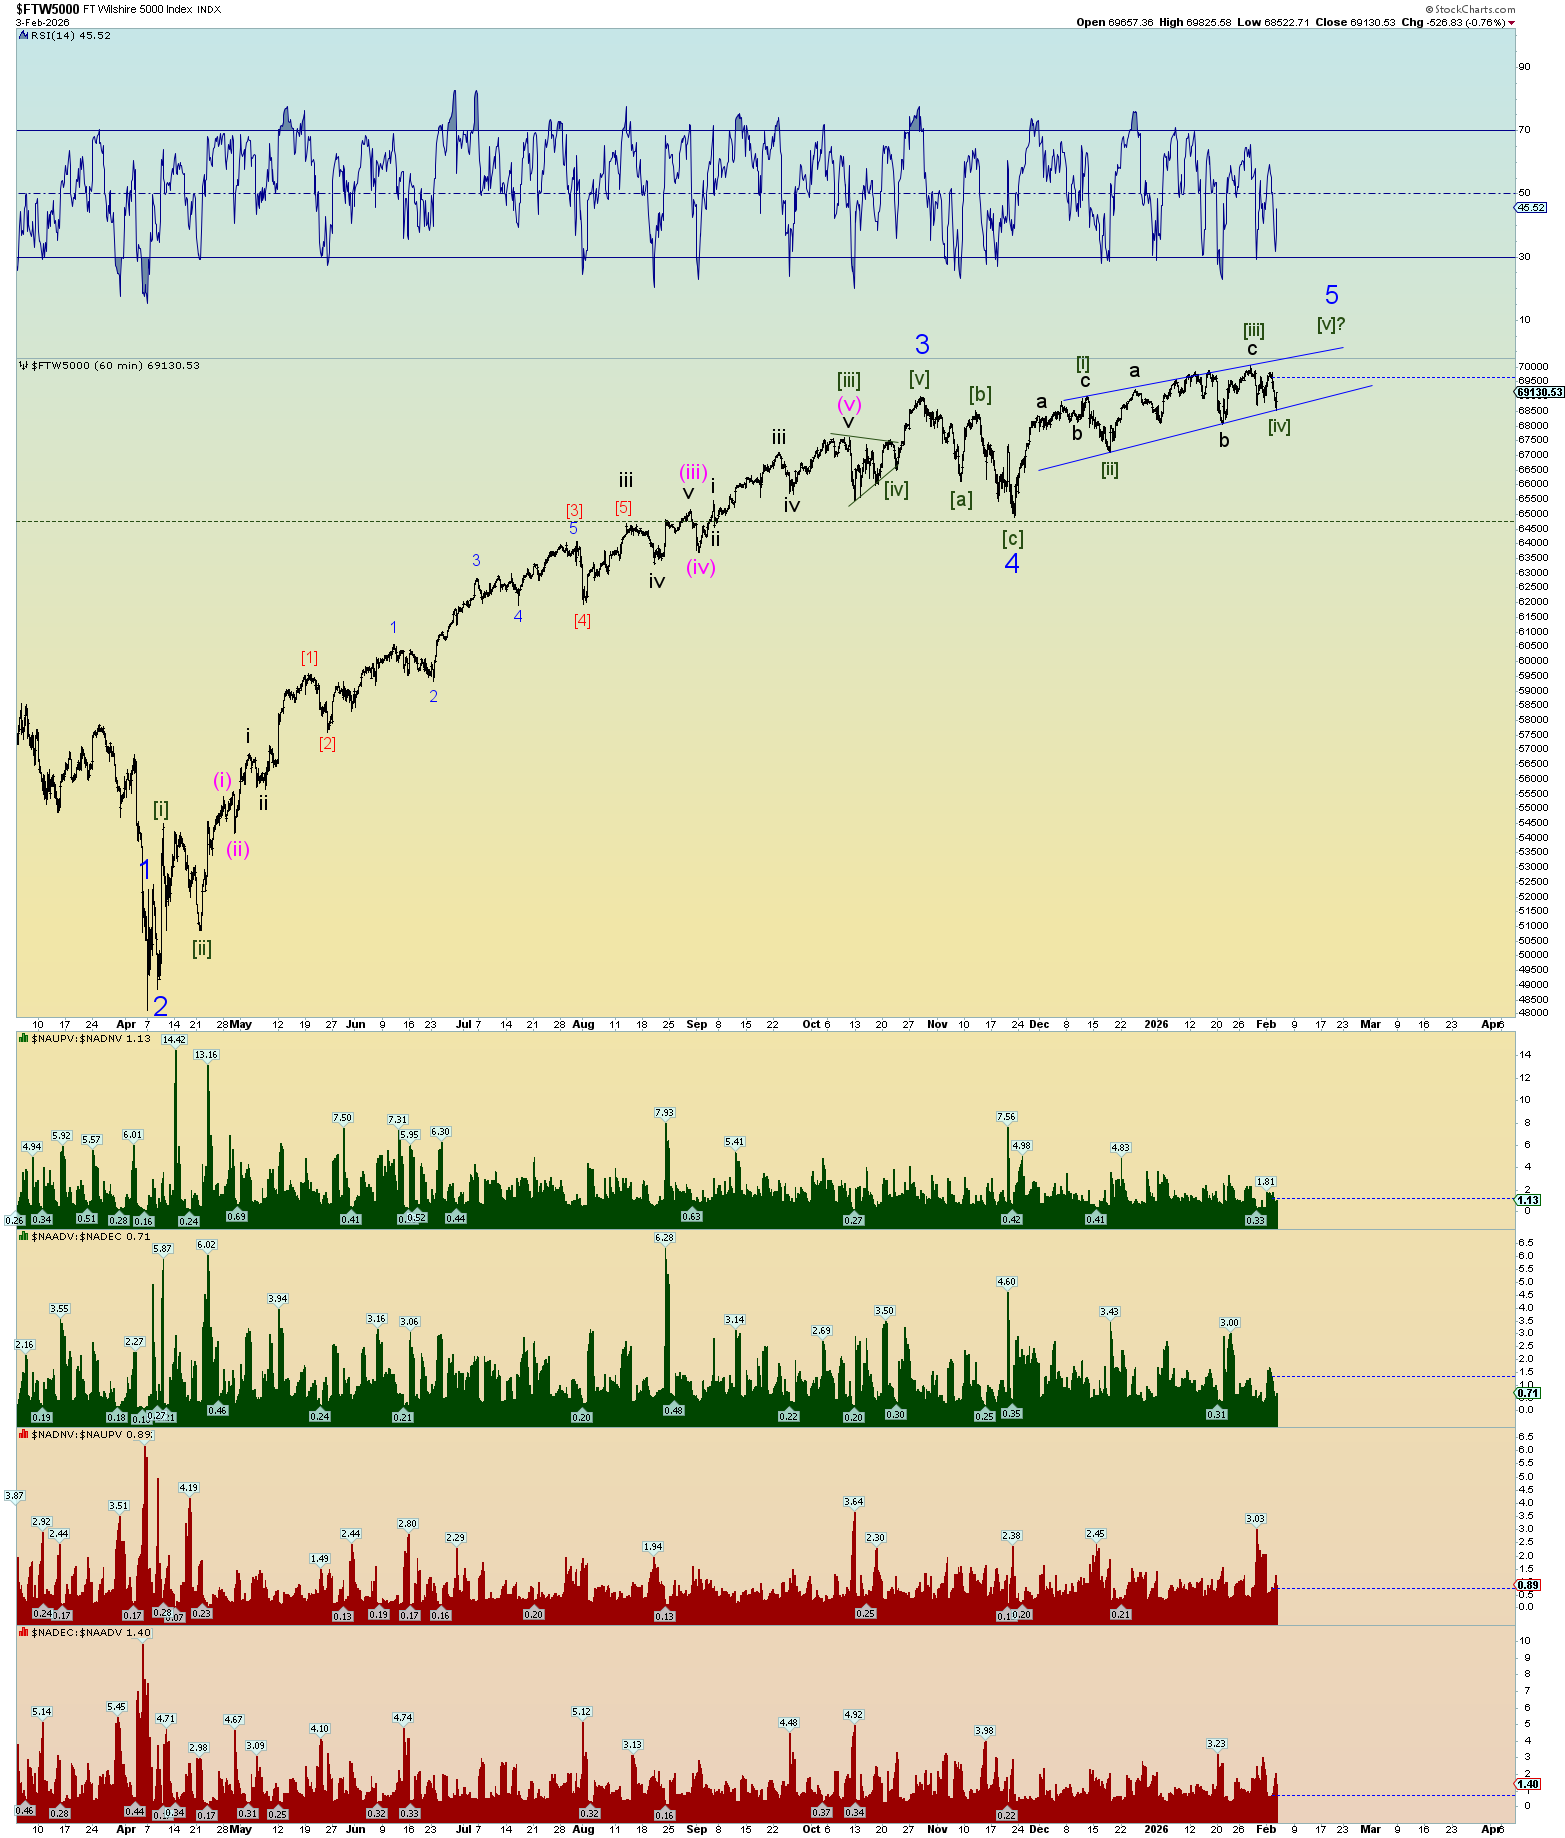
Top count is that wave 5 is underway.
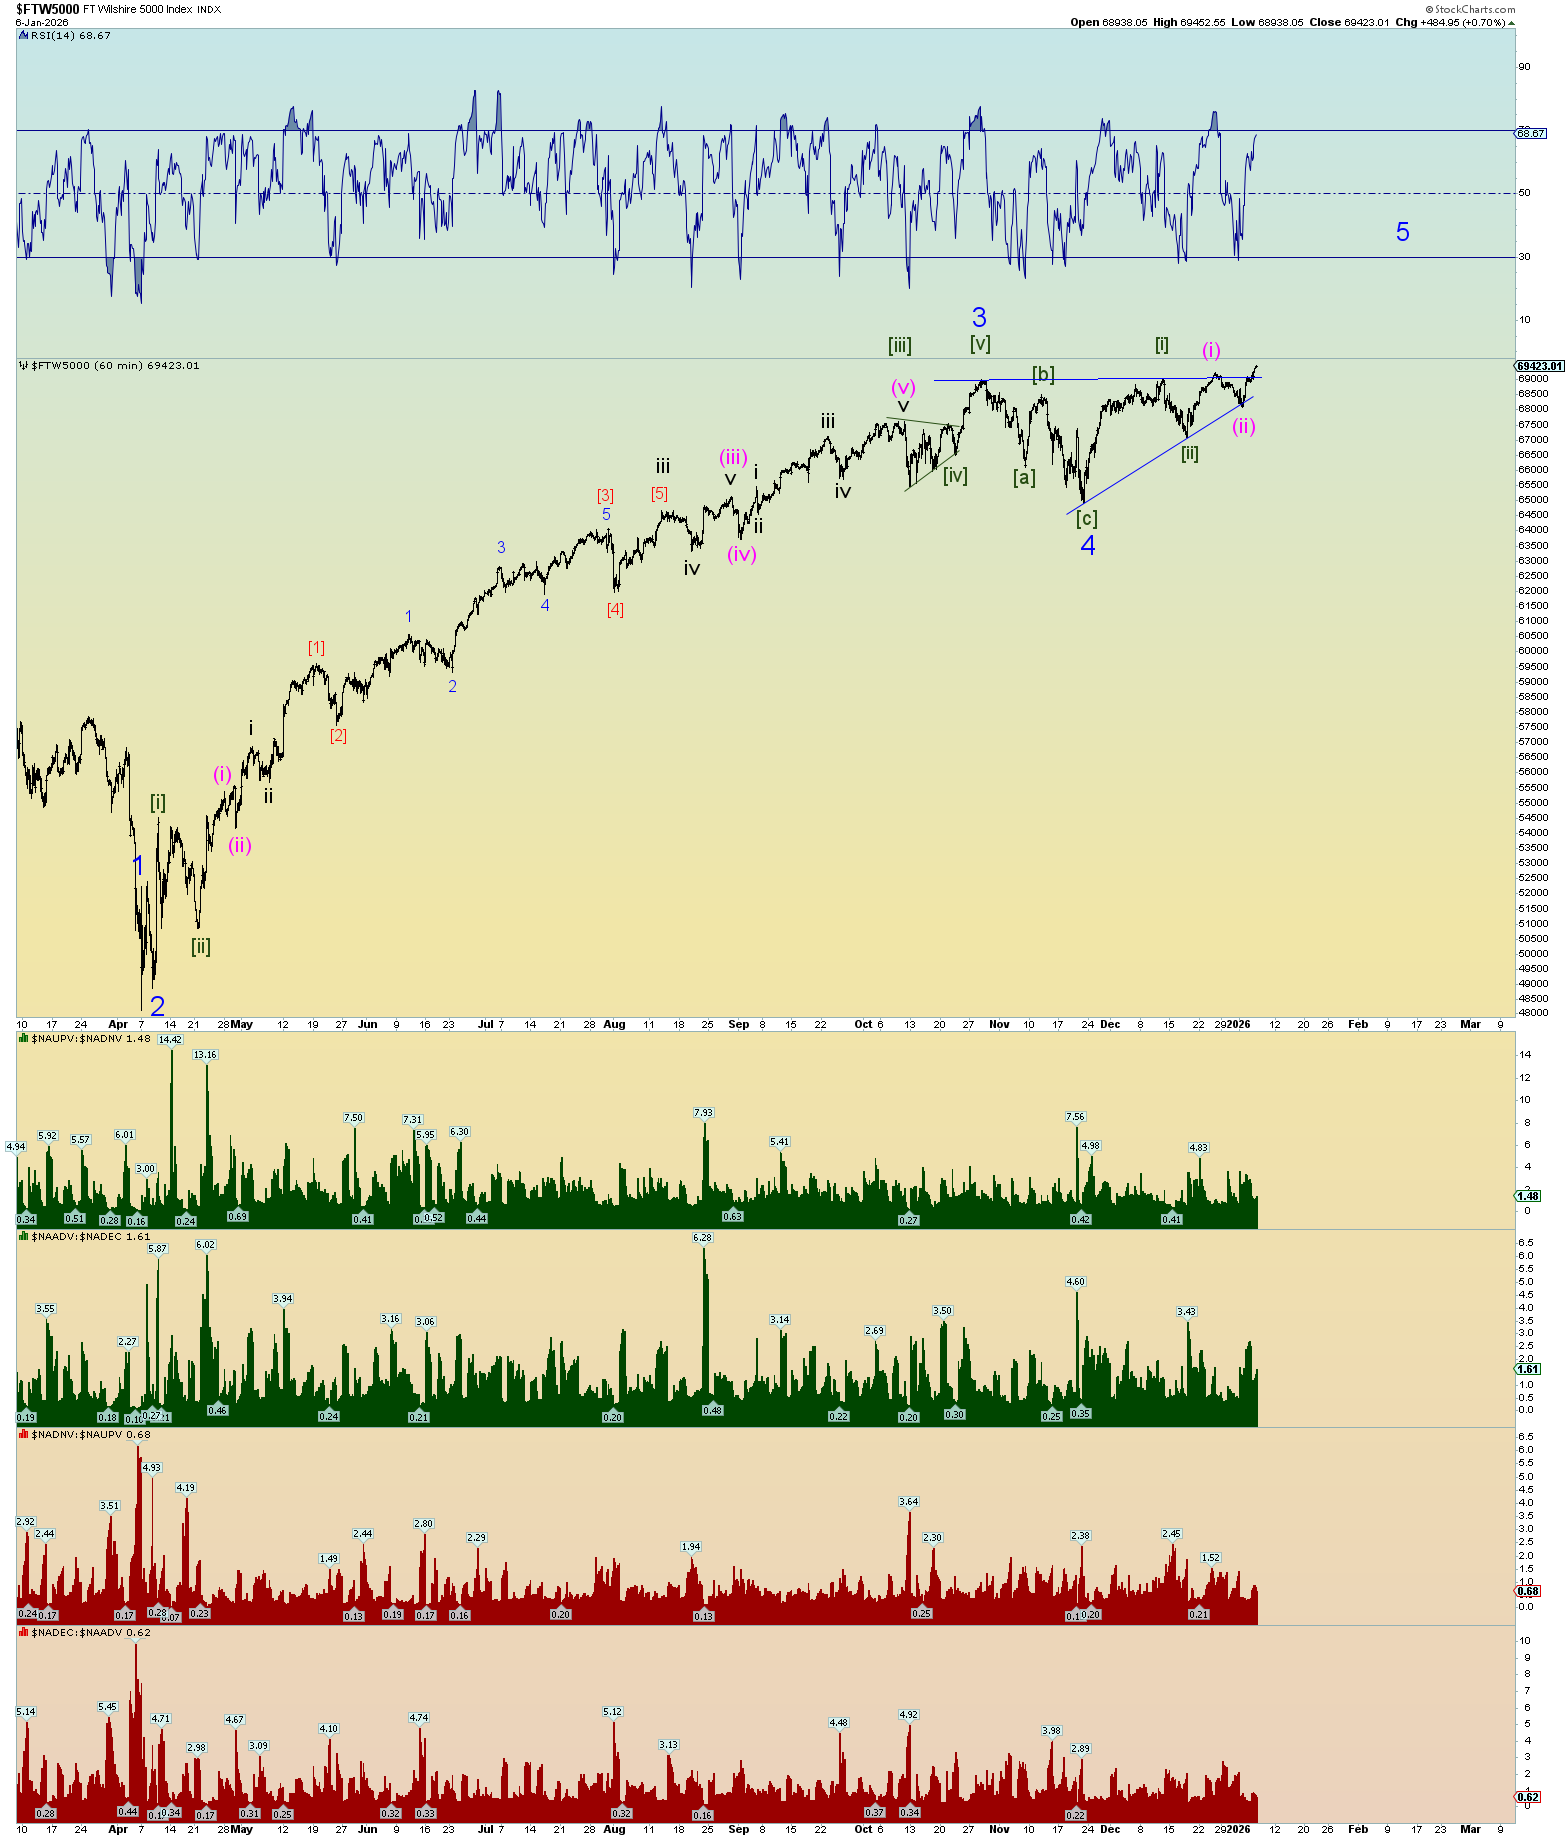
The alt is a curious ending diagonal triangle. This would imply perhaps a small pop over the trendline tomorrow and then price collapse.

Or a lower wave count. Regardless.
Best guess squiggle count. Yes, it’s not a “clean” impulse down, but yeah, if we are transitioning from a major all-time top into something else, it will be messy.
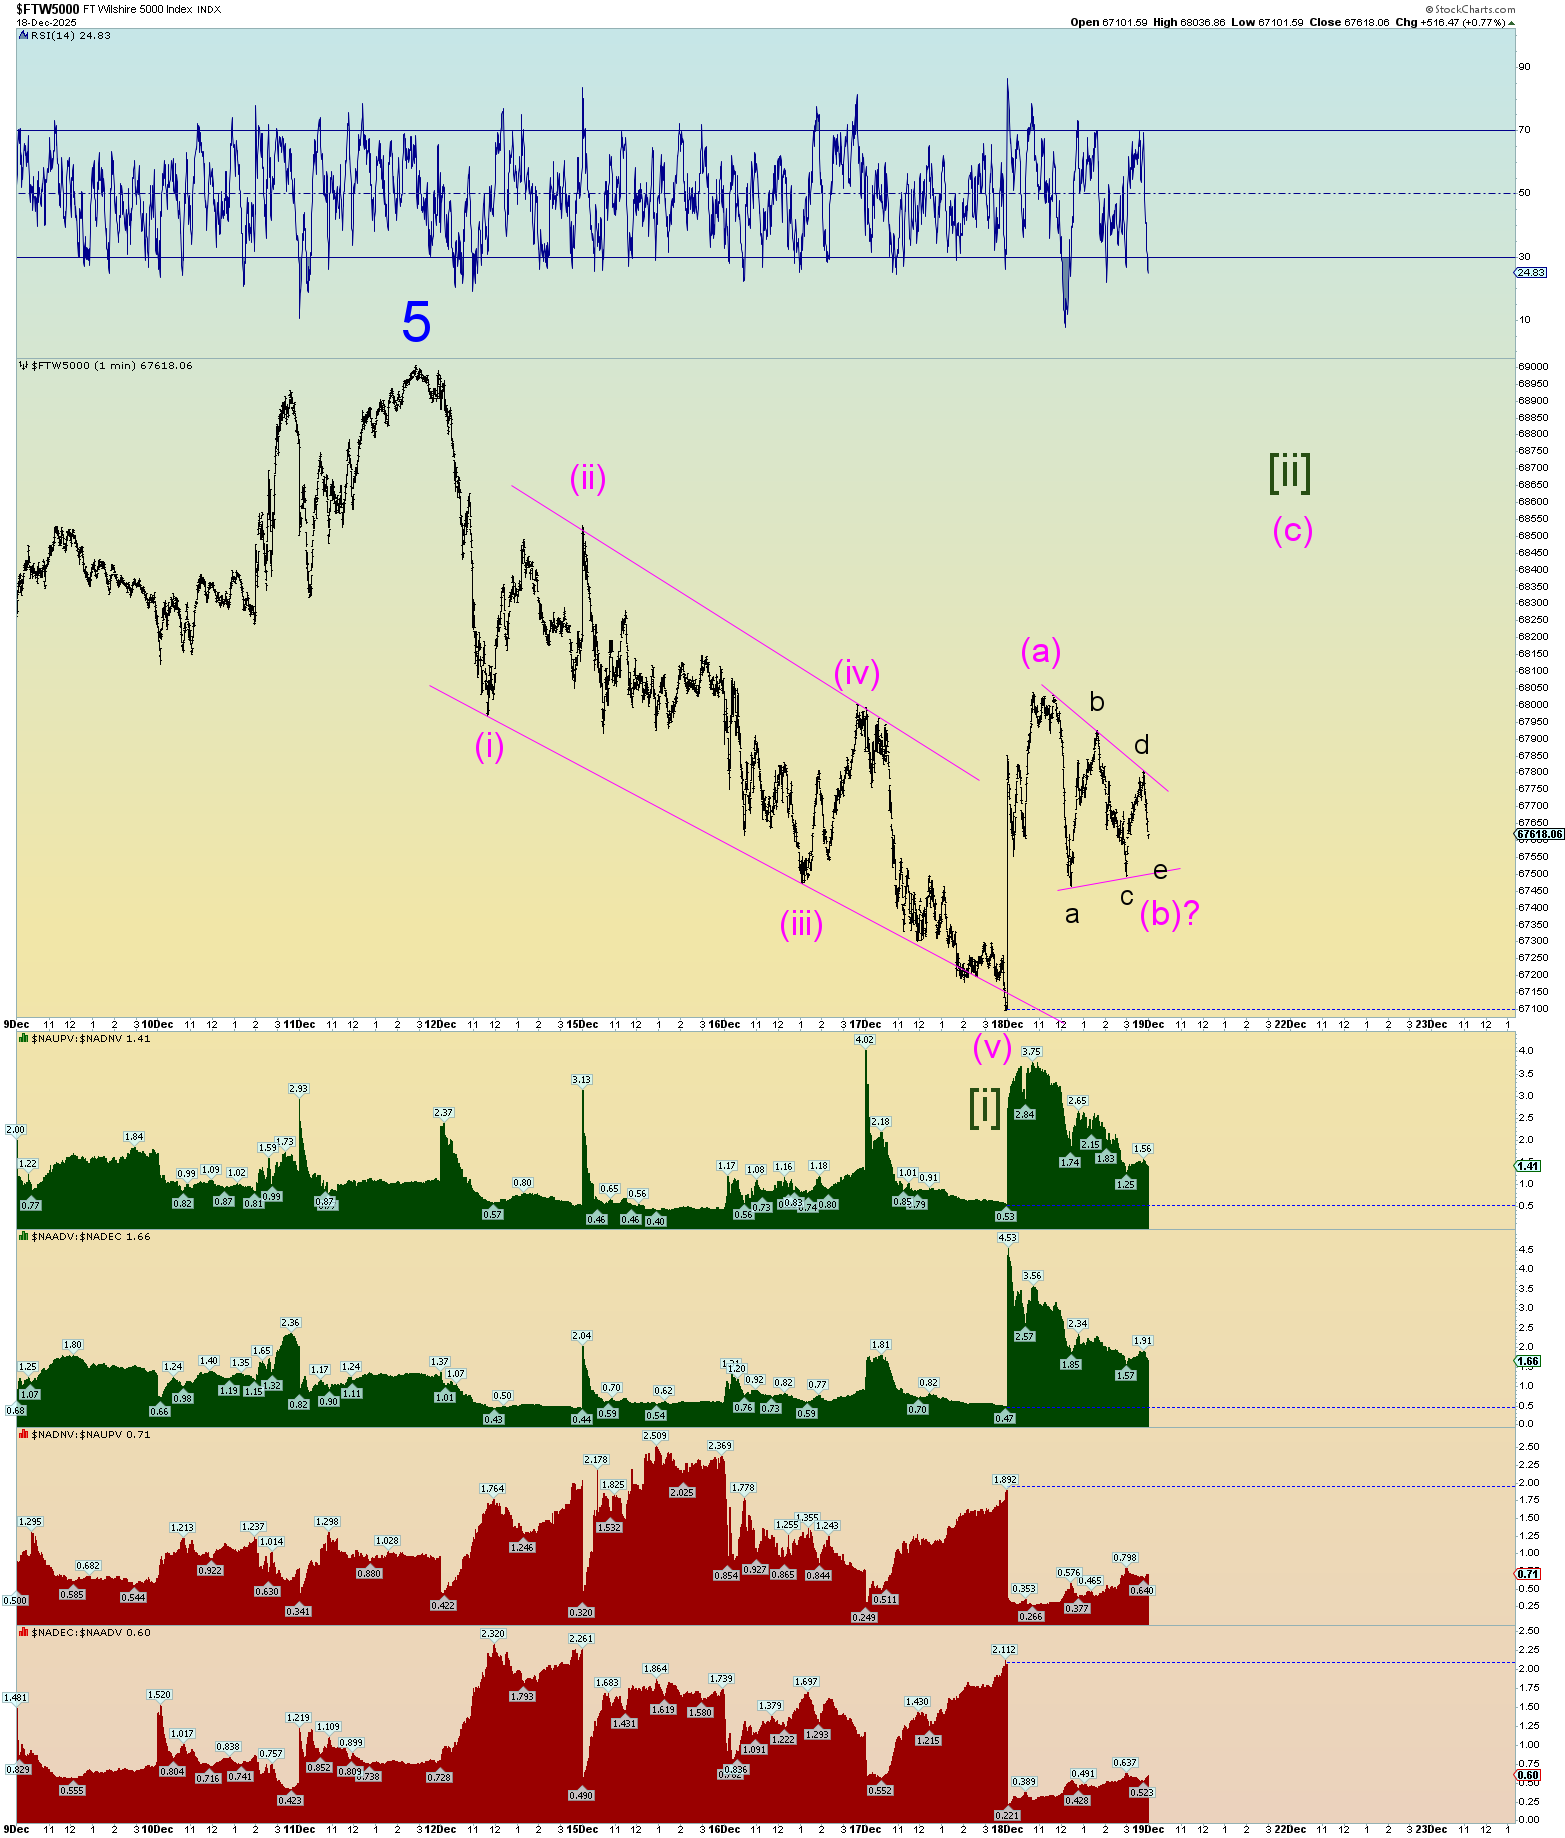
The top alt count is that Minute [ii] of 5 is tracing out or has bottomed today.