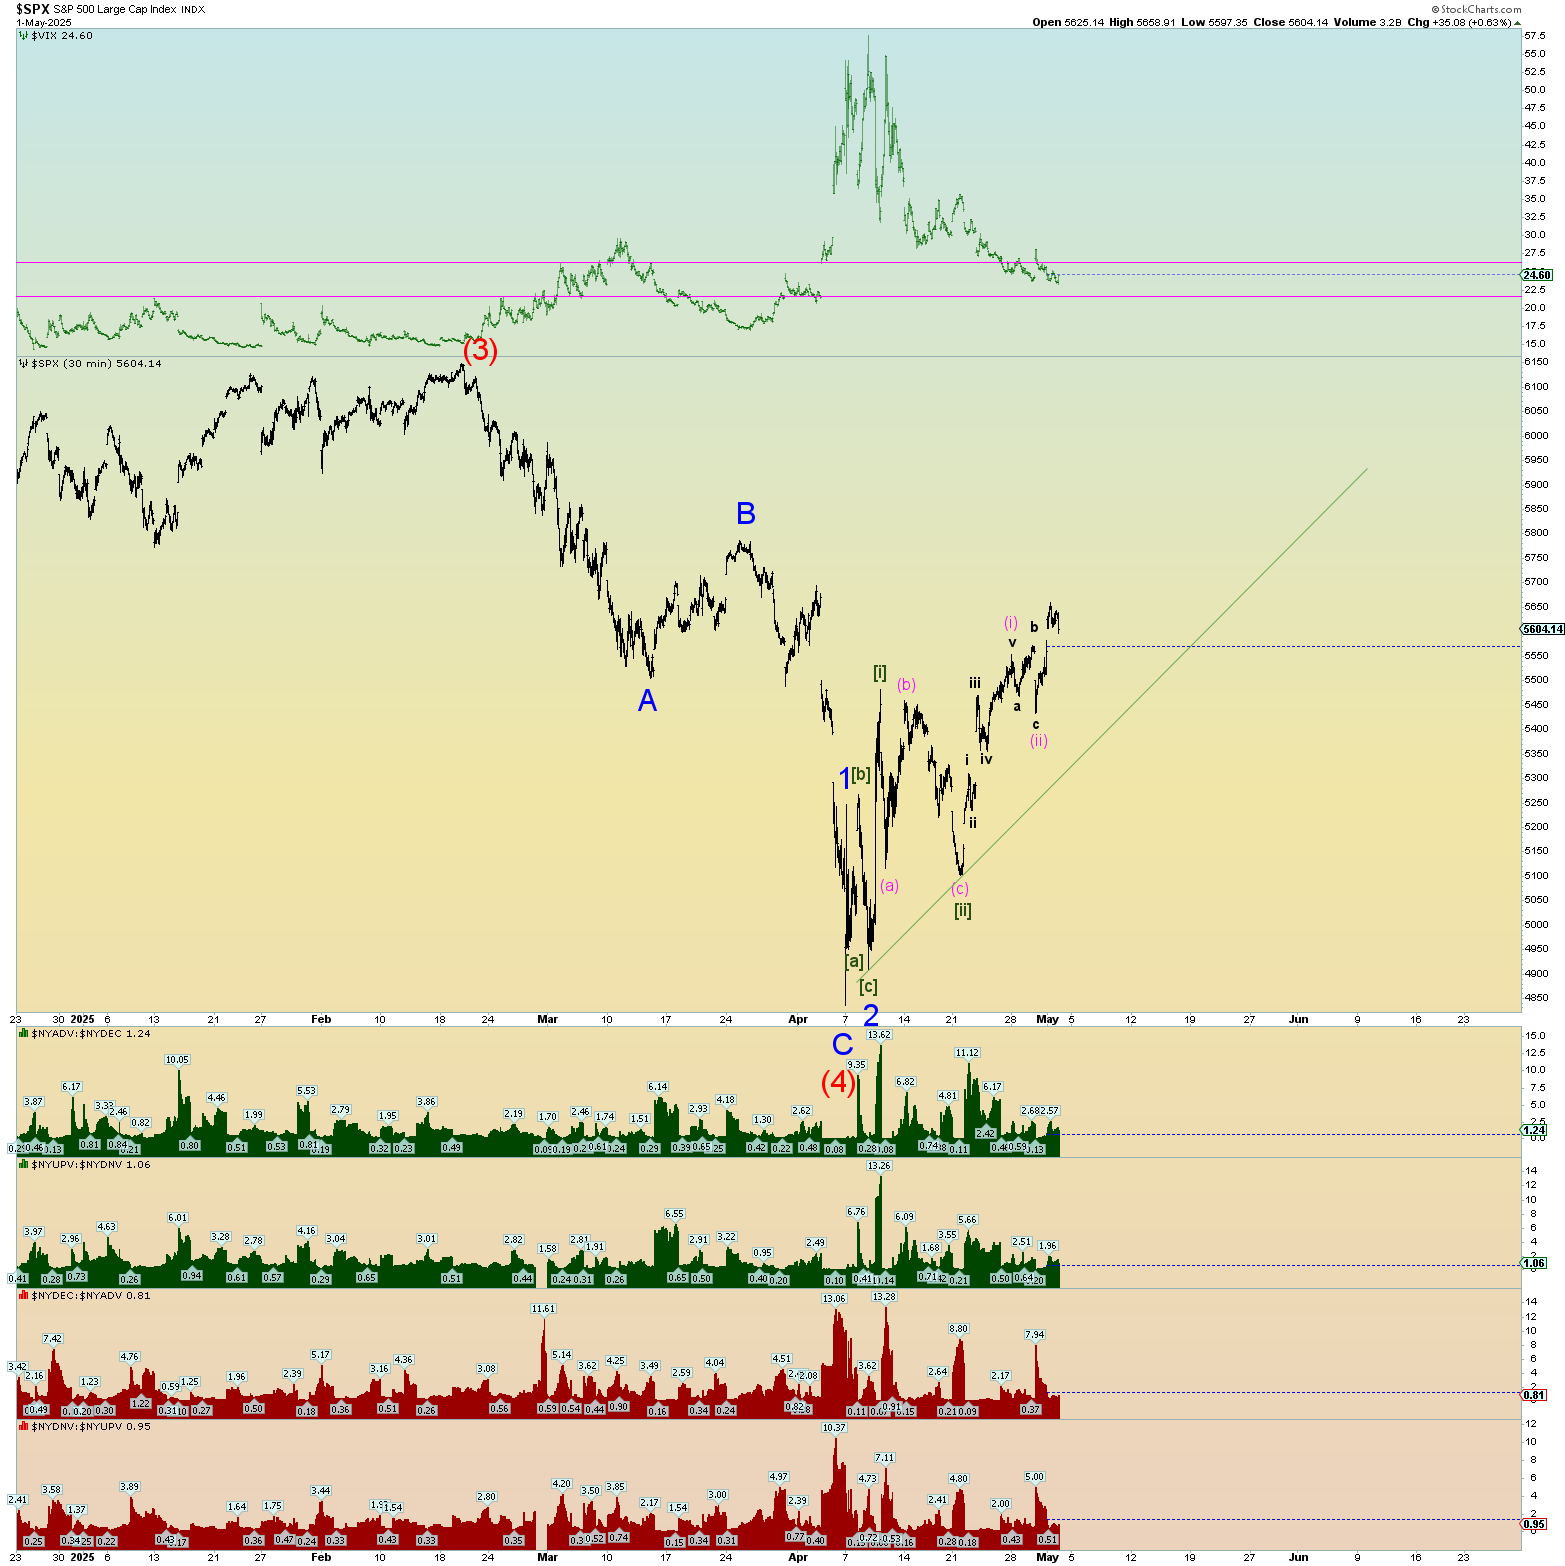
Just a few quick charts from the point of view of the bulls again which is the preferred count based on the overall “three” from all-time peak to spike low, the series of “one-twos” off the spike low, and the rare Zweig Breadth thrust event. The market closed above 5600 which can be said to be bullish along with 8 straight positive up days for the SPX which is very rare.
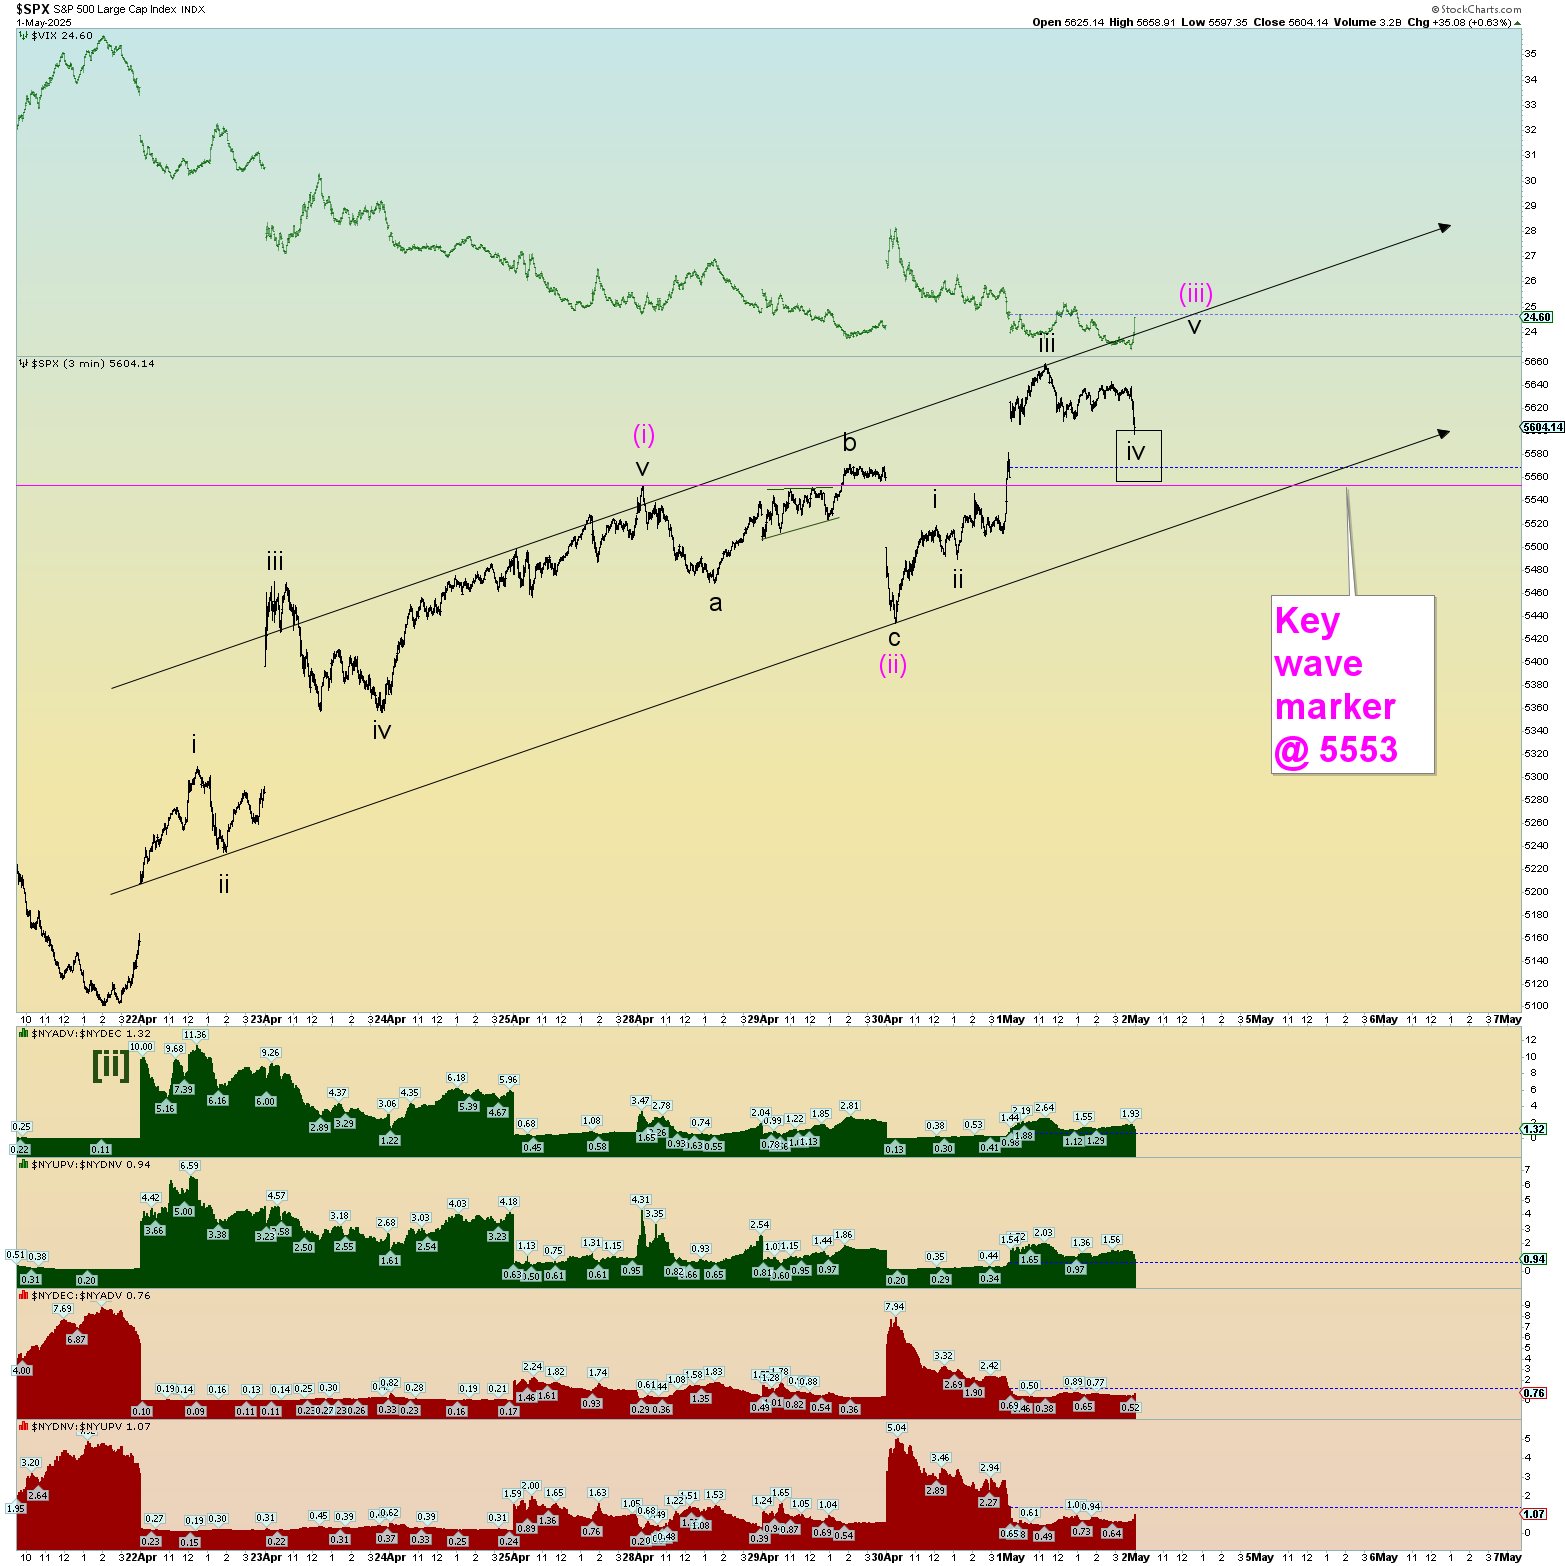
But there is a key wave marker perhaps in SPX 5553 or so. If prices fall below this, then everything will have to be reevaluated.
Just one proposed squiggle chart. Obviously, there is room to operate a bit. A Minute [iii] of 3 up channel to be followed may be emerging. Perhaps it is too steep, we’ll adjust if need be.