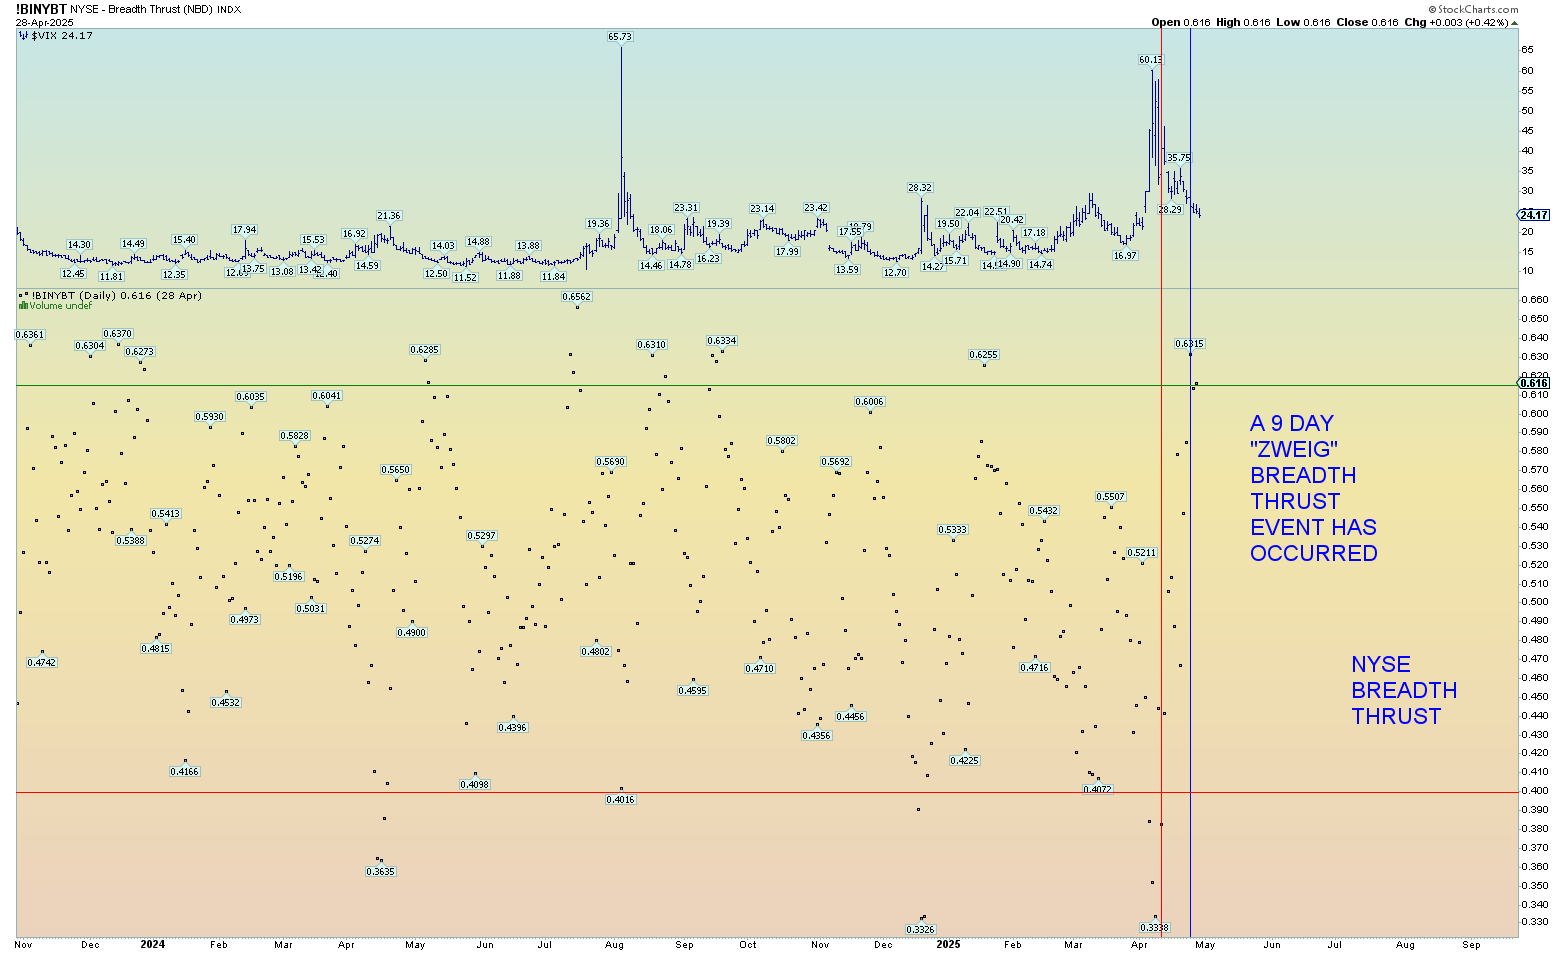
The New York Stock Exchange experienced a very fast and rare “Zweig” breadth thrust event. Within 9 days, the breadth went from well beneath .40 to above .615 indicating an abnormal “thrust” event appetite for stocks and a fairly reliable indicator that a new all-time high will eventually occur. A thrust event of this magnitude almost always indicates much higher prices are coming, at least a challenge to all-time highs. The VIX seems to be steadying down, and the massive intraday moves have subsided as a result. In other words, a slow steady grind for the SPX and INDU back toward all-time highs would likely take 2-5 months (from its recent low). A summer of “climbing the [media-induced] wall of worry”.
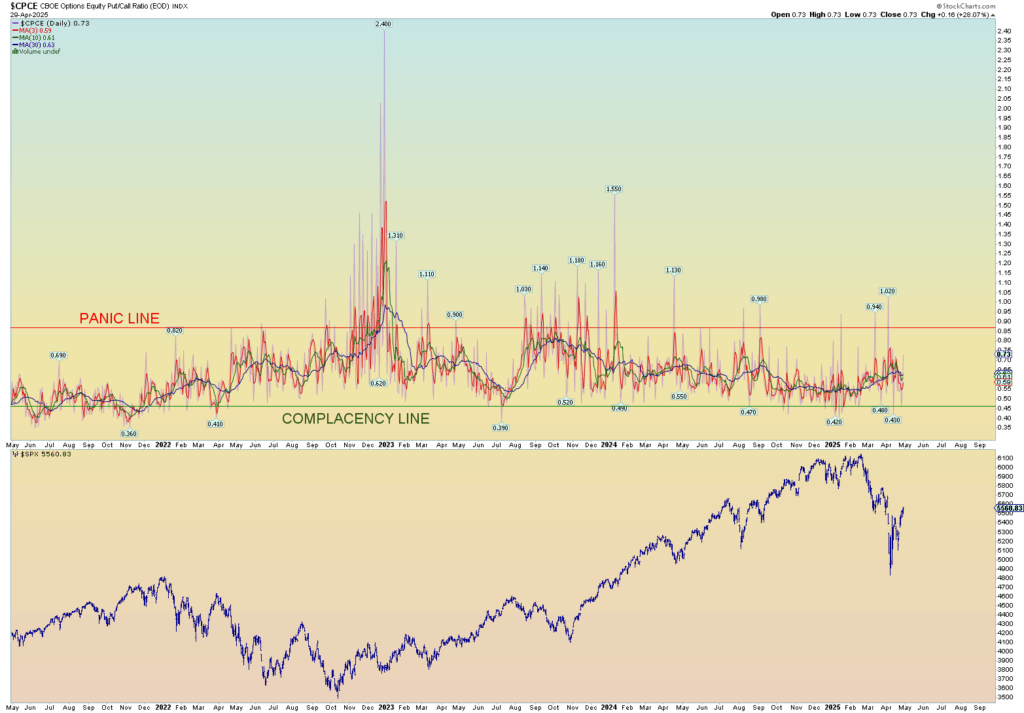
Again, I assumed the CPCE would indicate “panic” at some stage in this correction, but it has not. Despite the media wanting to be super bearish and hate Trump and his administration and want to take him down by constant gloom and doom, the underlying truth is that true market panic was just not there. Yes, it was reflected in the elevated VIX (which is very sensitive in these extremely leveraged markets), yet the underlying CPCE put/call ratio barely got excited. Seems more of a technical washout event meant to shake out weak hands to load up on cheaper prices.
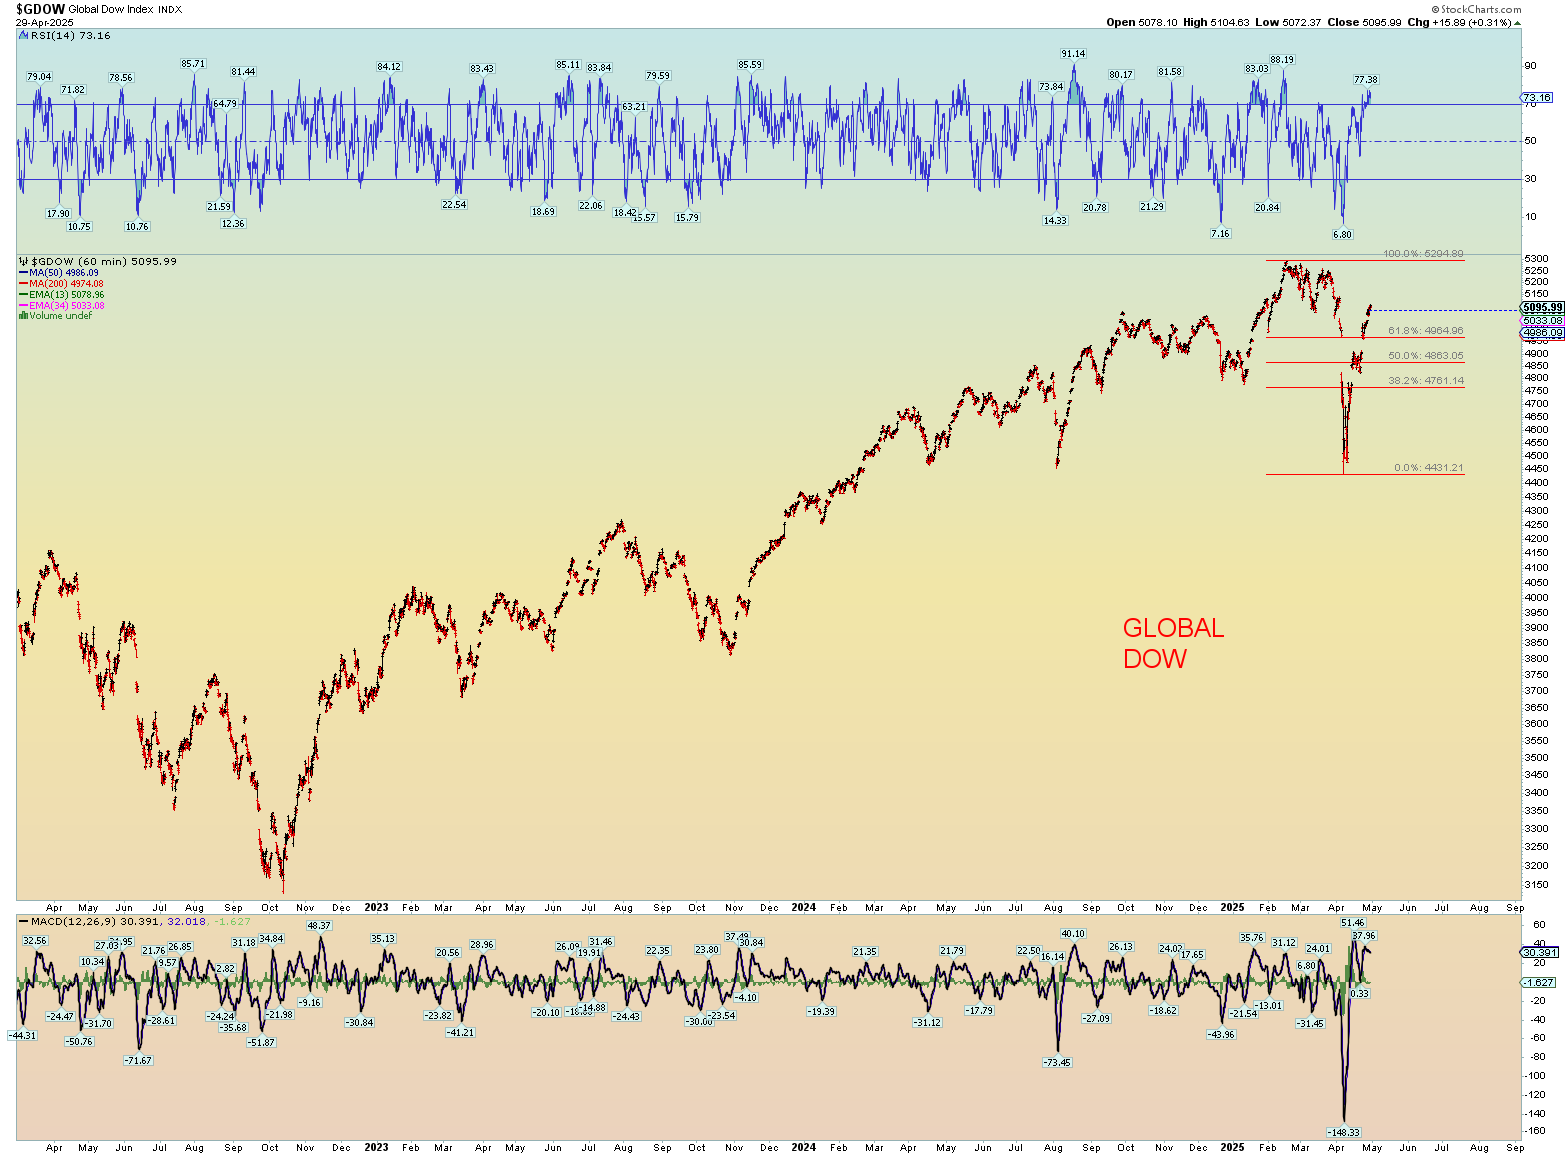
The Global Dow has recovered quite a bit.
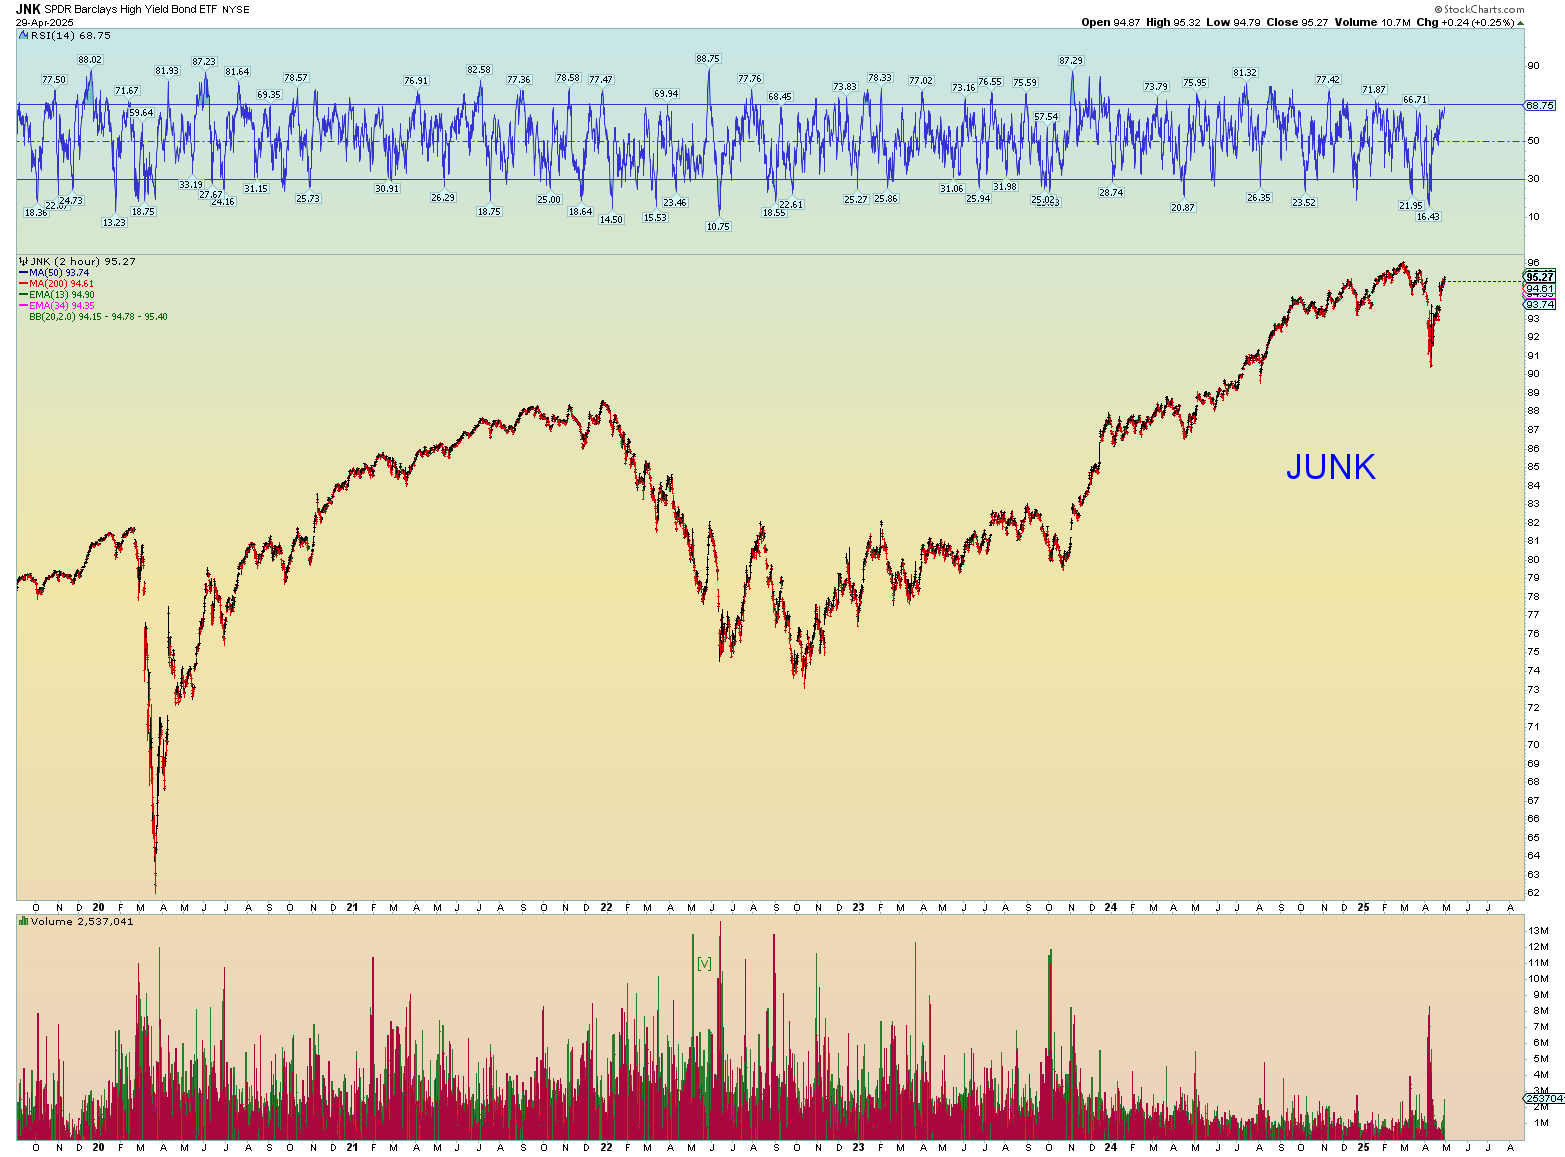
JUNK debt is being gorged upon still.
THE COUNTS – FIRST, THE BULLISH
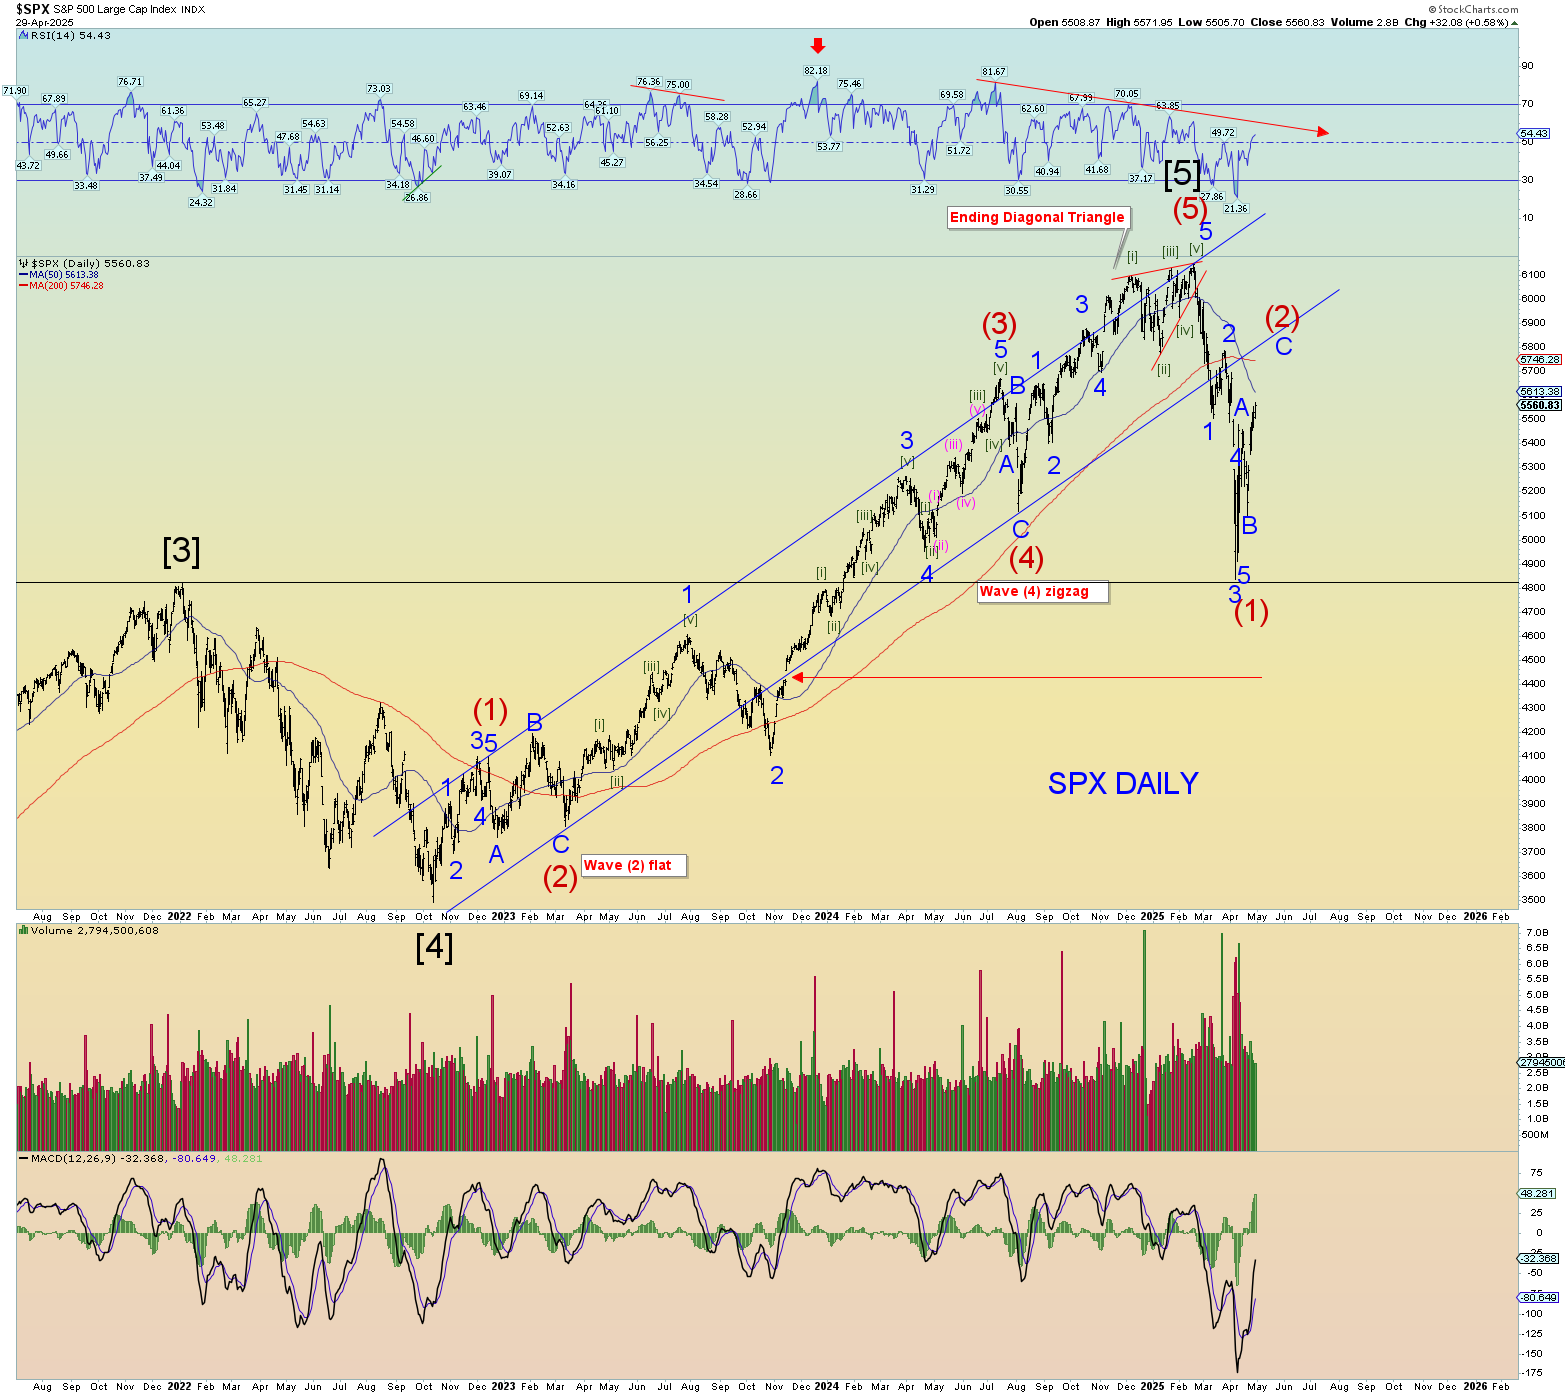
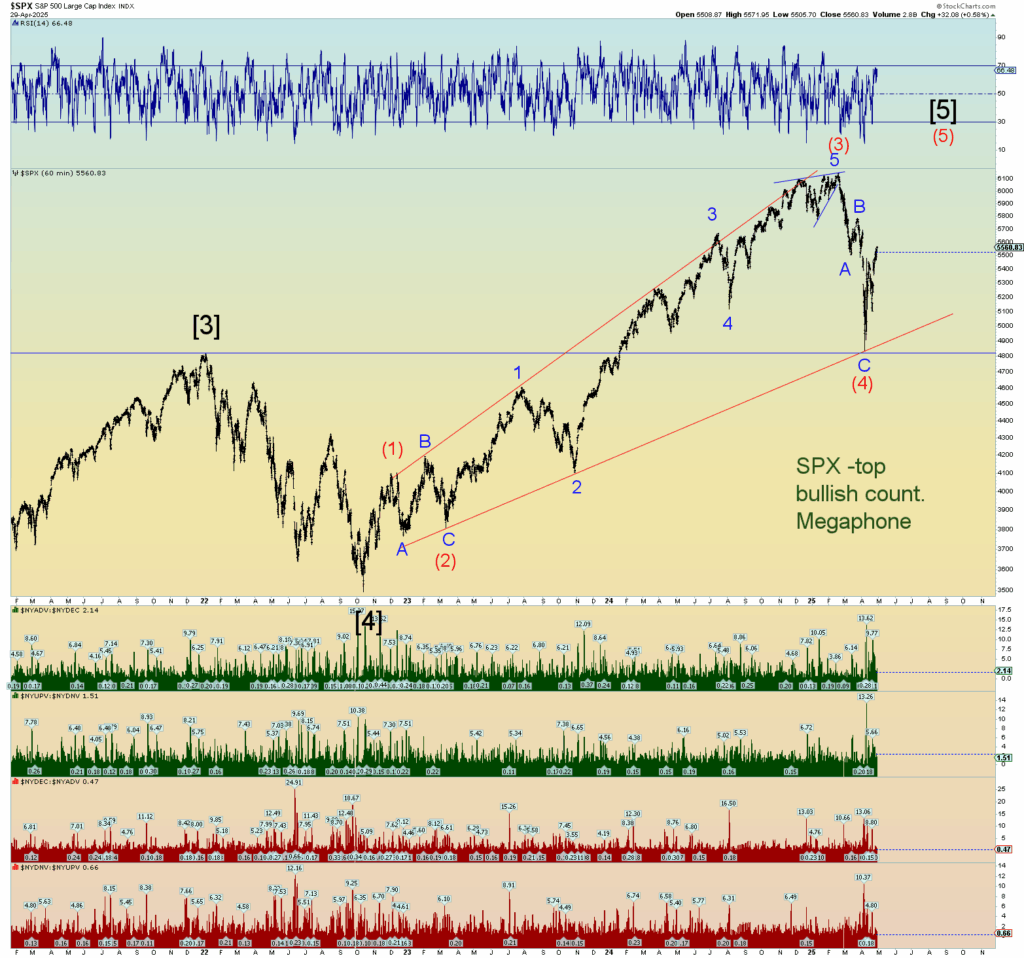
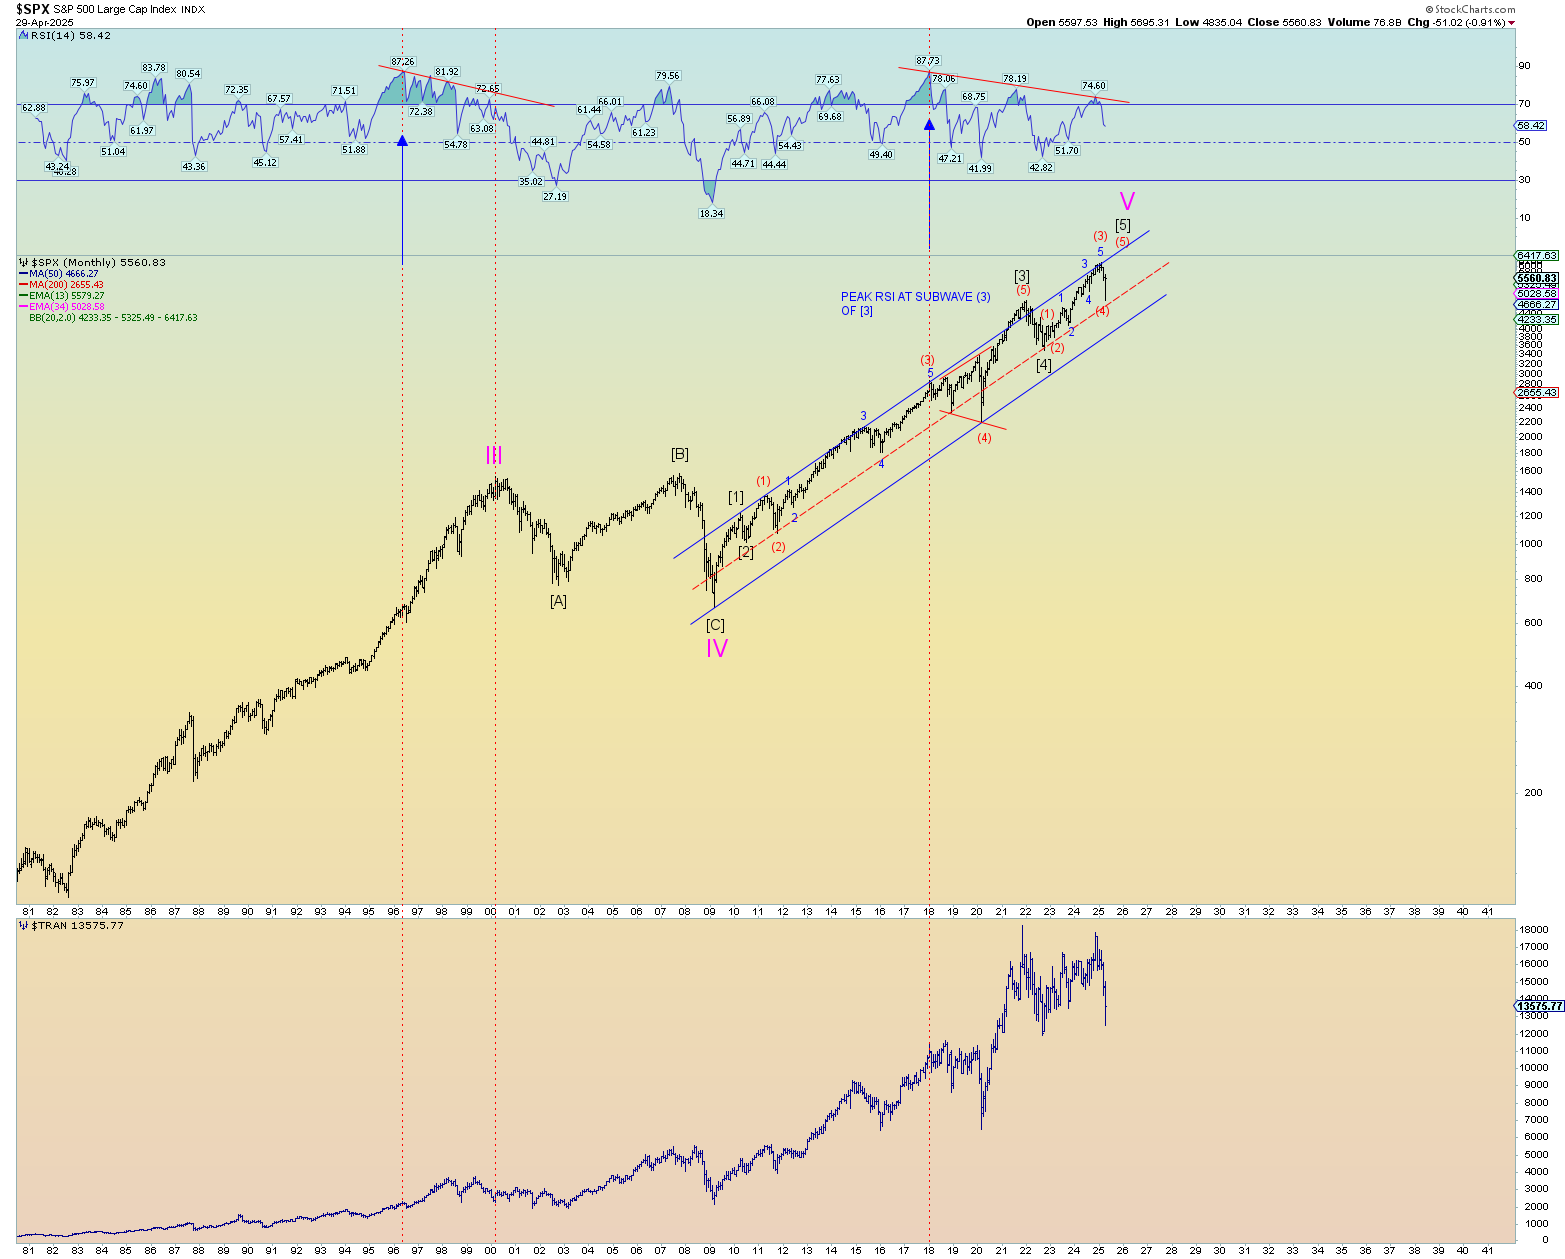
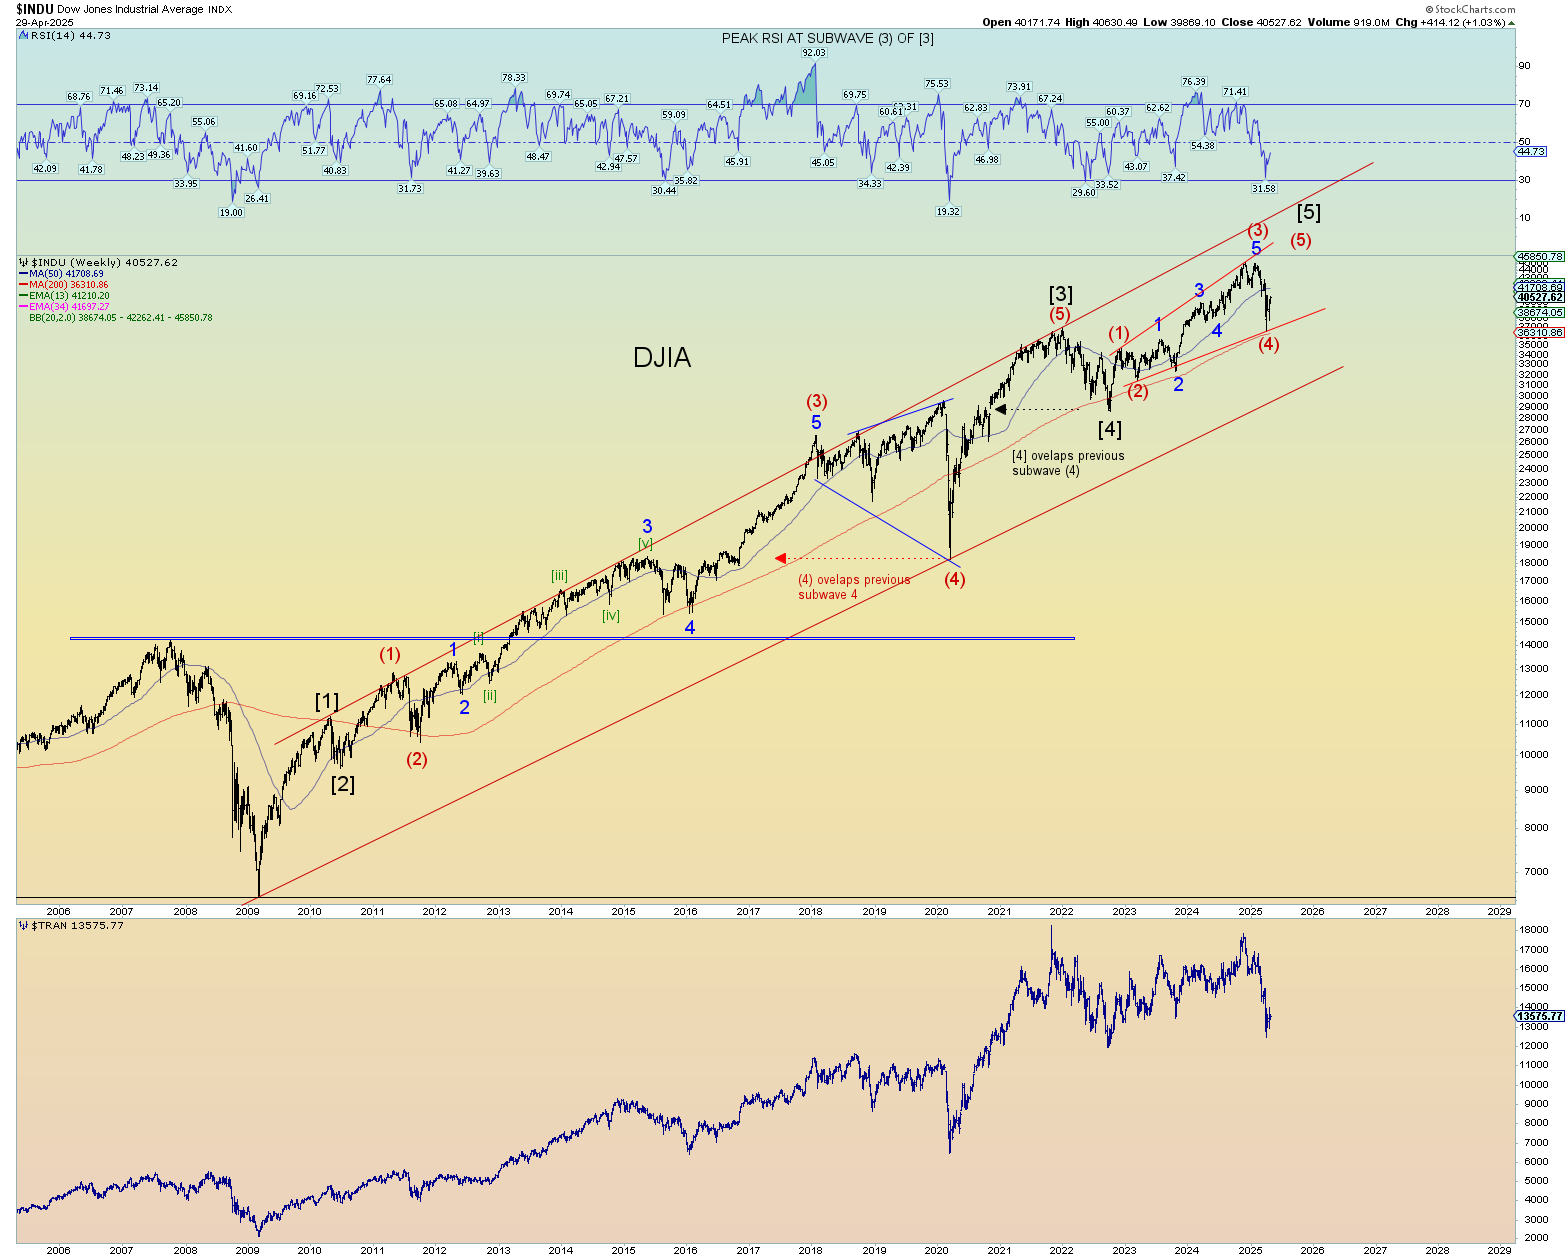
The bullish count, again based on the reliable Zweigh breadth thrust event, has the SPX is a wave (5) count. I have it labeled 1-2, [i]-[ii] up but that could be premature if a more developed multi-month pattern plays out back toward all-time highs. There is nothing objectionable to this count. Yes, wave (4) was quite a shock, but that seems to be the norm anymore. We have wave (3) stretched out nicely and wave (2) alternates in corrective form from wave (4).
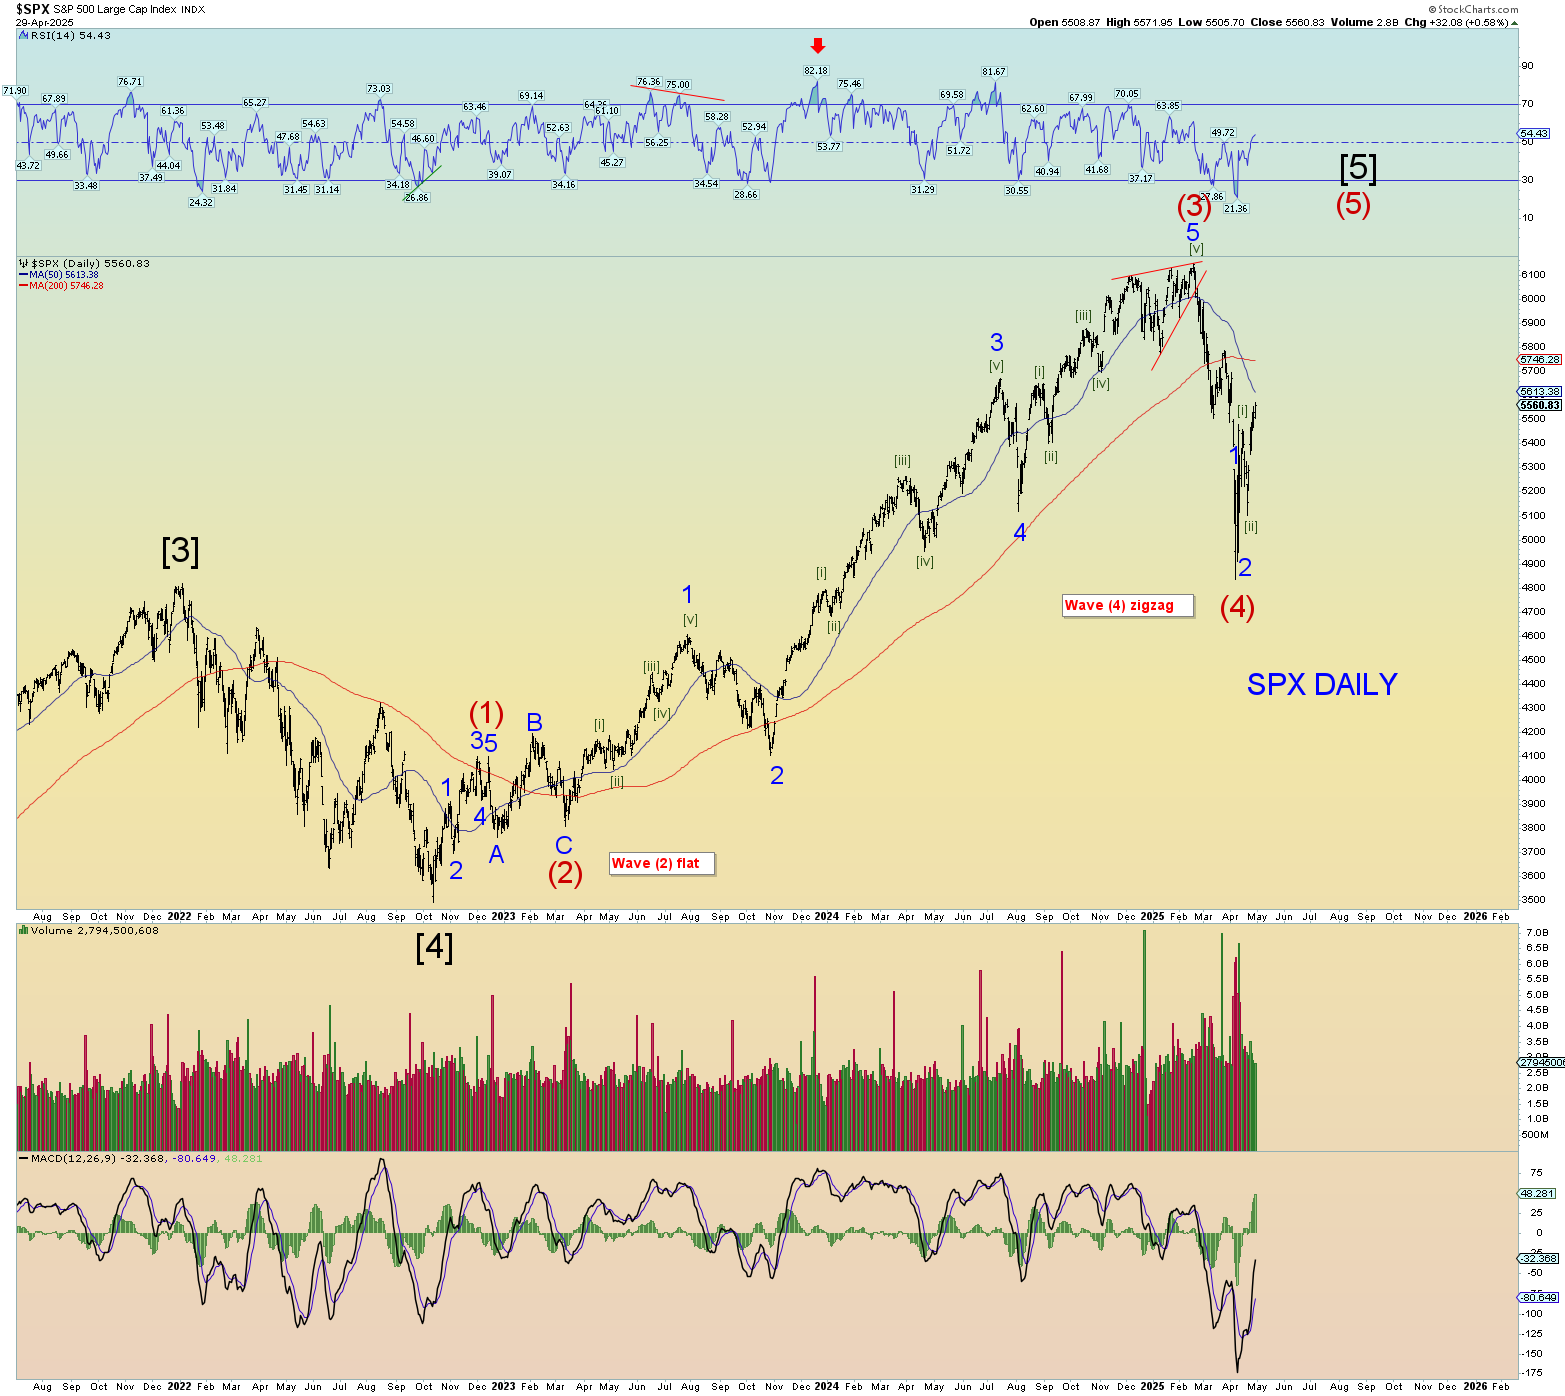
A “megaphone” type ending wave (5) of [5].
THE COUNT – THE BEARISH POTENTIAL
There is hope for the bears. But I think it needs to be based on 2 things at this stage:
A “reverse” Zweig breadth thrust event – a negative extreme event – would have to occur immediately in my opinion. And as luck has it, the market is exactly setup from yesterday’s data for this to possibly occur. Note the breadth thrust chart again (see above). Yesterday’s close (Monday – 28 April) was elevated back again ABOVE the key marker of .615. It closed at .616. The 28th of April would be DAY 0. Trading Day 10 would be the 12th of May. IF the breadth closes beneath .40 again within that time frame, we can consider the “positive” event to be reversed, and a negative extreme event has overridden things. Thats my theory anyway.
THE BEARISH COUNT
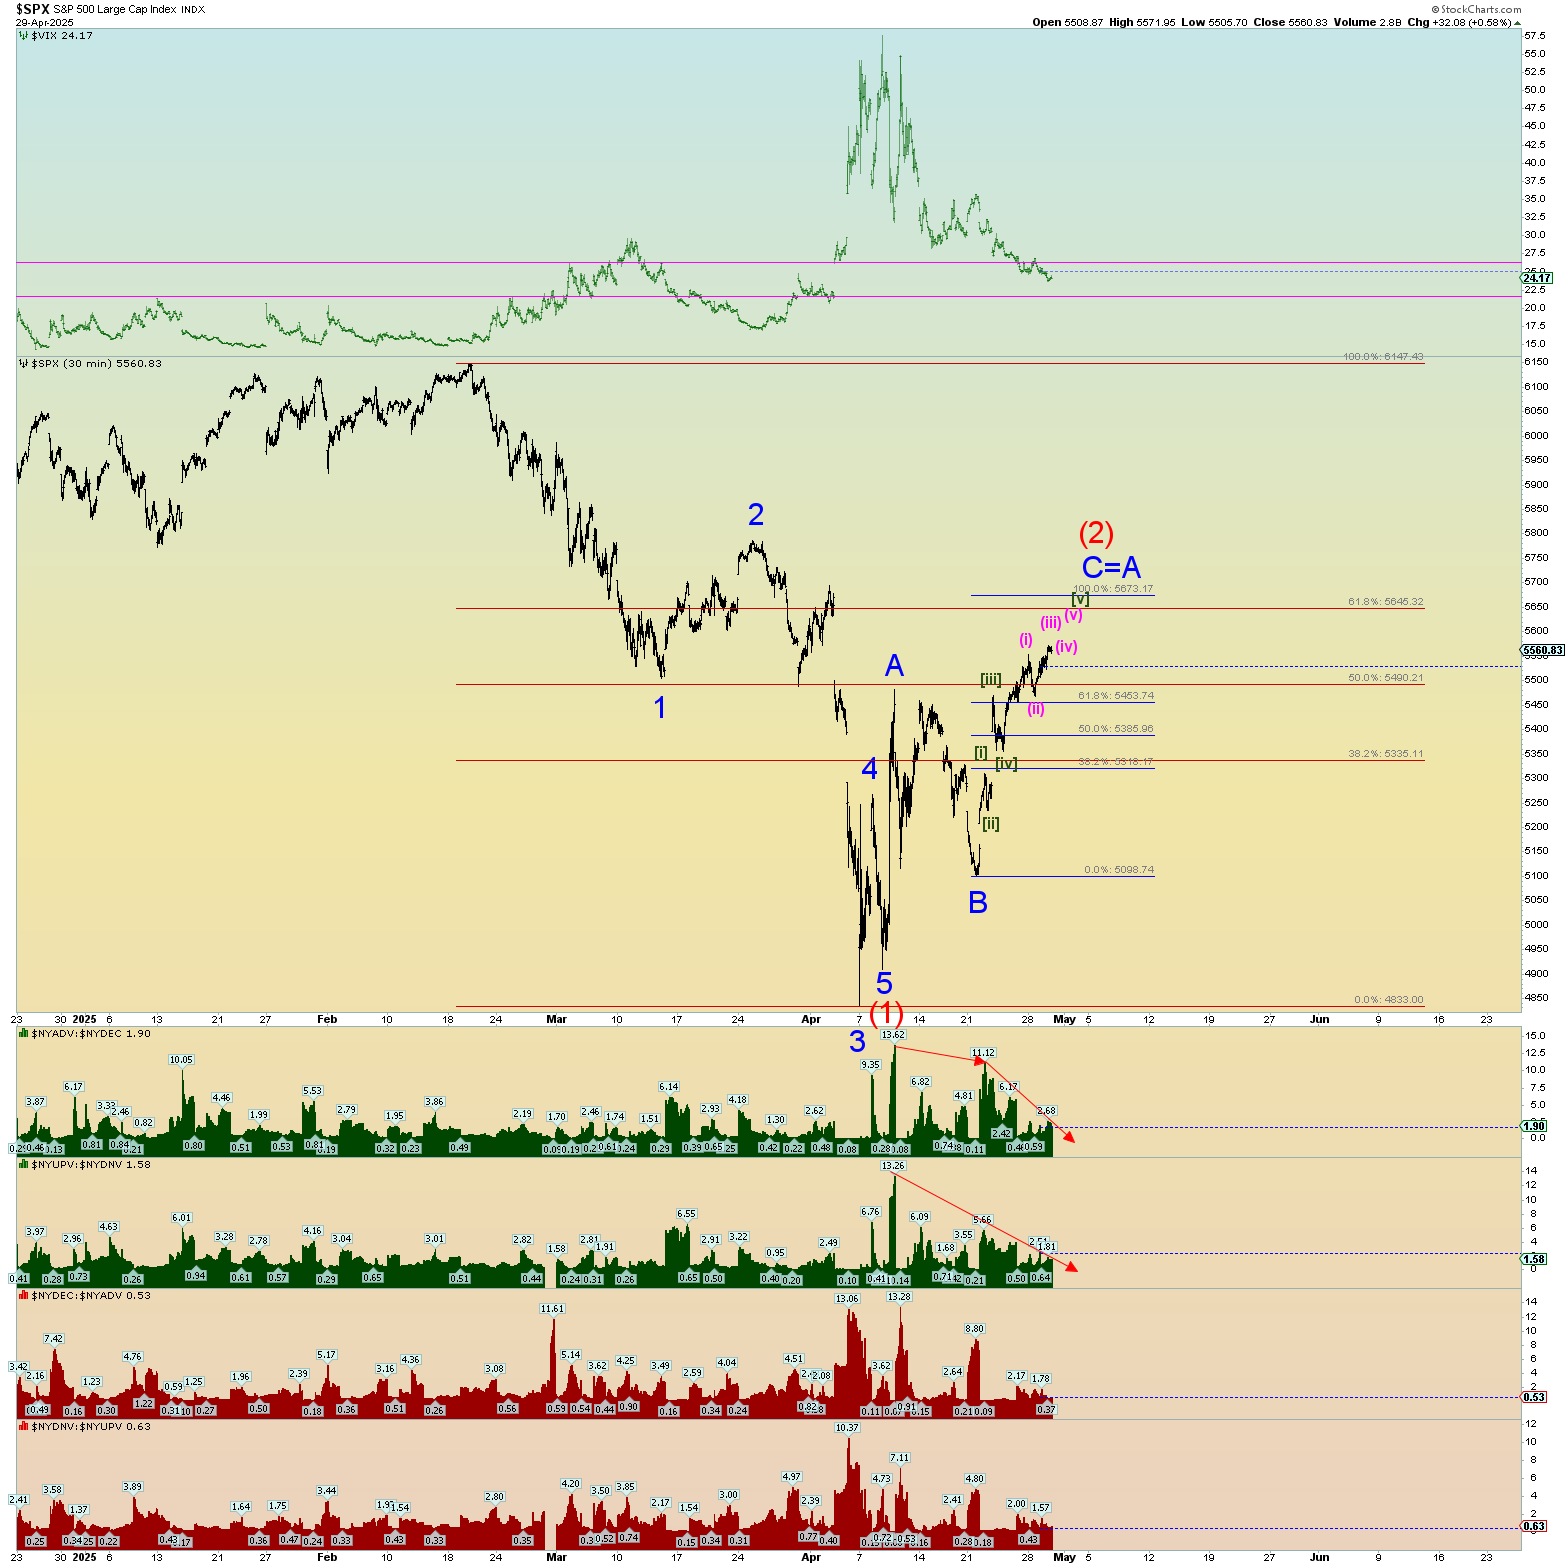
This would be the idea that a quick “truncation” occurred a few weeks back and that wave 5 of (1) down failed to make a new price low but came within 1.4% of doing so. These violent moves are largely a matter of extreme overnight futures that result in over-violent, yet quick opening market moves. Simply put, wave 3 down – the spike low – is a result of market violence at the open. (And the other massive distorted open chart gaps we see)
If that’s the case, the move back up since that truncated wave 5 of (1) low can be counted as a big simple A-B-C zigzag that is close to completion. Note that C=A at the top of the still half-open monster gap down. As I said many weeks ago, the market likes to resolve these futures-induced market opening chart gap distortions. Prices have rebounded well into the gap.
CONCLUSION:
I’m certainly not against this bearish count. The bullish count – the megaphone – still looks and feels wrong. And maybe it is. But it is hard to go against a very rare NYSE thrust event that has occurred. Again, the bear’s hope is that this is just a wave (2) and that the reason no true panic has occurred yet (based on CPCE) is because there is so much more terrible bear moves to come in a wave (3) event that takes prices eventually far below SPX 4800. And that would be exciting, wouldn’t it? We have the next 9 trading days to find out.
Some other technical to note: A) the declining trend of up volume and advancers vs. decliners. B) there are 7 small waves up from “B” of (2). It just looks like it’s starting to limp over. C) This is a great stopping point area for wave (2). We have price retrace into the previous sub wave 2 of (1). We are between Fibonacci 50 – 61.8% (a healthy retrace). The VIX is filling its huge gap also (see the pink gap markers).
The next few days should be interesting.