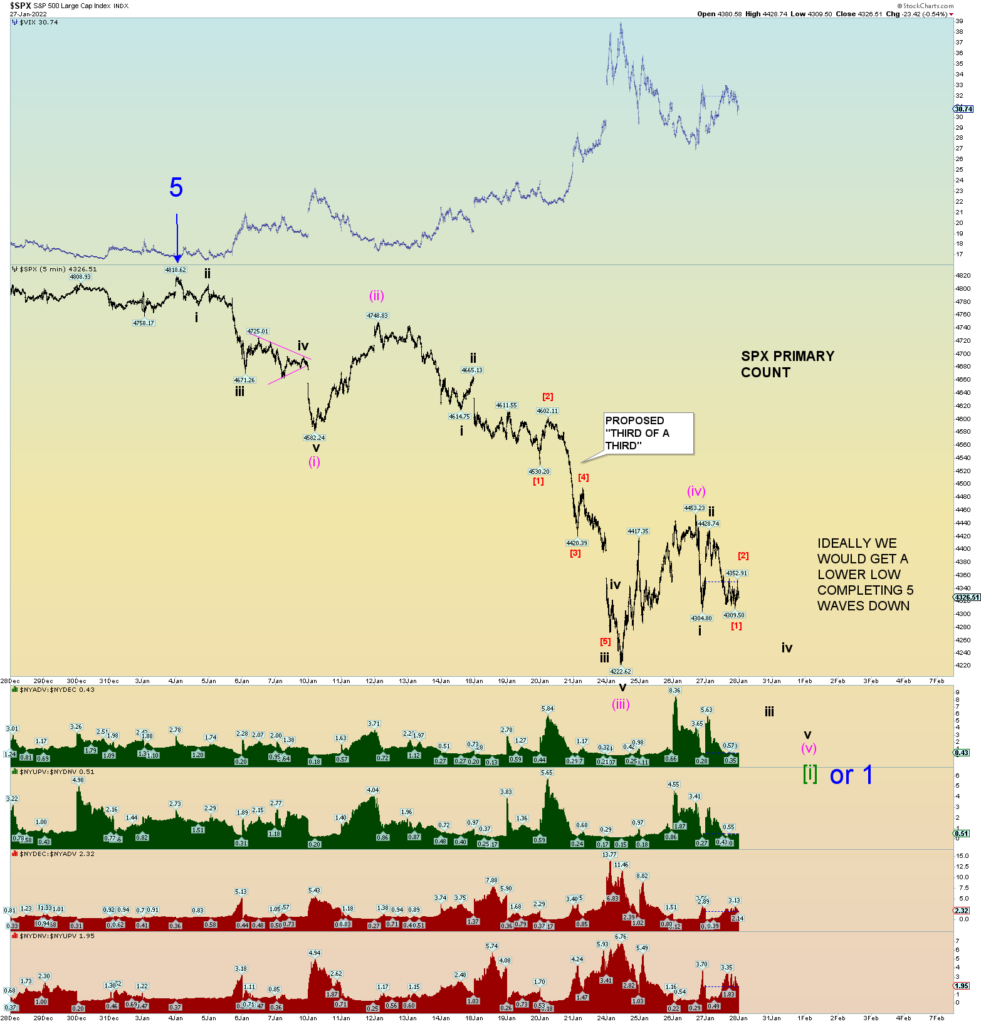
The primary count is that the market is working lower to form an overall initial impulse 5 wave count. The SPX is the best index for illustrative purposes. It has a very different starting peak than the Wilshire 5000.

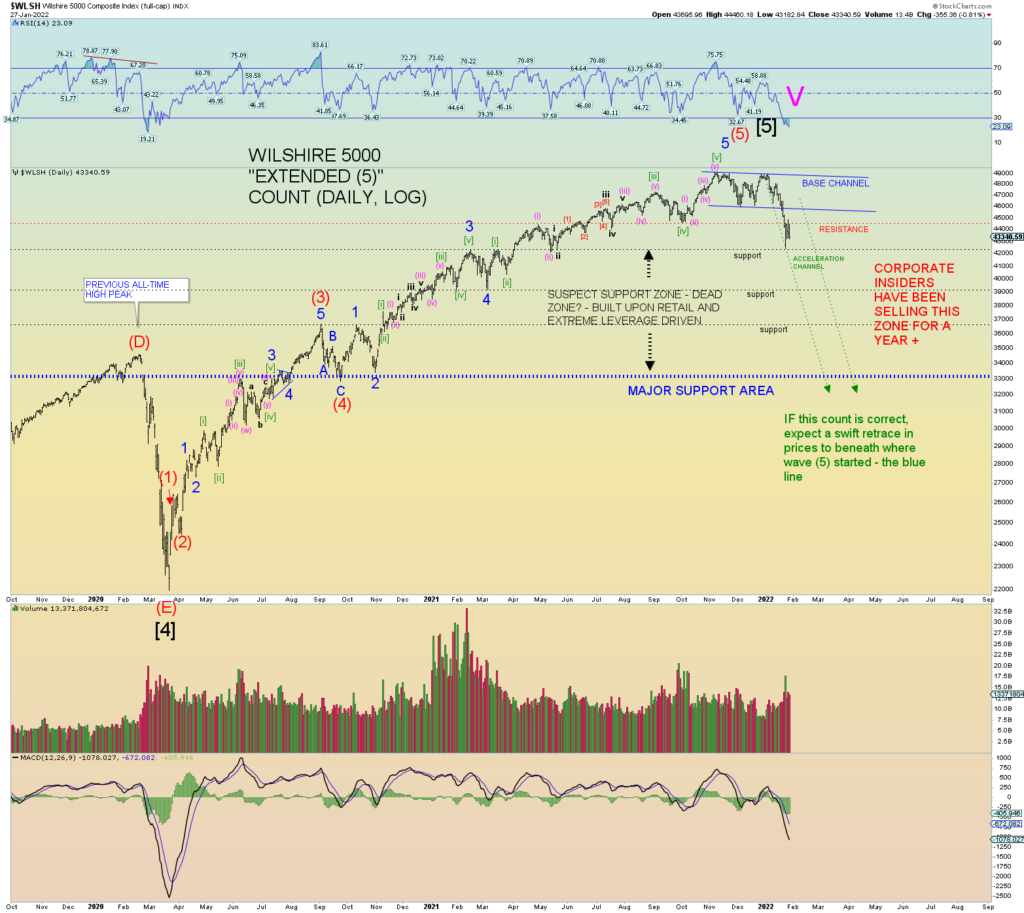
Overall, for the Wilshire 5000, the bigger picture projected for the next few months is a collapse in prices. The theory is that if Intermediate red wave (5) was indeed an extended, ridiculous wave structure built on leverage and retail buying, the pattern predicts that a swift retrace of prices to beneath where wave (5) started would be the next wave structure (which has begun). This following chart shows that potential.
The green down channel represents the acceleration channel of a wave 3 down move. For now, I painted it wide to give the benefit of the doubt for the market as there may be a more violent bounce than so far has happened. Note how the collapse in March/April 2020 was also very steep and (even more) narrow. It is an example of how fast the market can move to the downside. I am not making any predictions for now other than we have to rely on the wave structures as it goes.
However, as I said, if the market was in an extended (5), expect a swift collapse in prices. It would be an approximate 33% down move from absolute peak for the first Intermediate wave (1) down. Wave (5) up was built exclusively on retail and extreme market leverage so extreme leverage works the same in reverse and usually way more deadly. Again, note the steep, fast 2020 collapse in prices which everyone has forgotten apparently. Therefore wave (1) down will basically be a retrace of wave (5) up and a little more for good measure. That’s the theory anyway.

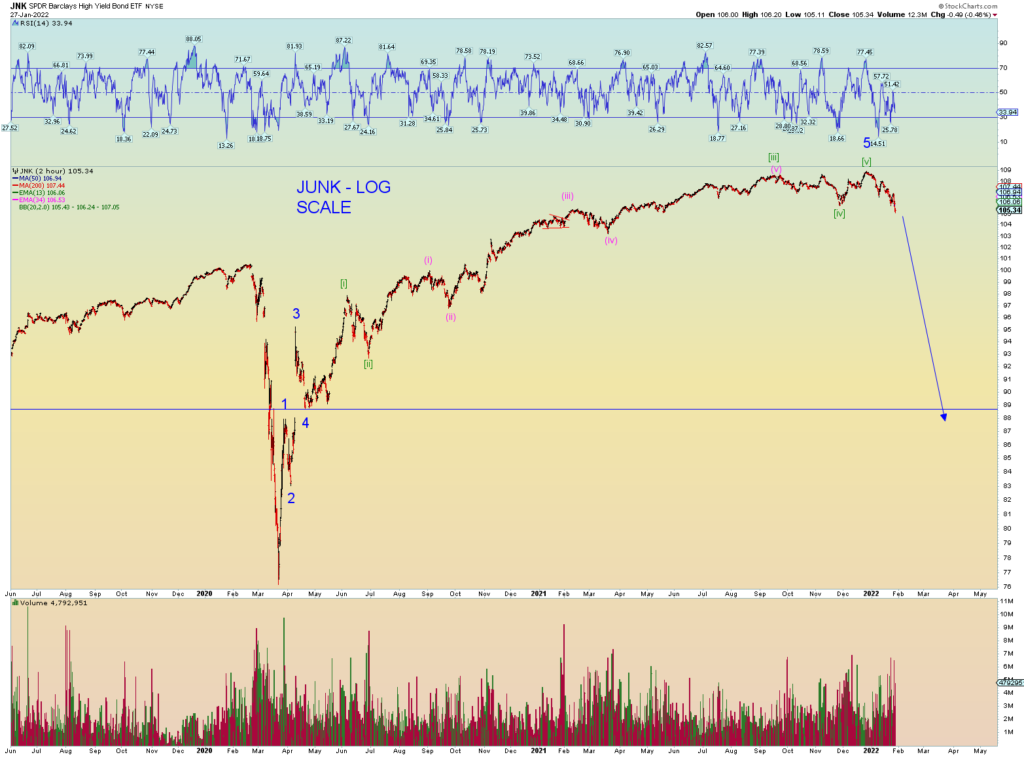
I would expect JUNK to lose quite a bit also.
