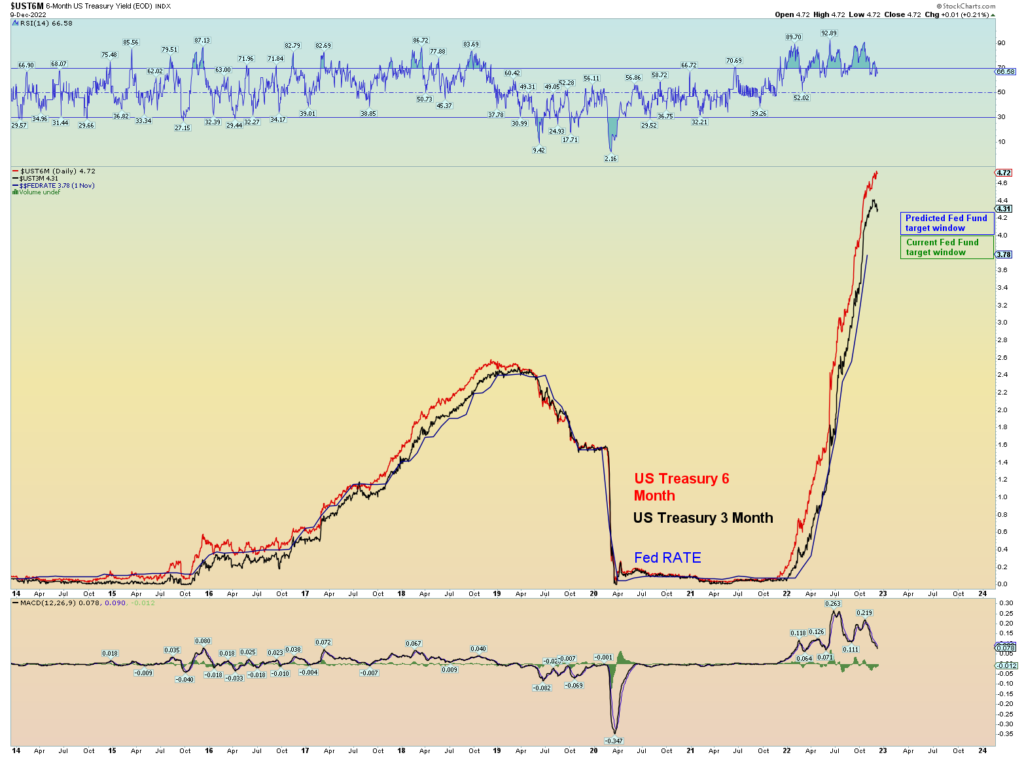
The 3/6-month Treasury bill rates are indicating that next week’s rate hike will only be 1/4 point. The Fed has been very consistent to keep its top range beneath the yield of the 3-month rate.
Unless the 3-month surges some more, expect a 1/4-point hike setting the top of the Fed Fund rate range at 4.25%, not 4.50% as was expected for many weeks.
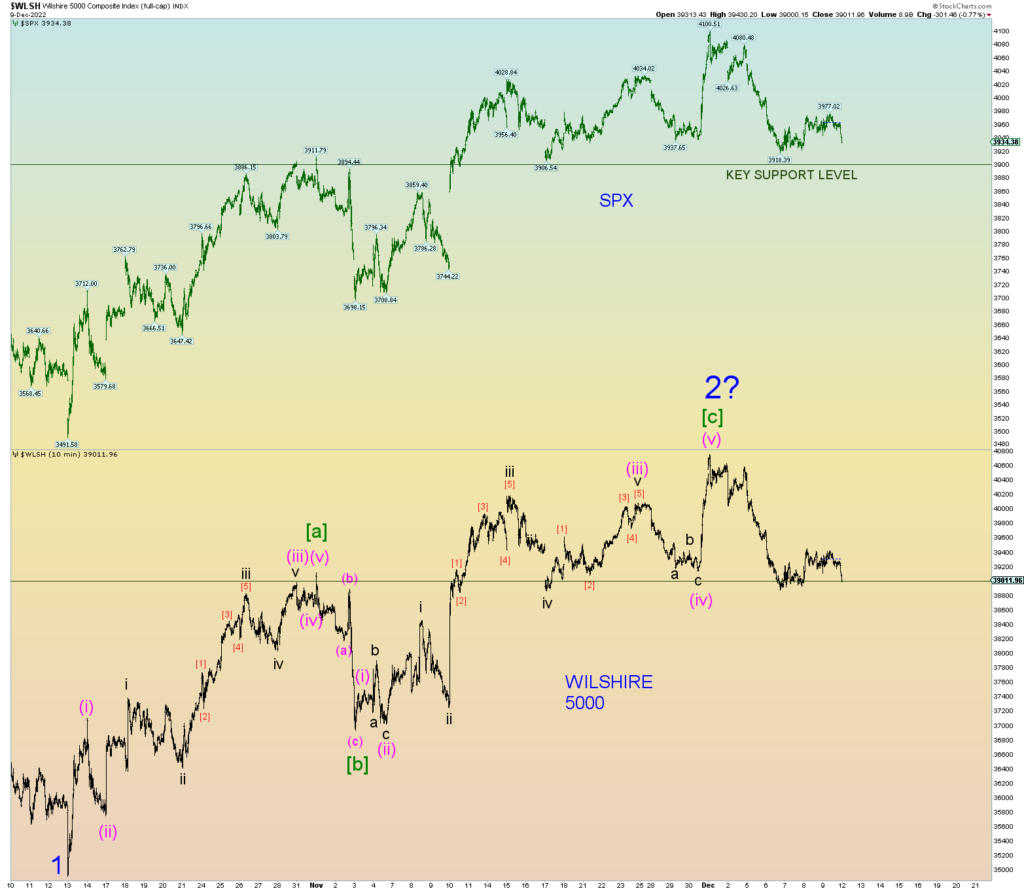
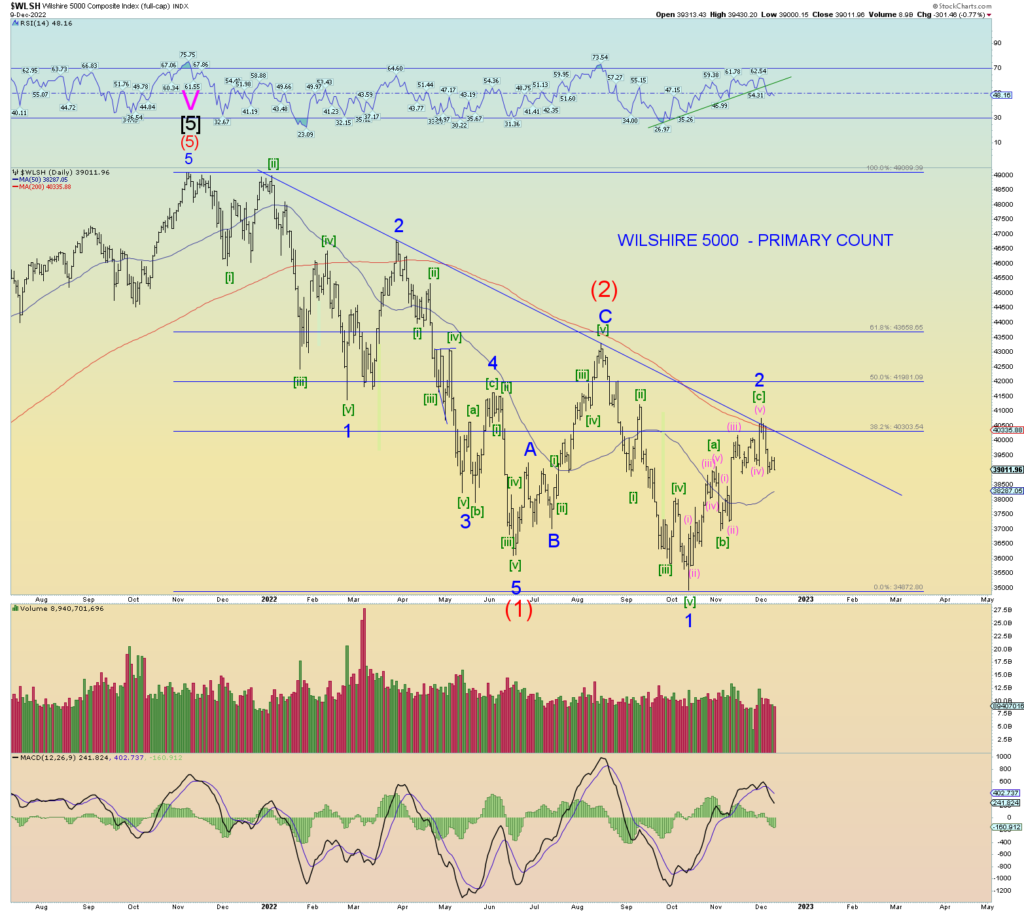
The short-term squiggles seem to indicate the market needs a lower low to confirm a nice 5 wave impulse move lower. At the end of day, the market seems to be indicating that will be accomplished come Monday. We shall see. We have support at 3900 on the SPX and 39,000 on the Wilshire 5000.
3,900 and 39,000. Seems a convenient coincidence.
The pattern on the SPX/Wilshire is almost a textbook [a]-[b]-[c] 5-3-5 zigzag structure and [c] pretty much equals [a] in price. That is why it is called a “corrective” wave 2. We need a solid break of support to help confirm wave 2 is over and wave 3 of (3) down has commenced.
The uptrend RSI has been broken. The market is losing strength and momentum is waning.
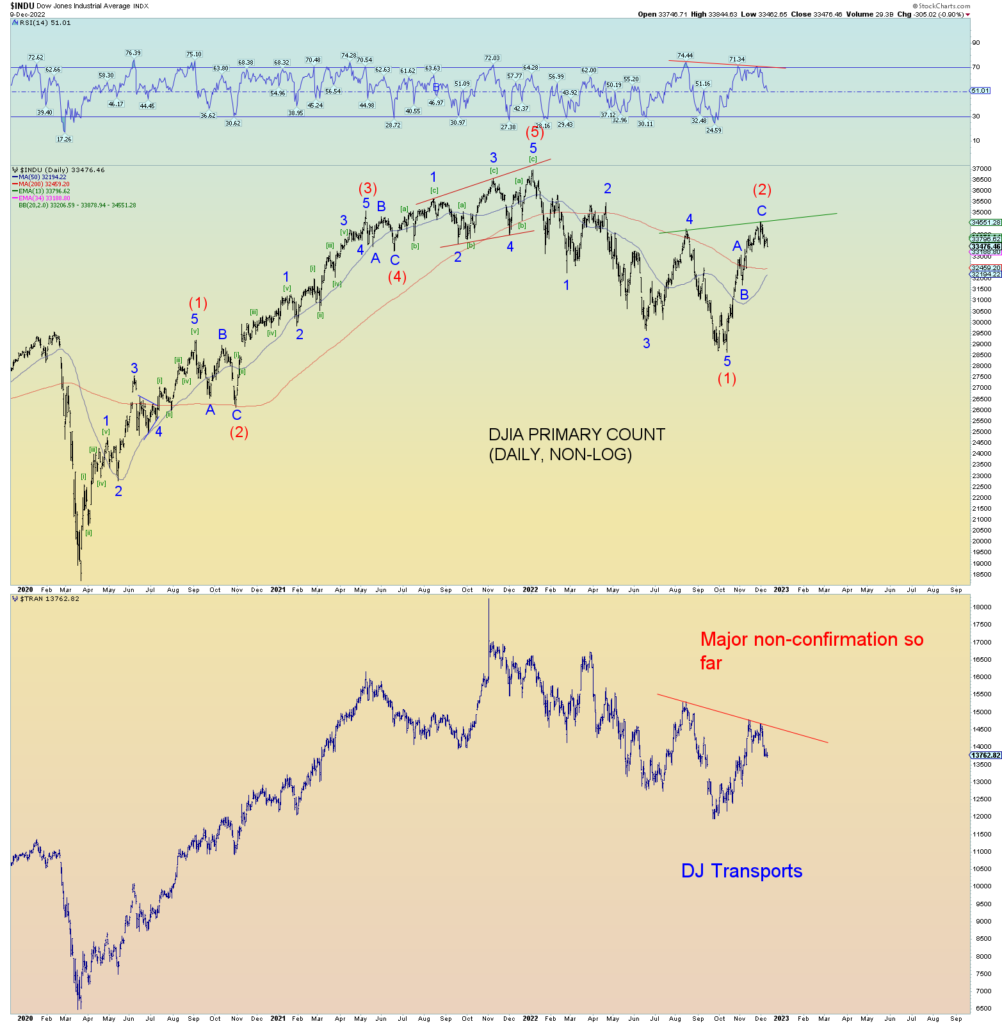
DOW Theory is flashing a bearish warning signal.
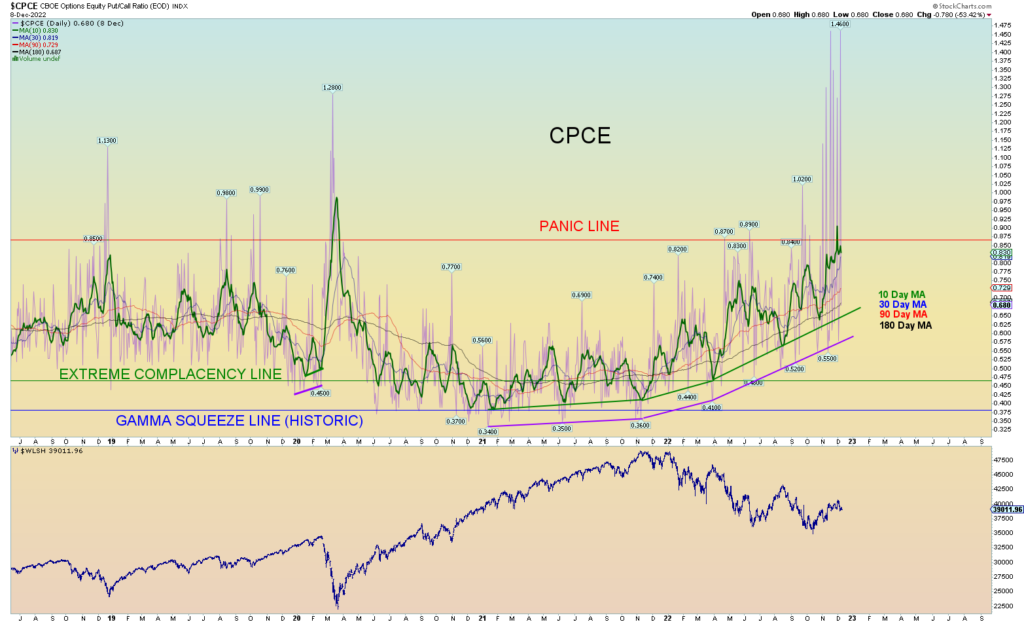
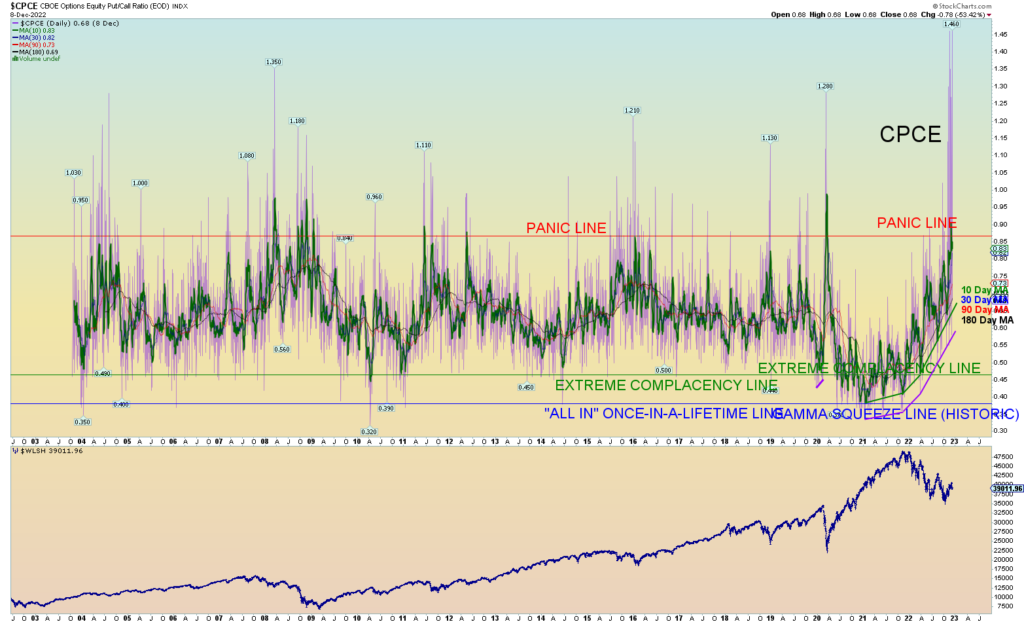
The wild extreme swings in the CPCE (the purple lines are the daily) reminds me of a seismograph reading of a huge earthquake. In this case, the earthquake – an outright collapse of the stock market in a nasty bearish wave 3 of (3) down – has yet to materialize. But the underlying warning signs are there. I can go back 20 years and not see this behavior.
