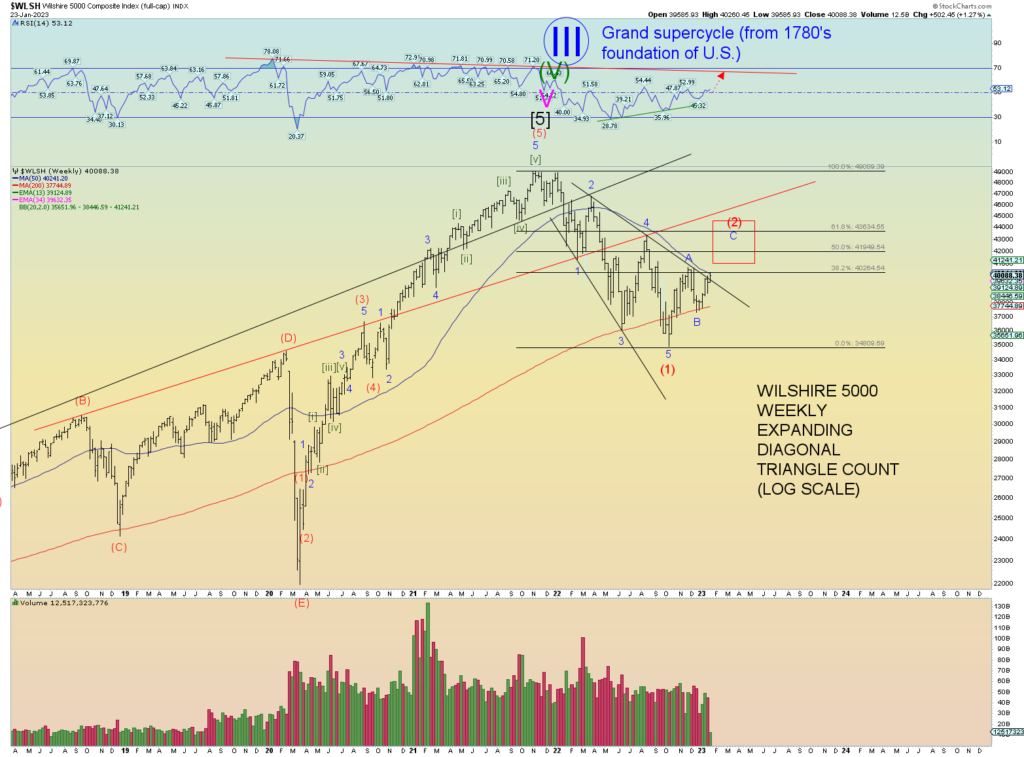
It seems likely the Wilshire 5000 is in Intermediate wave (2) up which has been our alternate count. If prices go above the December high where Minor A of (2) is marked, this will confirm the count.
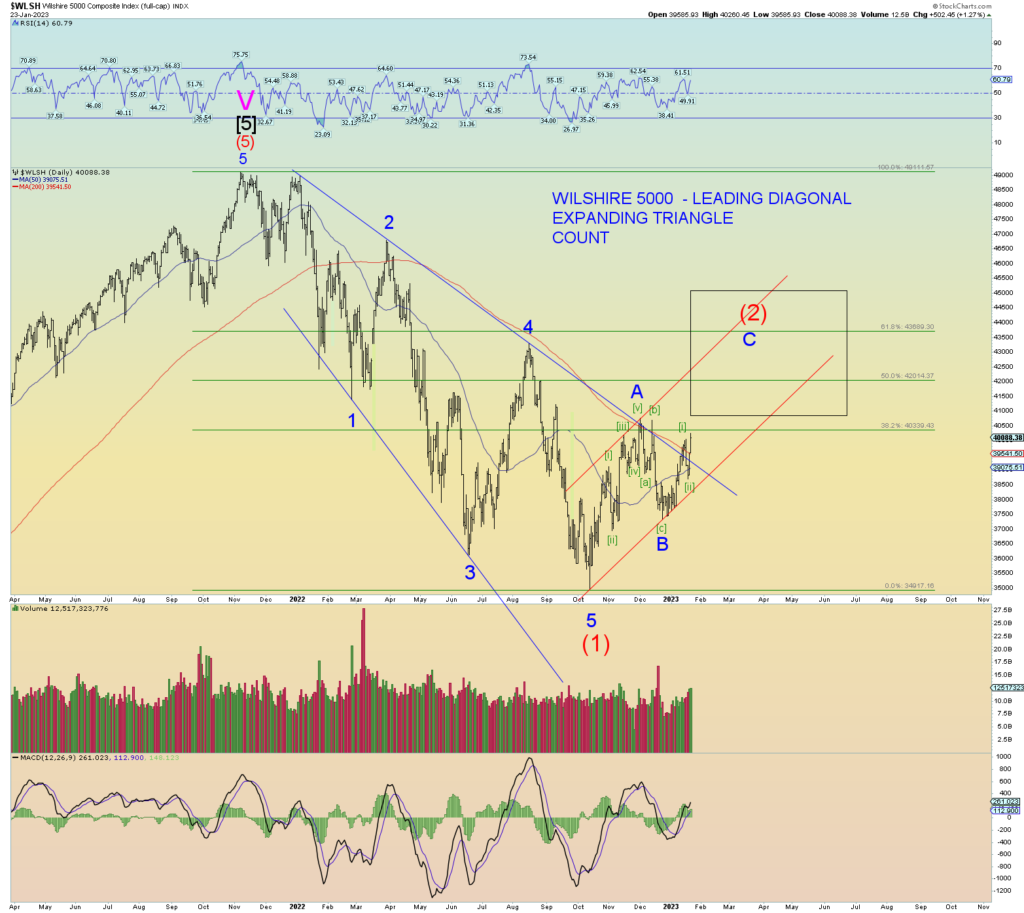
Prices have broken above the big down trendline from the peak of January 2022.
The big black box represents the target box. For now, we’ll assume an A-B-C simple zigzag will be the corrective form. If prices can move above “A” of (2) then likely Minor 4 of (1) peak will be challenged as the next resistance.
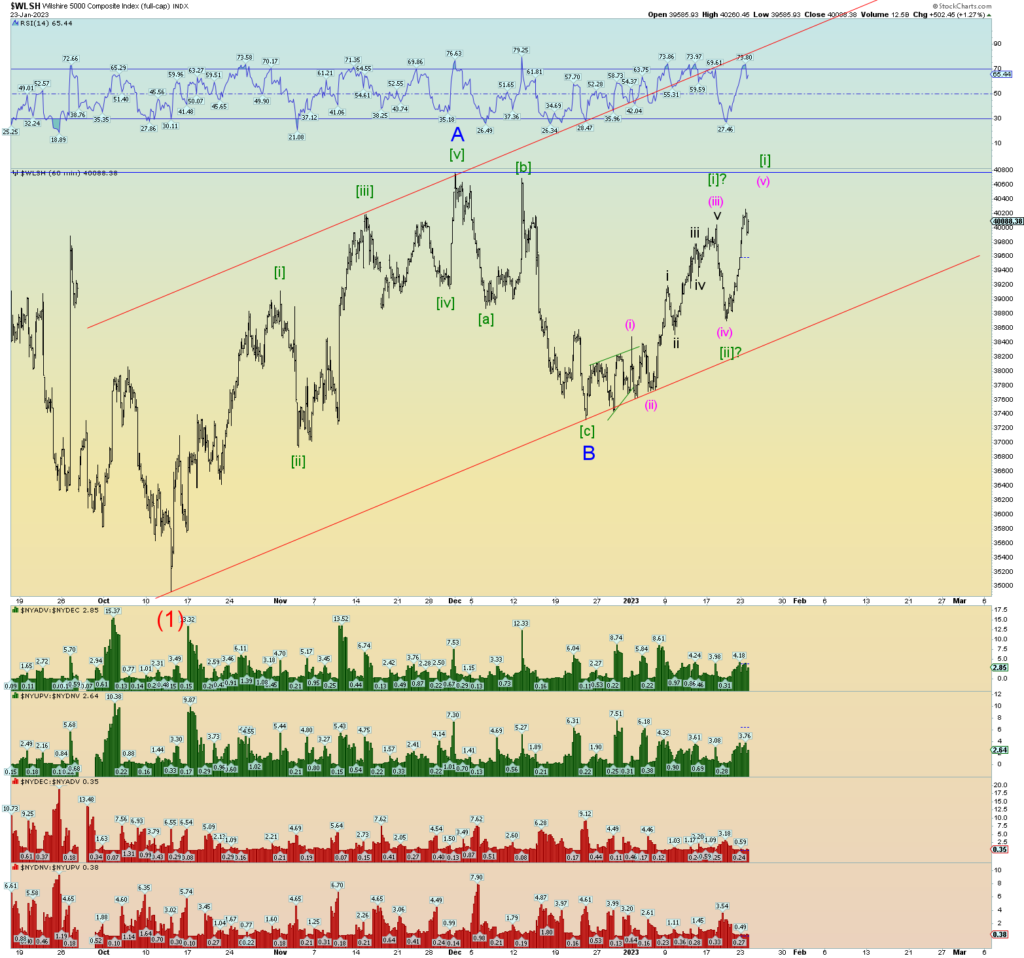
Possible squiggle count for wave C of (2). Looking to confirm the peak of wave [i] of C of (2). Perhaps it has already completed.
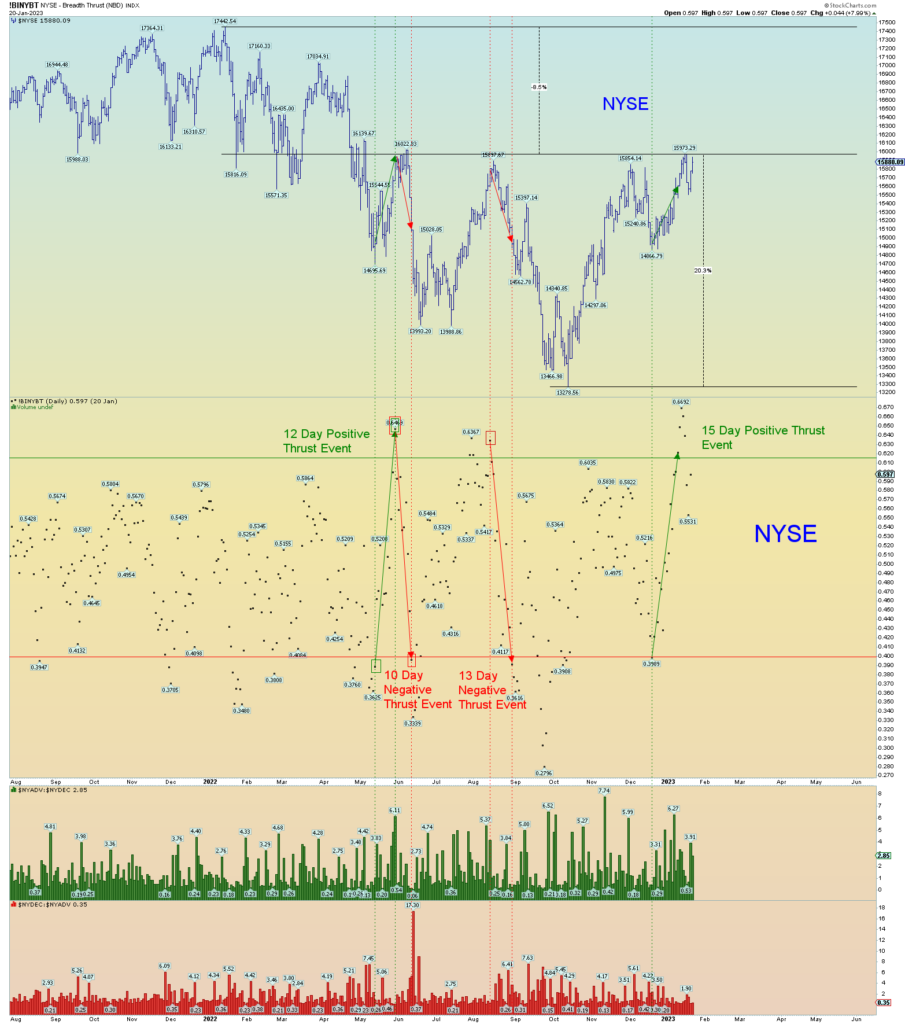
Of course, the NYSE has already broken above its December peak and the recent positive breadth thrust event seems to have some follow through.
It’s clear the Global Dow is in this count already. As is the DJIA.
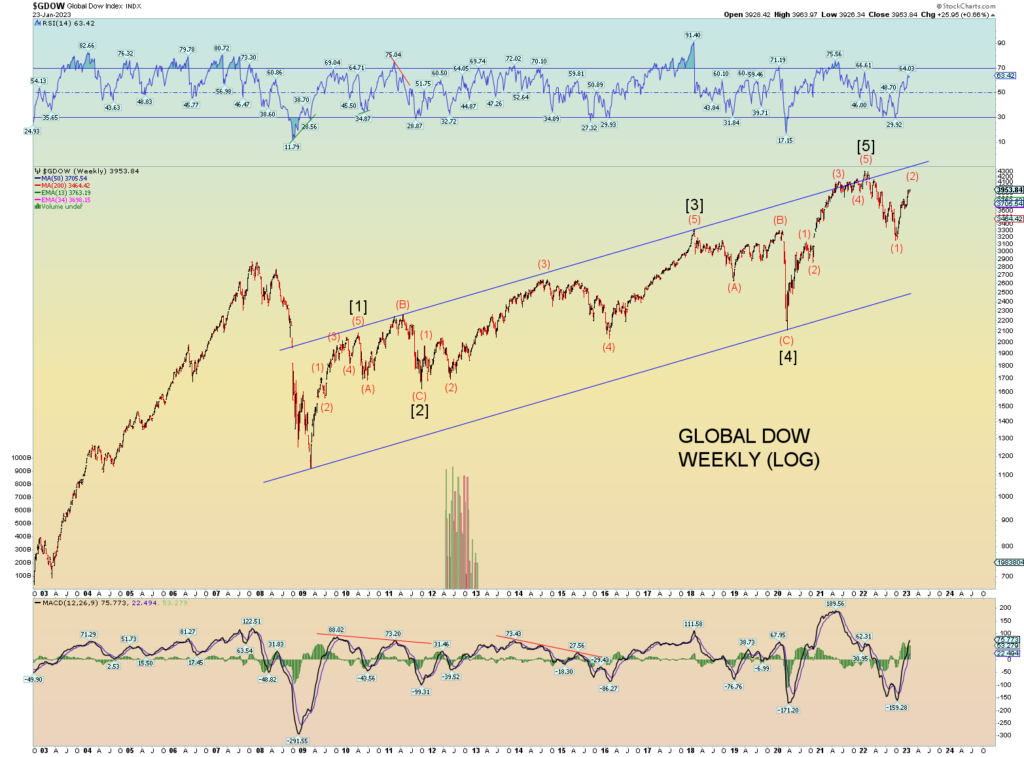
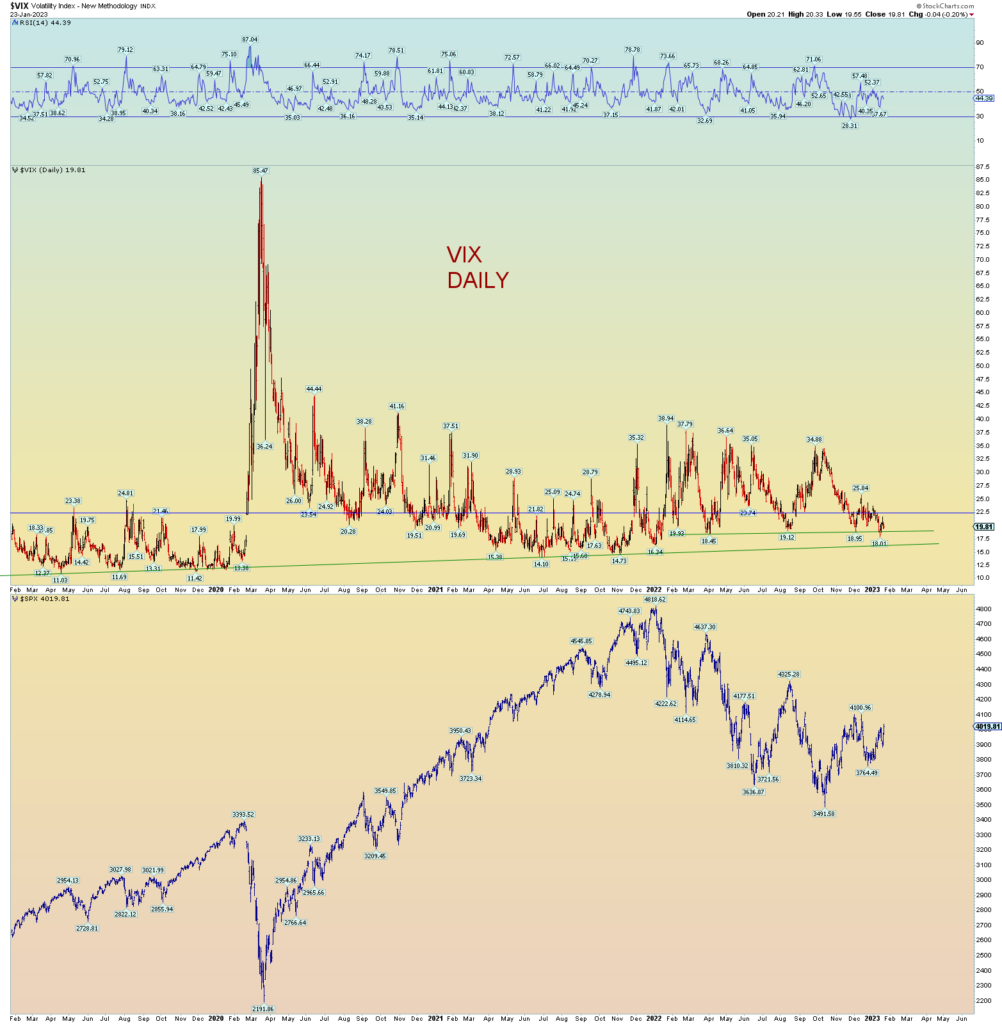
As the weekly shows, these are huge wave moves. If (1) down is correct, the size of (3) down will be ginormous and make the 2008 and 2020 collapse look like a picnic in the park. It’s actually exciting to see (2) take shape it would bring much clarity to the overall count.
