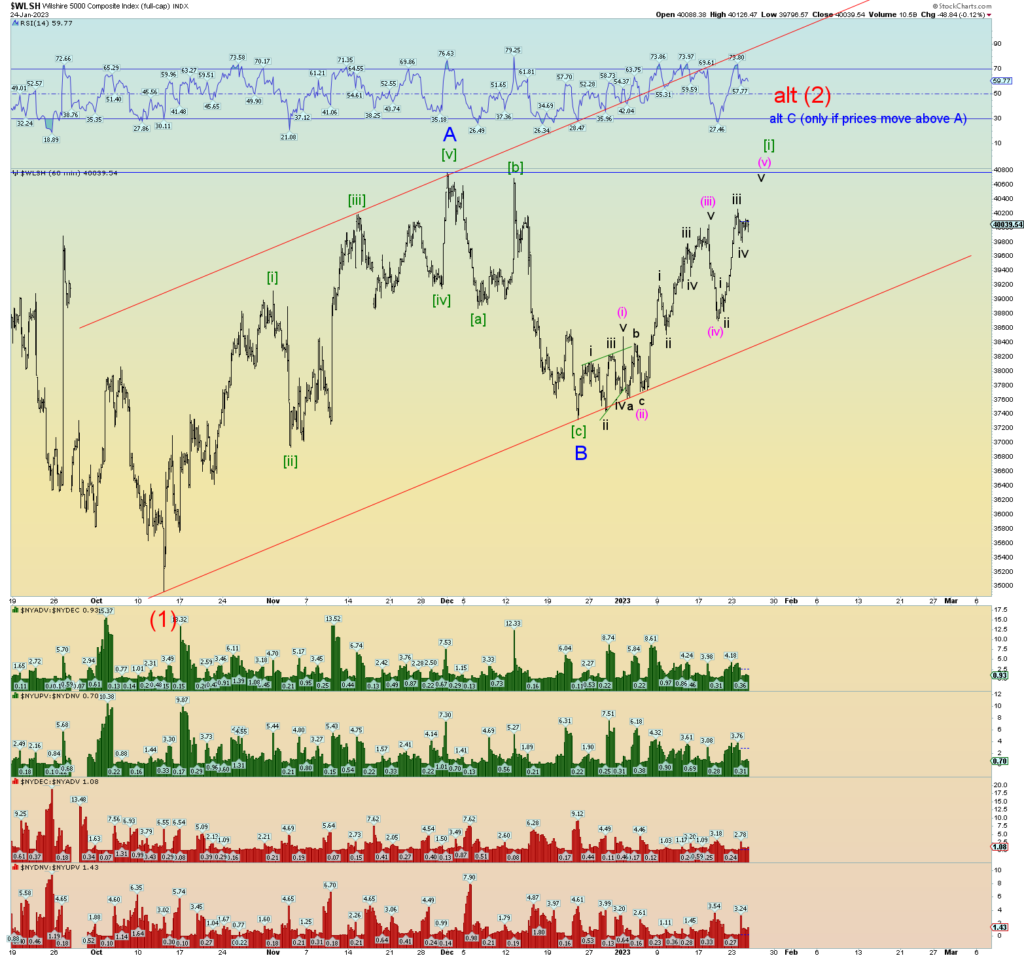
The best count has us looking to confirm the peak of Minute [i] of wave C of (2).
If prices can peak above wave A of (2) then possibly this entire rise from late December is all of wave C of (2). I throw this out there because it will count nicely as the second 5 waves of a 5-3-5 zigzag.

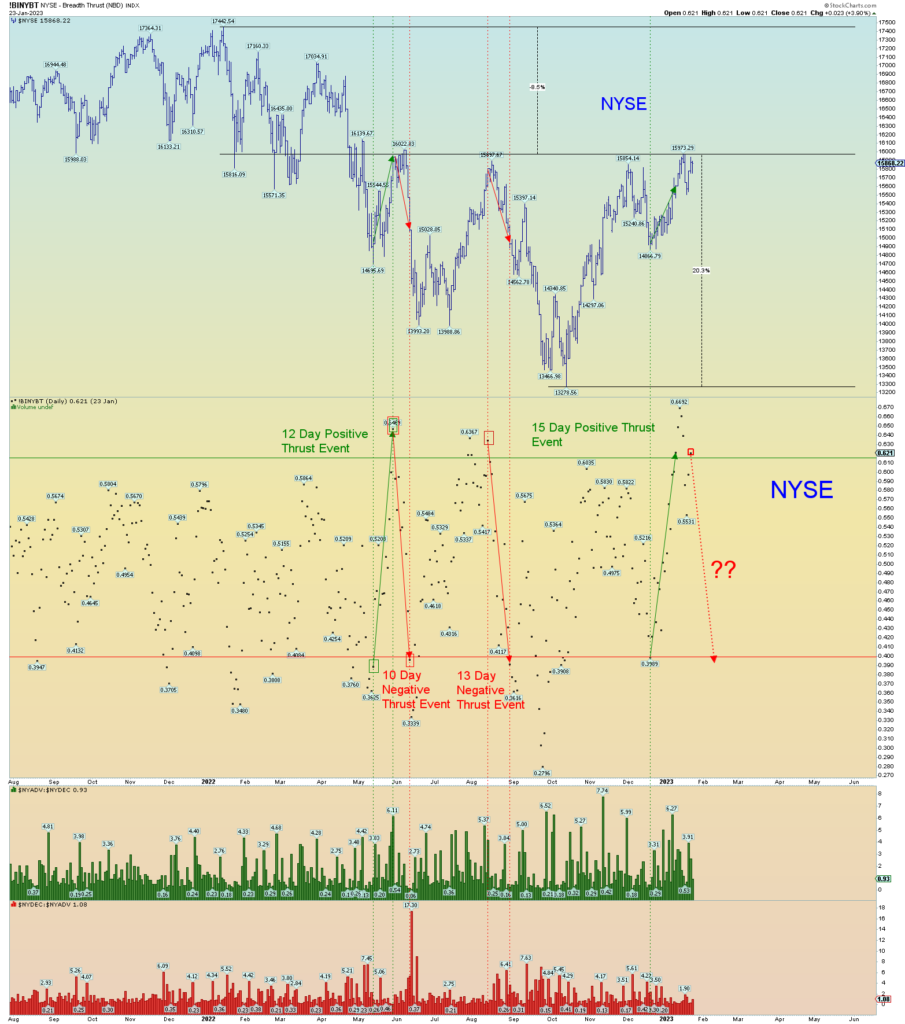
On the bearish side of things, yesterday’s NYSE data moved above the overbought thrust line of 61.5 again. If the most bearish wave count is to remain intact, prices would have to plunge immediately, and we would look for yet another negative price breadth event.
This market remains frustrating for the maximum number of participants. There has been a lot of short squeezing going on and the shorts have been shaken out somewhat.

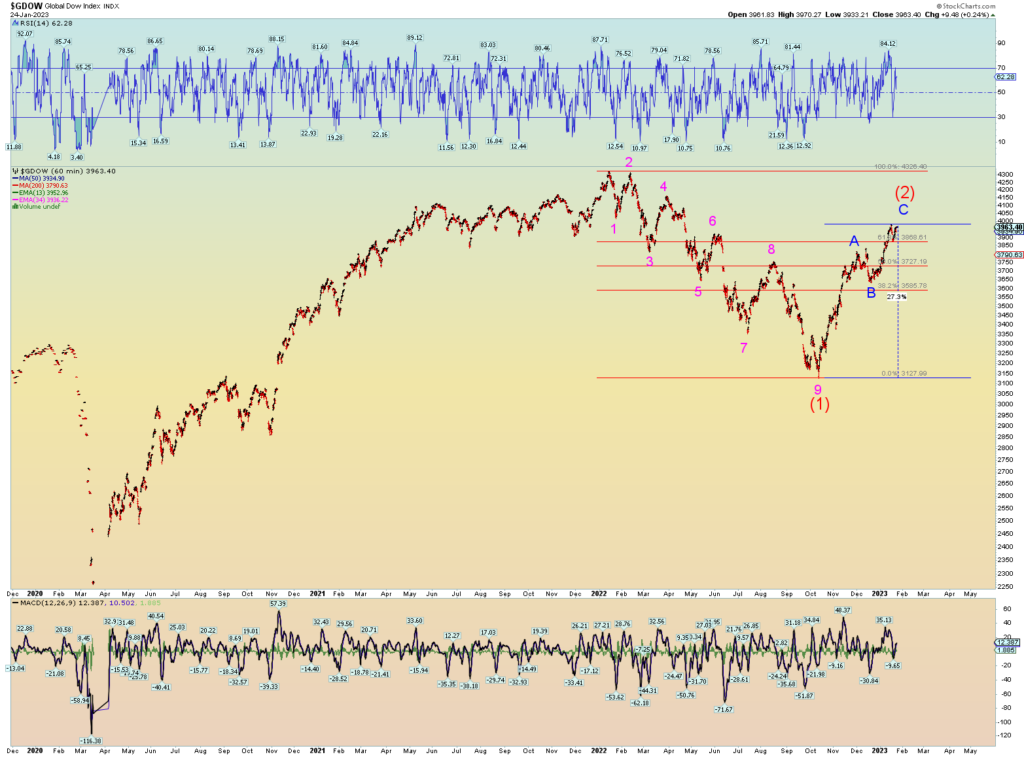
The Global DOW is actually in a bull market technically. After stair stepping a 38% drop, it has rallied over 27% back up in a very distinct and sharp zigzag pattern.
One could surmise that if the GDOW was to make eventual all-time highs again, it still has a lot of work cut out and would take the form of 5 waves up. I believe it is way overextended. And this chart gives the bears hope because all global stocks more or less rise and fall together except China which can sometimes operate much on its own.
People are still talking bear markets when actually globally this is not the case at all anymore. In fact, they missed the 27% rally. It’s probably the spot where strong hands will again start to turn things over to the weak hands.

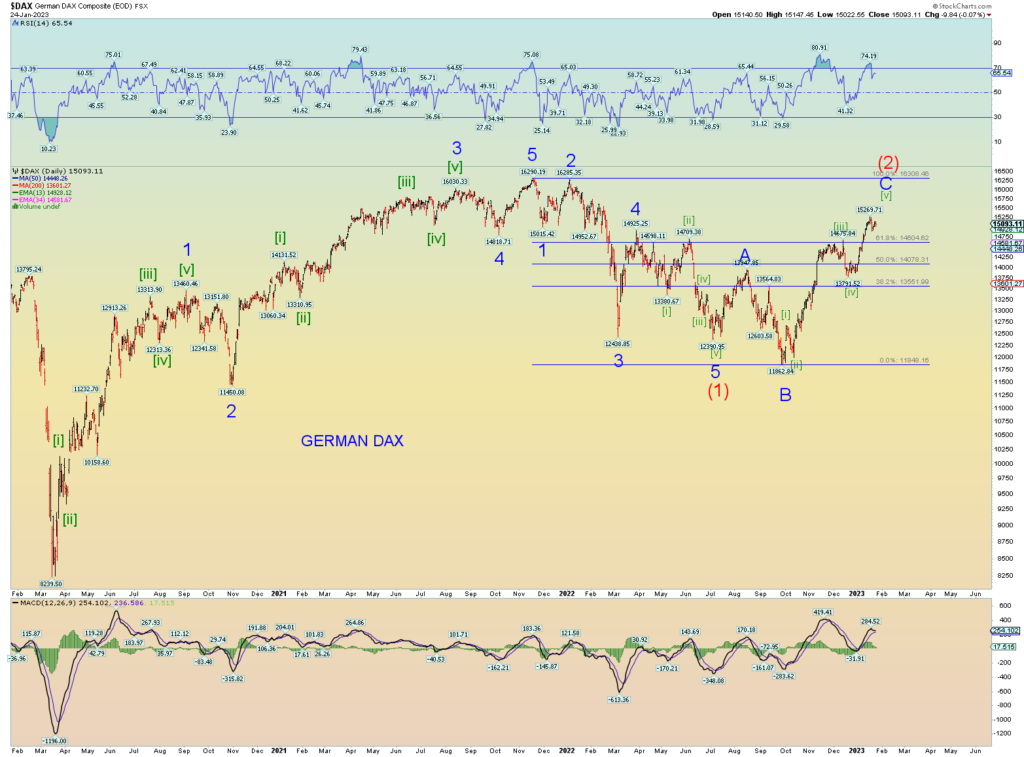
The German DAX is not a very countable market, but you can see it is not in a bear market.
