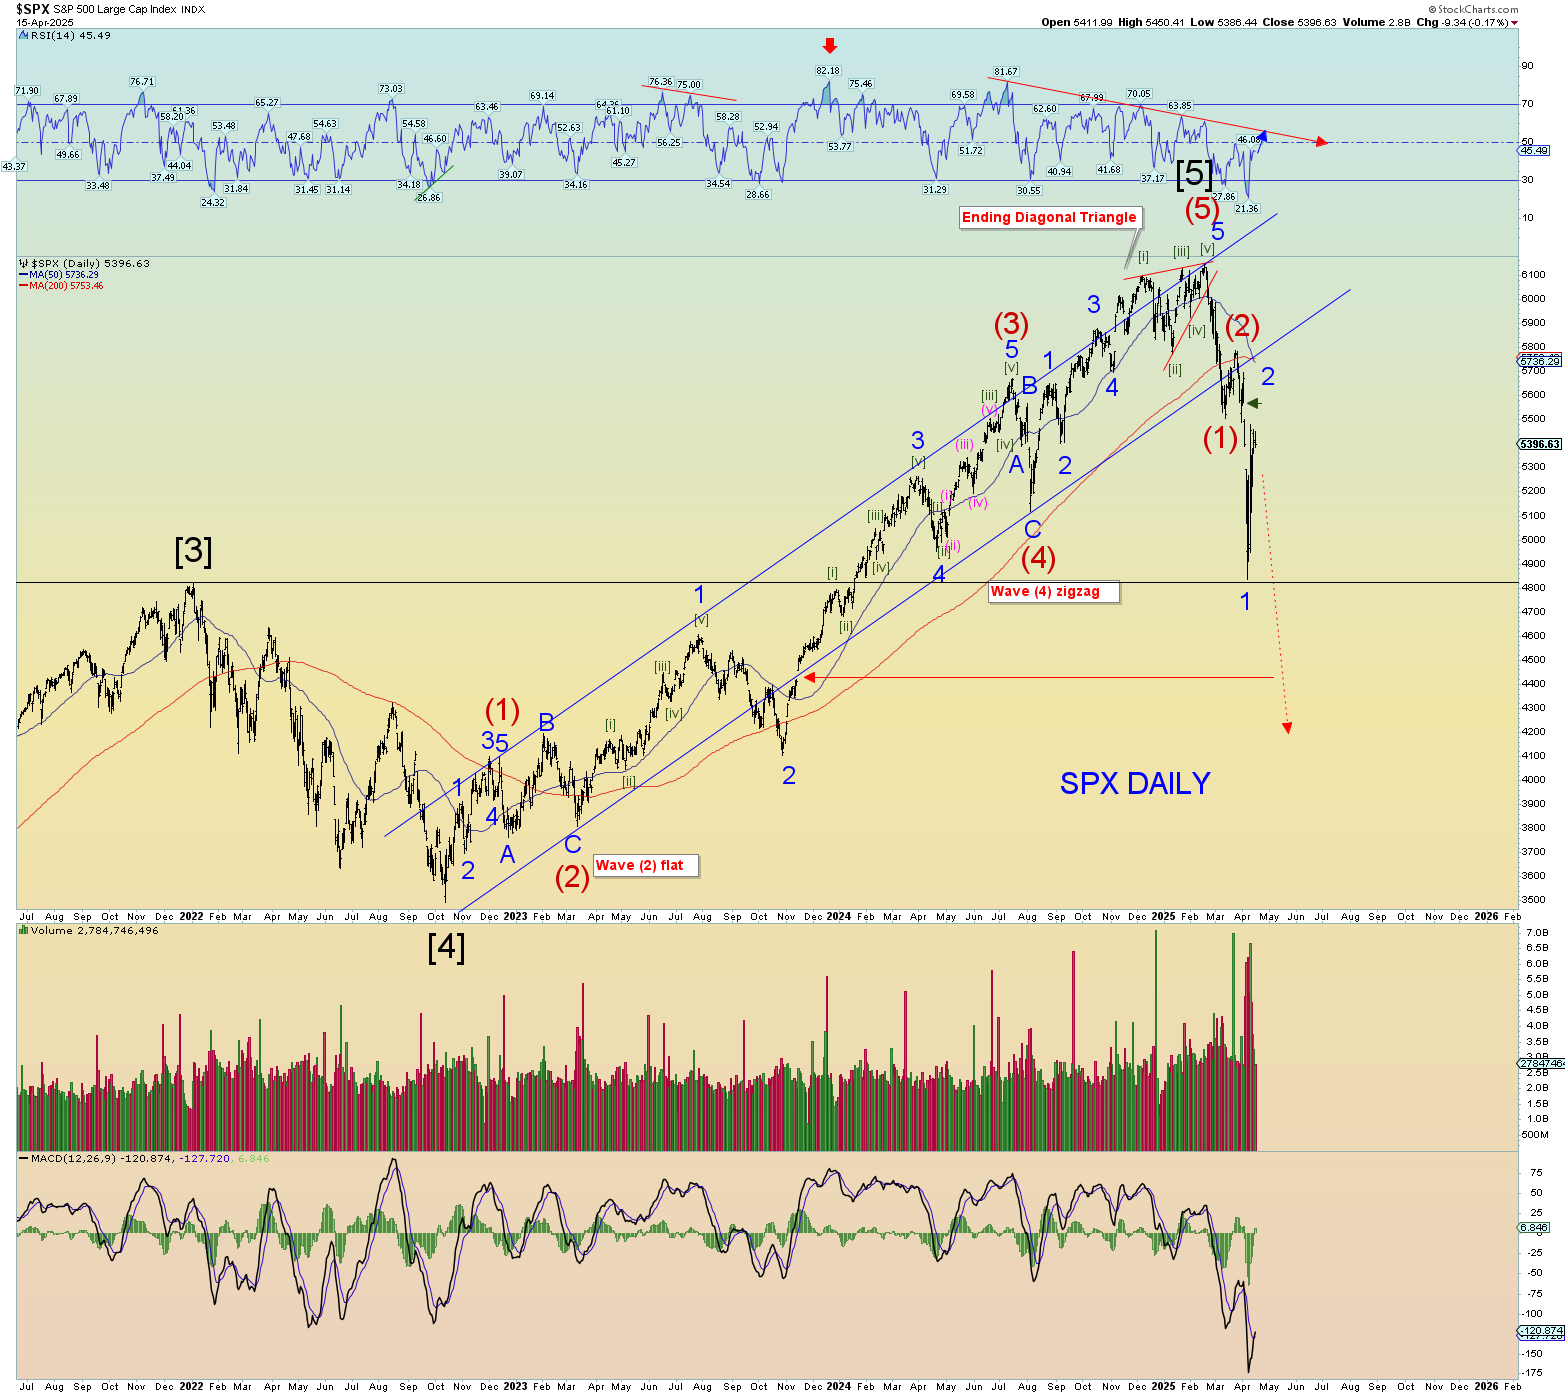
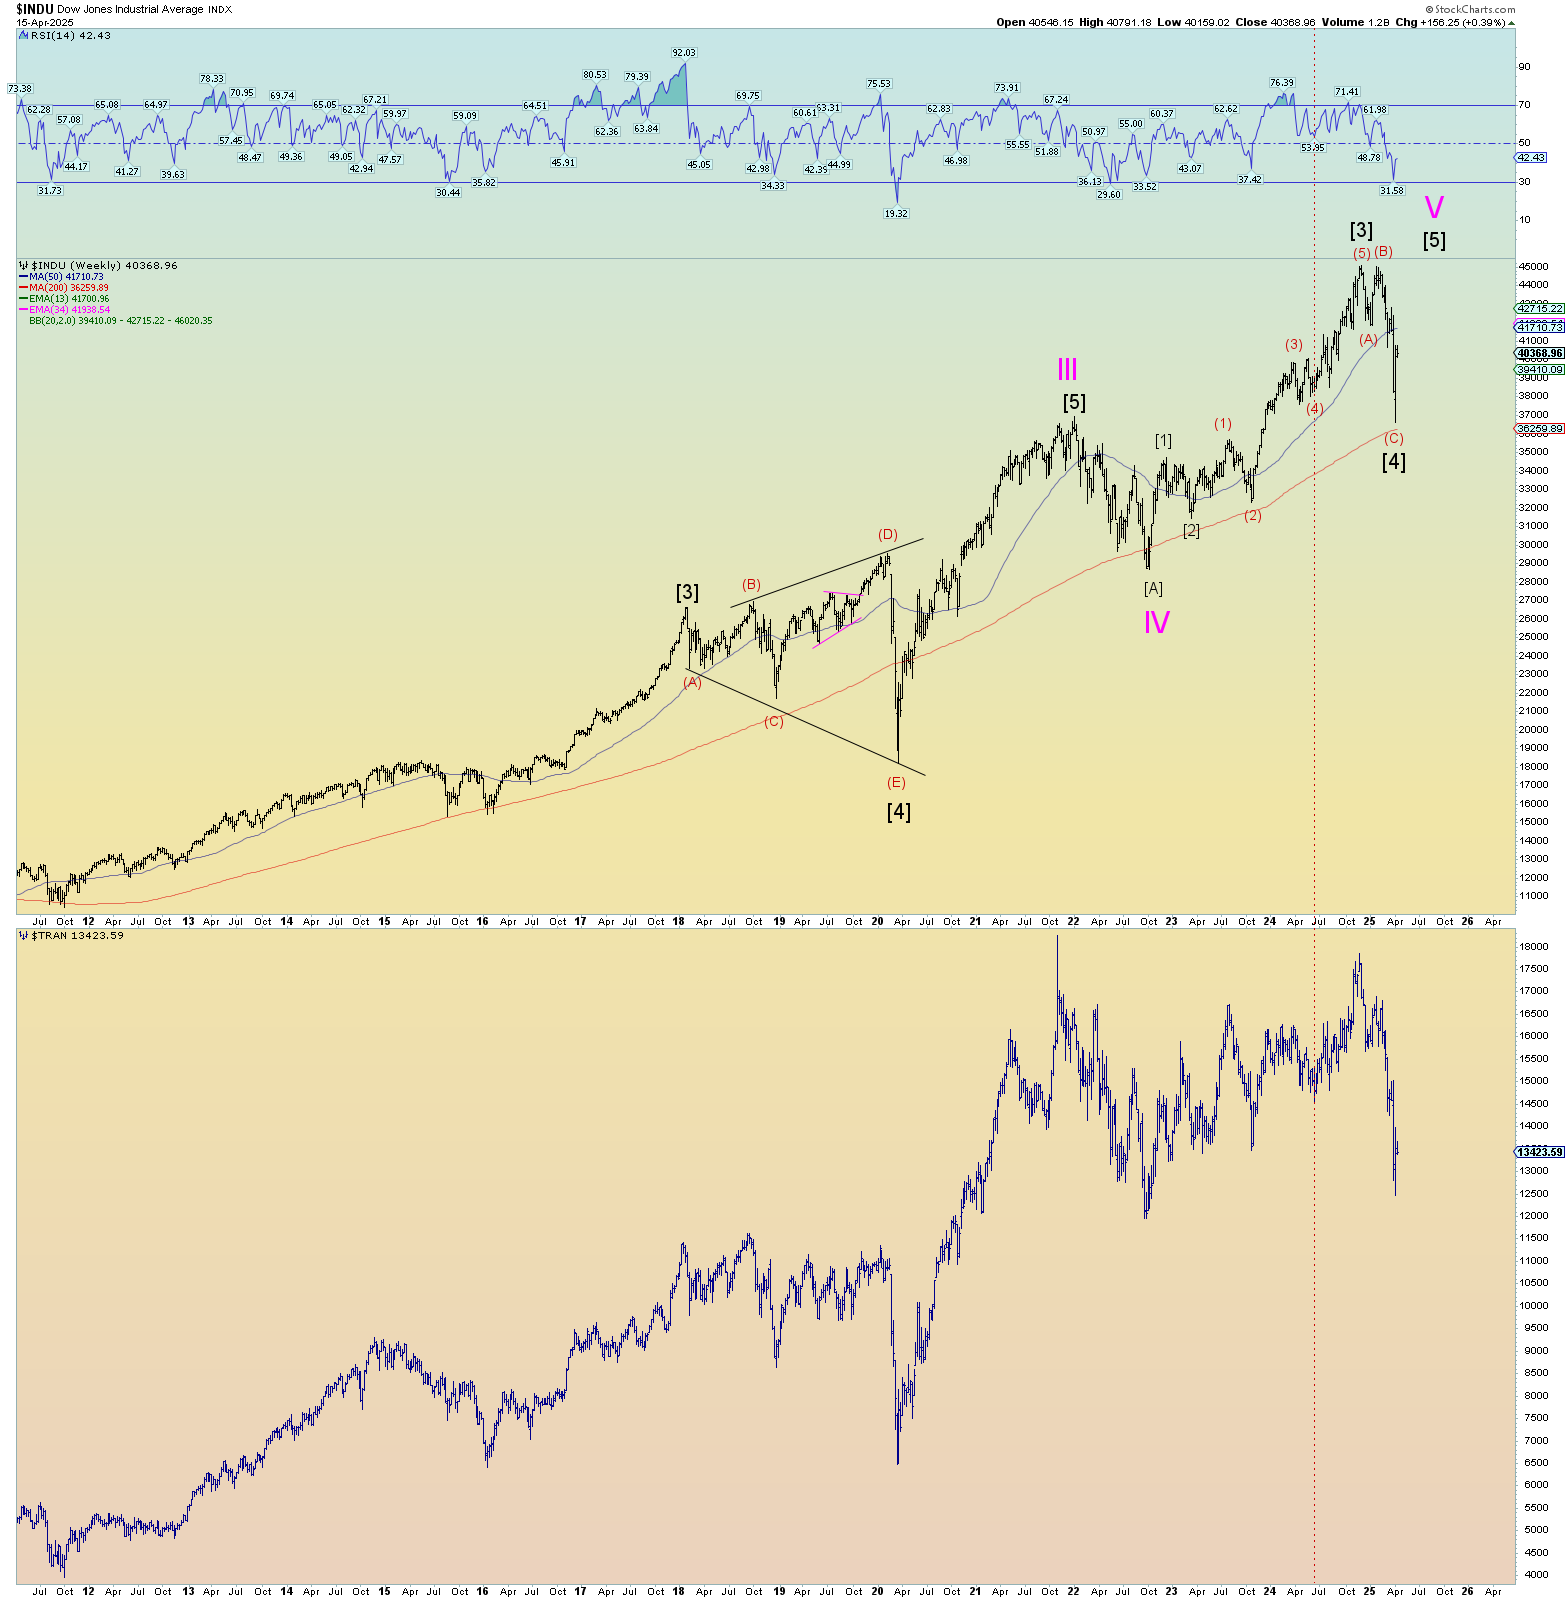
The ridiculously very large open chart down gap still exists just above the price point of today’s close. It would be a good place in the count to try and breach this open gap in the most bearish count of (1)-(2), 1 – 2. Please note that the market is still trading within the very large trading range created by the euphoric squeeze up to where pink wave (a) is currently labeled.
There are other possible counts. Perhaps the “tease” of breaking yet higher is just that and prices start drifting heavily lower to trade in the lower part of this massive trading range that was created in about 30 minutes time. I have no preference. I don’t really actually care to be honest. Break higher would be exciting, breaking lower would be a thrill. Let’s let the market tell us if we are a massive 3 wave down from peak or something more sinister such as a massive impulse is happening. Fun times!
This is the bullish chart but it’s kind of boring, yes? A slog back up to new all-time peaks. As if we haven’t seen that song and dance before. Whatever. See the slog of post 2020 Covid collapse? It took months to break to higher highs again, but it did. Again, if that’s the case, I’m going to get bored again and probably just wait for the dreadful slog to be over with. This doesn’t break any rules, but it looks gay.
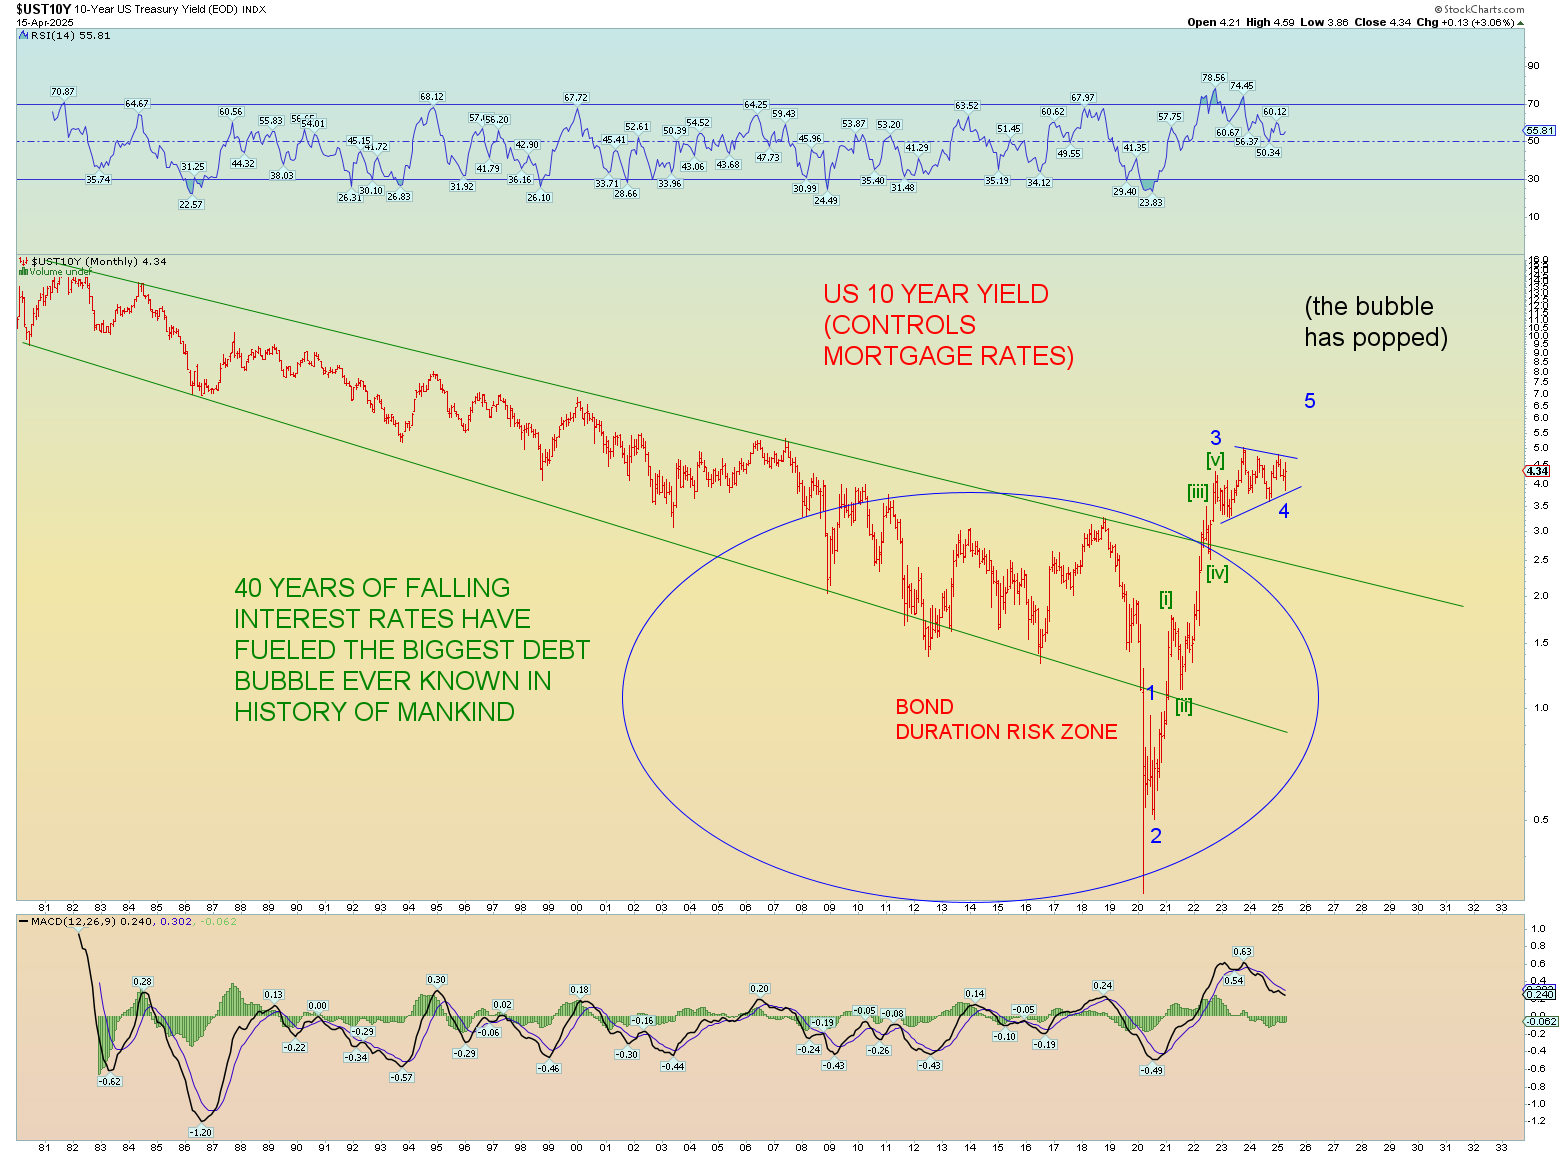
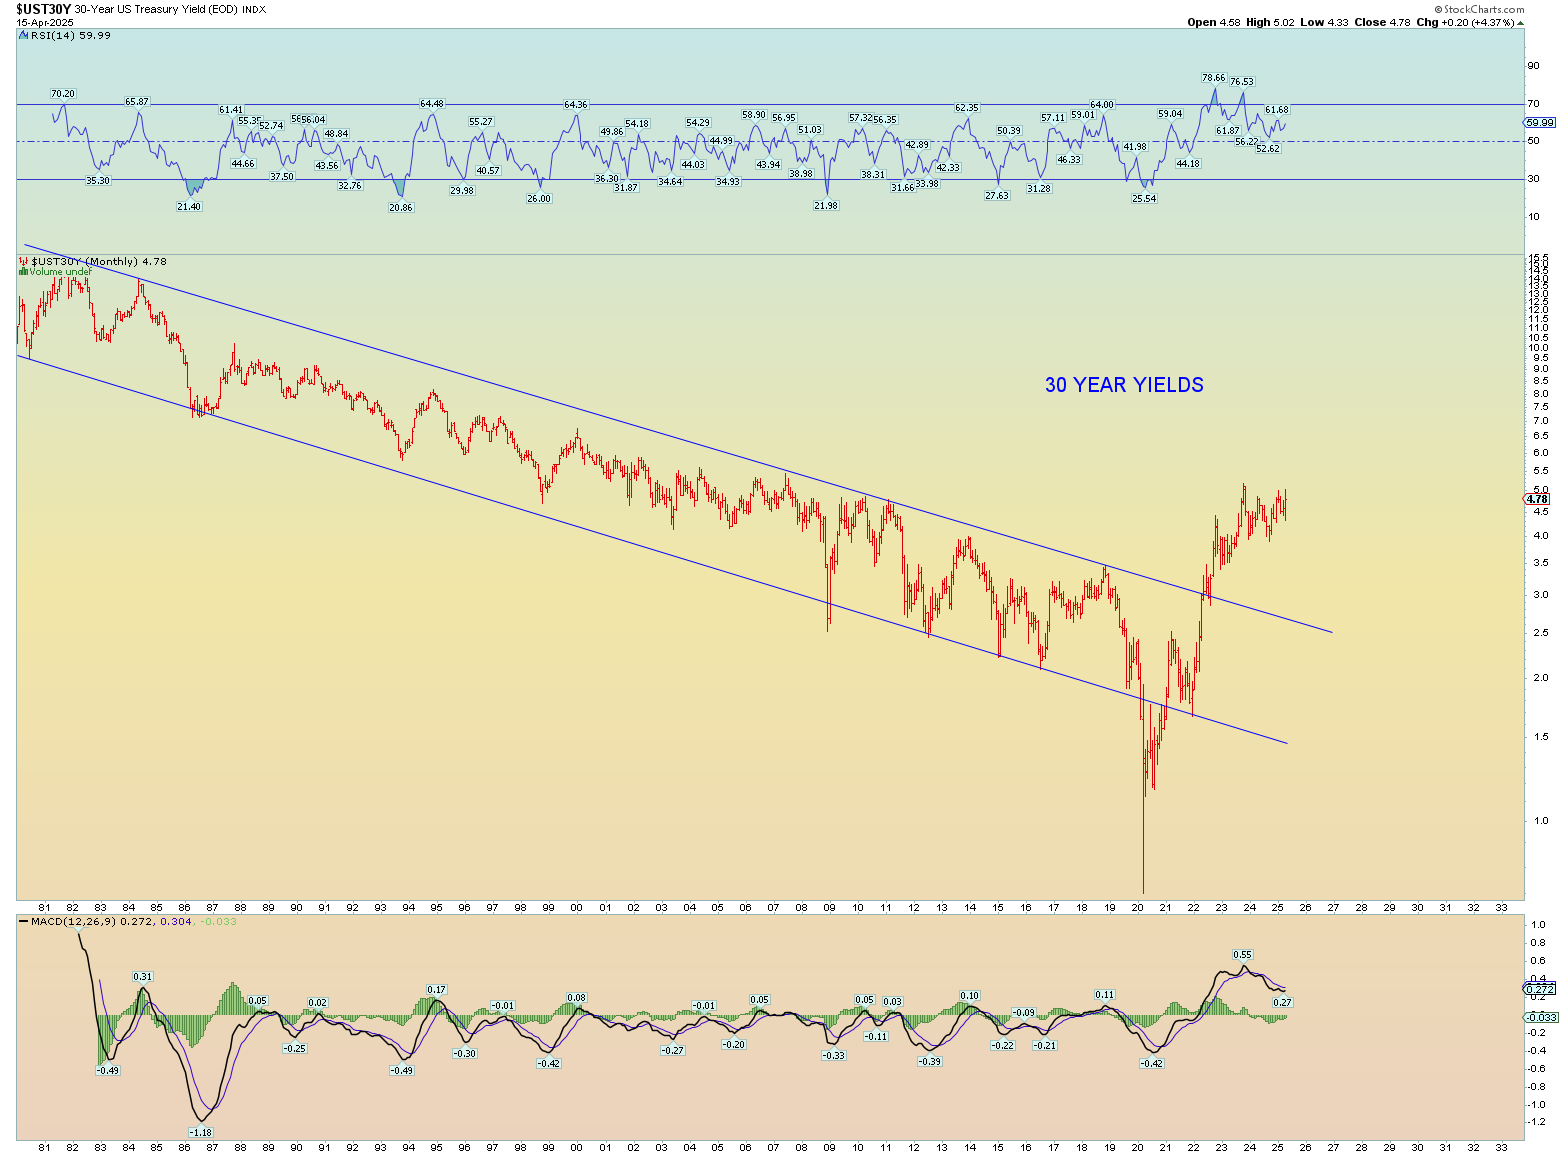
In 2020, the Covid panic, interest rates hit the floor across the spectrum. A dramatic ending to a 40-year downtrend in yields. That has not happened this market collapse (yet) and I don’t think it will happen. There is simply too much debt to hide. Oh, there are a zillion debt-hiding programs the Fed and the banks have created, but at some point, it will fall apart and probably quite quickly. Which would suit them just fine anyways as the system has been setup to “take everything”. They are not hiding it anymore. The Great Taking – Documentary
10-year yield seems to be in a log consolidation period with a coming break higher.