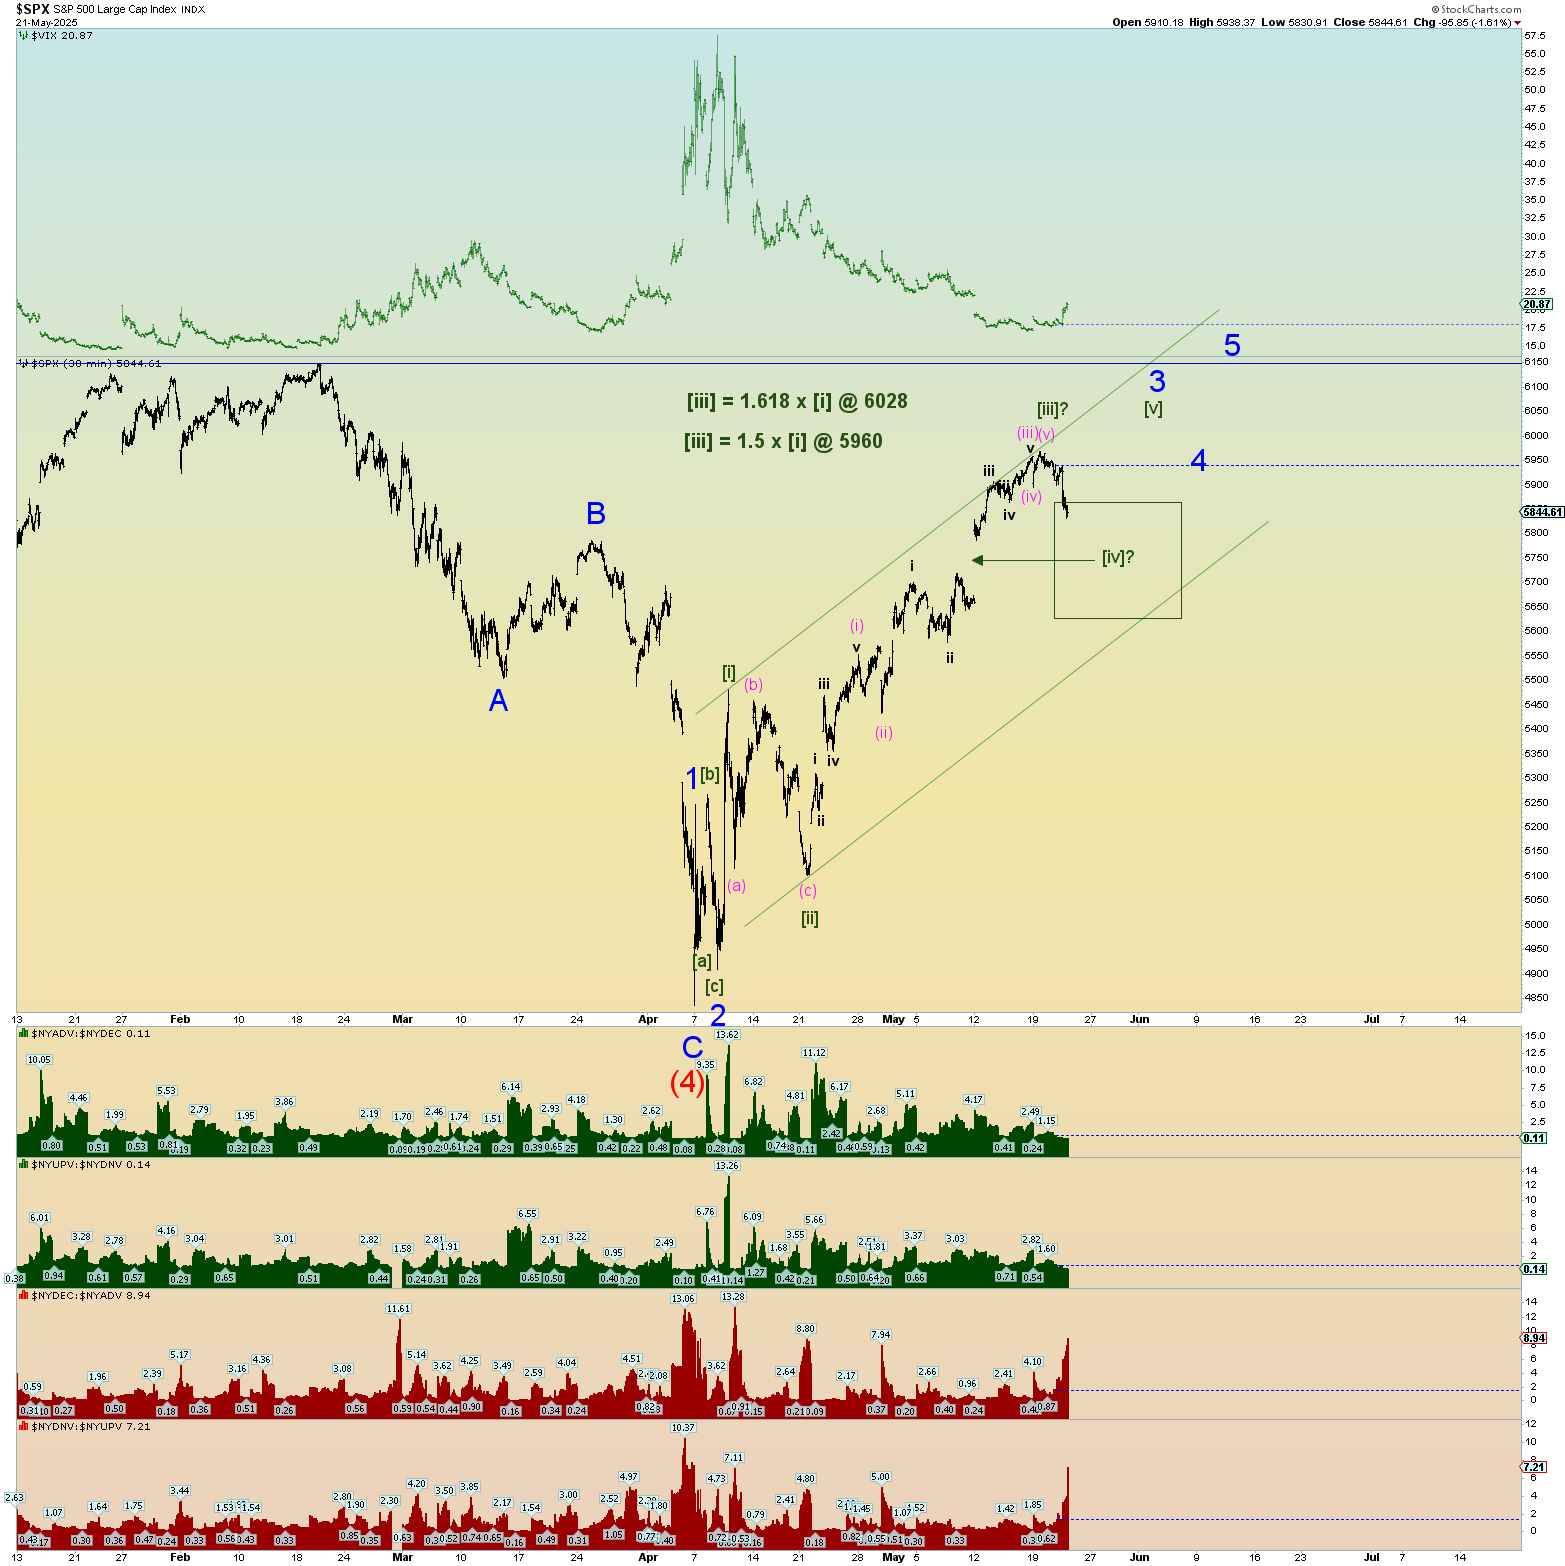
Today’s correction was big enough to consider the top of Minute [iii] has occurred. One such squiggle count is presented below. I feel the market’s best bet is to limit this Minute [iv] and continue higher sooner rather than later. A bigger dip would be damaging. Today’s market internal numbers ended on a high down volume and decliners vs advancers. That’s got to be concerning for bulls who bought this big open chart gap up.
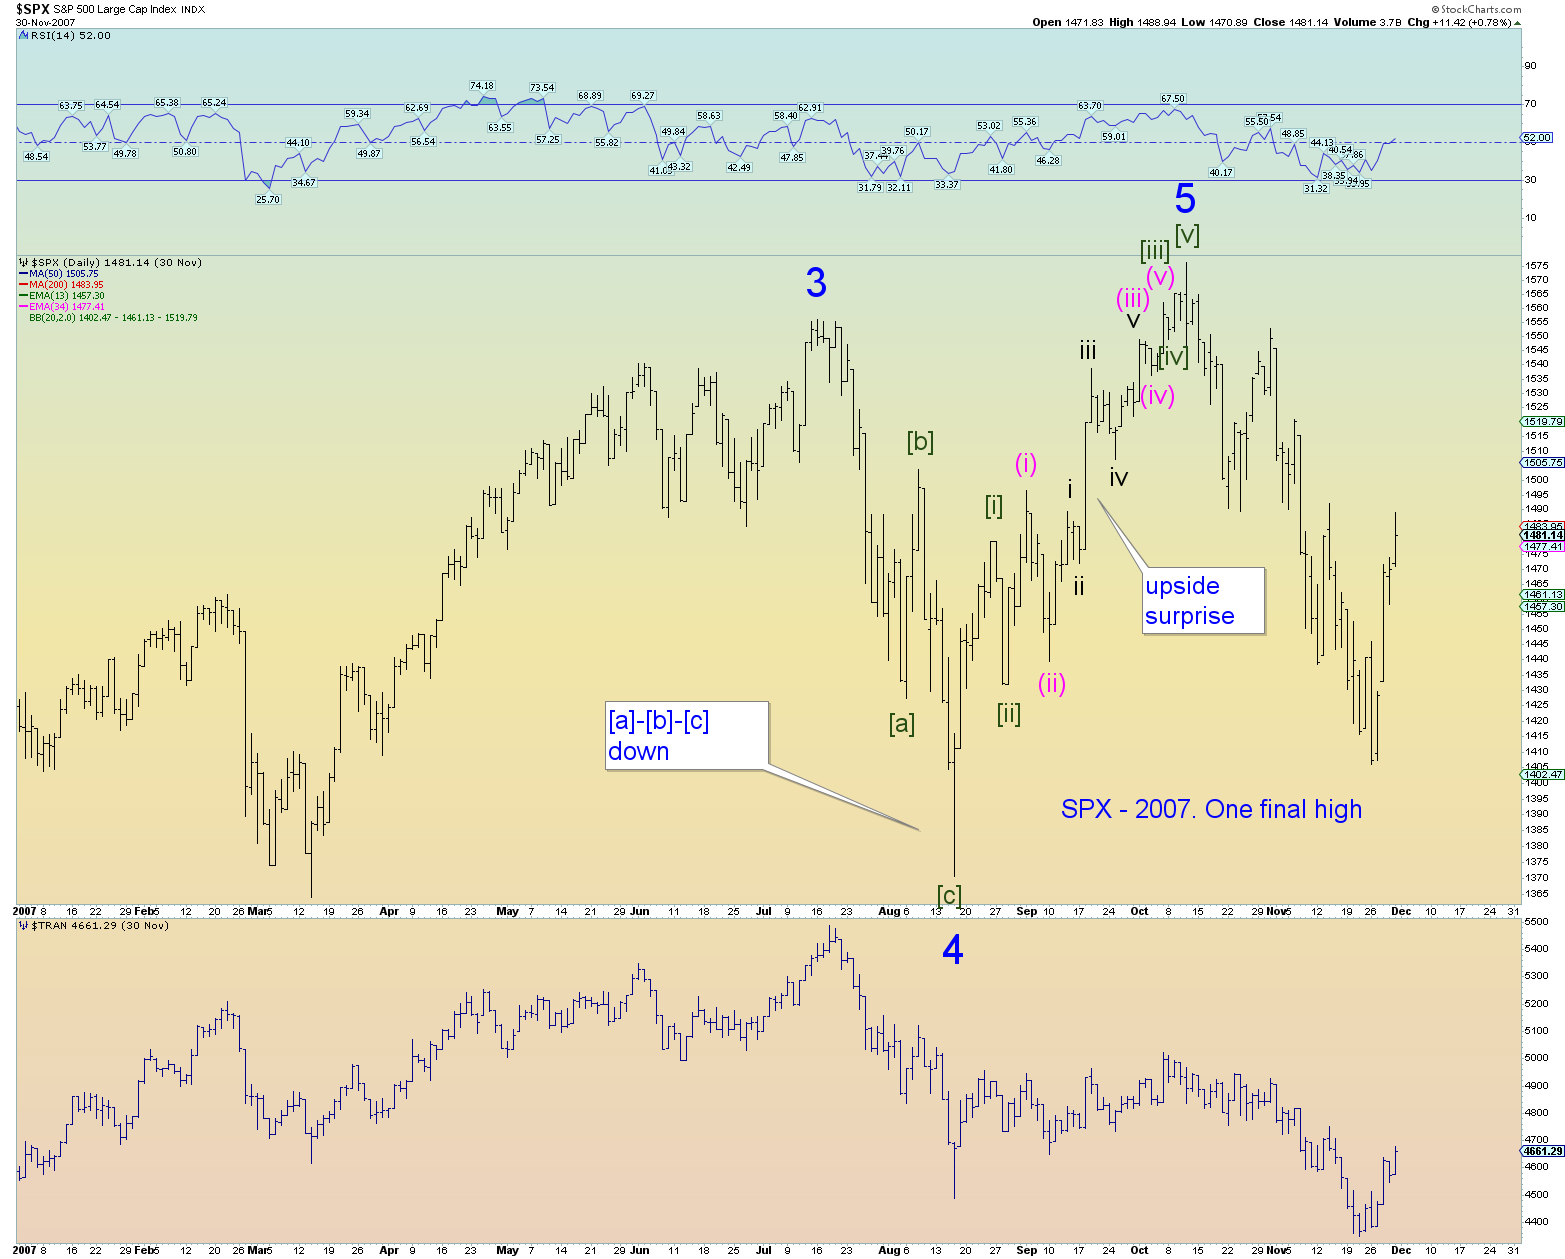
Again, looking at 2007’s final push to another new high occurred in rapid fashion (even though at least 1 degree wave lower) with big waves at the bottom of the structure and smaller at the top. It’s an example of a last market high wave that did not have a perfectly symmetrical structure.
I feel today’s market must do the same to have a chance at a new all-time high. Do it quickly in the summer when trading is thinner. Remember, I may be “bullish” short term for this final wave reaching a new high, but in reality, it still counts as the last. In my eyes, if it squeaks out a new high, its over anyways. I could care less and if does not happen, we are well prepared for an extremely bearish count.
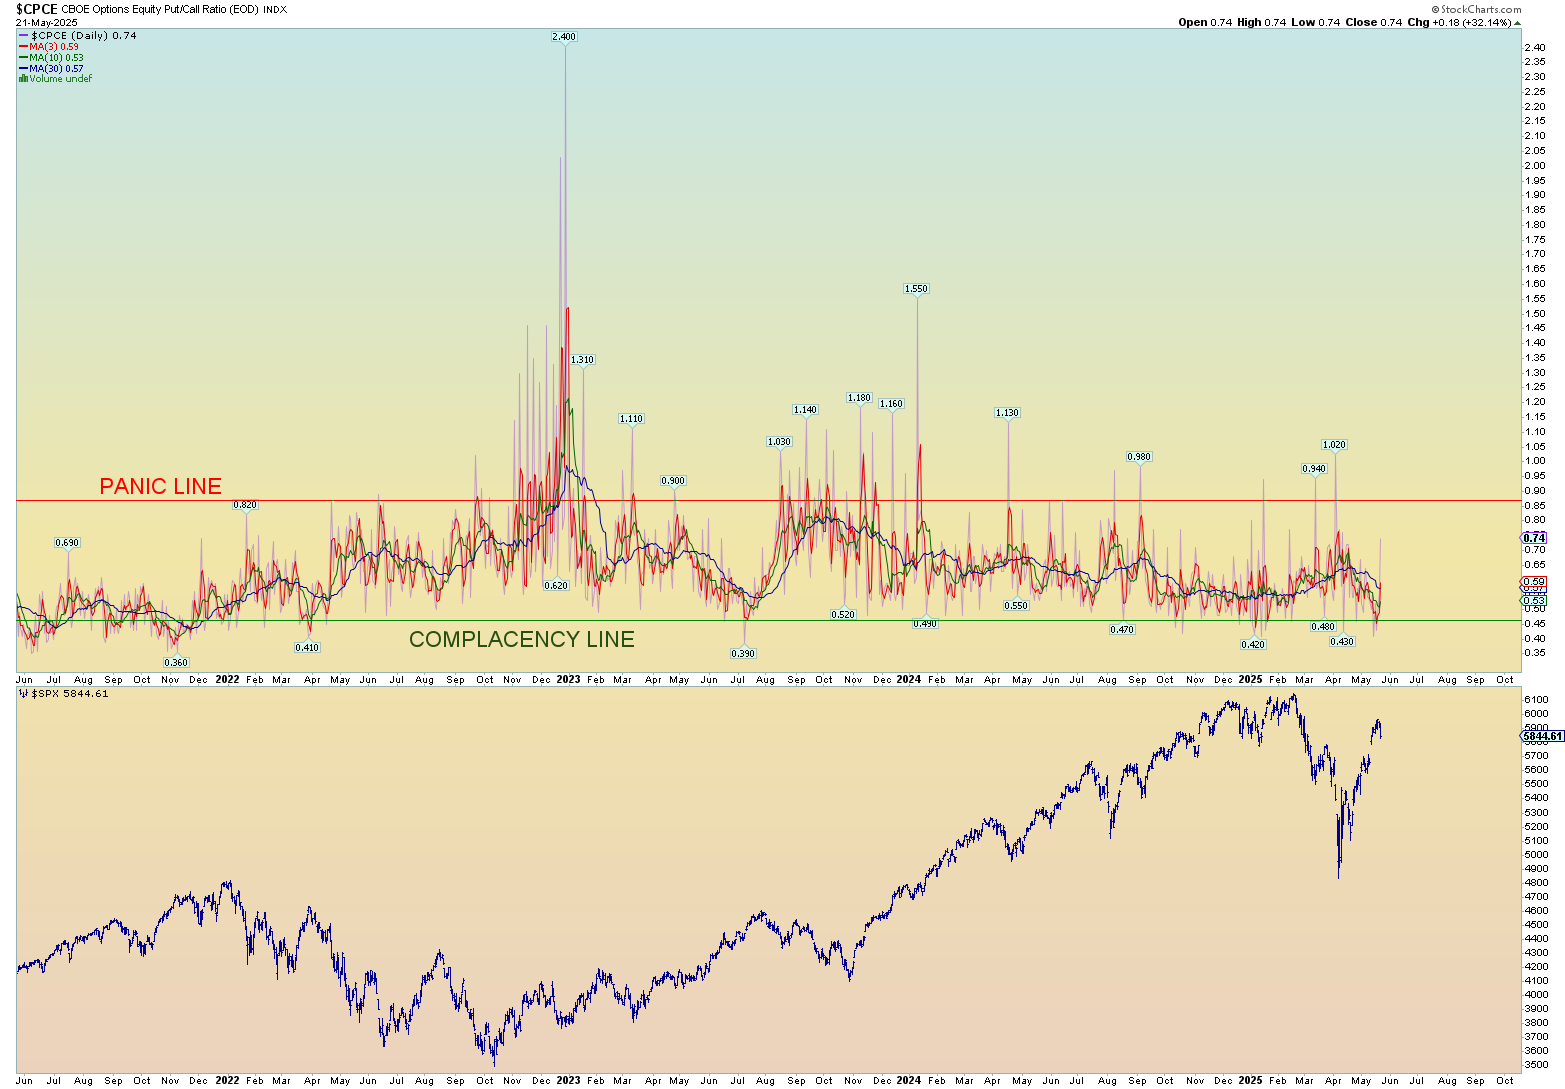
The CPCE reached extreme complacency levels on the 3 day and 10 day moving average. Again, I’d like to point out, there was no real panic in the April’s market downturn. It’s got to be concerning for the bulls that the positioning became so one-sided bullish again so quickly. Rising prices no matter the cause is of course inflationary.
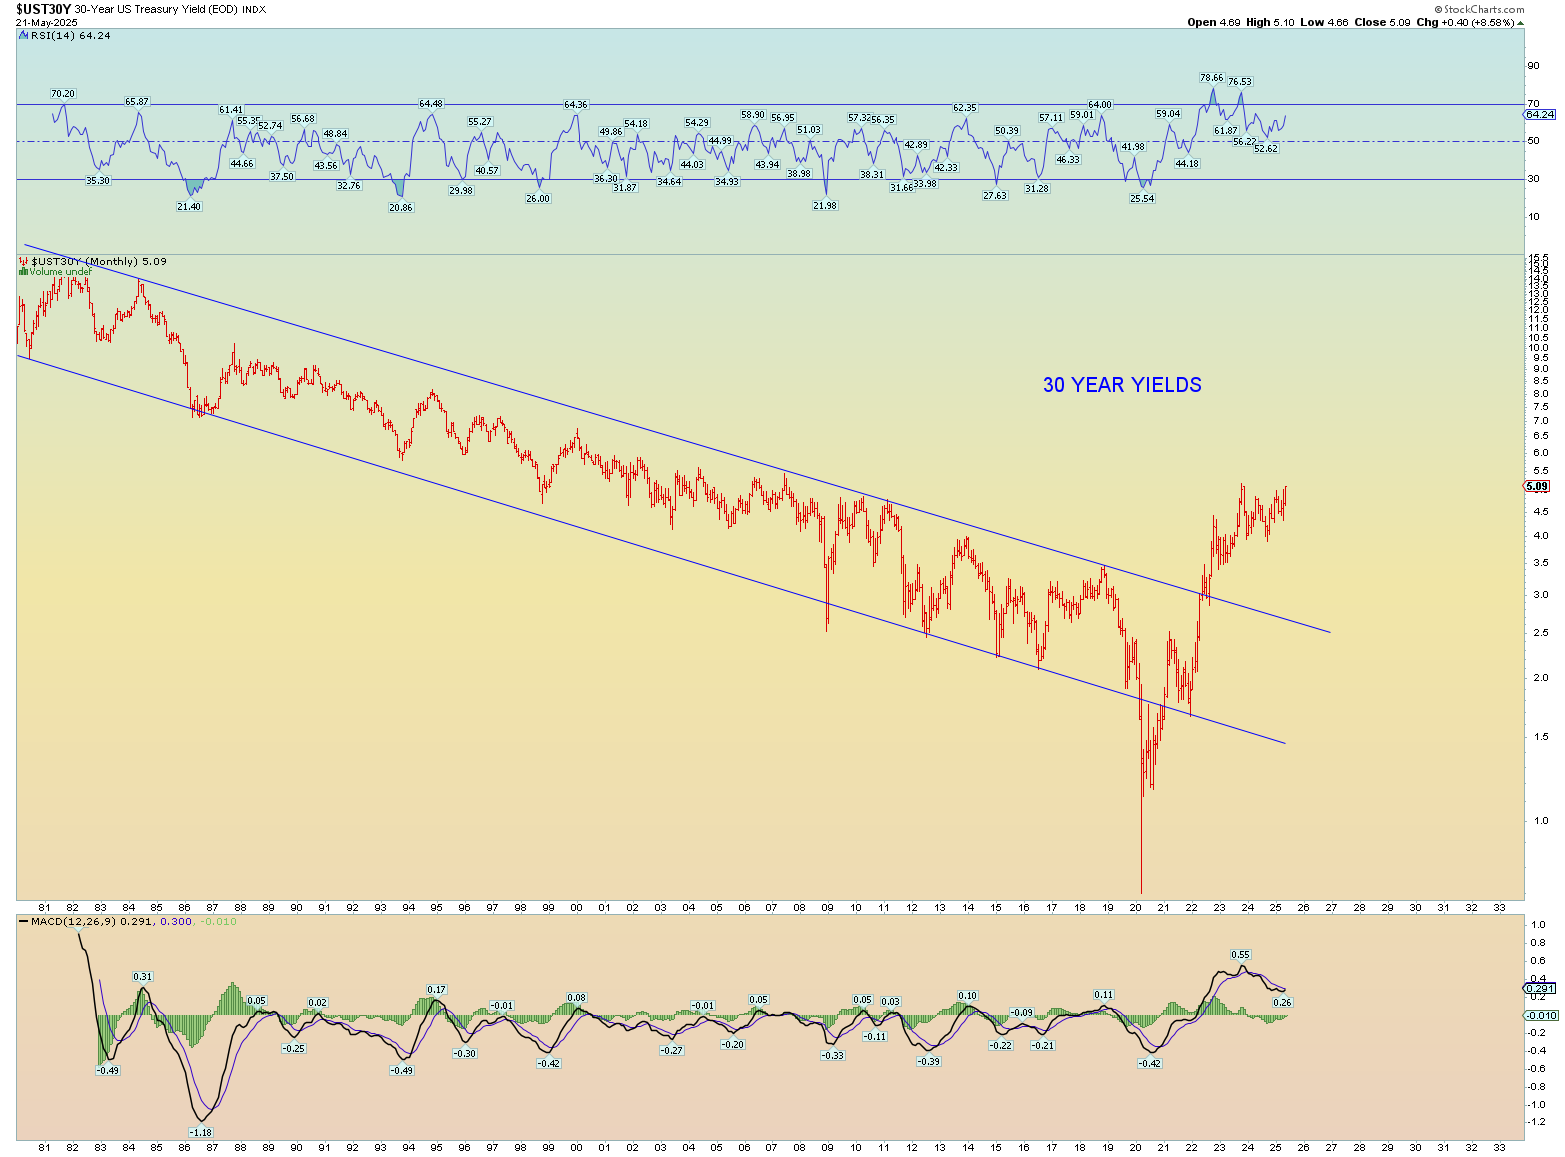
The overall concerning thing for bulls, is interest rates are sticky high and seem to be headed higher after a long consolidation period along the yield curve. The world is bankrupt folks. People are living in a delusional global financial market propped up by Satan himself. It’s not “if” the time will come, but simply “when”. When will the global financial system self-implode? The tariff wars cannot be put back in the bottle. Consumers will pay the price for the tariff increases. Any dummy should know that.

Um, yes Virginia, there has been a long-term trend change! Duh!
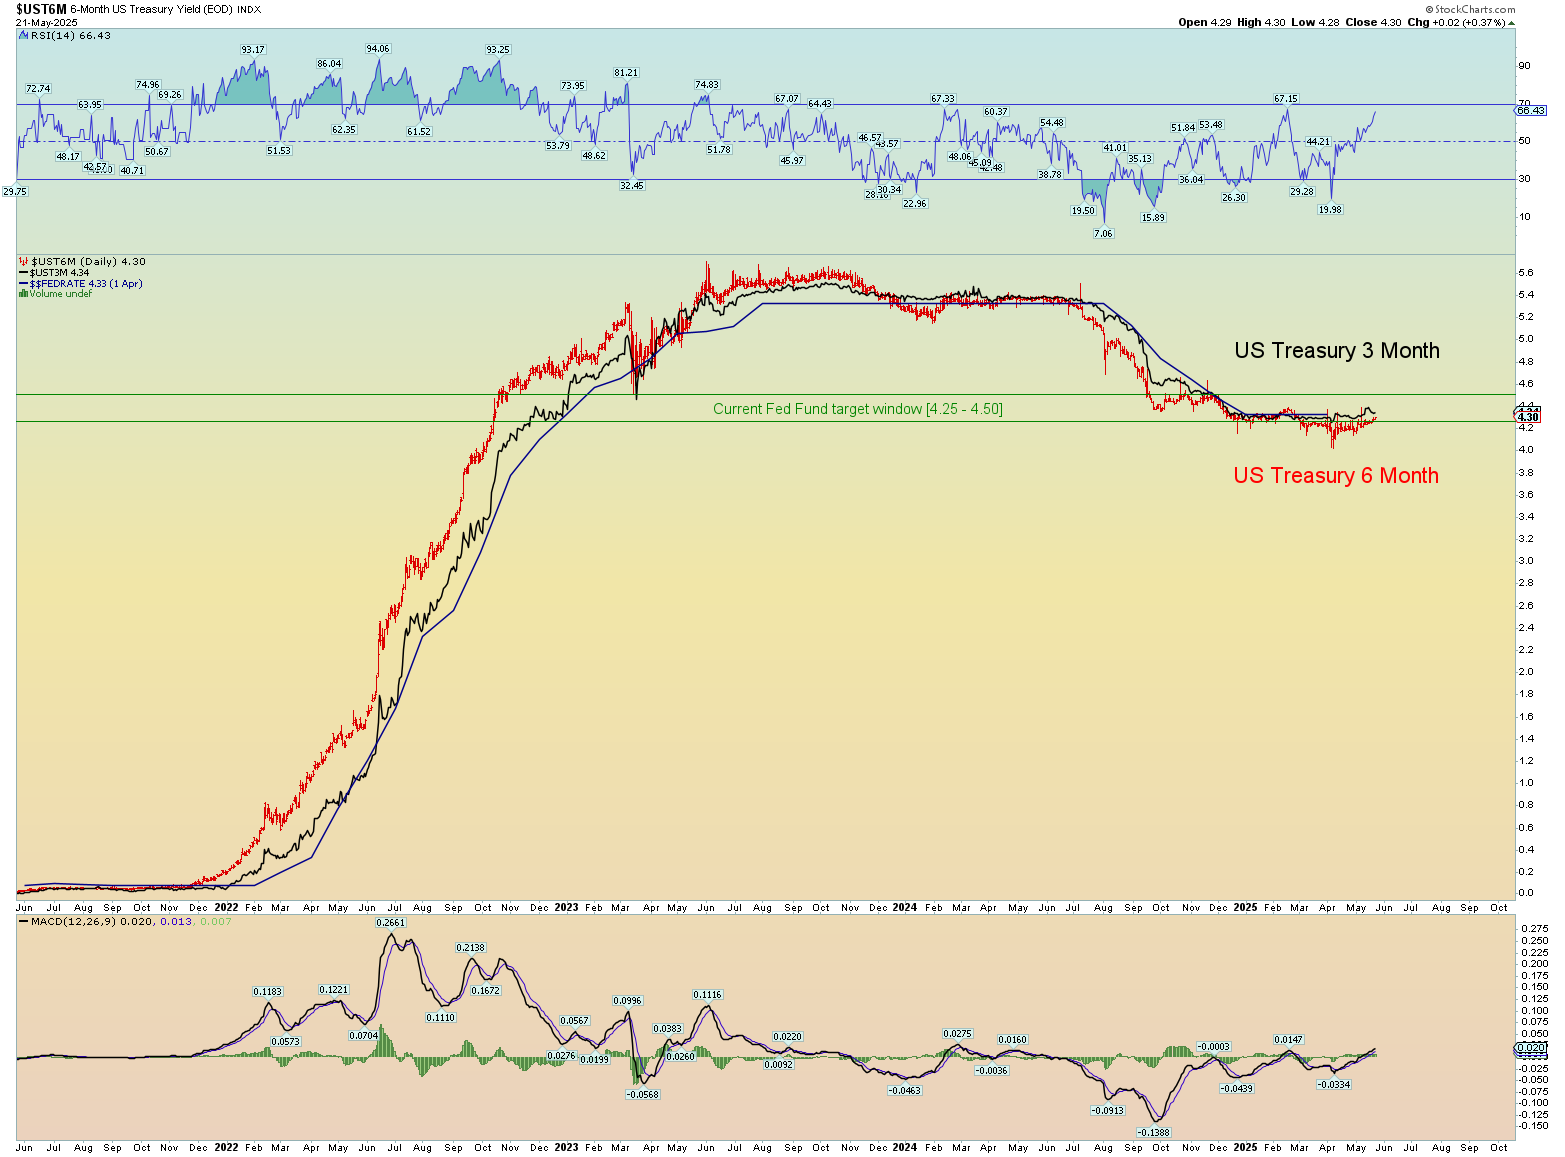
One key thing I’m looking for is if the 6-month yield flips higher and again begins to lead the 3 month also back higher. Look for a yield crossover.
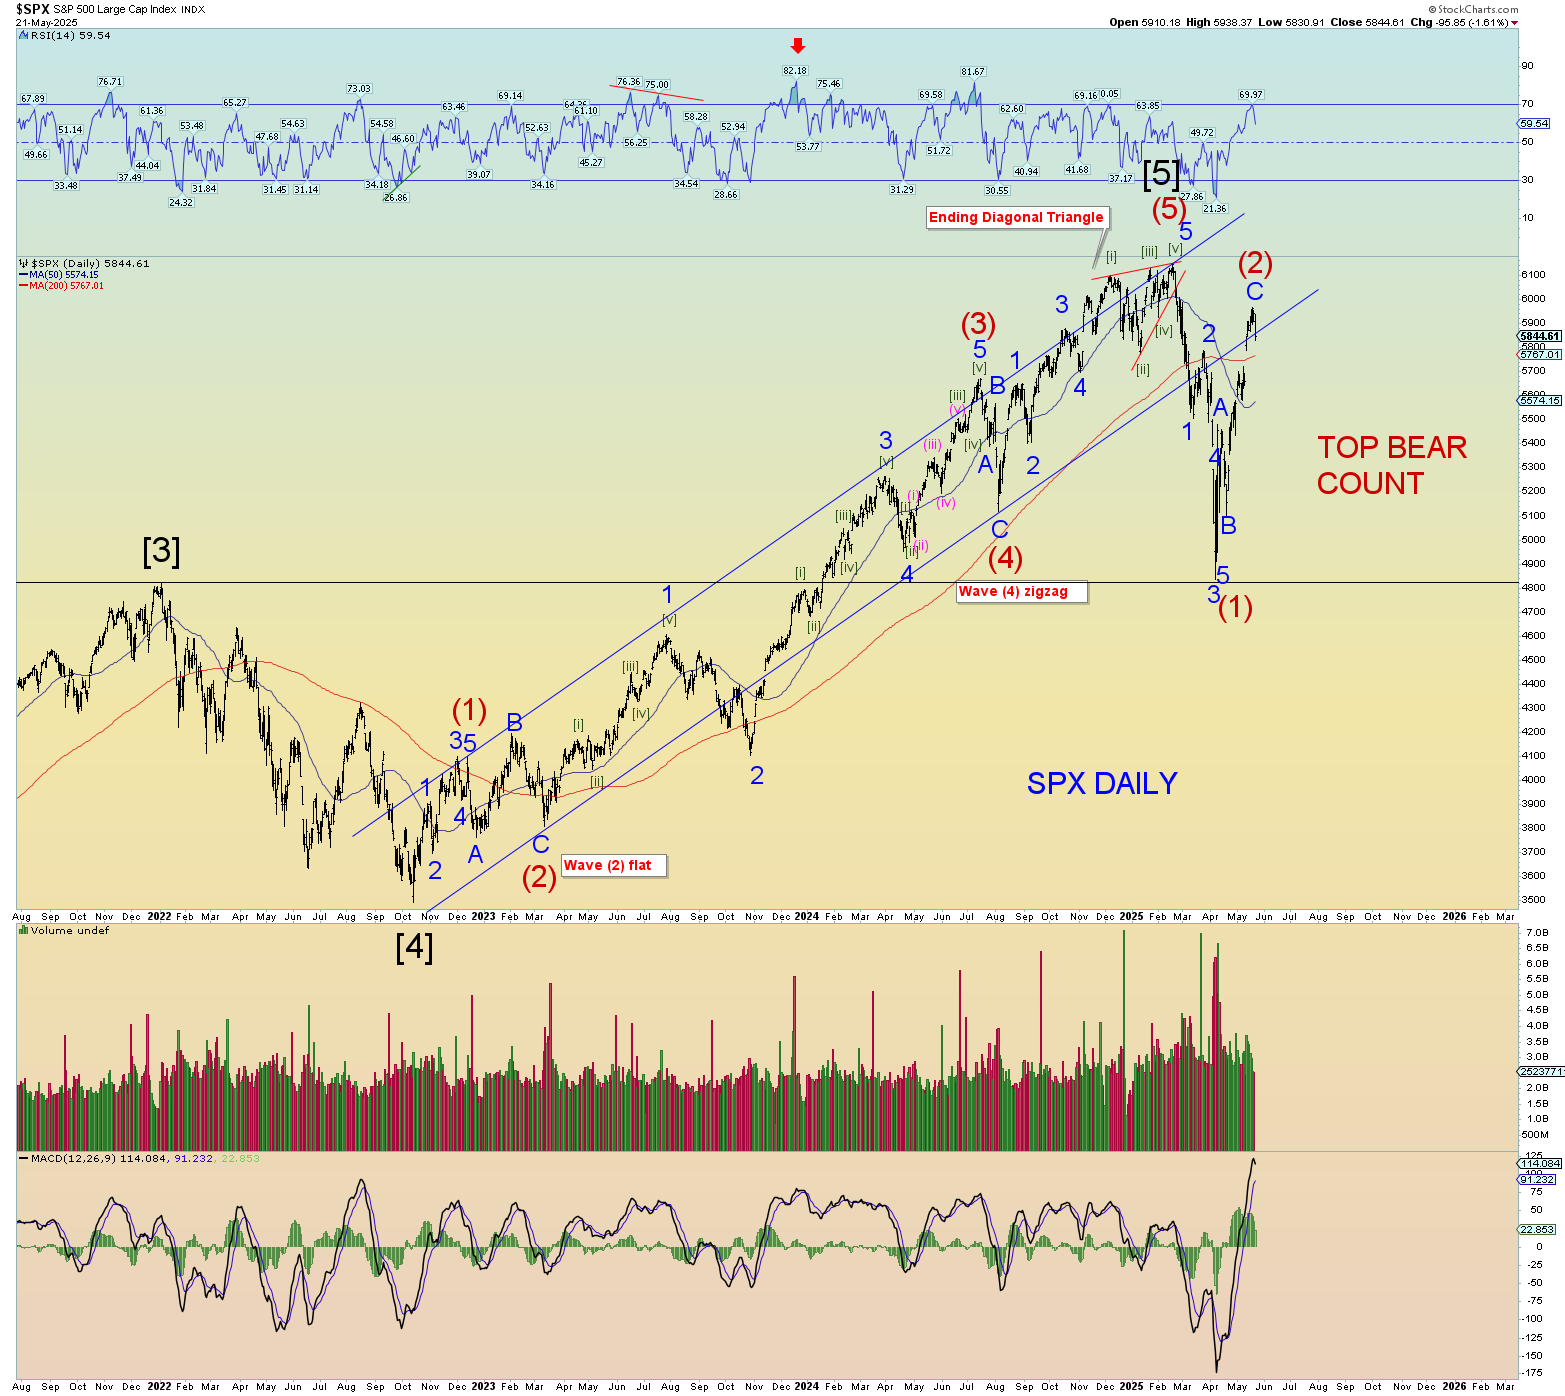
And for the hardcore bears who have endured this historic rally since the April low, I still have a chart that in my opinion, would be just fine. If correct, Wave (2) really has stretched itself and I would consider it over. Prices trying to jump back in the old uptrend channel is a typical stopping point and reversal.
A price moves beneath 5650 would be a key wave marker. But thats still 200 points beneath.