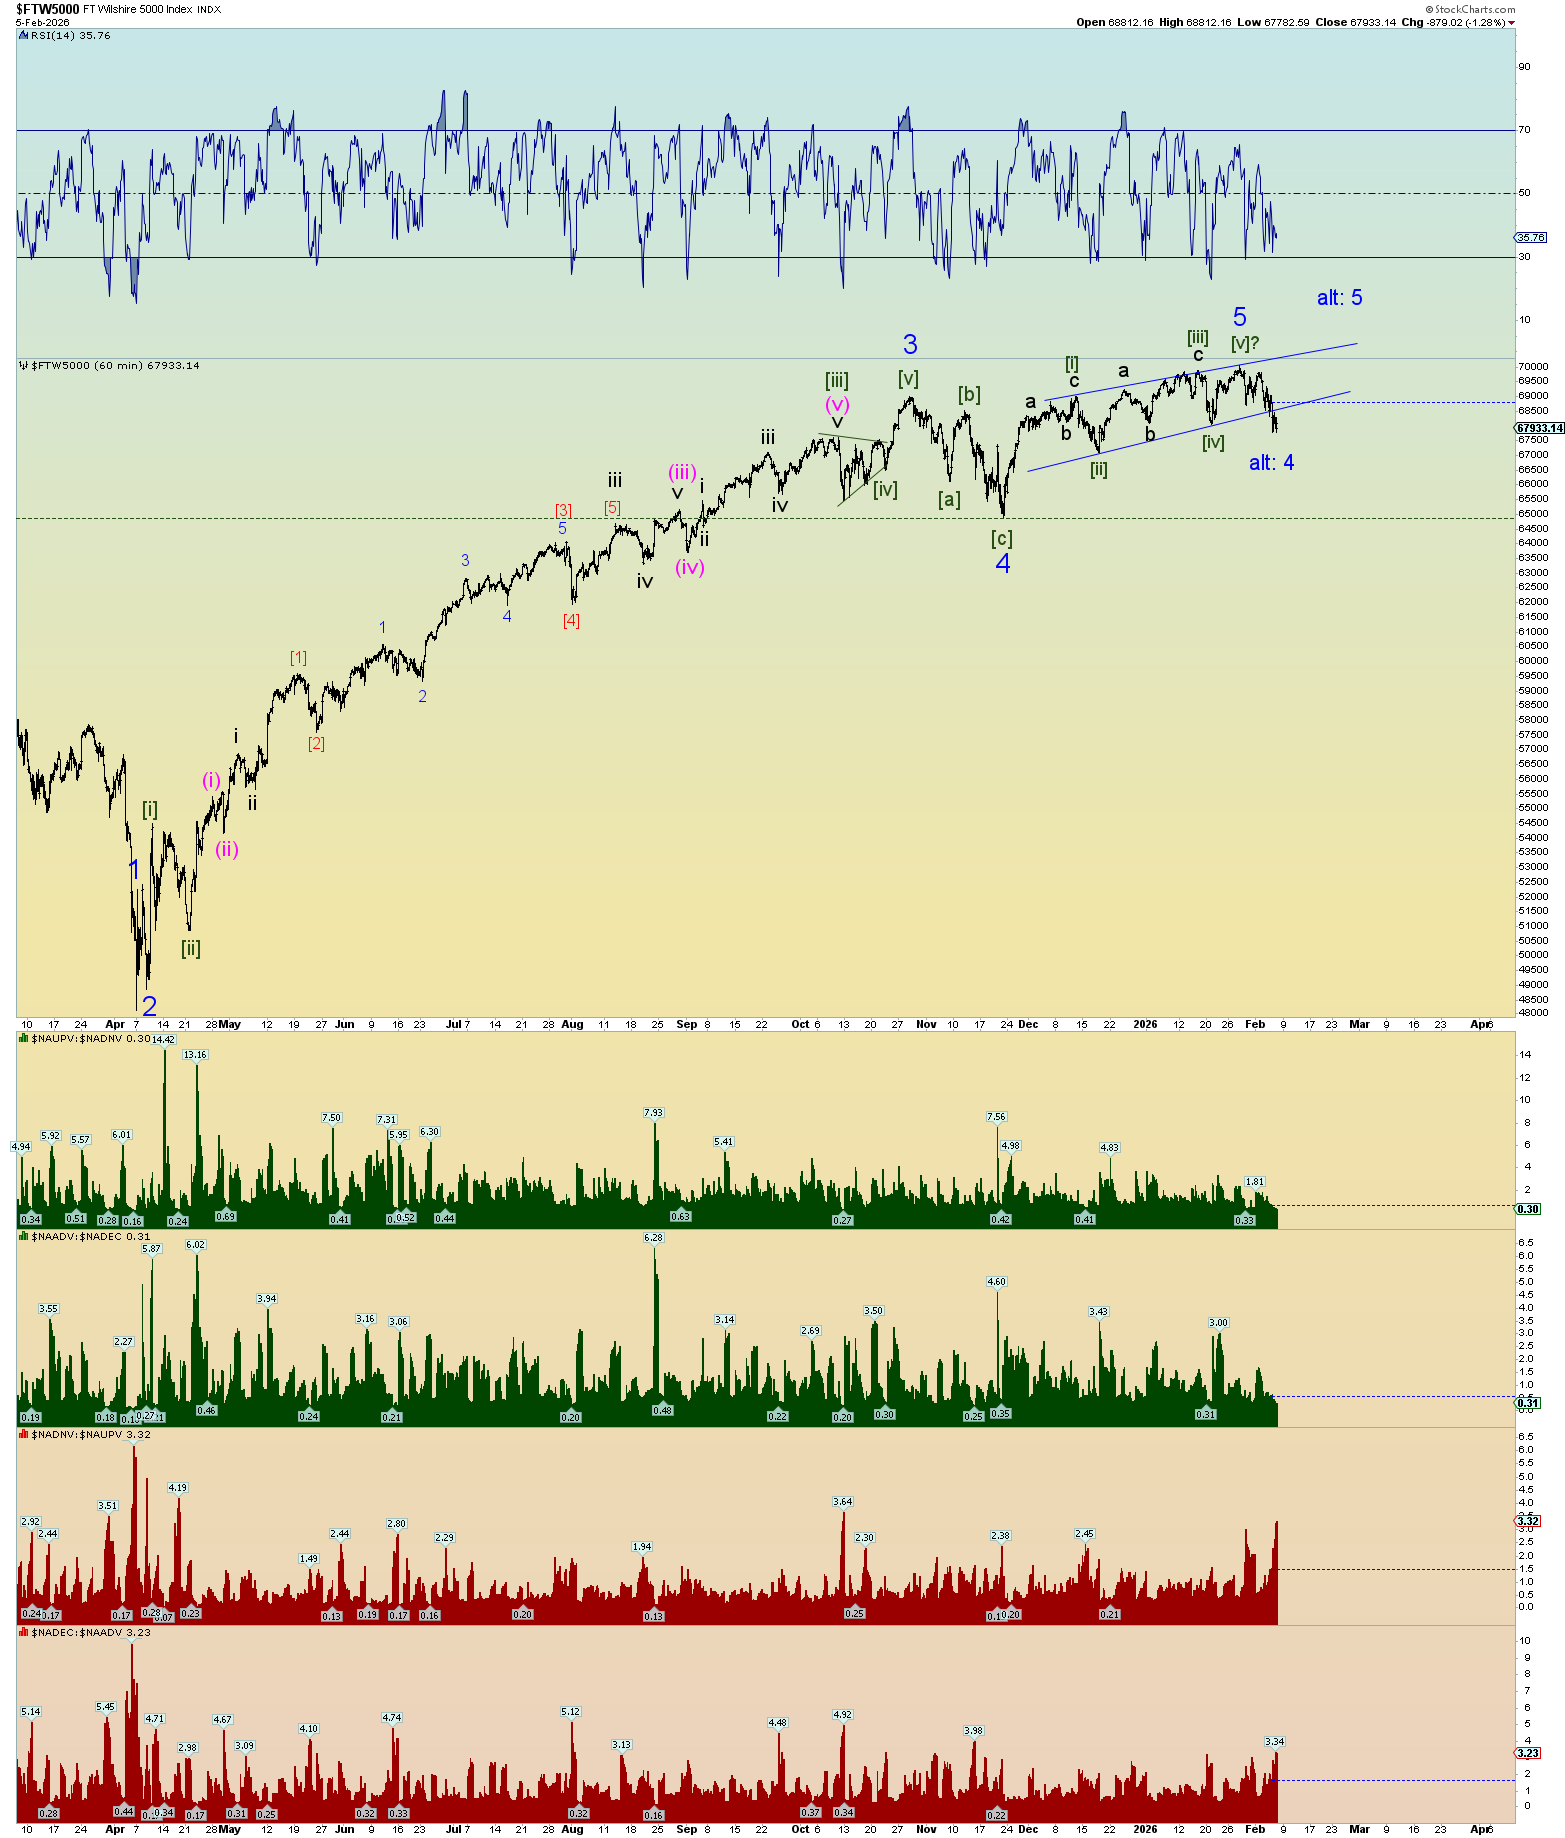
Across the board selling today and crypto and silver got hammered. Because of the further price drop today and the overall negative price action everywhere one looks, the best wave count for the Wilshire 5000 (and SPX) is that the ending diagonal triangle ended last week and it’s been just a bunch of shakeouts just prior to the bottom falling out.
This does make a really nice count. Choppy overlapping finish at the end. To confirm the count implies a quick selloff to beneath the late November 2025 Blue Minor 4 low. Same holds true for the SPX.
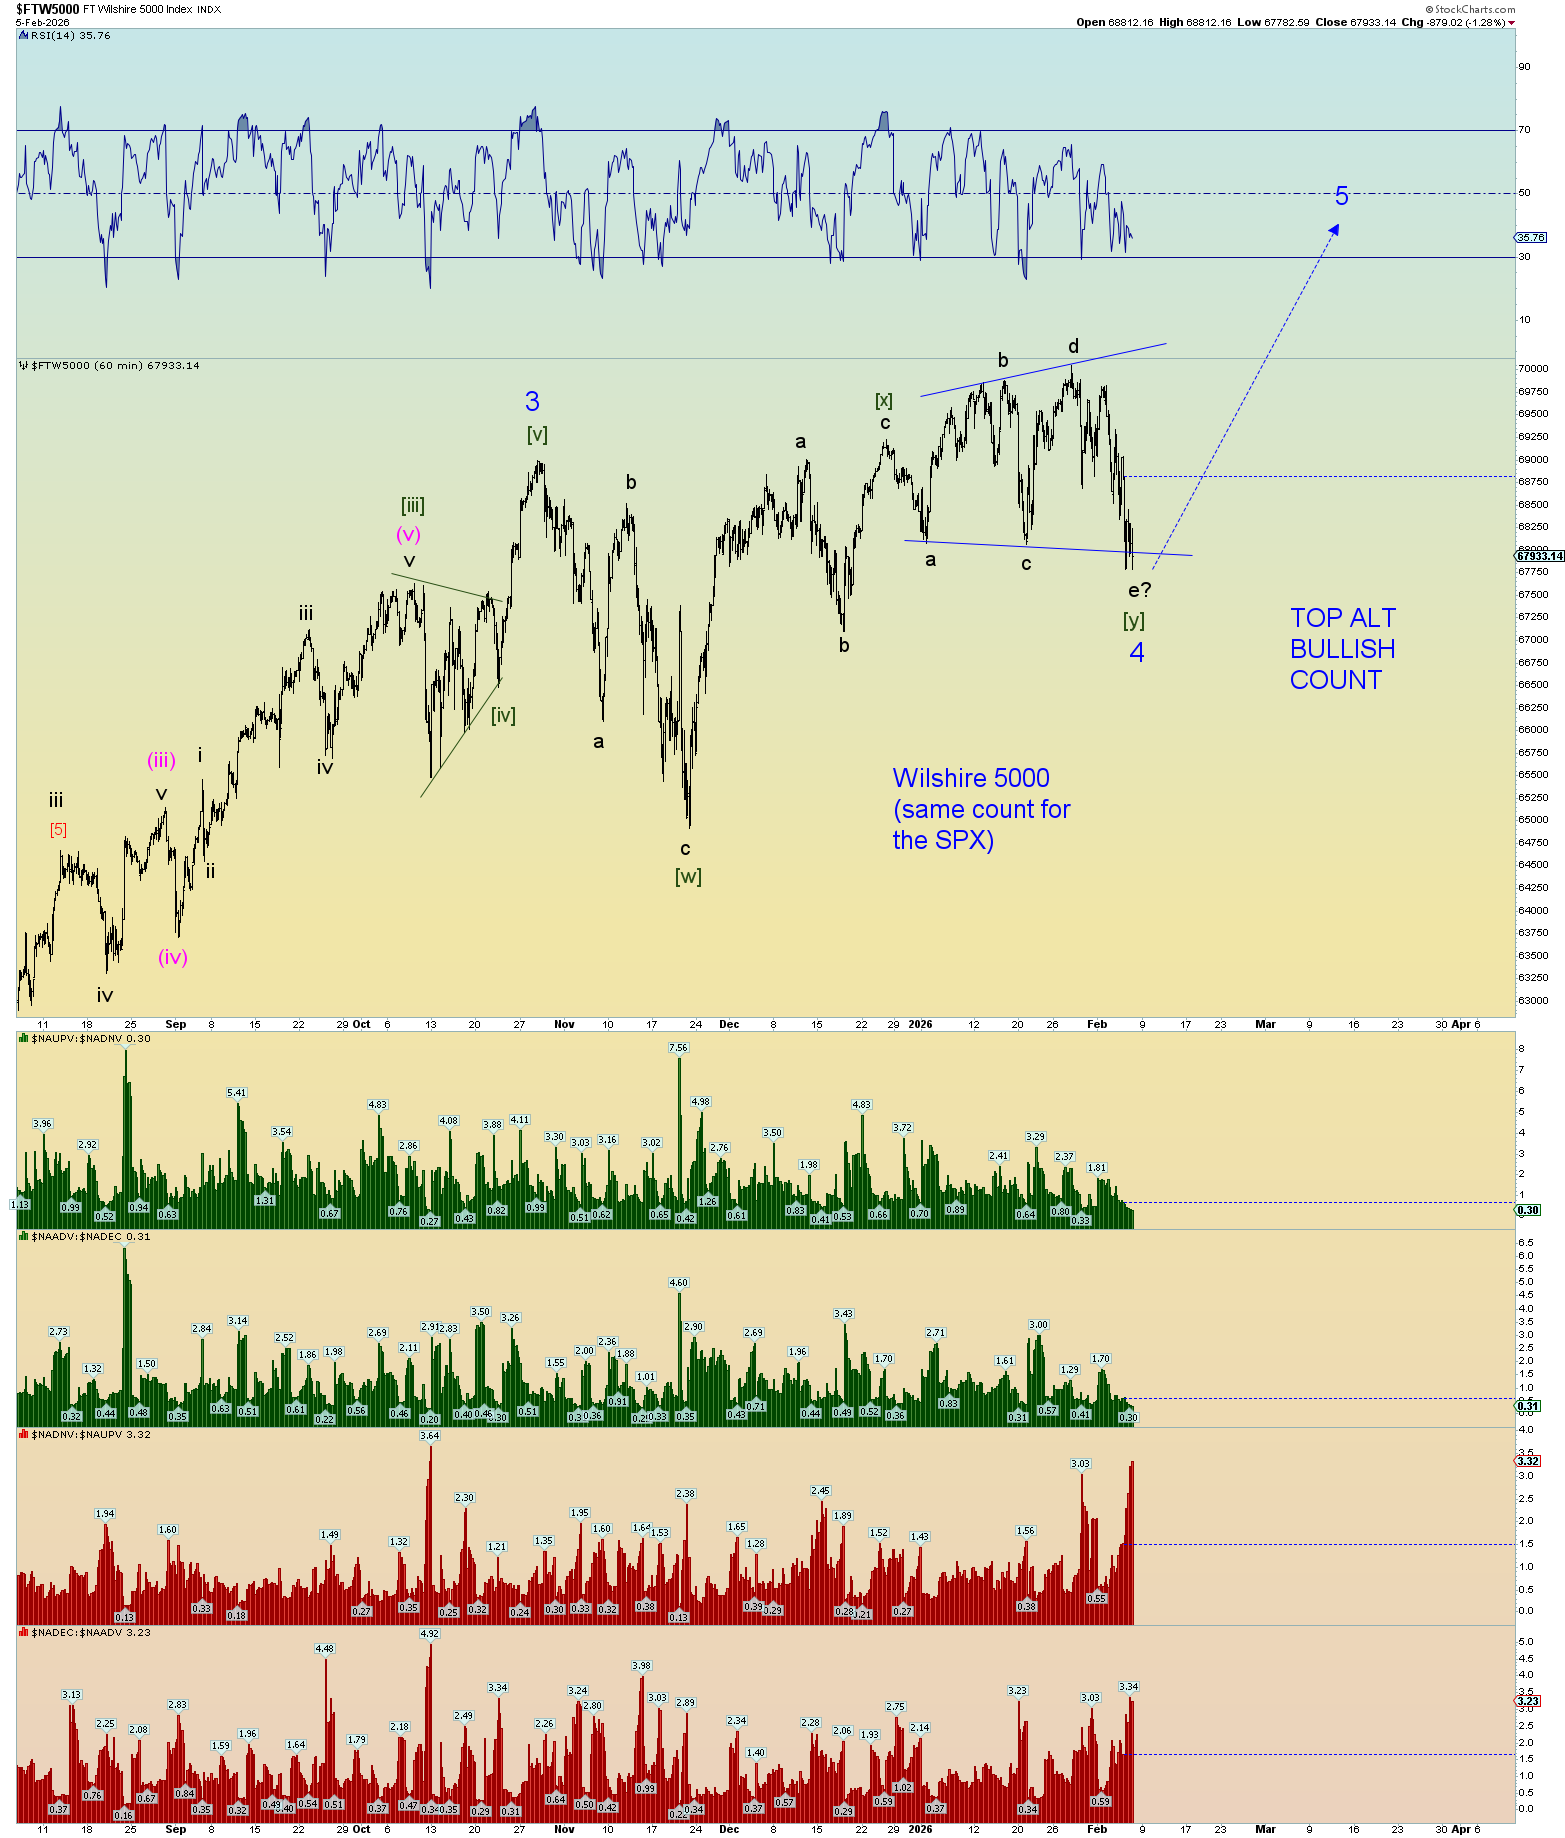
However, there is an interesting alternate count that cropped up today. This would be known as a complex corrective, a 3-3-3 sideways count that stretches out time rather than price. zigzag – zigzag – expanding triangle structure.
Again, there really is no more room for this to be a valid count, so I wanted to show it tonight. We always want to prepare for the best alternate with a valid count.
I’m not really rooting either way, just that I hope this entire mess resolves itself one way or another finally.
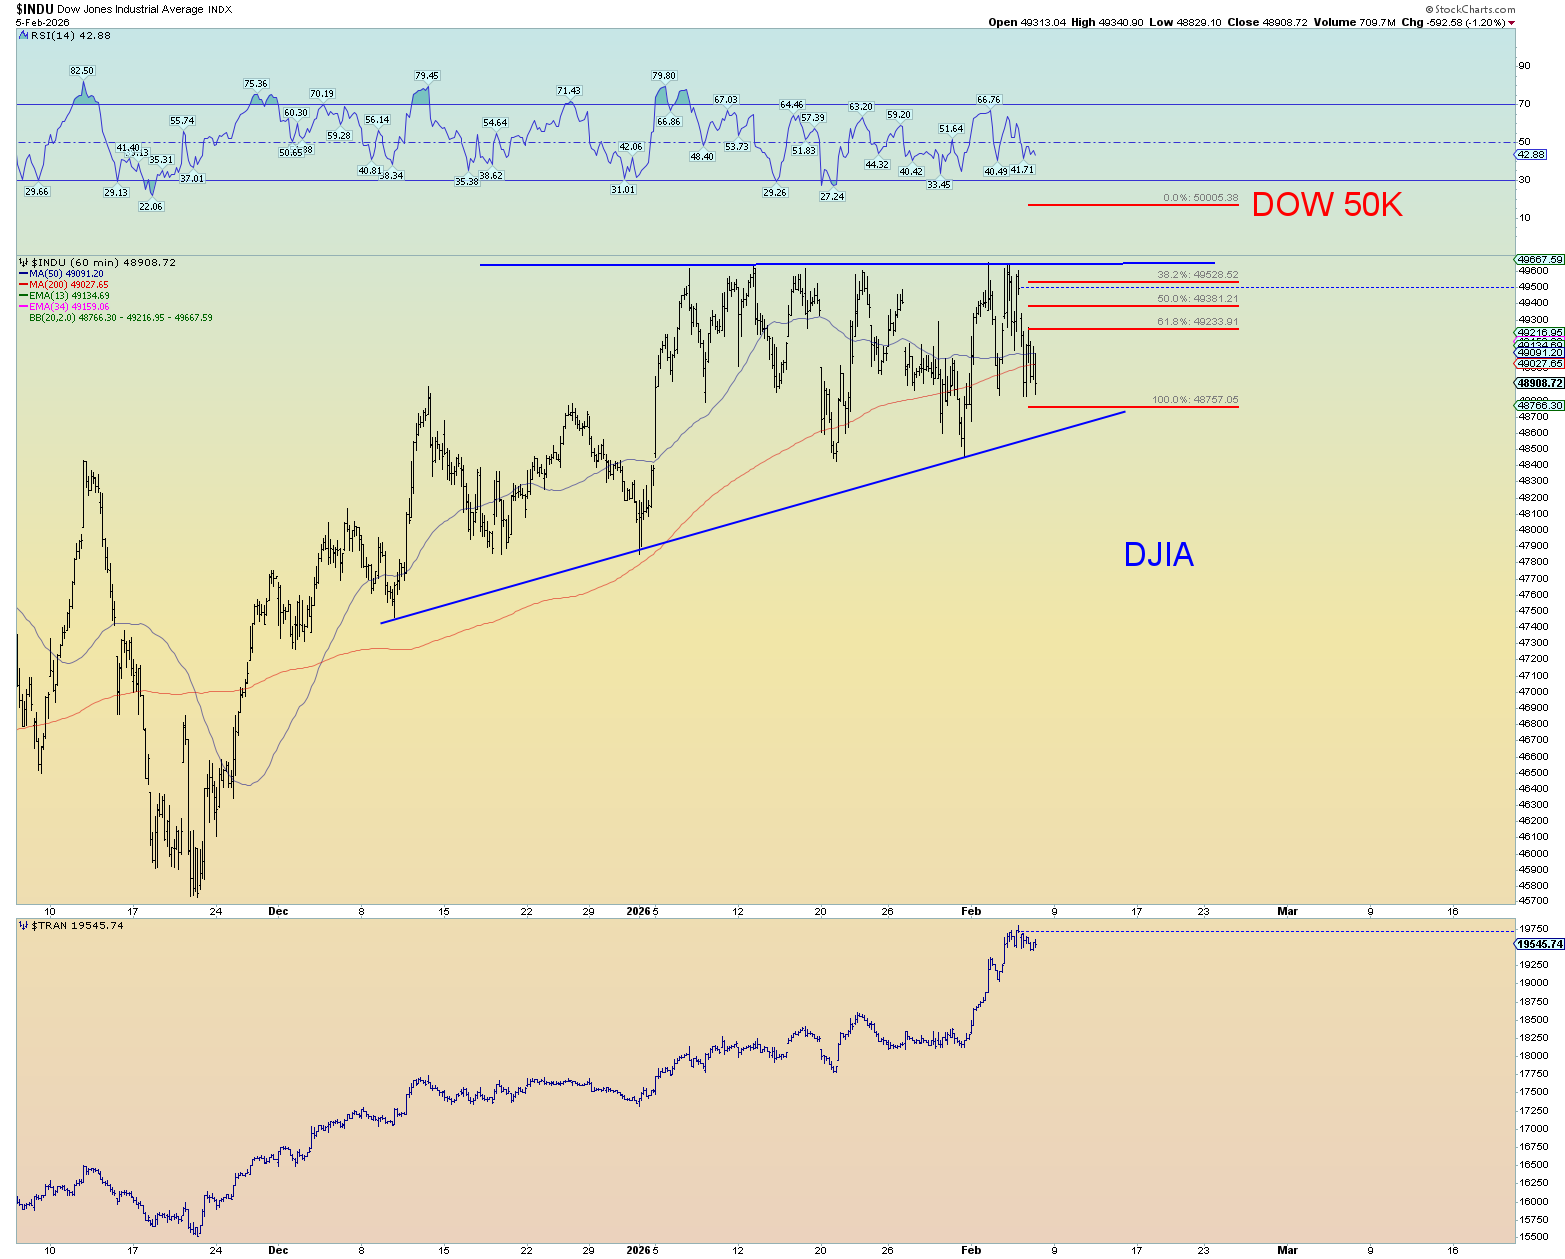
Afterall, the DOW is still ok for an ascending triangle: