UPDATE:
I meant to talk about the gas pipelines sabotage. I predicted this back in April and it was very surreal to see it not happen until now. But it happened. My blog post on 21 April 2022 Elliott Wave Update ~ 21 Apr 2022 – Daneric’s Elliott Waves (danericselliottwaves.org)
And the key snippet:
Sooner or later, Russia’s pipelines will be sabotaged. It is a surreal situation. Europe is shipping weapons to Ukrainians to kill Russians yet buy their gas from them. At some point it would be logical to blow up the pipelines. It wouldn’t be hard. I imagine that is being planned for and the “green light” hasn’t yet been given. But it is coming.
And so finally the “green light” had been given and my bet would be that Babylon USA is responsible as we haven’t complained very much about it since it happened. From what I understand there are still other pipelines operating from Russia to Europe some actually through Ukraine that are still flowing gas.
Here is my next prediction: at some point ALL of Russia’s pipelines to Europe will be cutoff, shutdown, sabotaged or whatever. The fact that “de facto” war exists between Russia and Europe will eventually lead to the real-world scenario that trading in energy goods actually stops between the two completely if it hasn’t already.
ORIGINAL POST
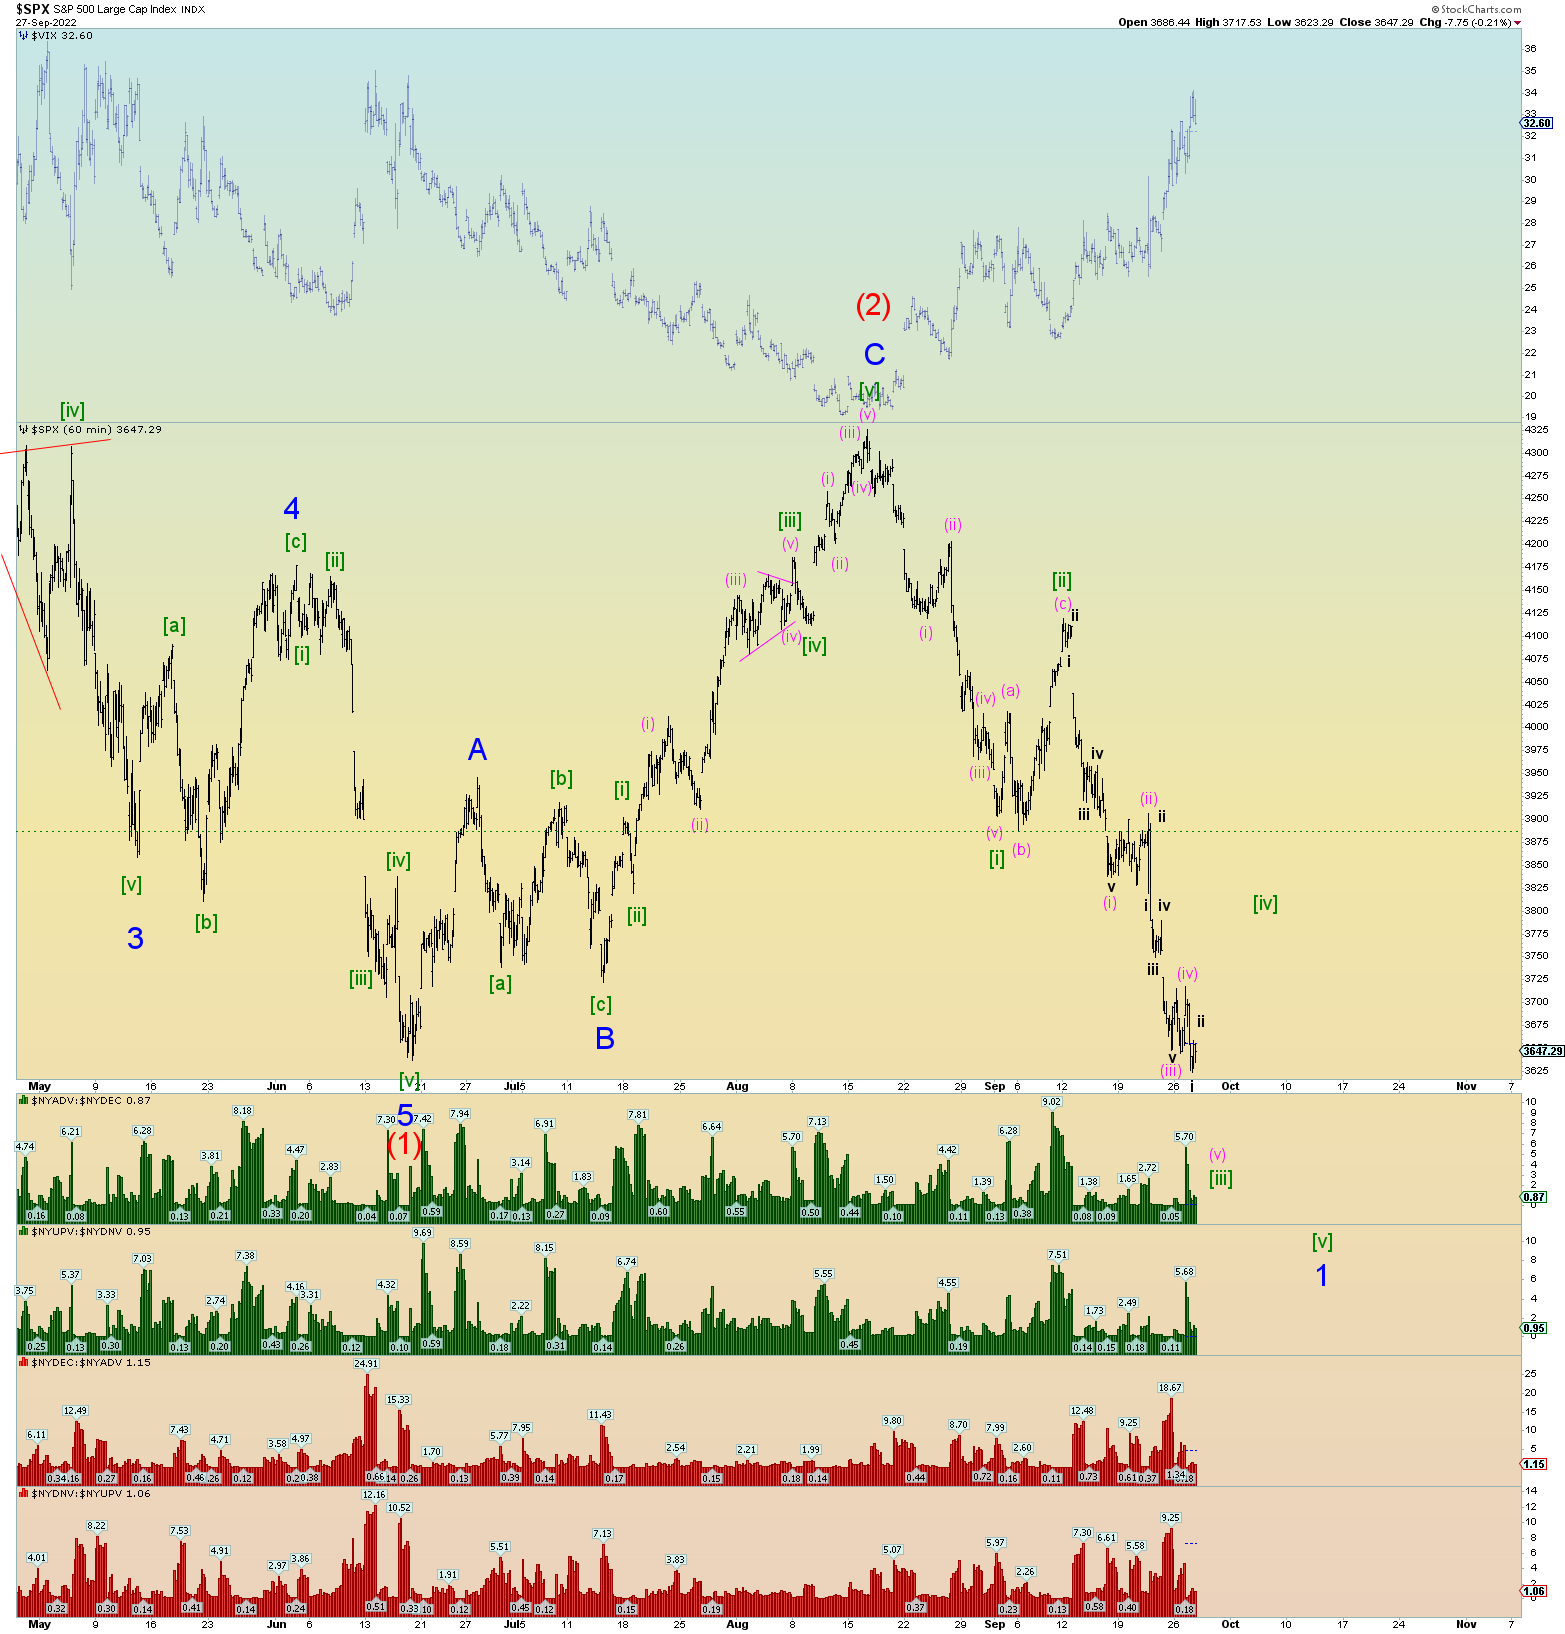
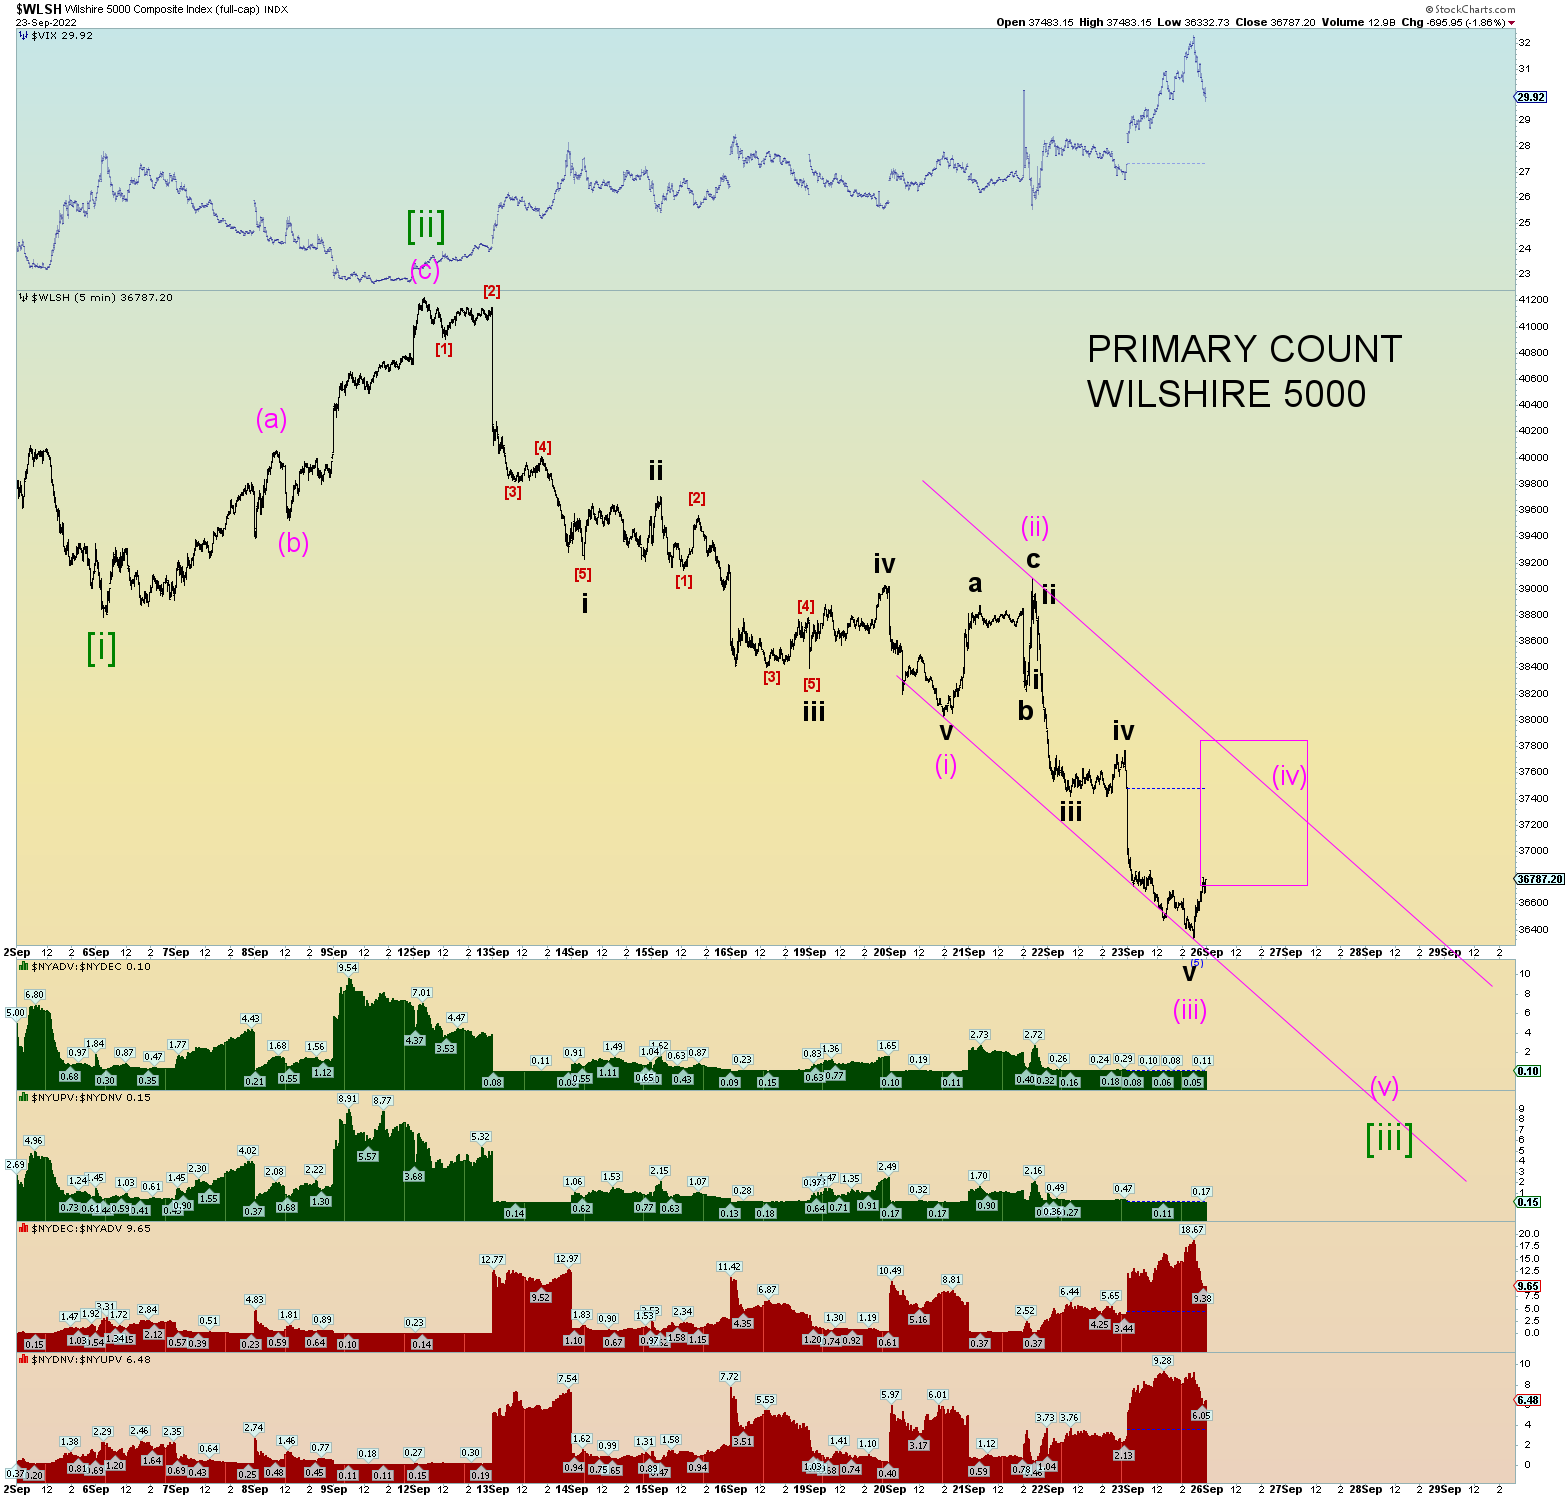
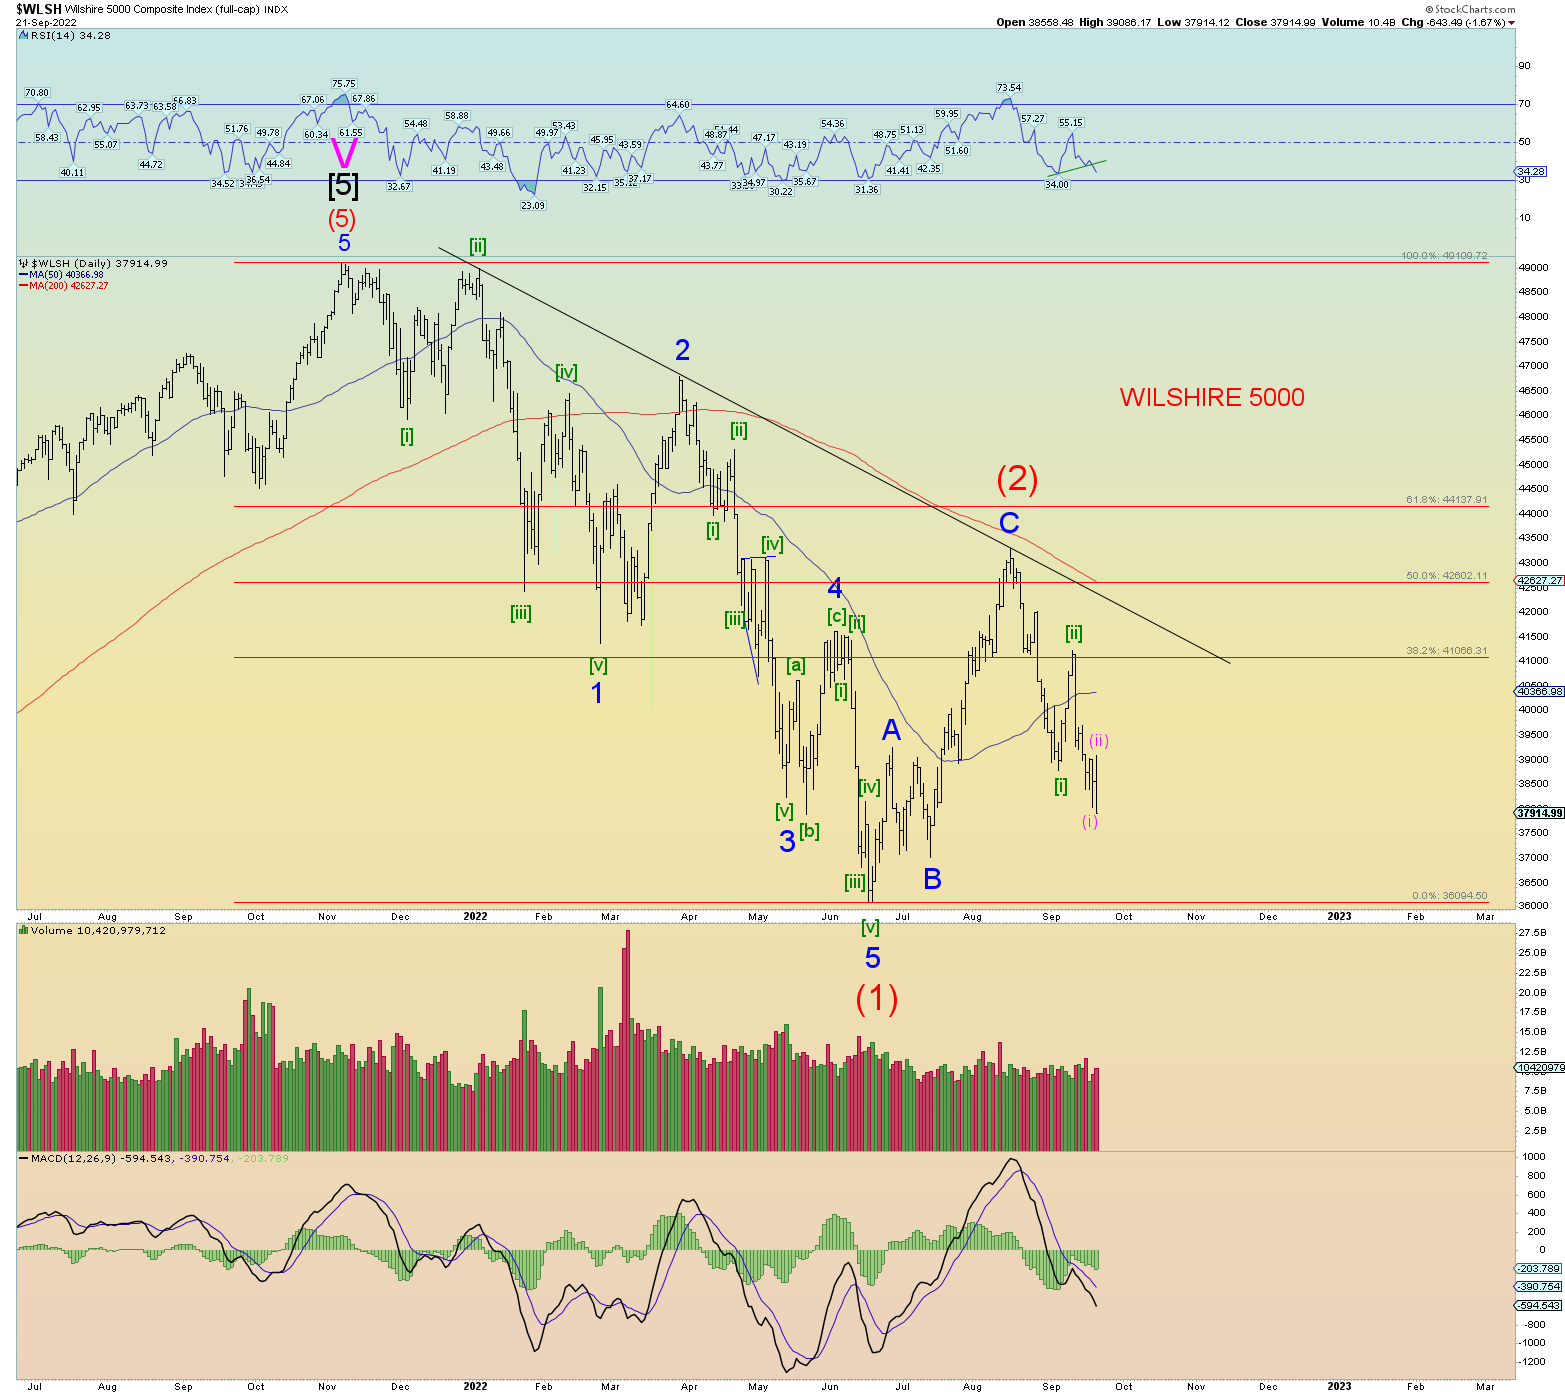
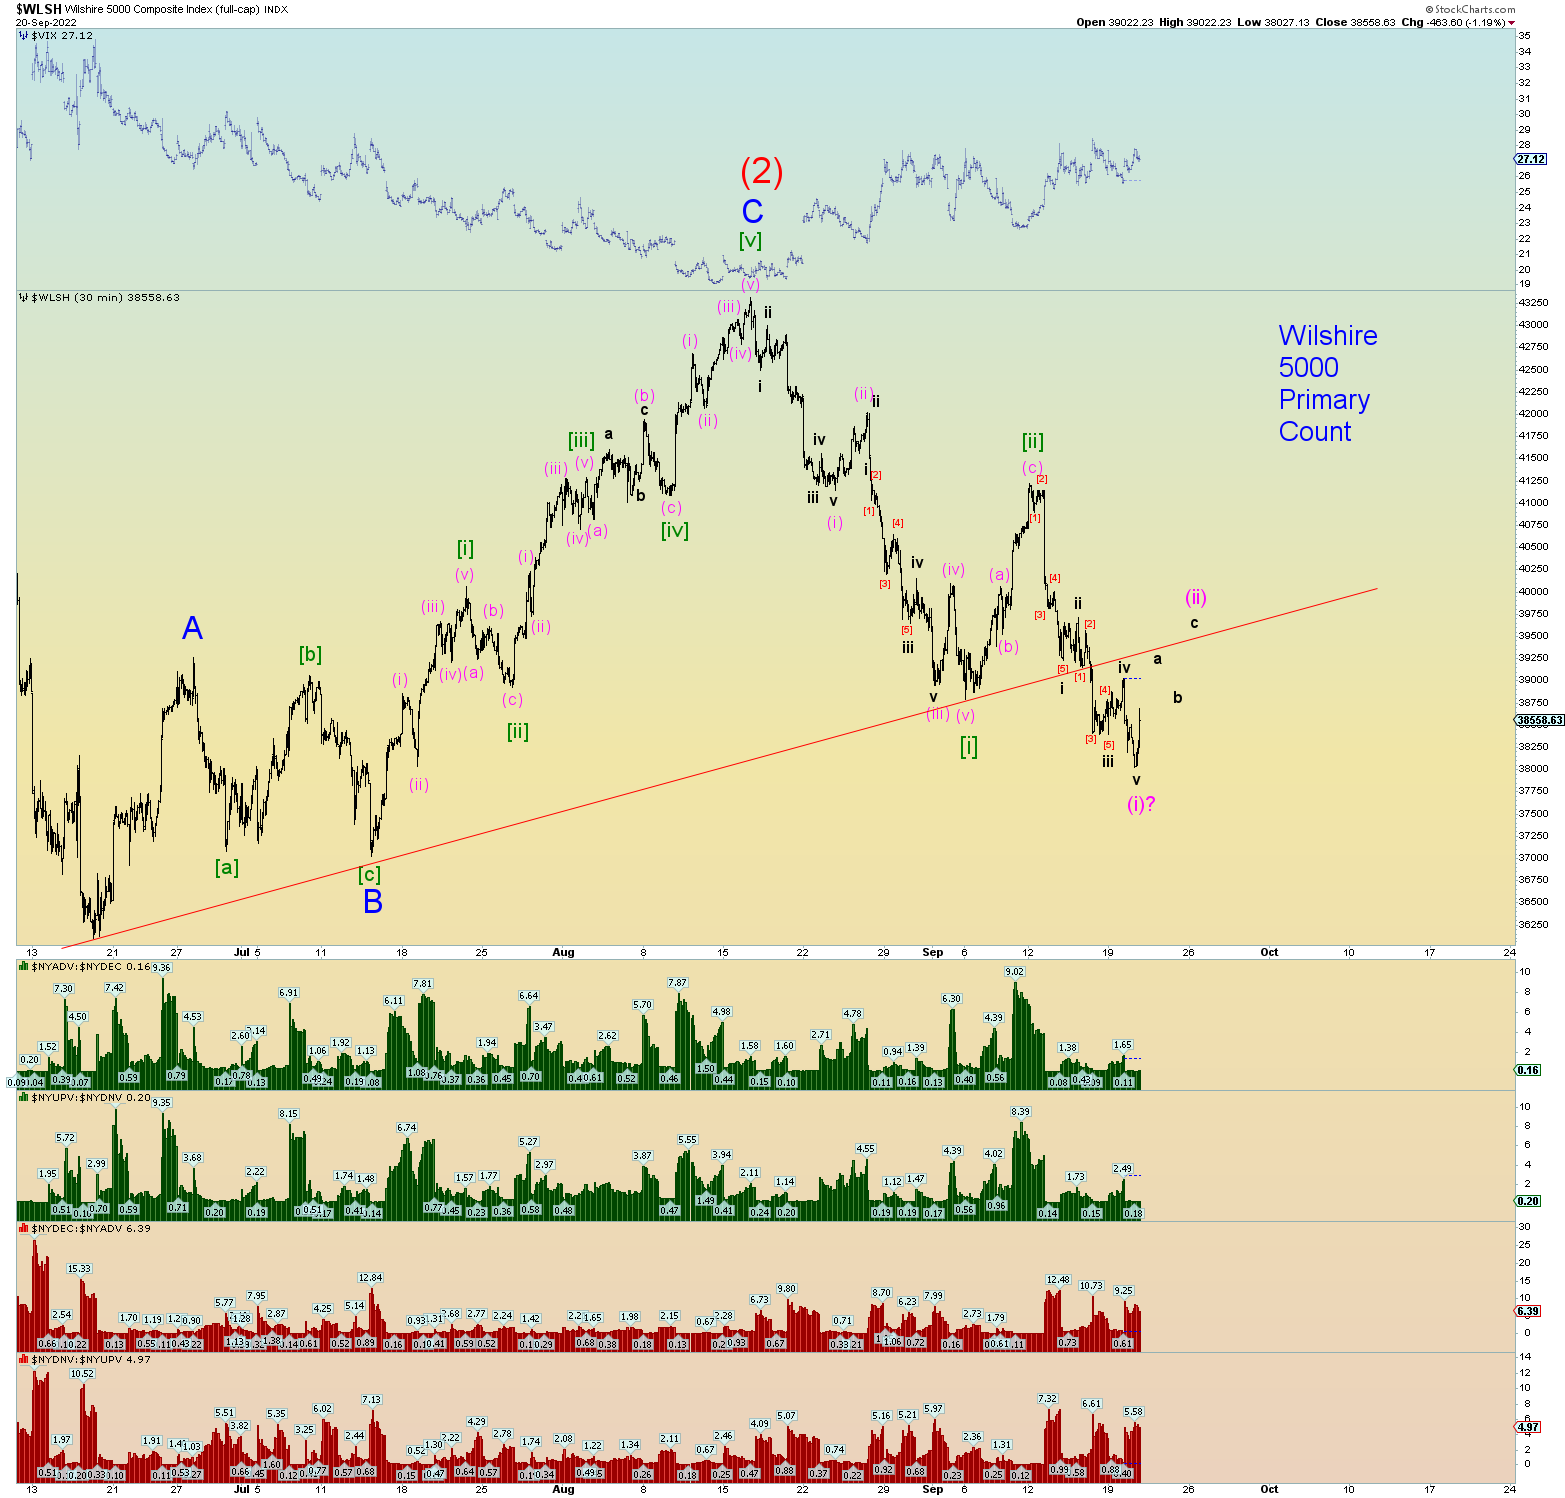
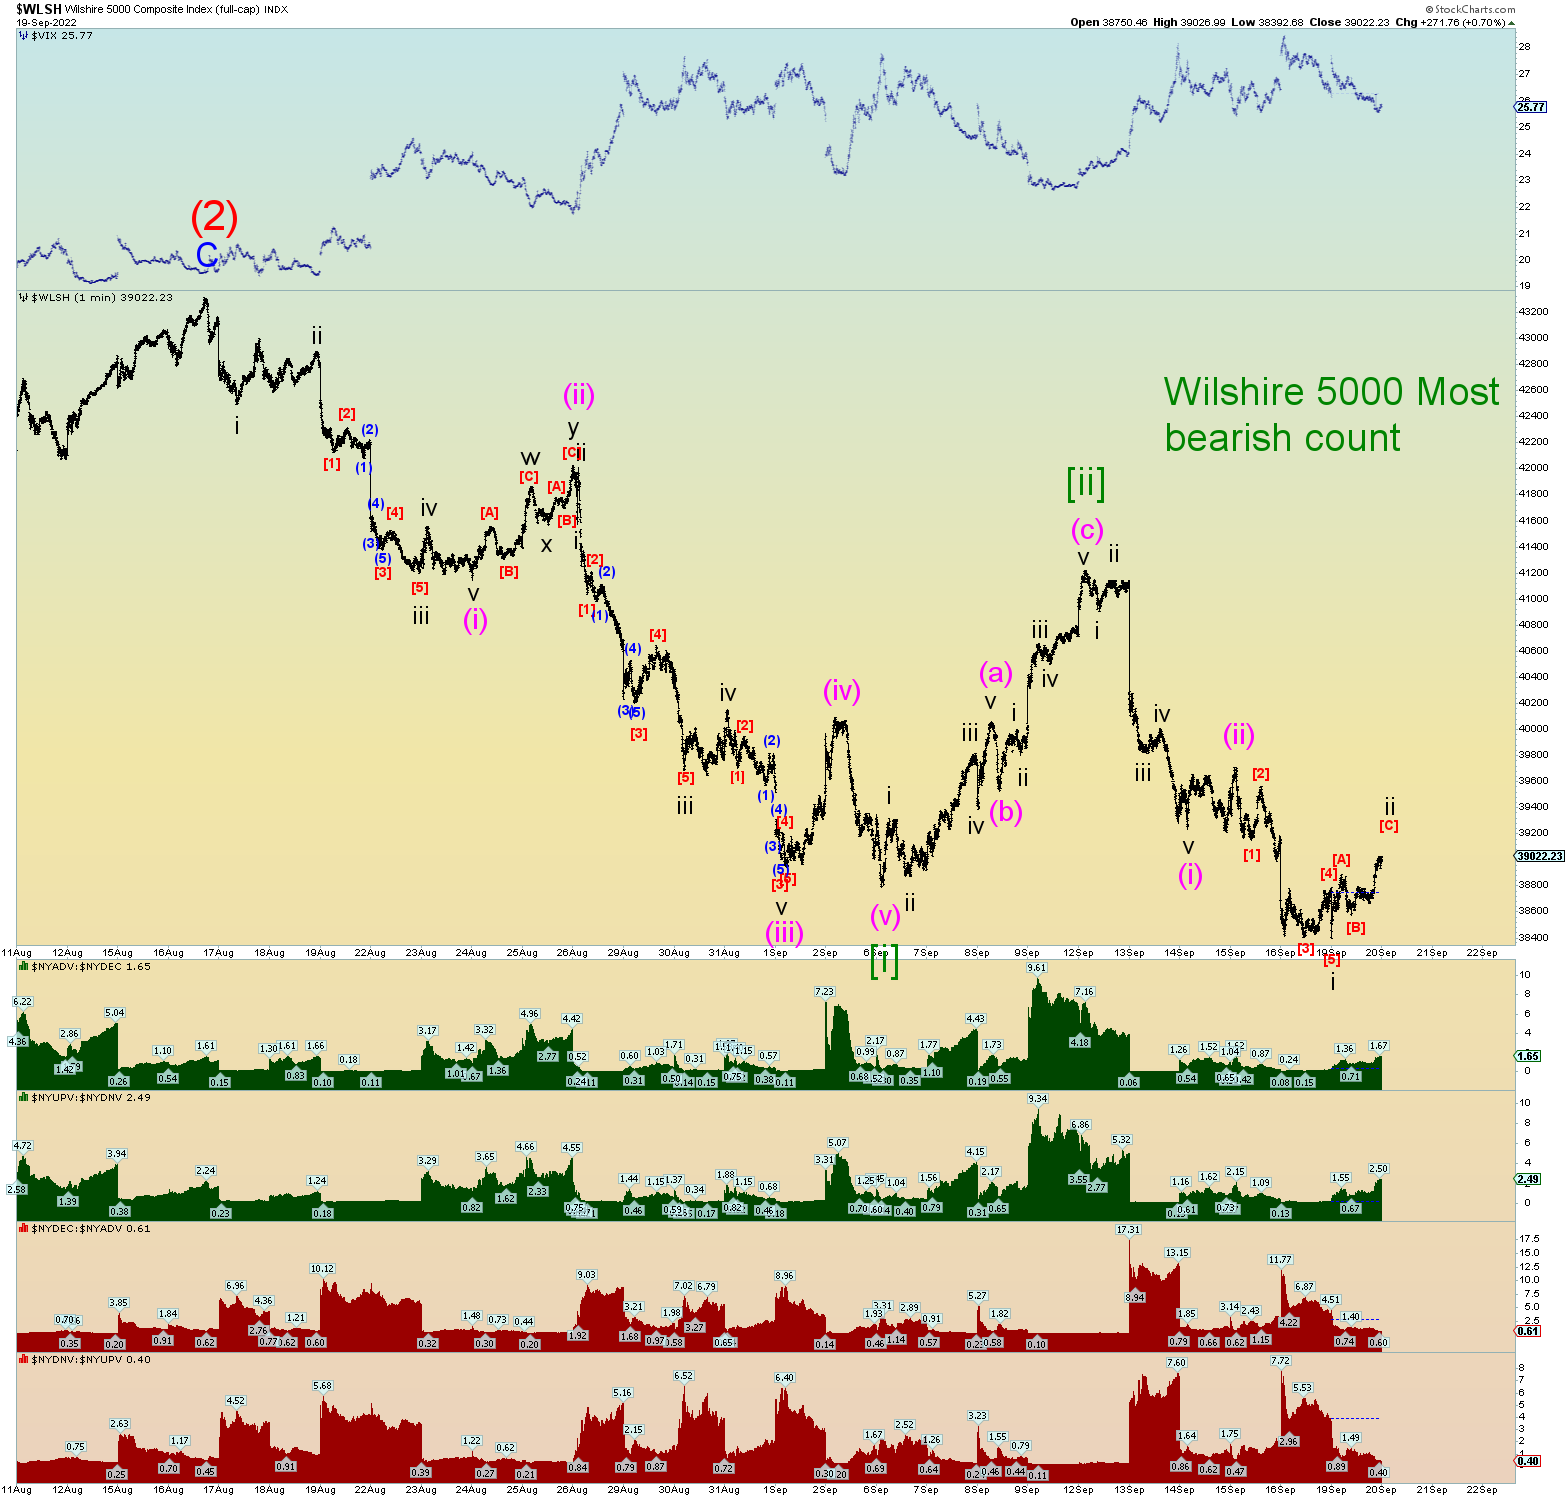
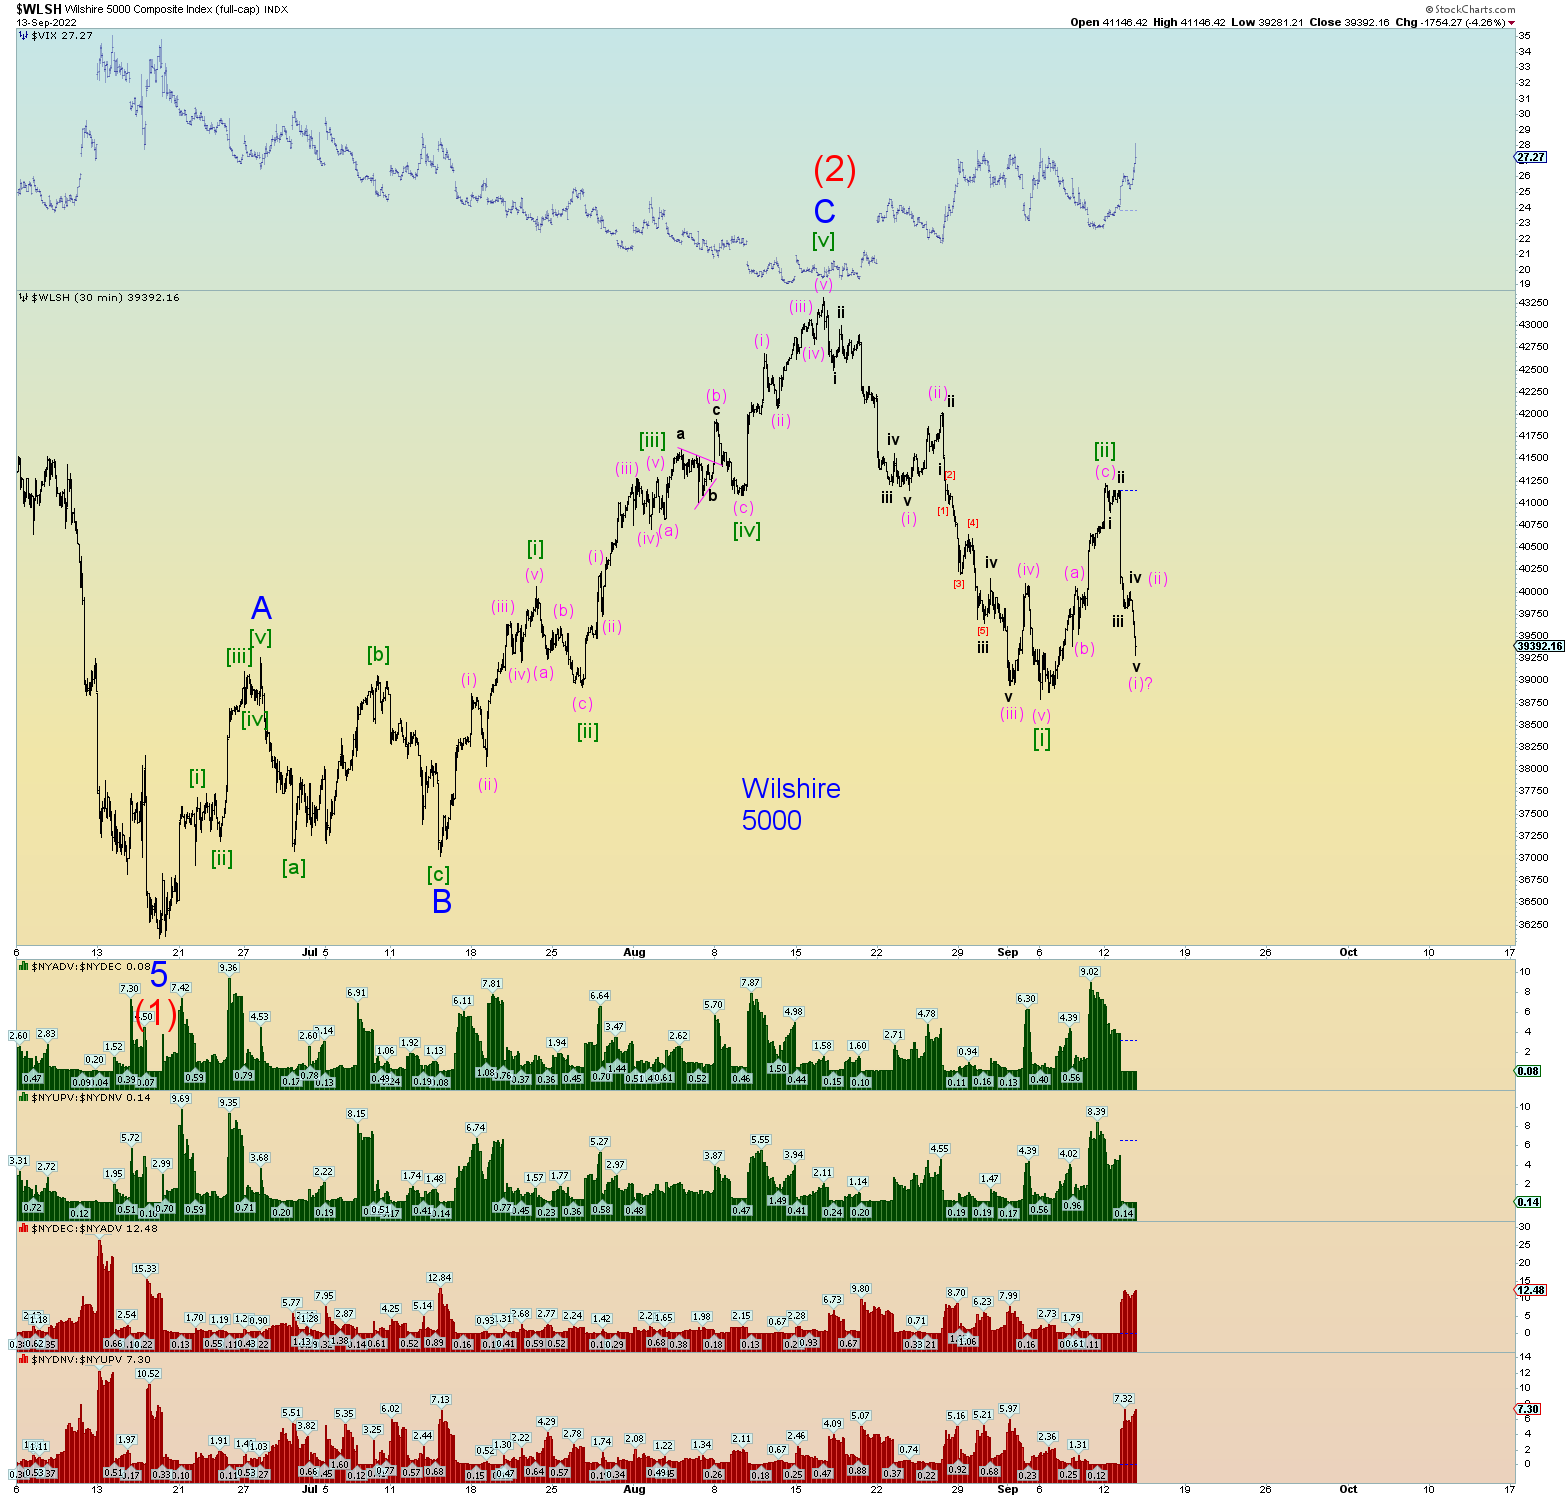
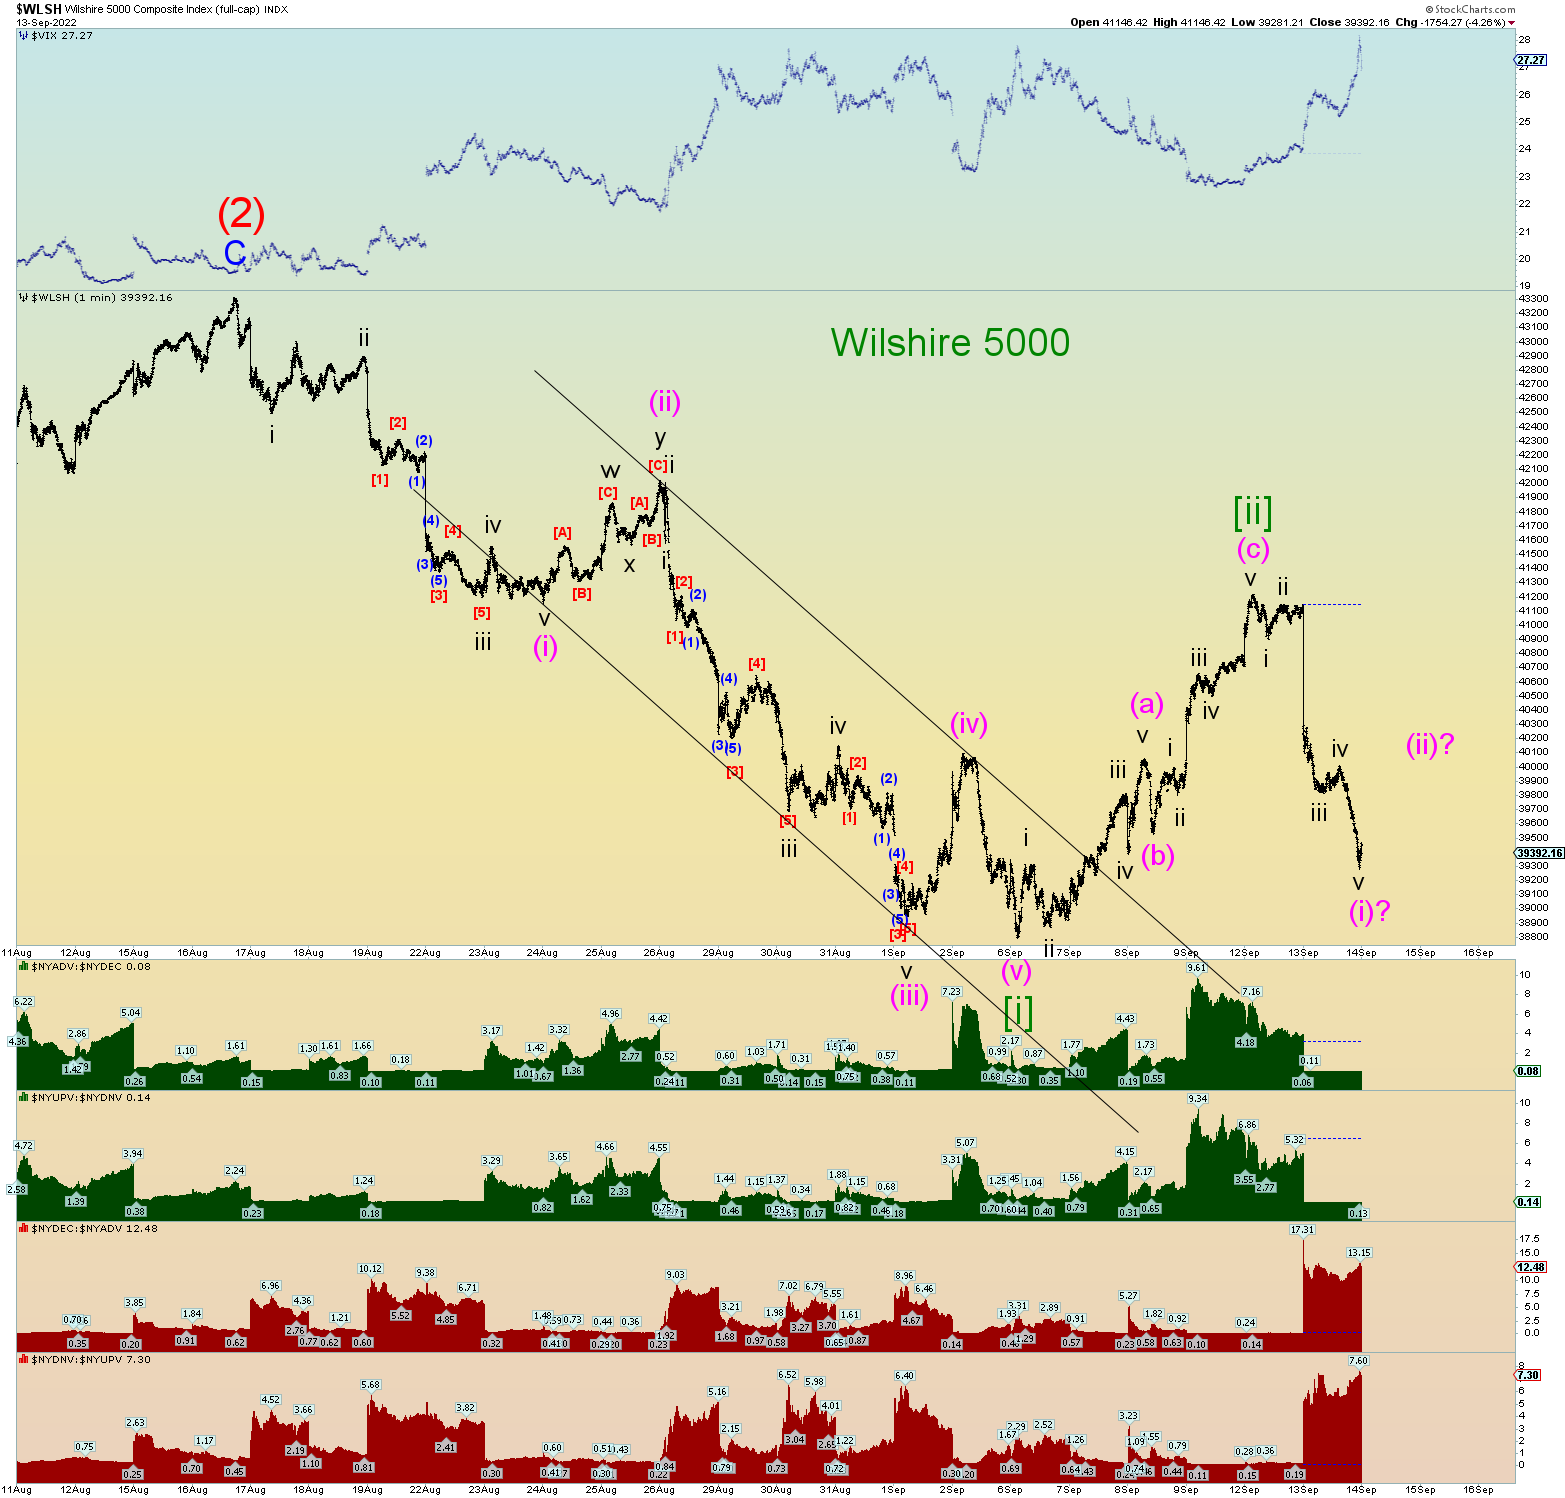
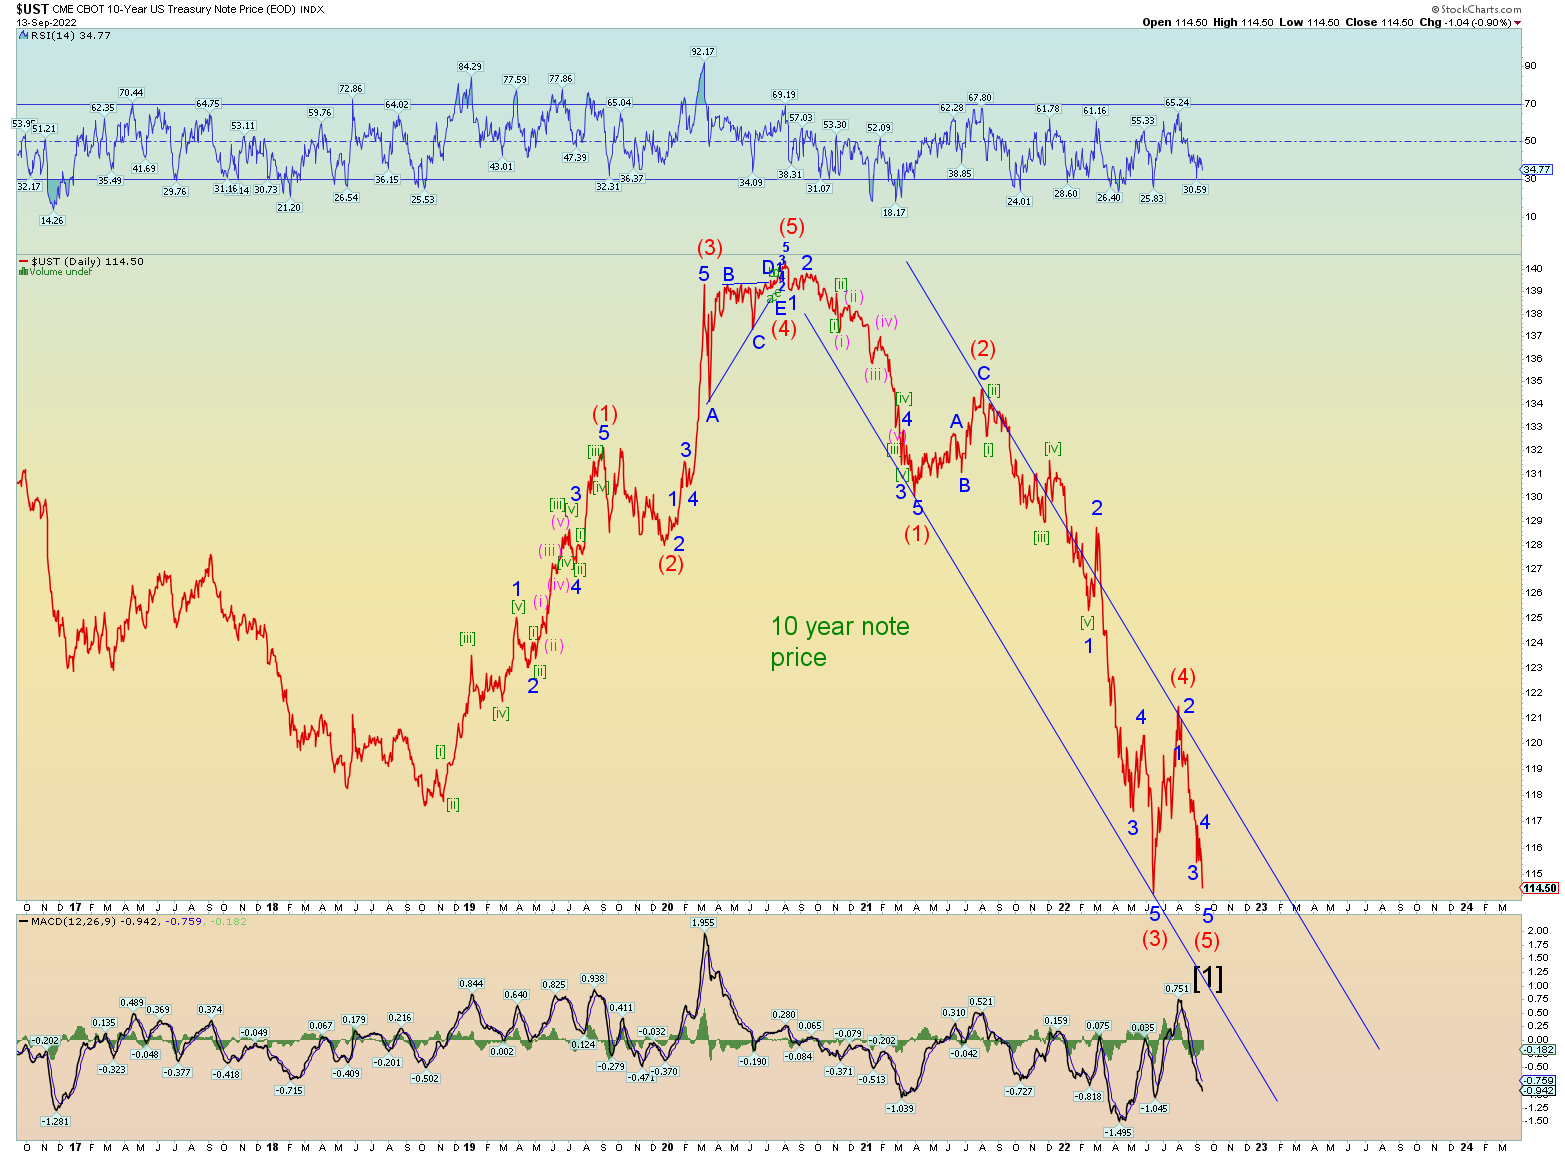
The primary count is that Minute [iii] of Minor 1 of Intermediate (3) ended at yesterday’s low. The overnight futures which at one point, were indicating yet again a lower low, recovered upon the “news” of the Bank of England panicking and doing more QE to support their collapsing bond market.
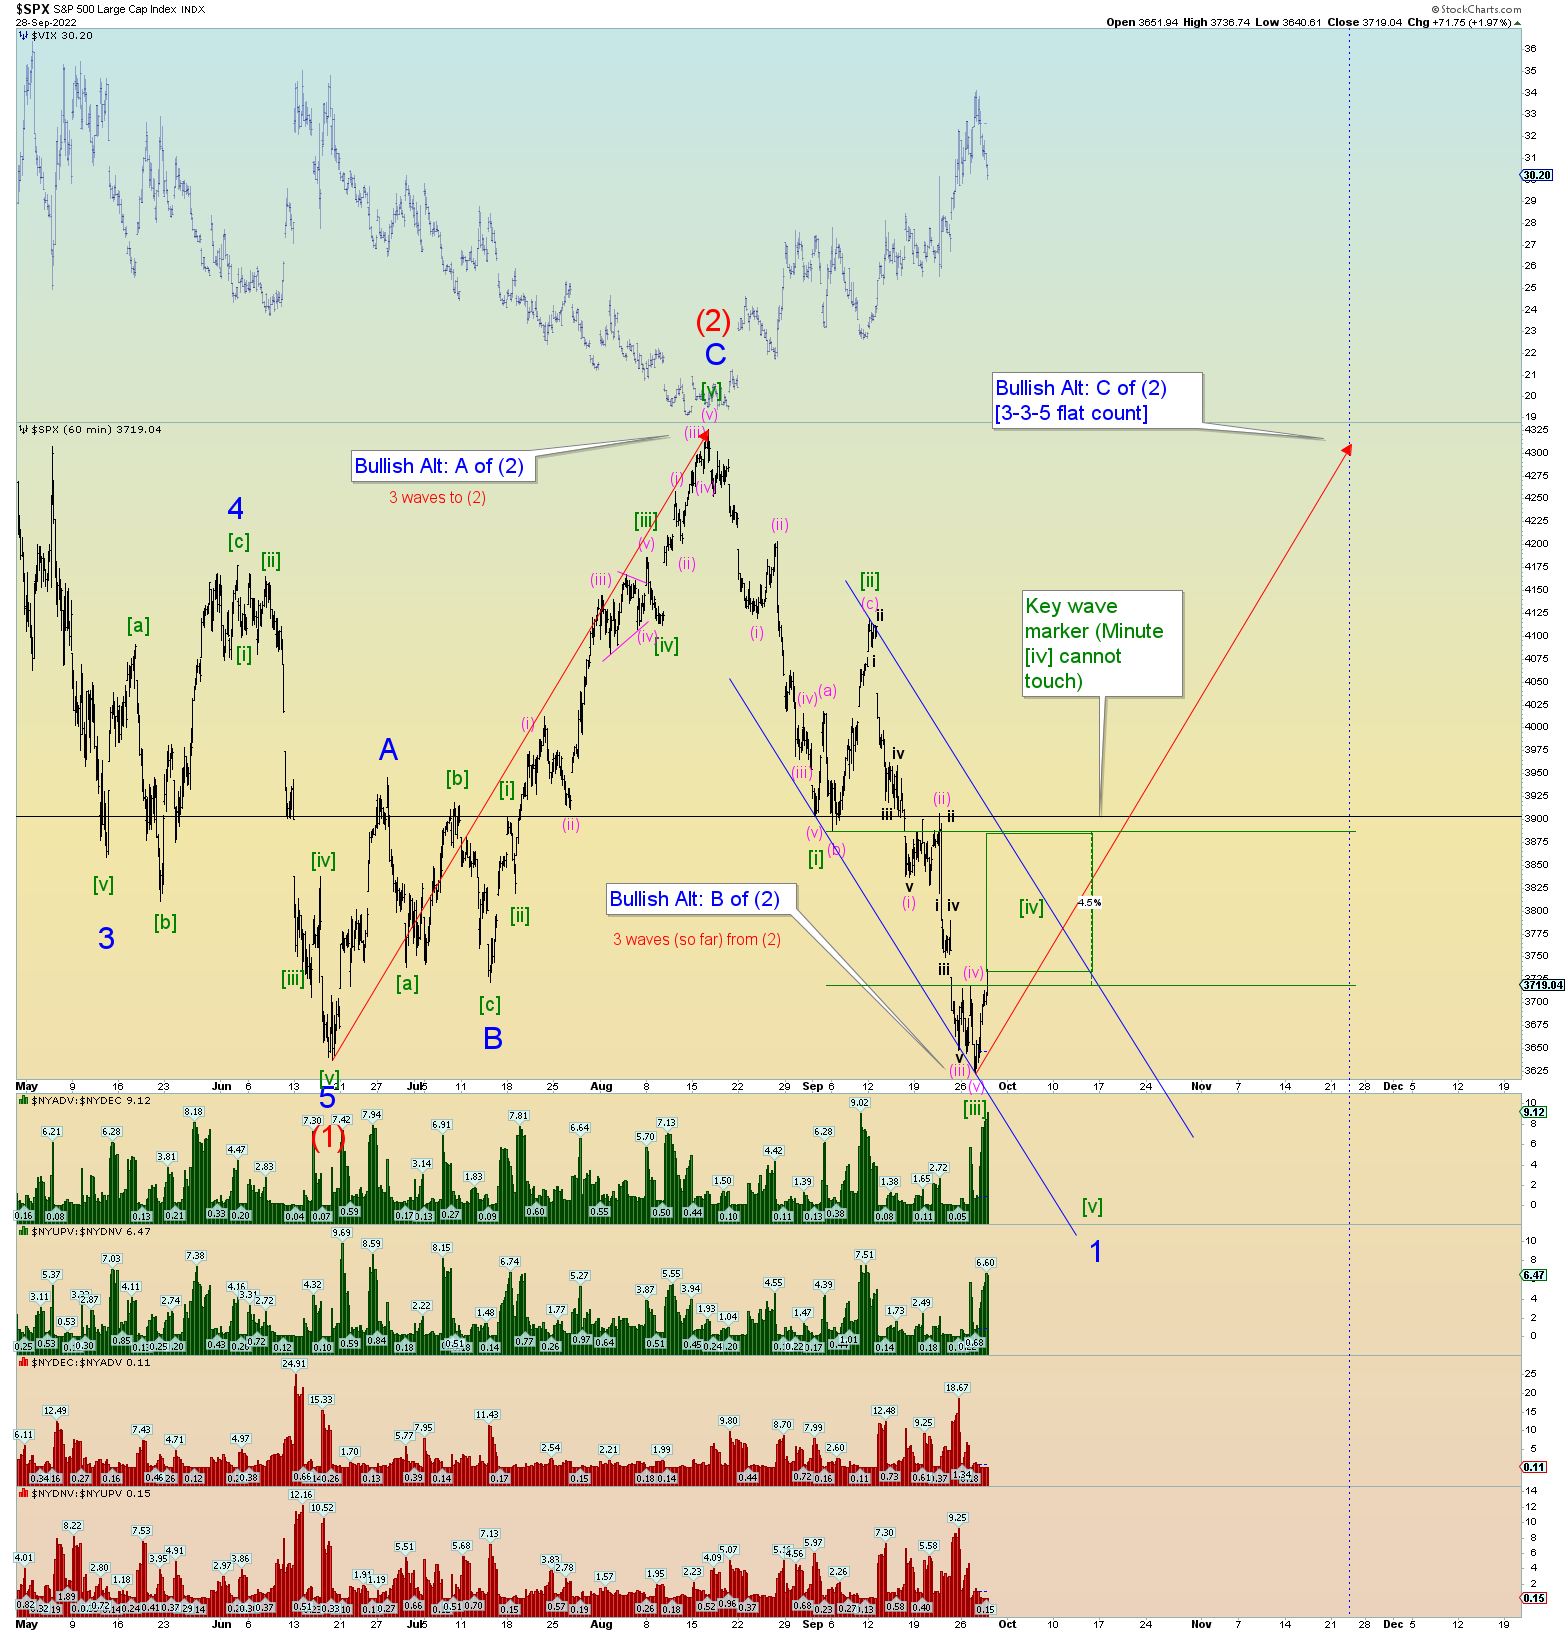
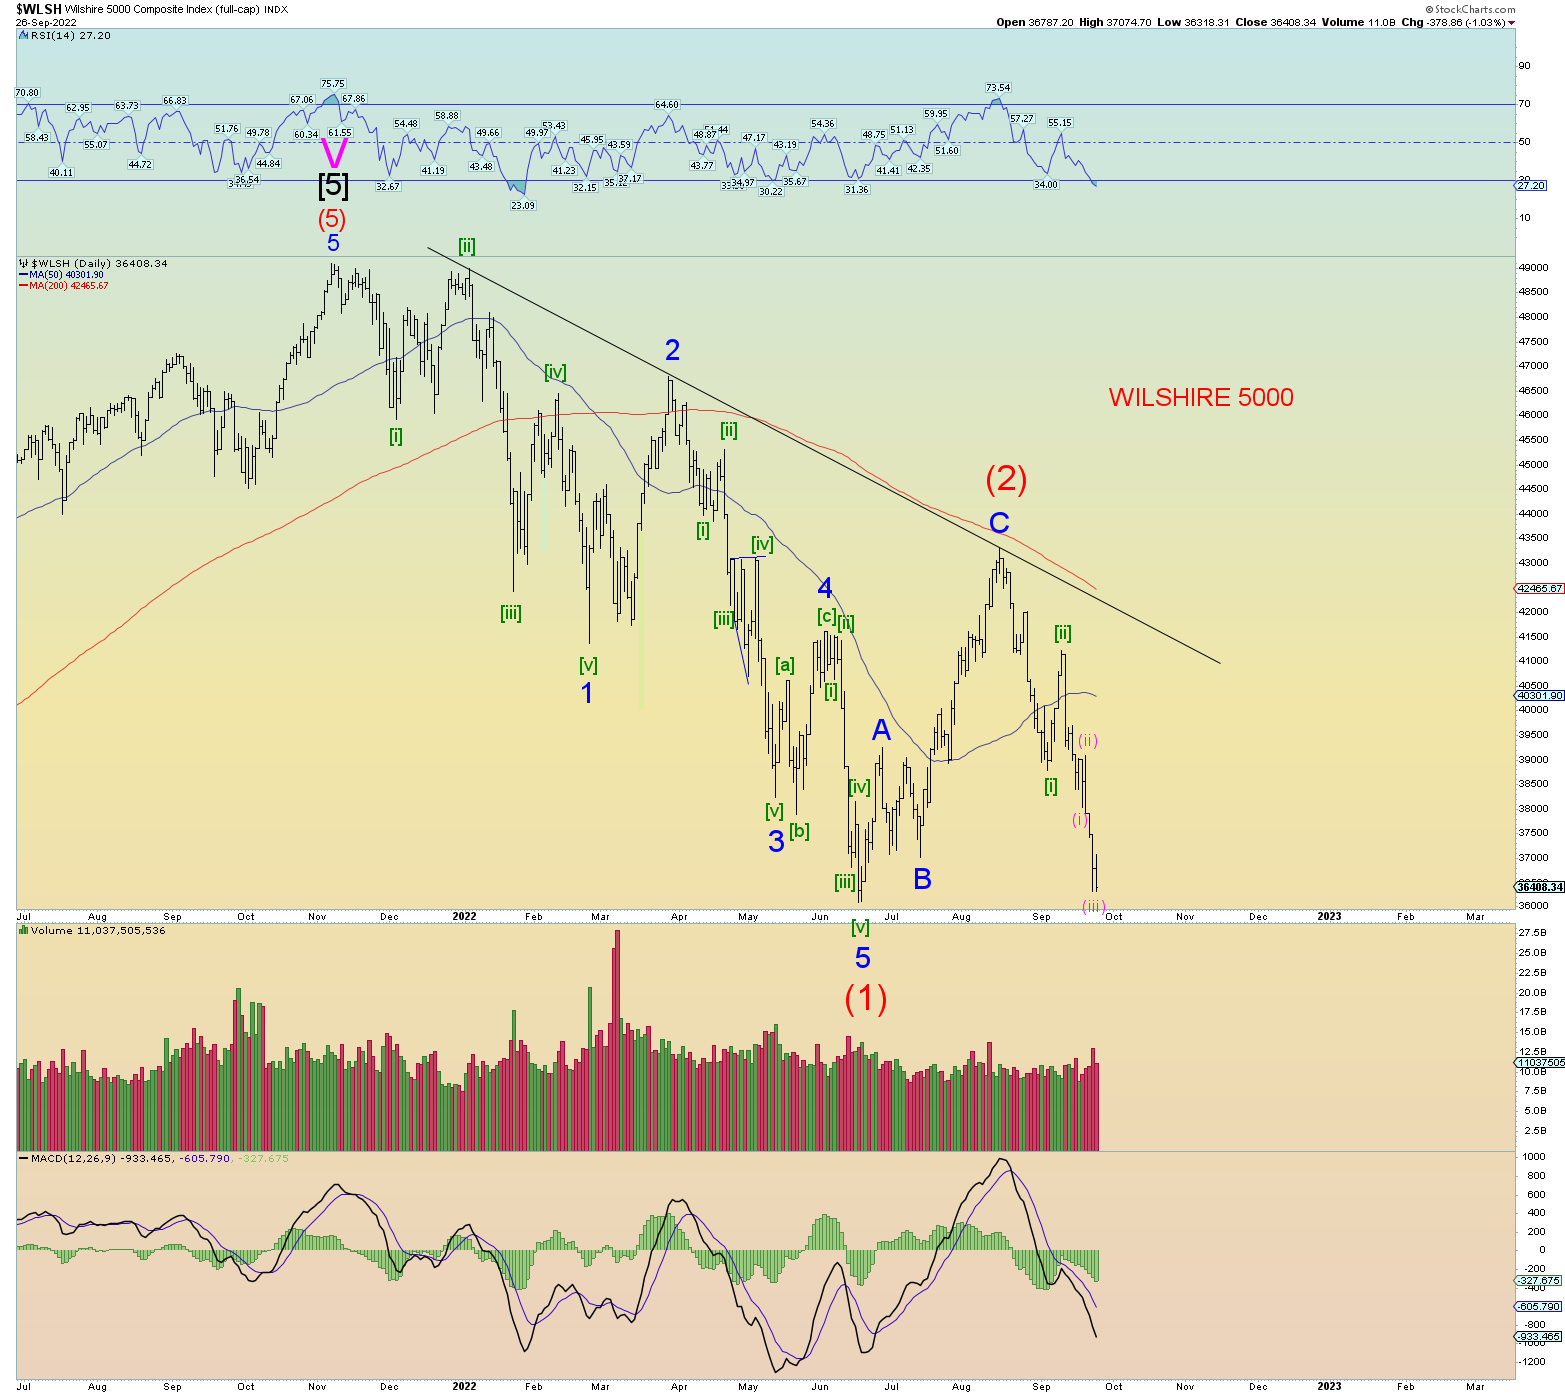
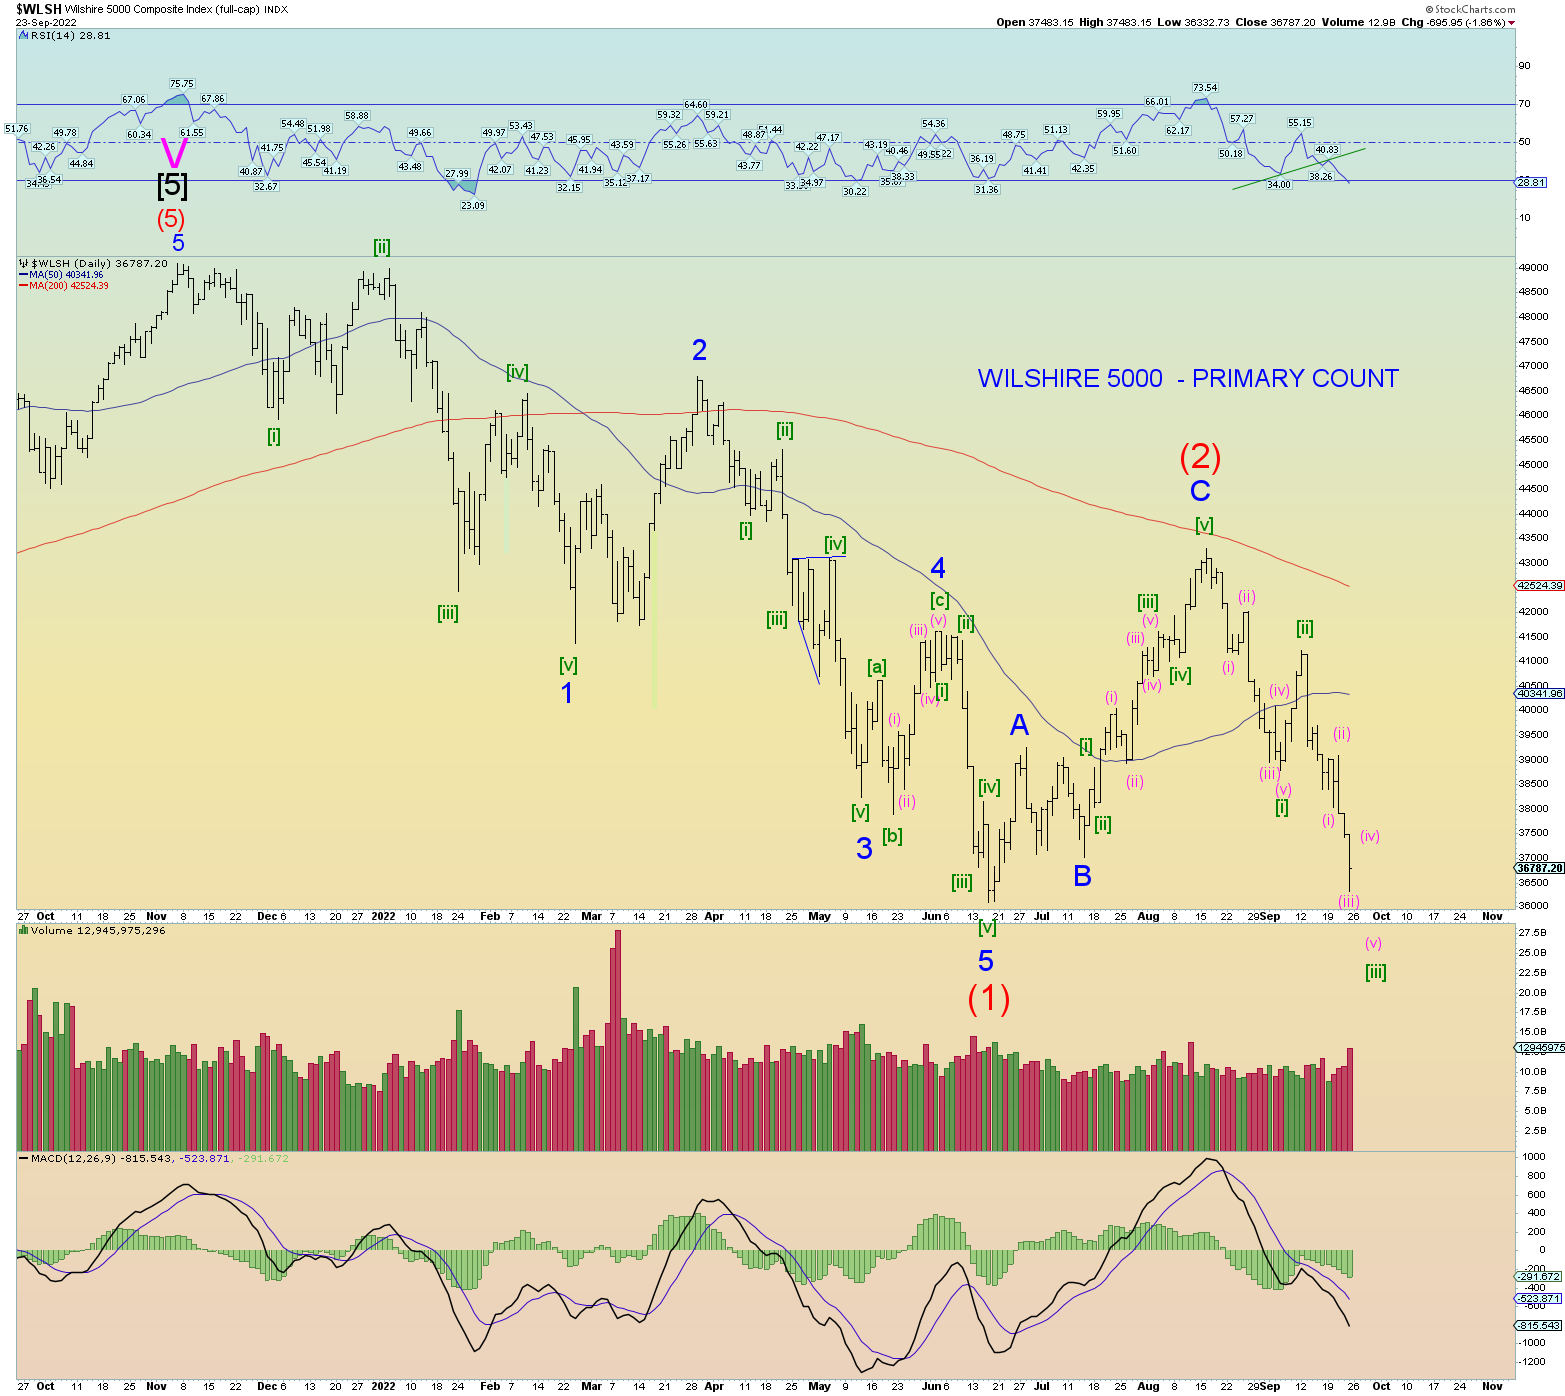
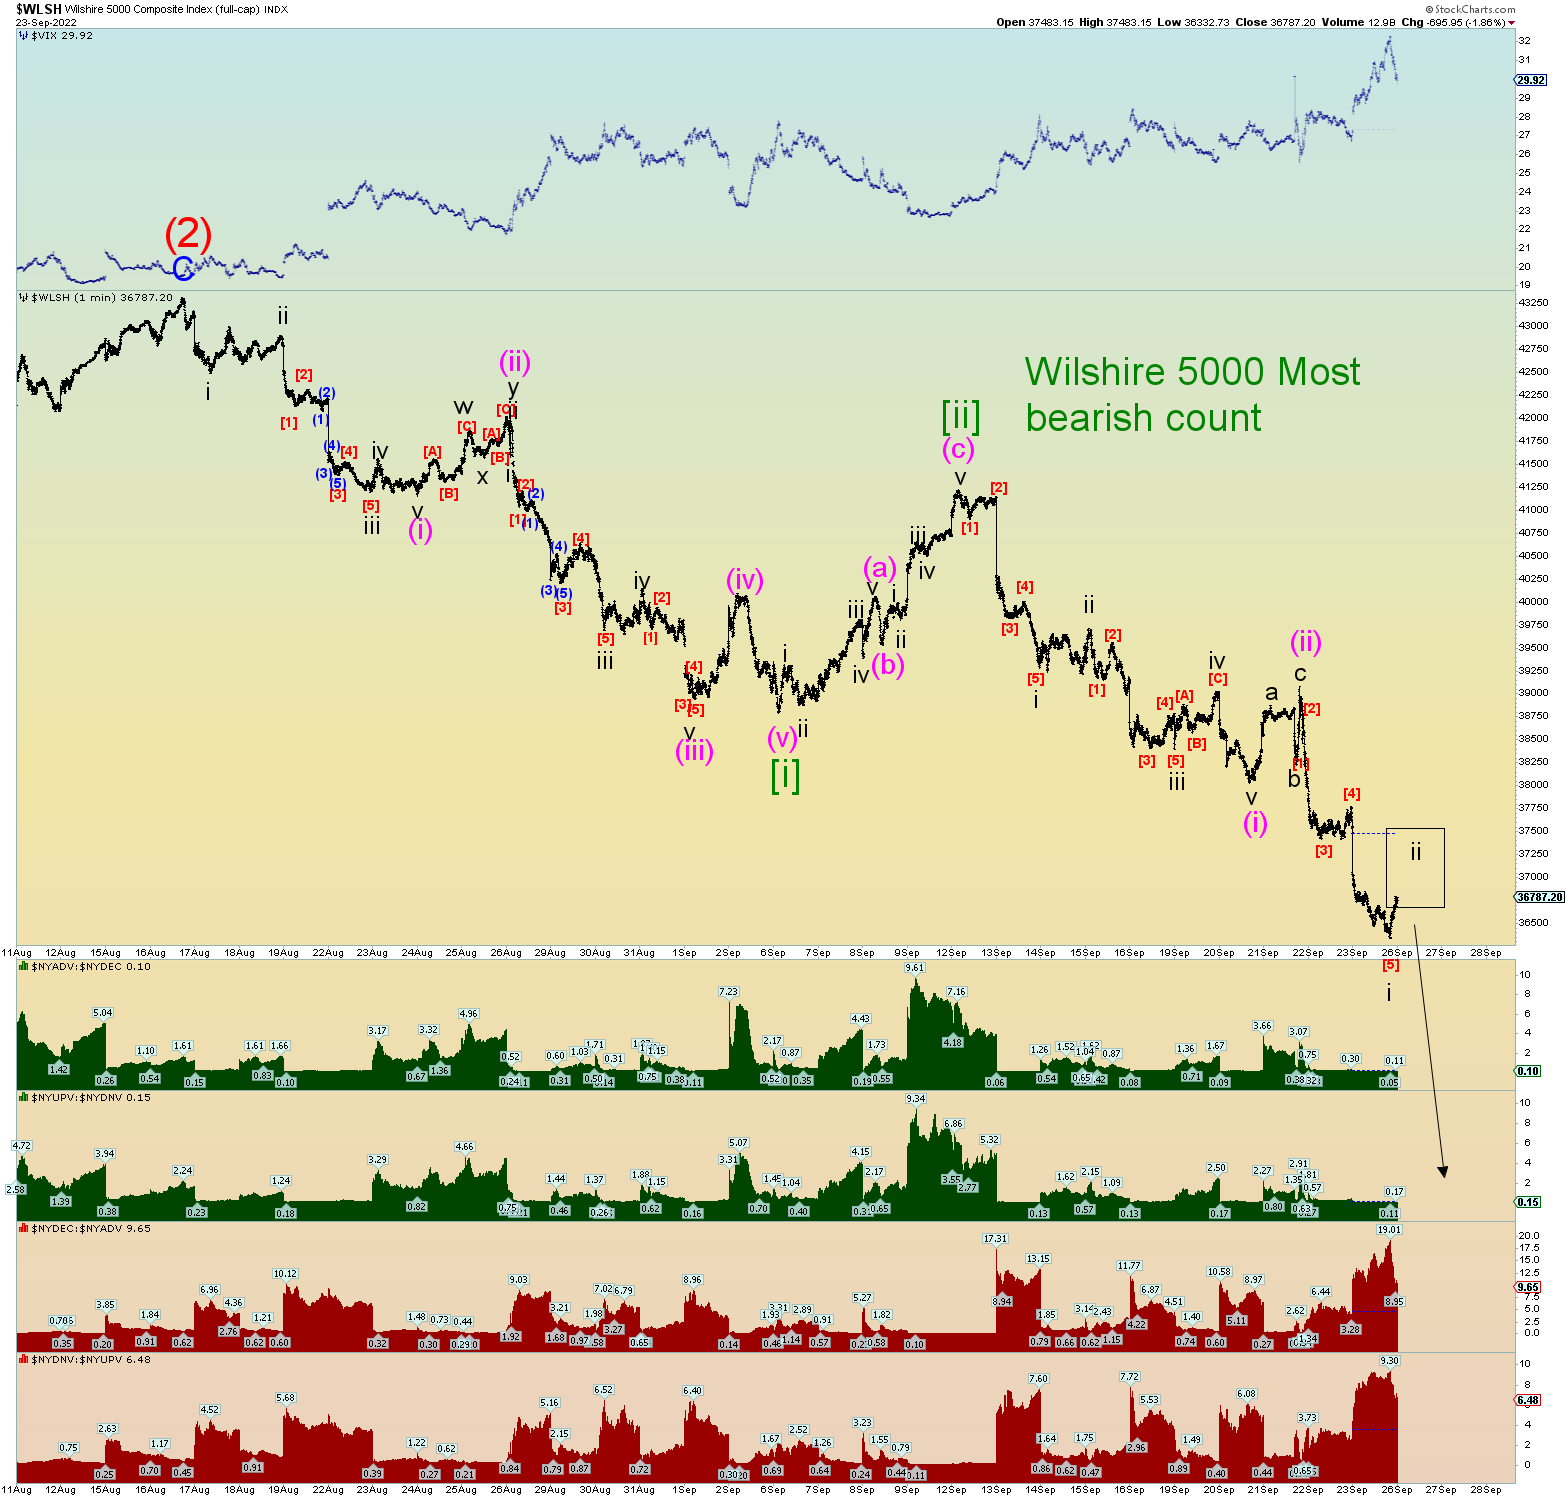
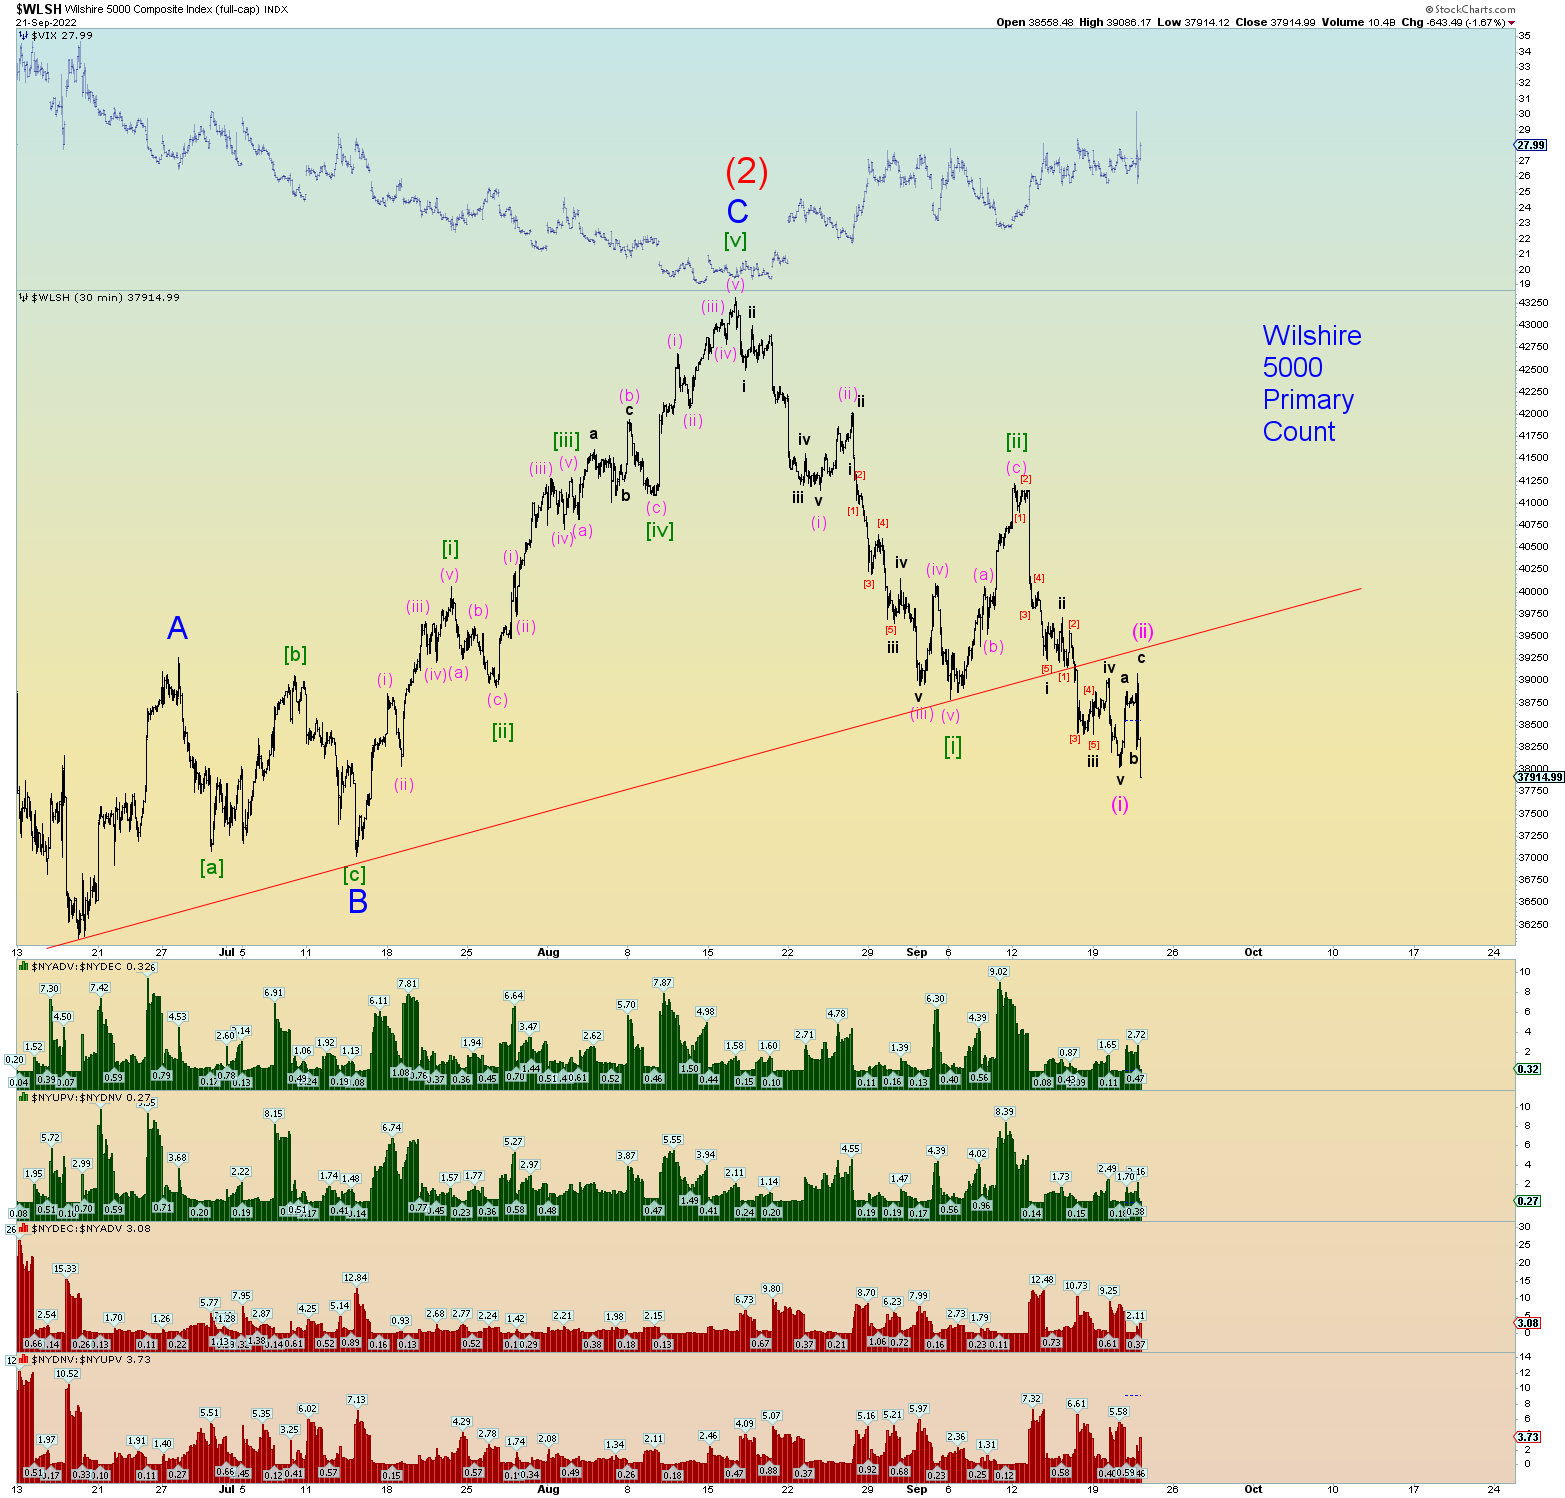
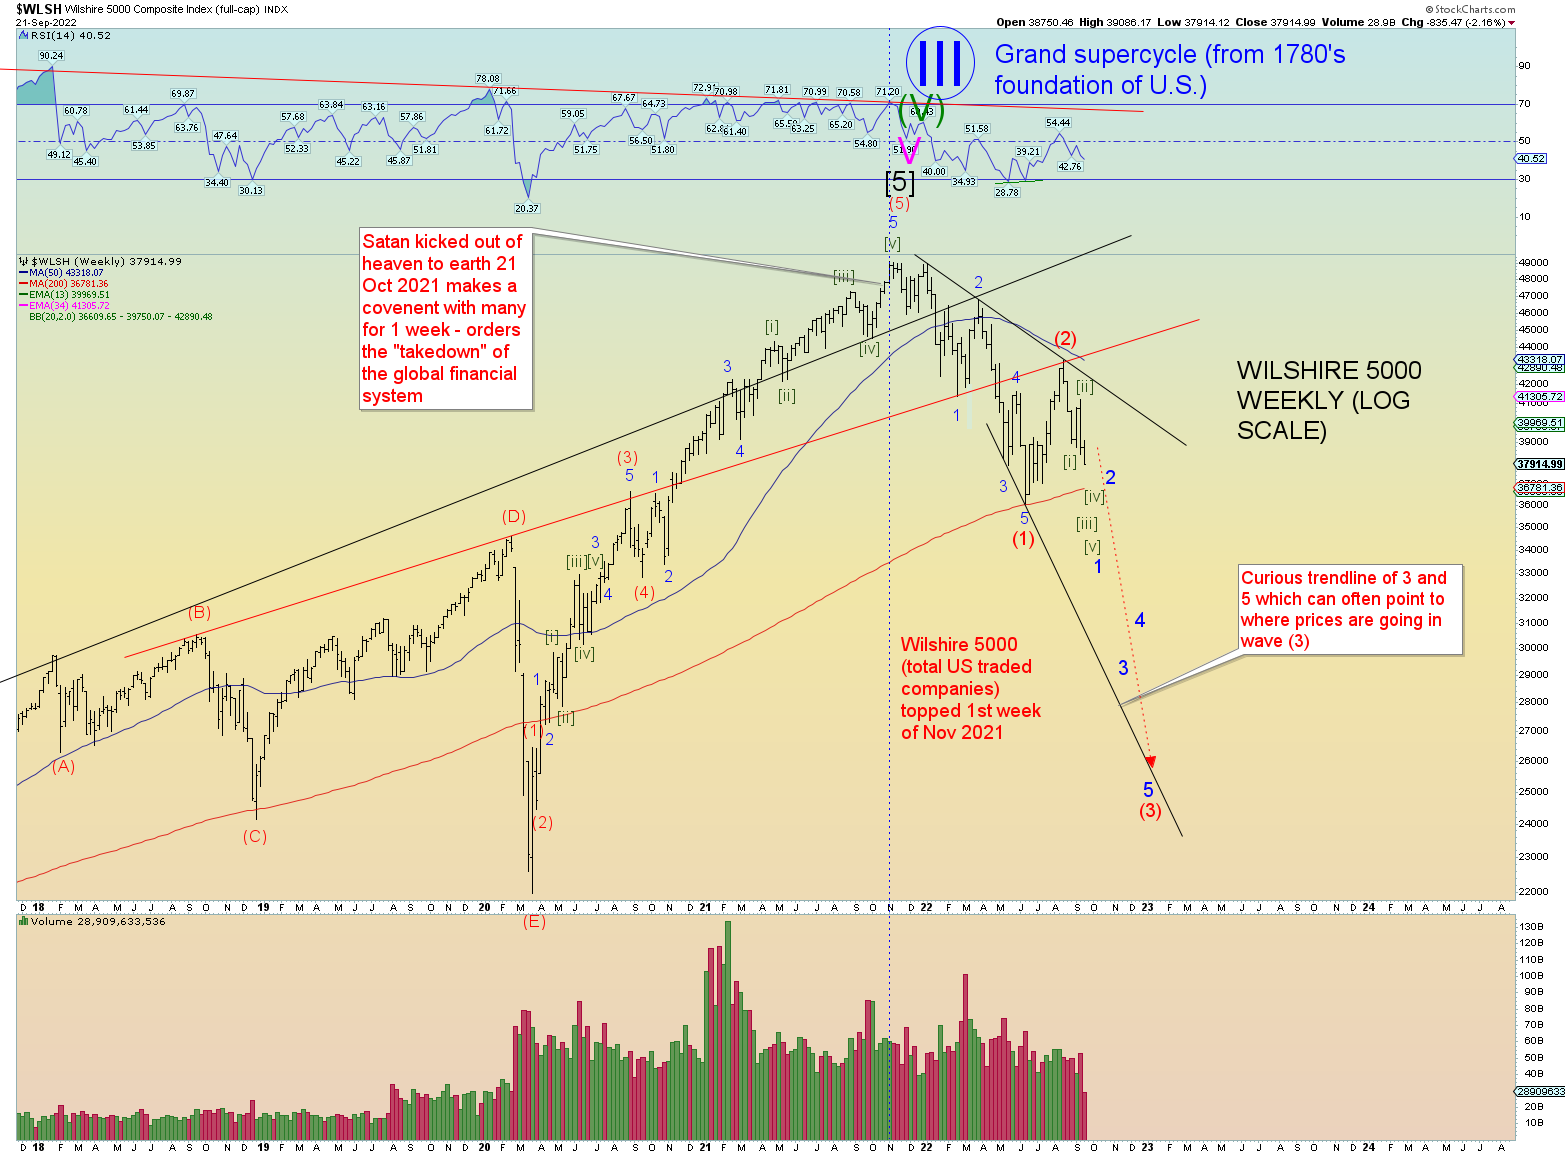
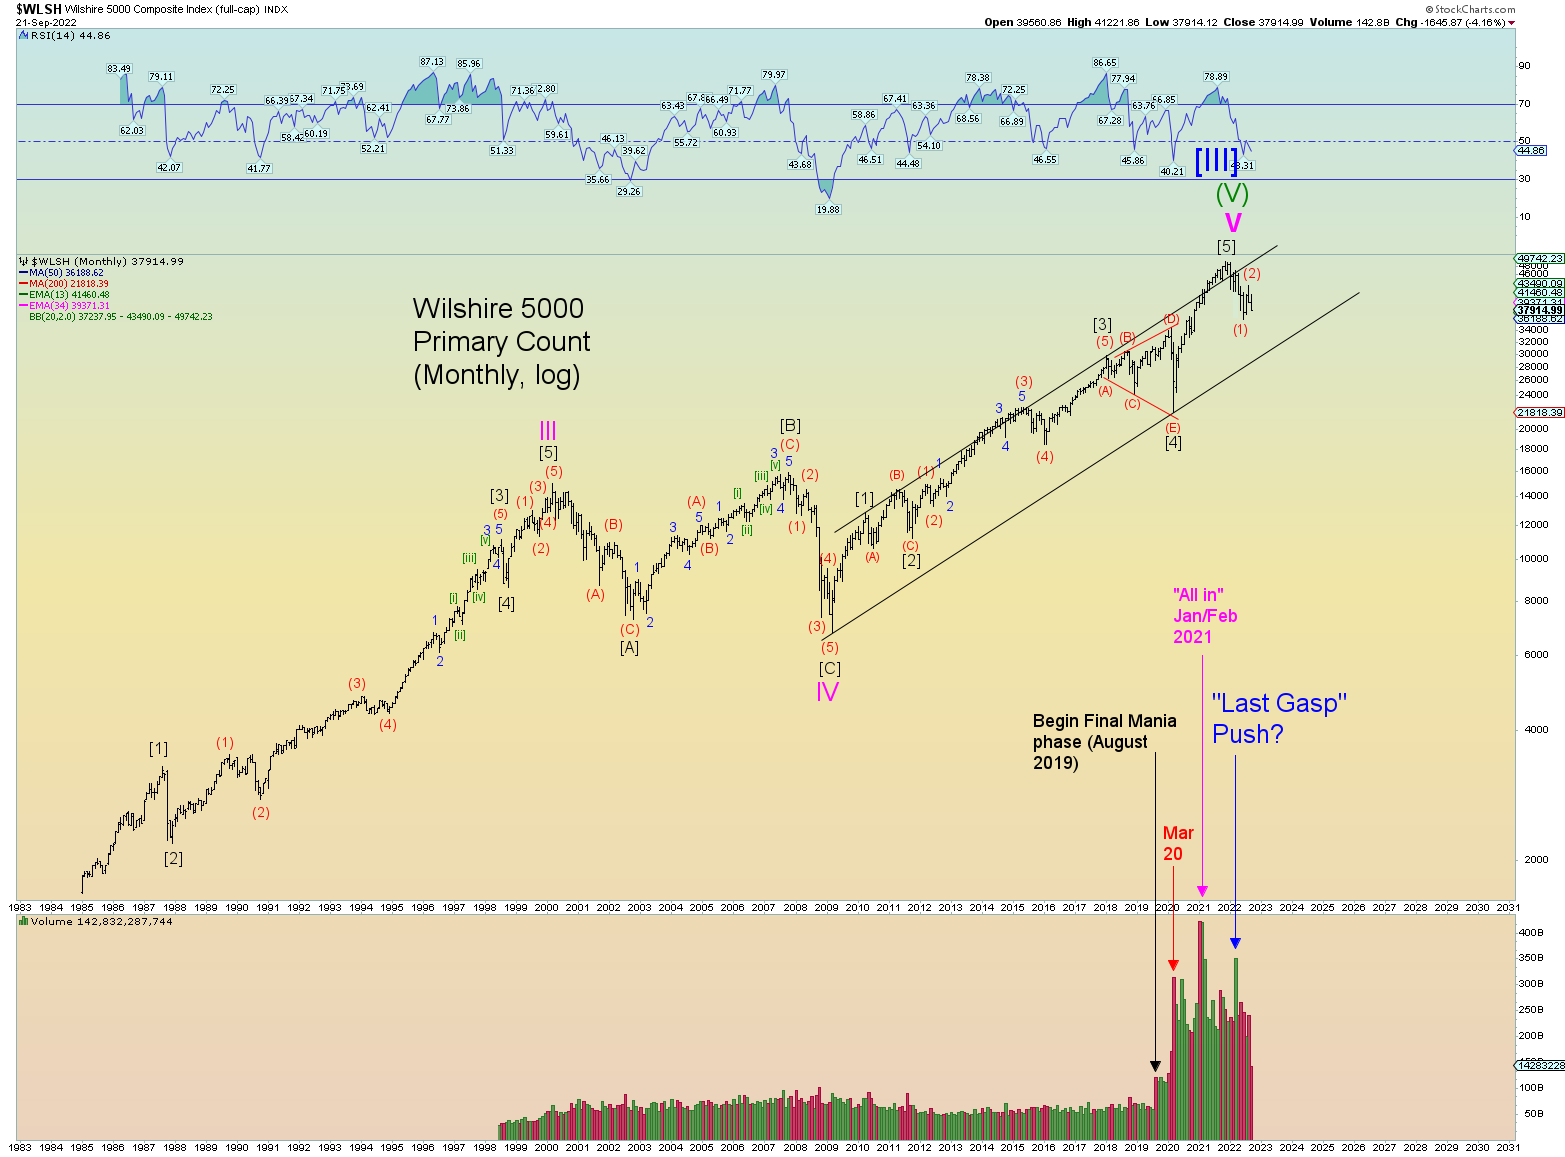
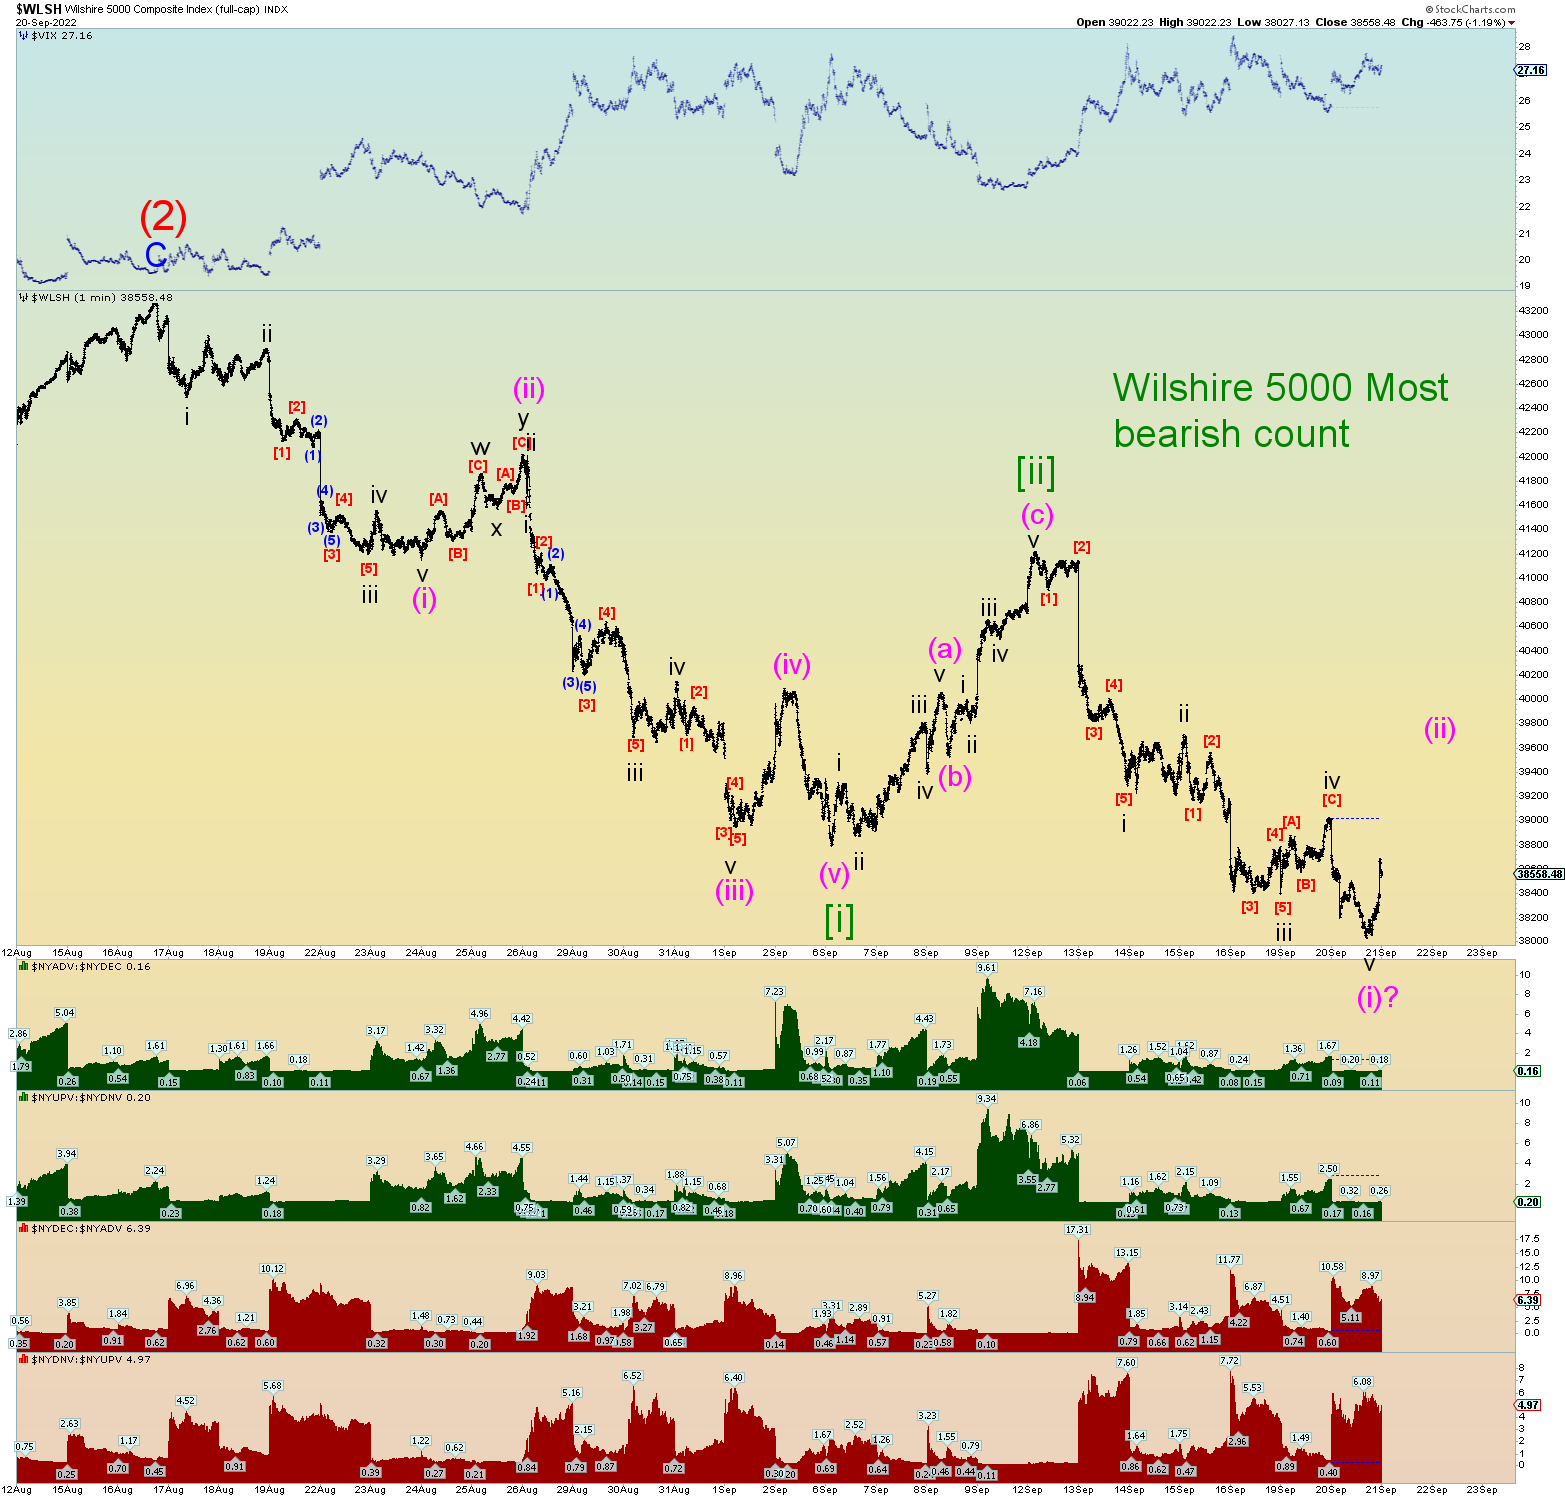
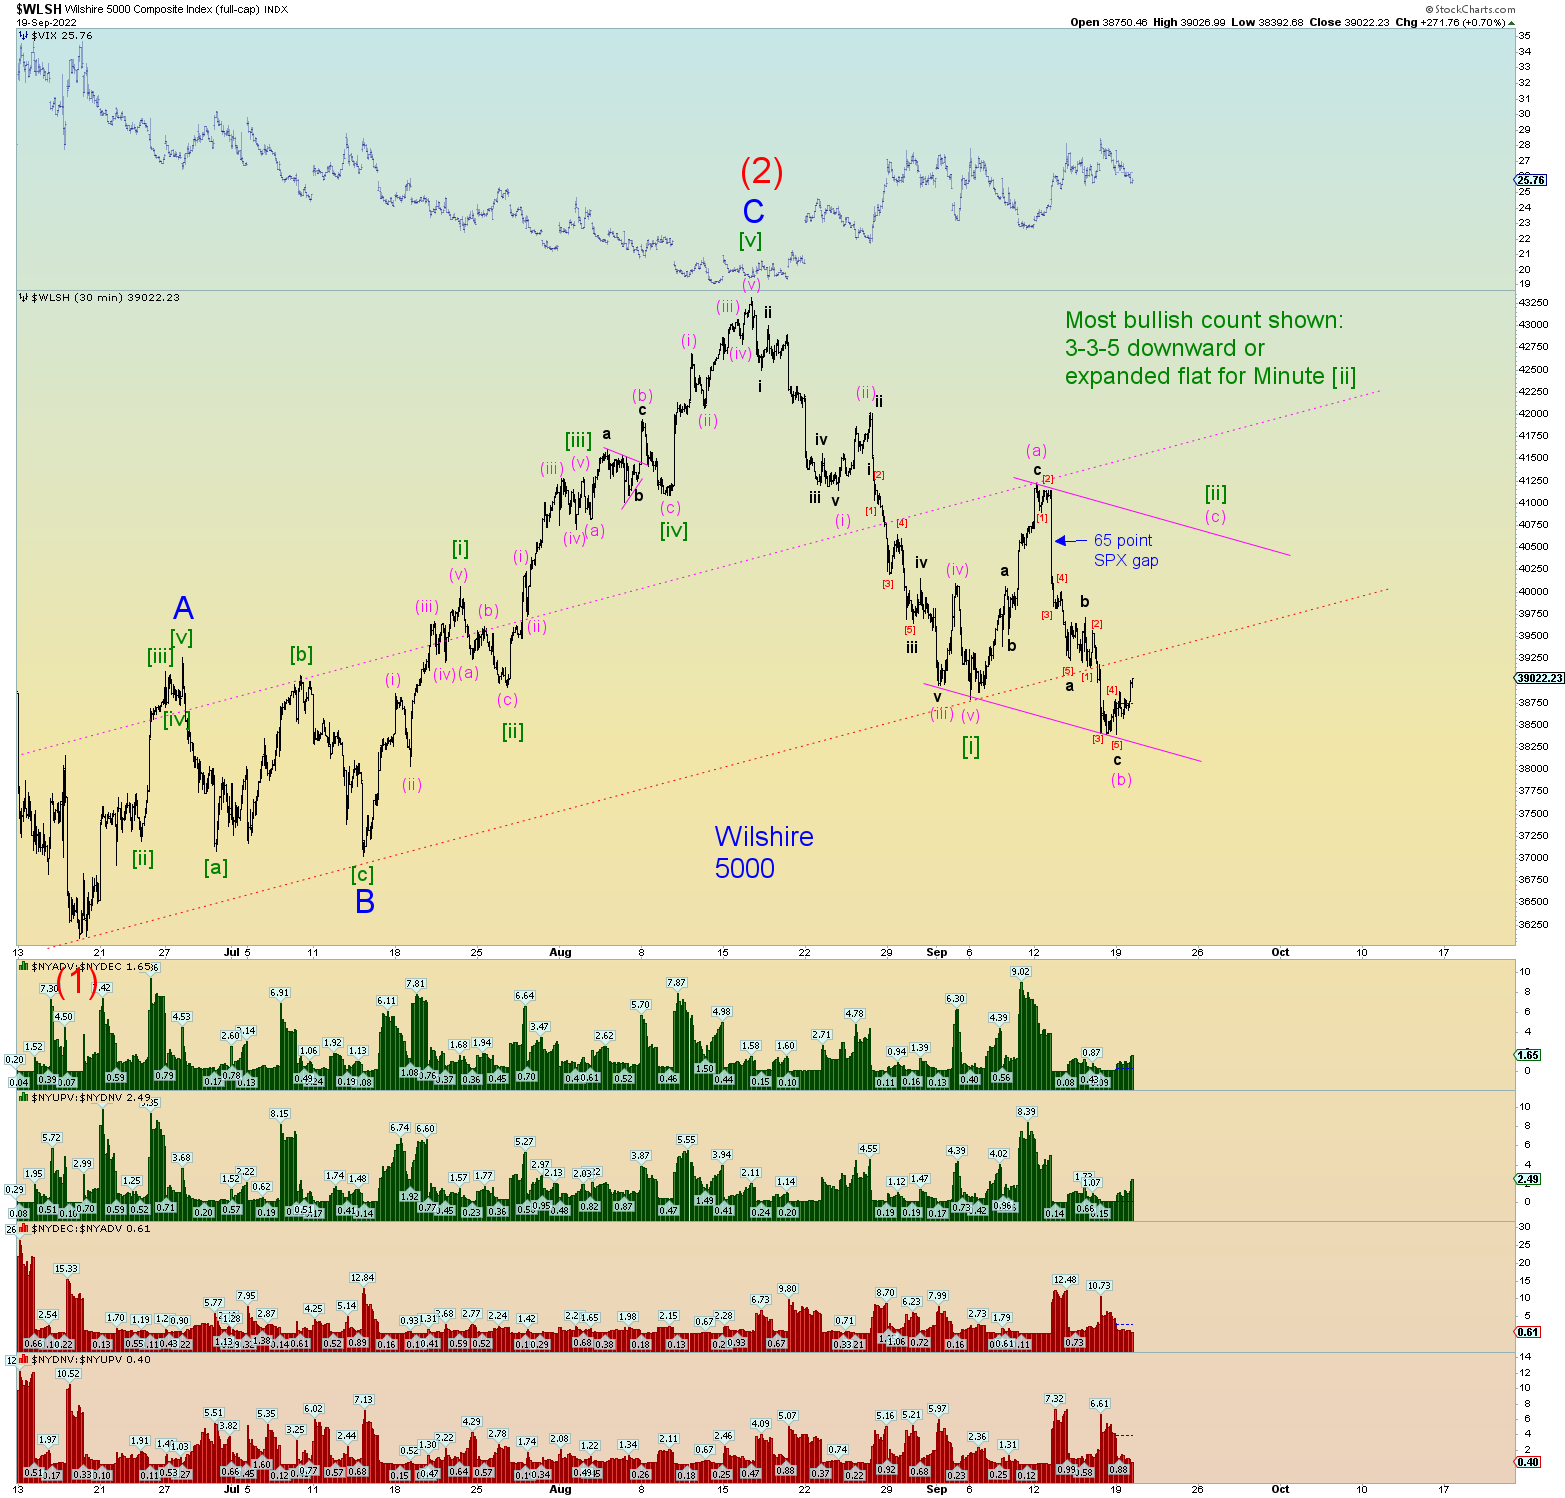
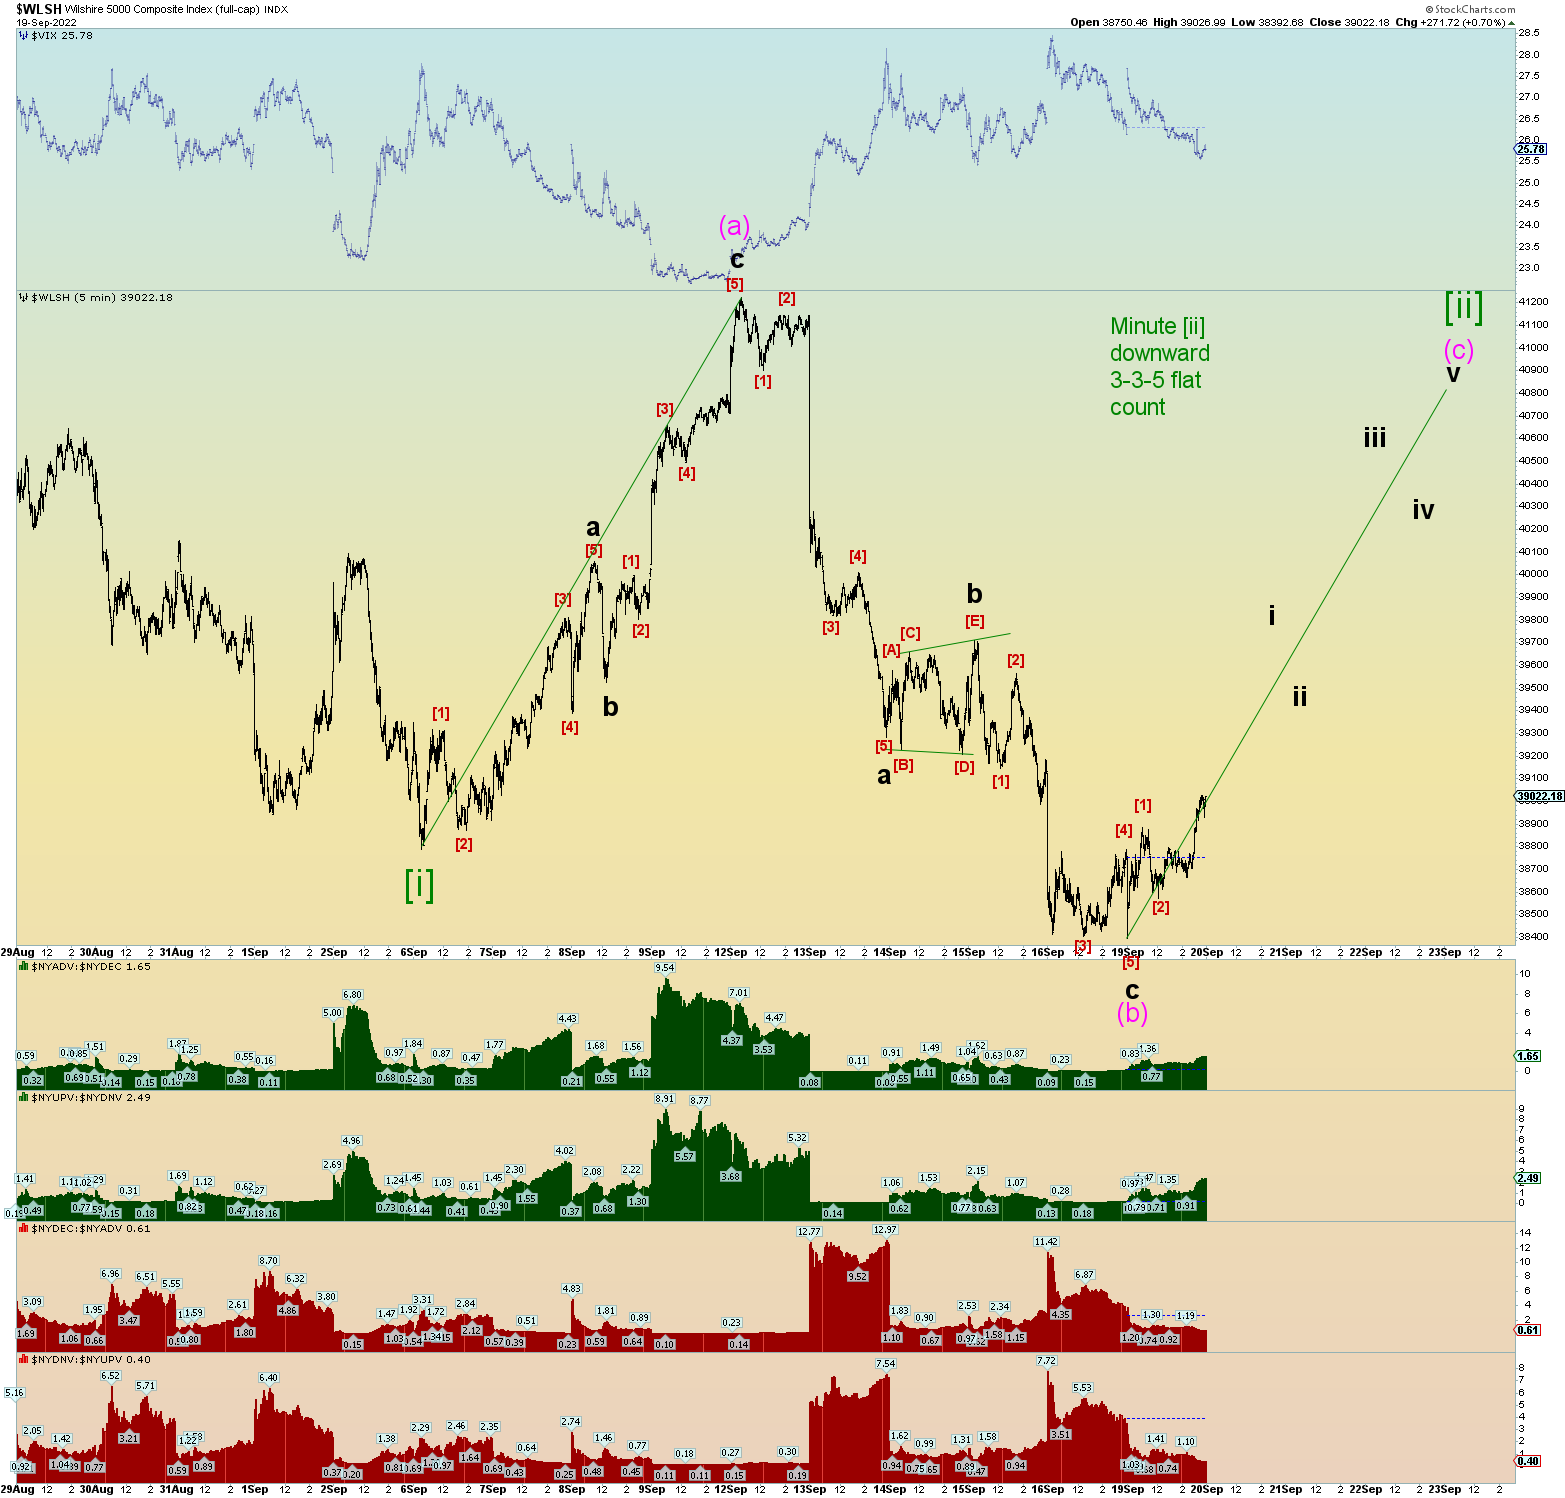
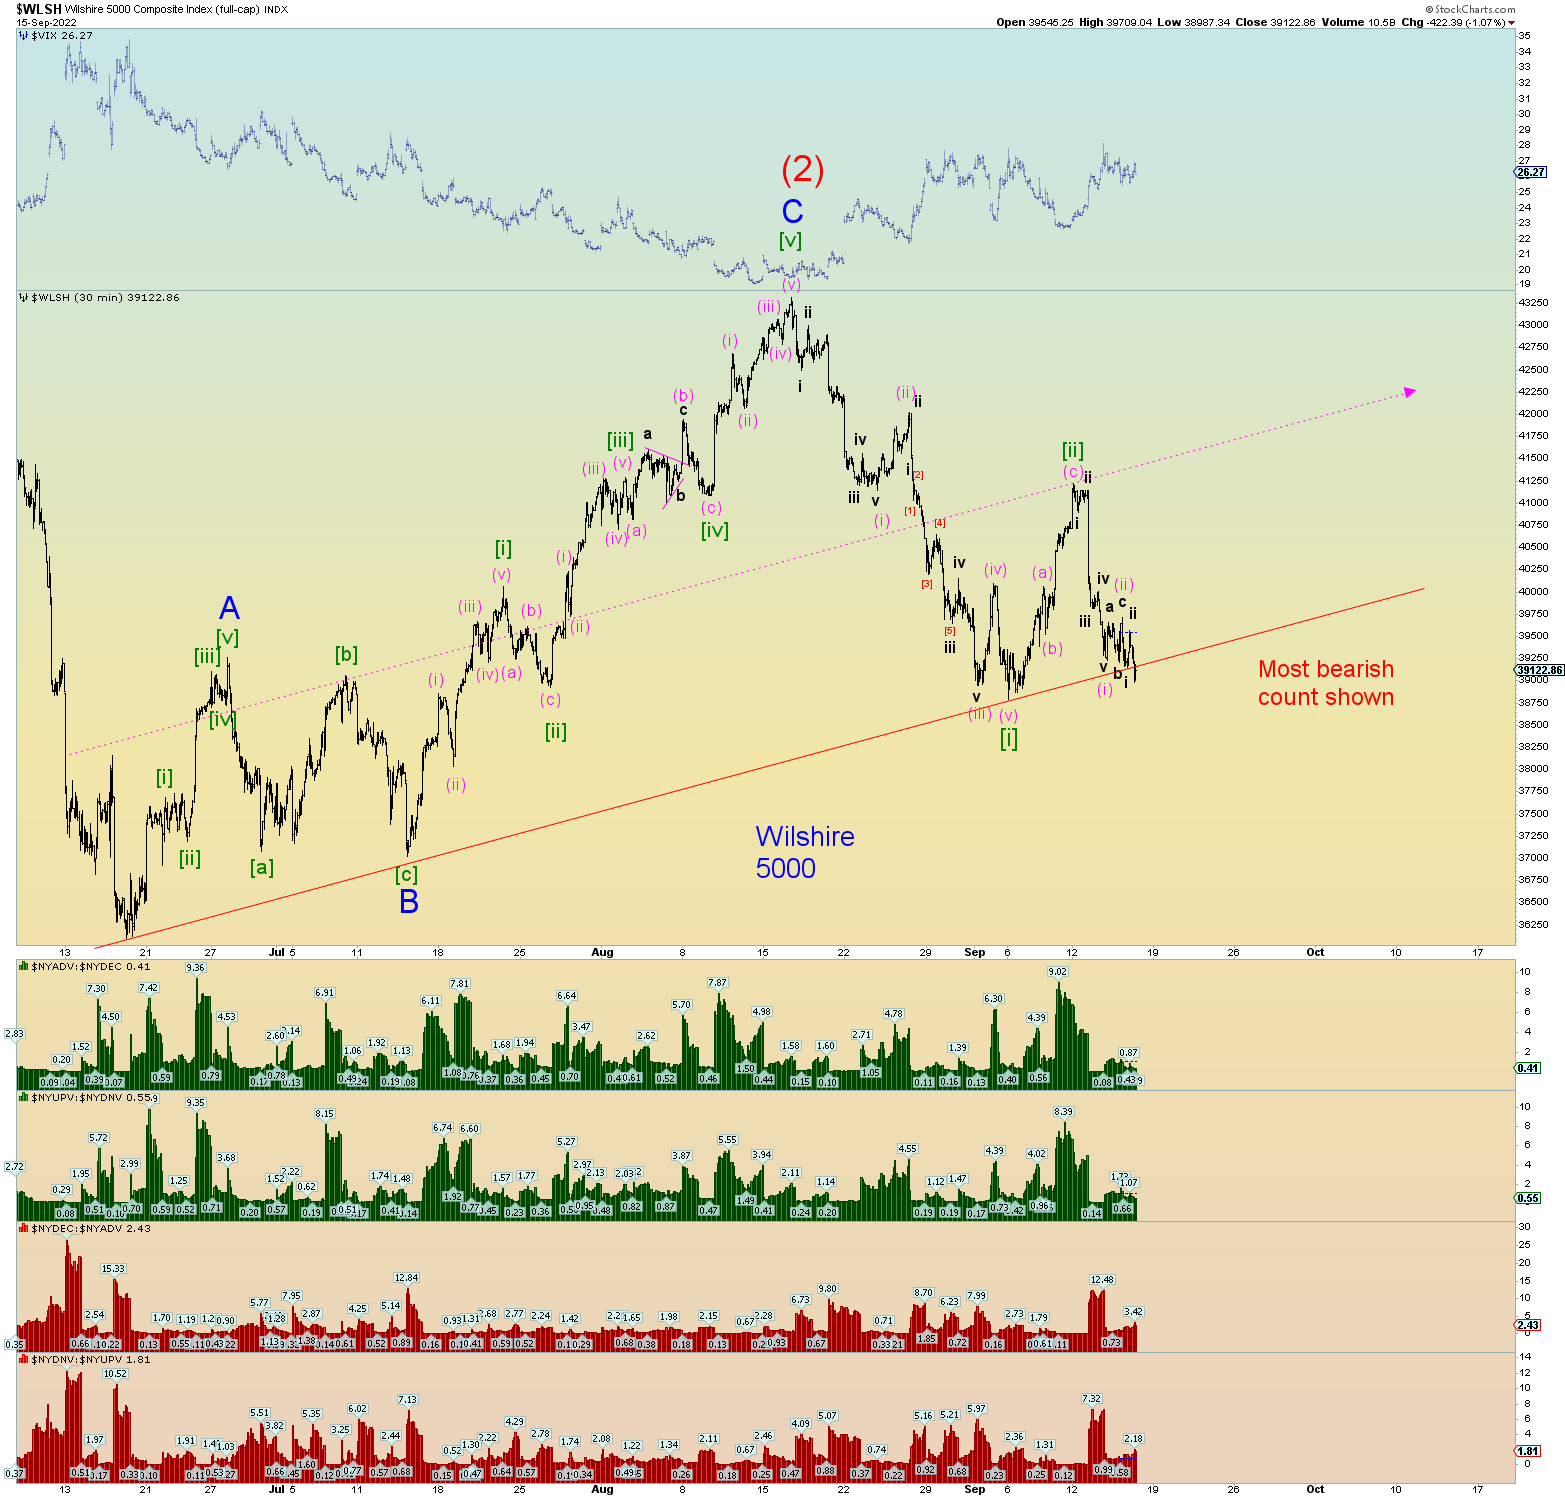
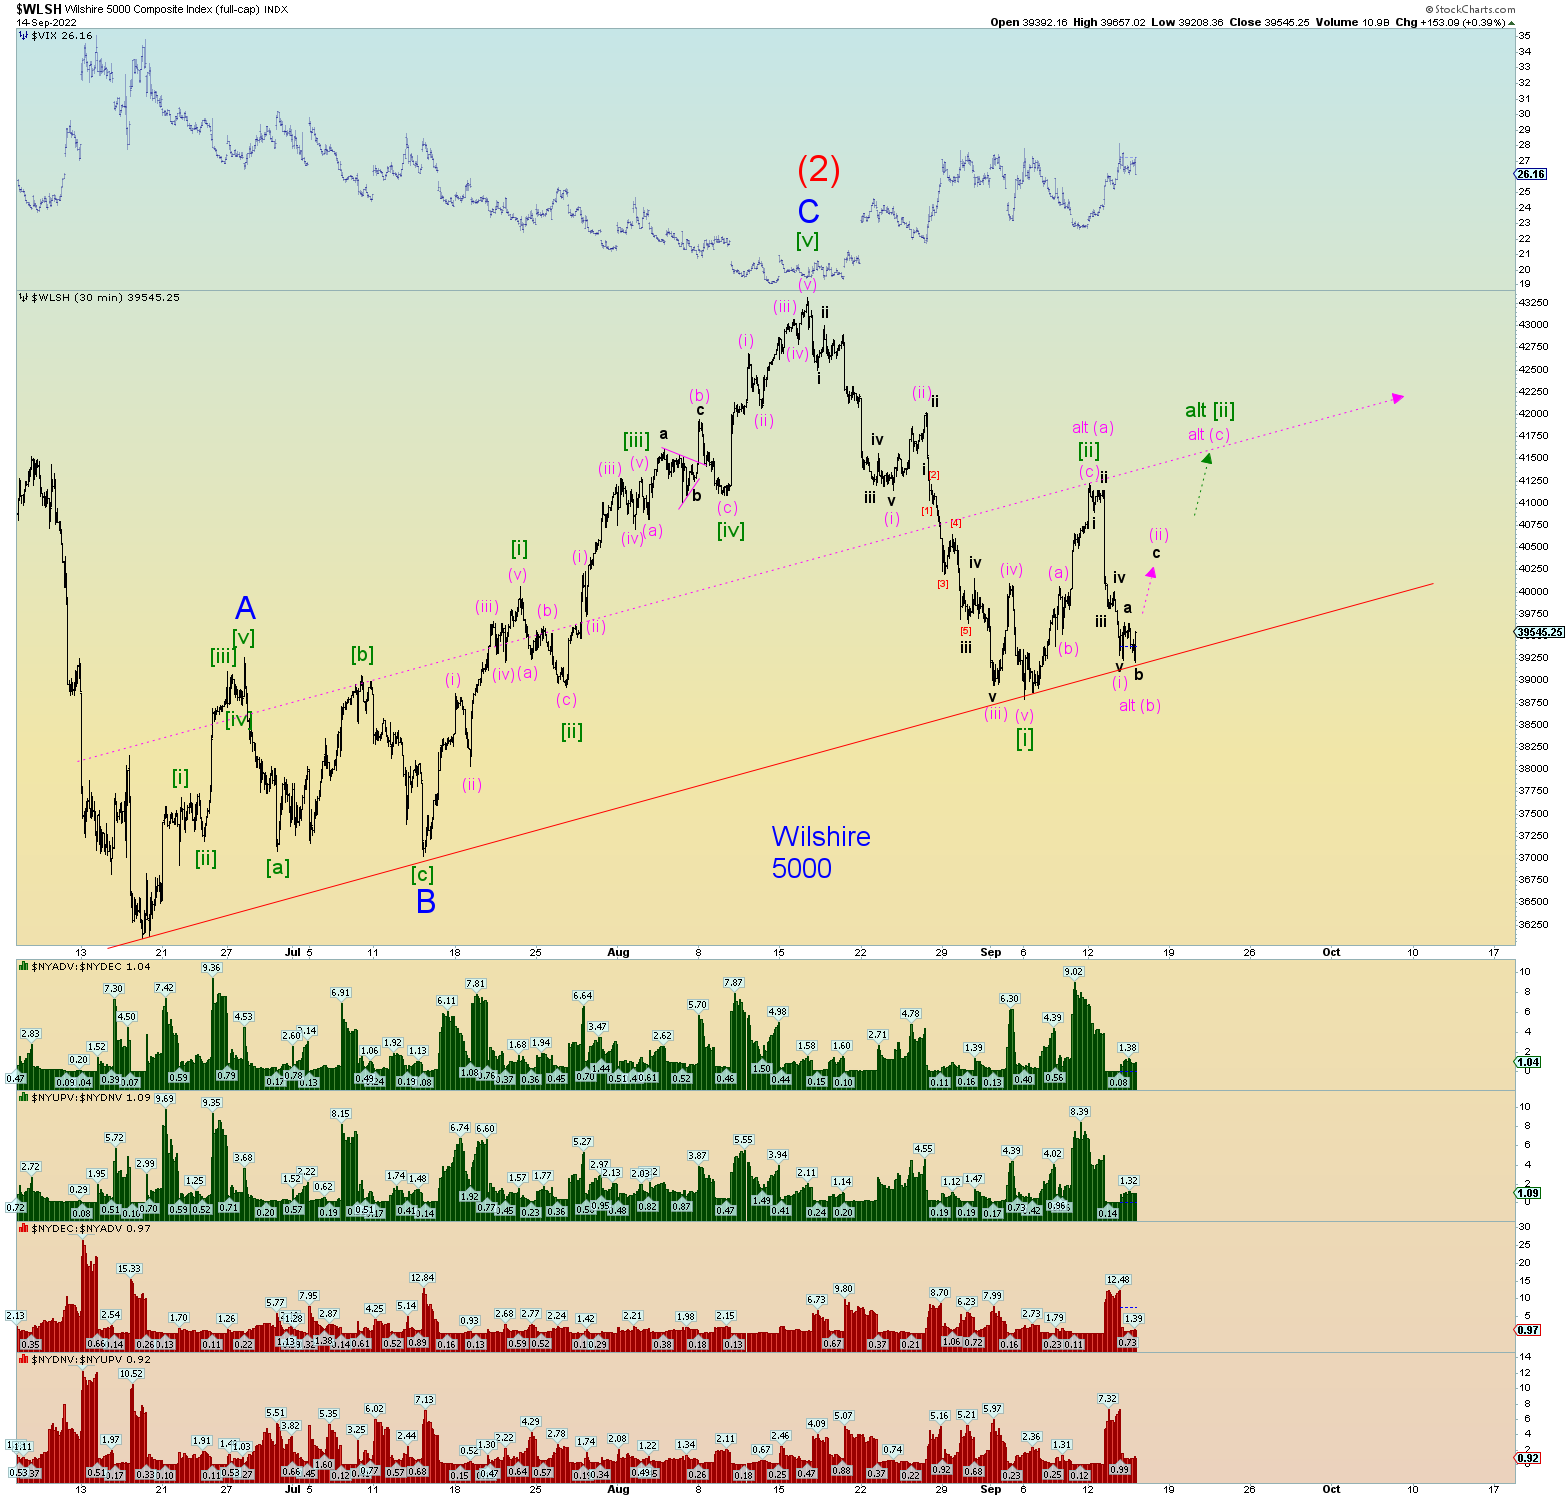
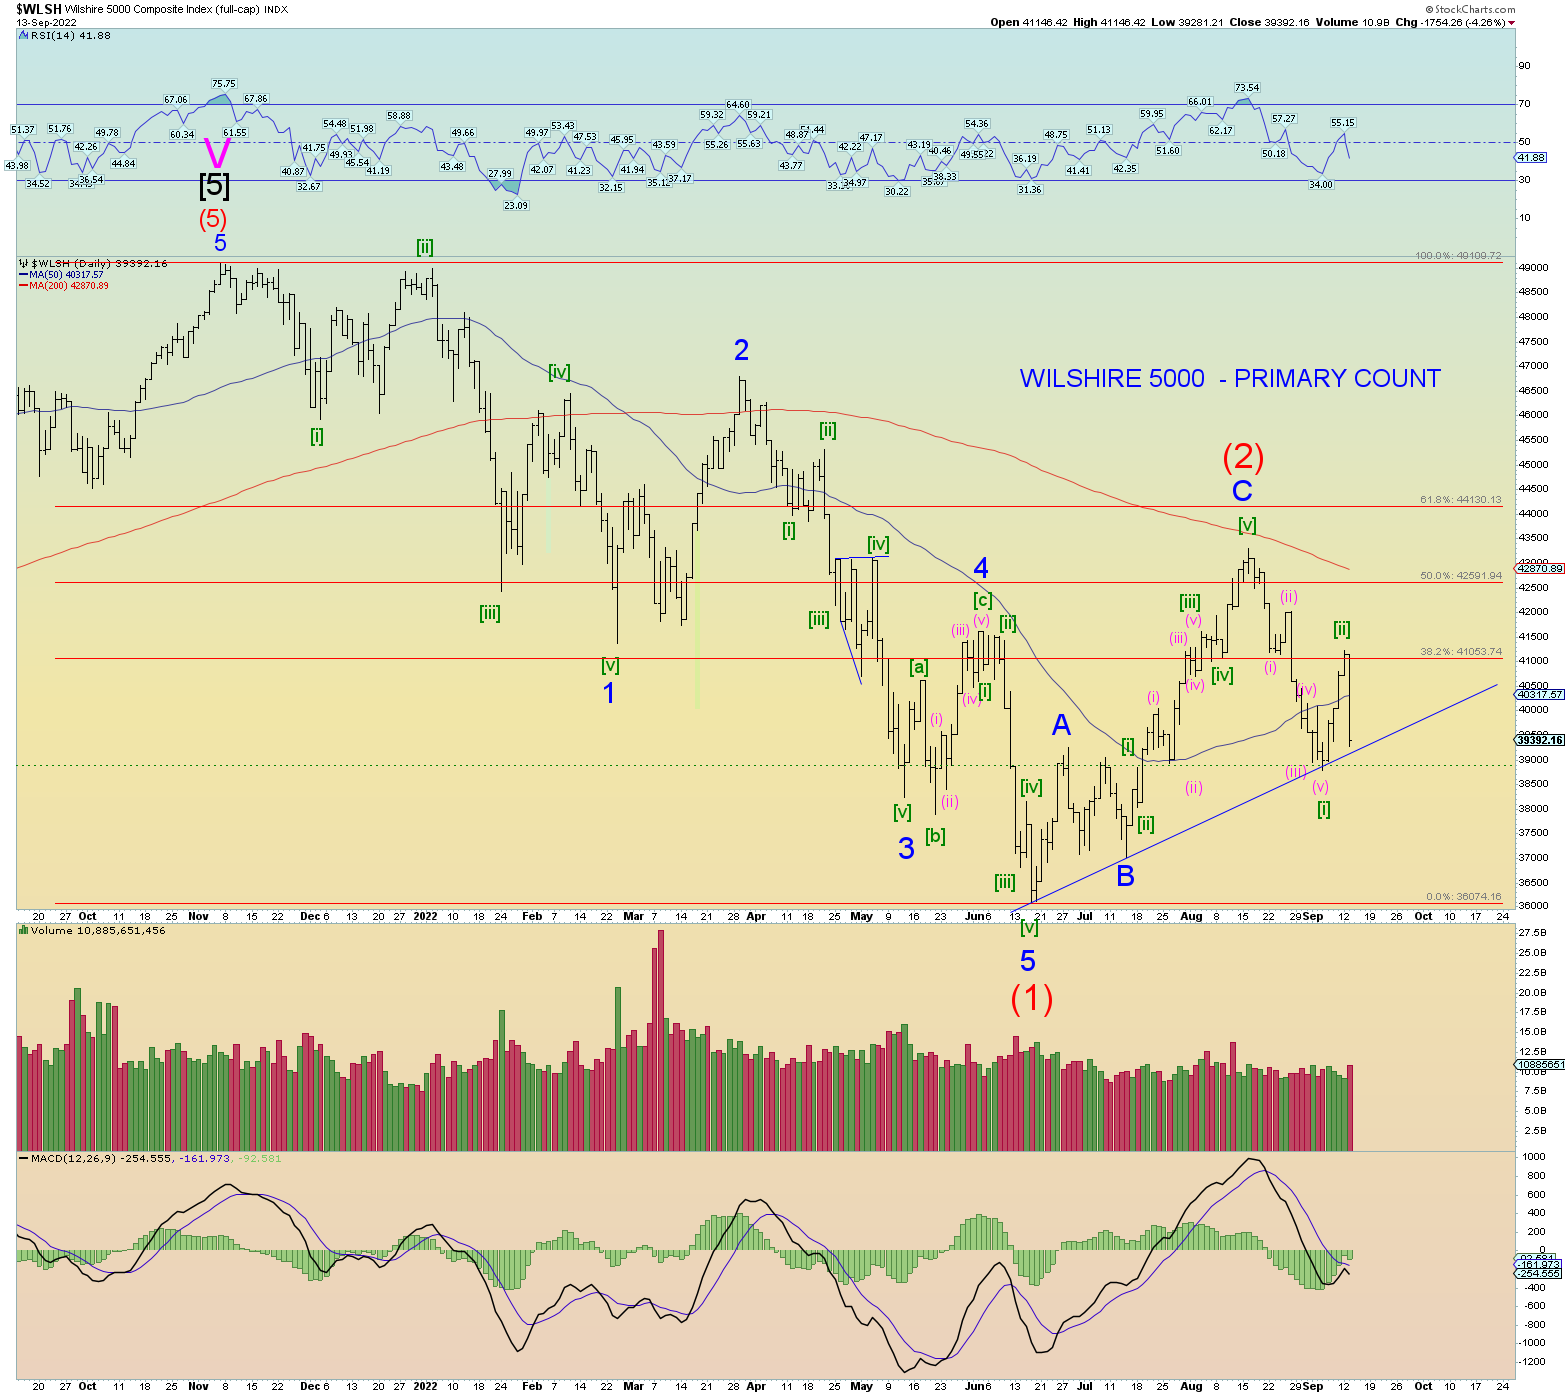
Ok, so tonight is just one chart and I put a lot of information on it for the purposes of tonight’s market price action comments. Several people have emailed me recognizing that the price move from where Intermediate (2) is labeled seems to be a clear “3” wave move to yesterday’s low. And it is. And since we had a clear 3 waves from the June low to (2), with today’s sharp rally, it could be the “kickoff” of a Minor wave C of Intermediate wave (2); a 3-3-5 flat count.
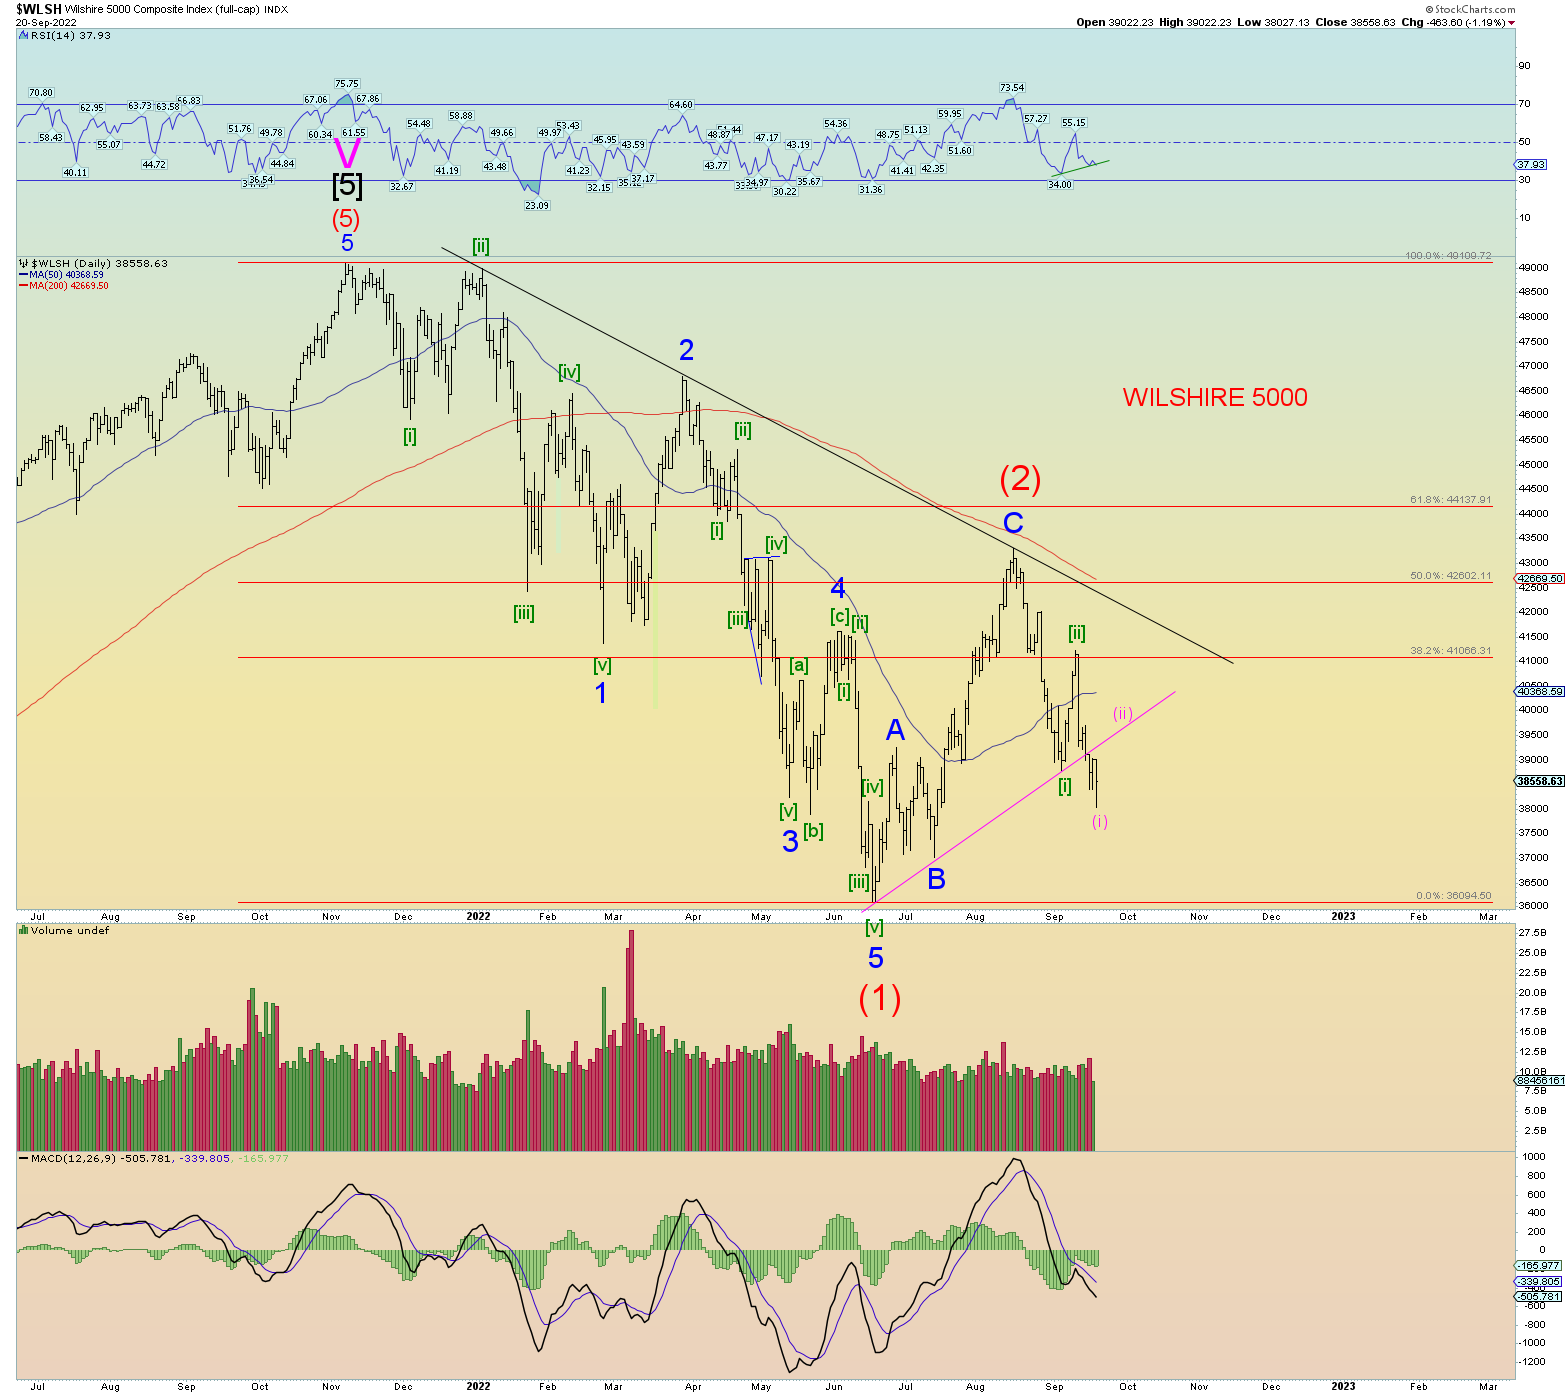
And of course, it is a possibility and is the most bullish count we can dream up at the moment. But first things first. The illustration on the SPX chart below shows that prices in the SPX alone would have to climb another 4.5% – some 170 SPX points from today’s close – to be a real challenge of wave overlap with Minute [i] which would be a violation of Elliott wave counting rules. That is the key price level we look at before we change our medium-term counts.
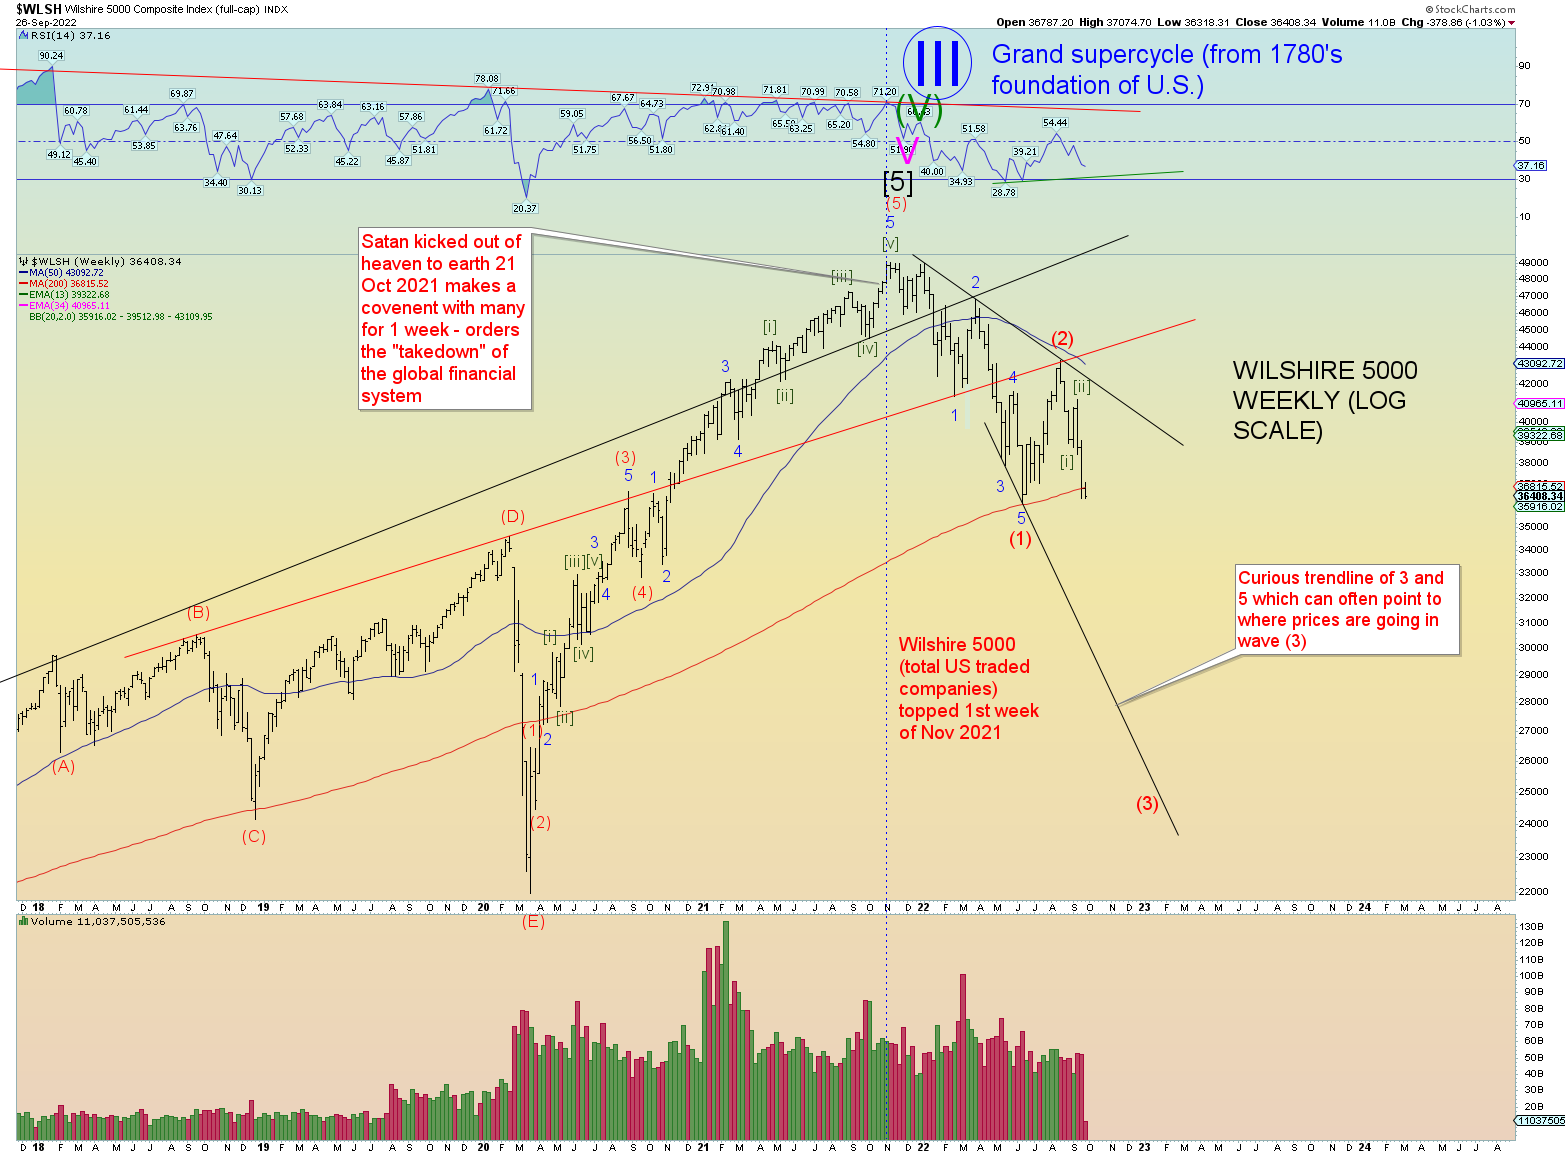
And not only that, but an Intermediate wave (2) flat involves much more than a 4.5% rise from today’s close. It involves prices travelling back toward the 4300 level. And this would take some time. The slope of price rise would probably take until Thanksgiving holiday late November. Am I saying this cannot happen? Of course it could, all I am saying is first things first.
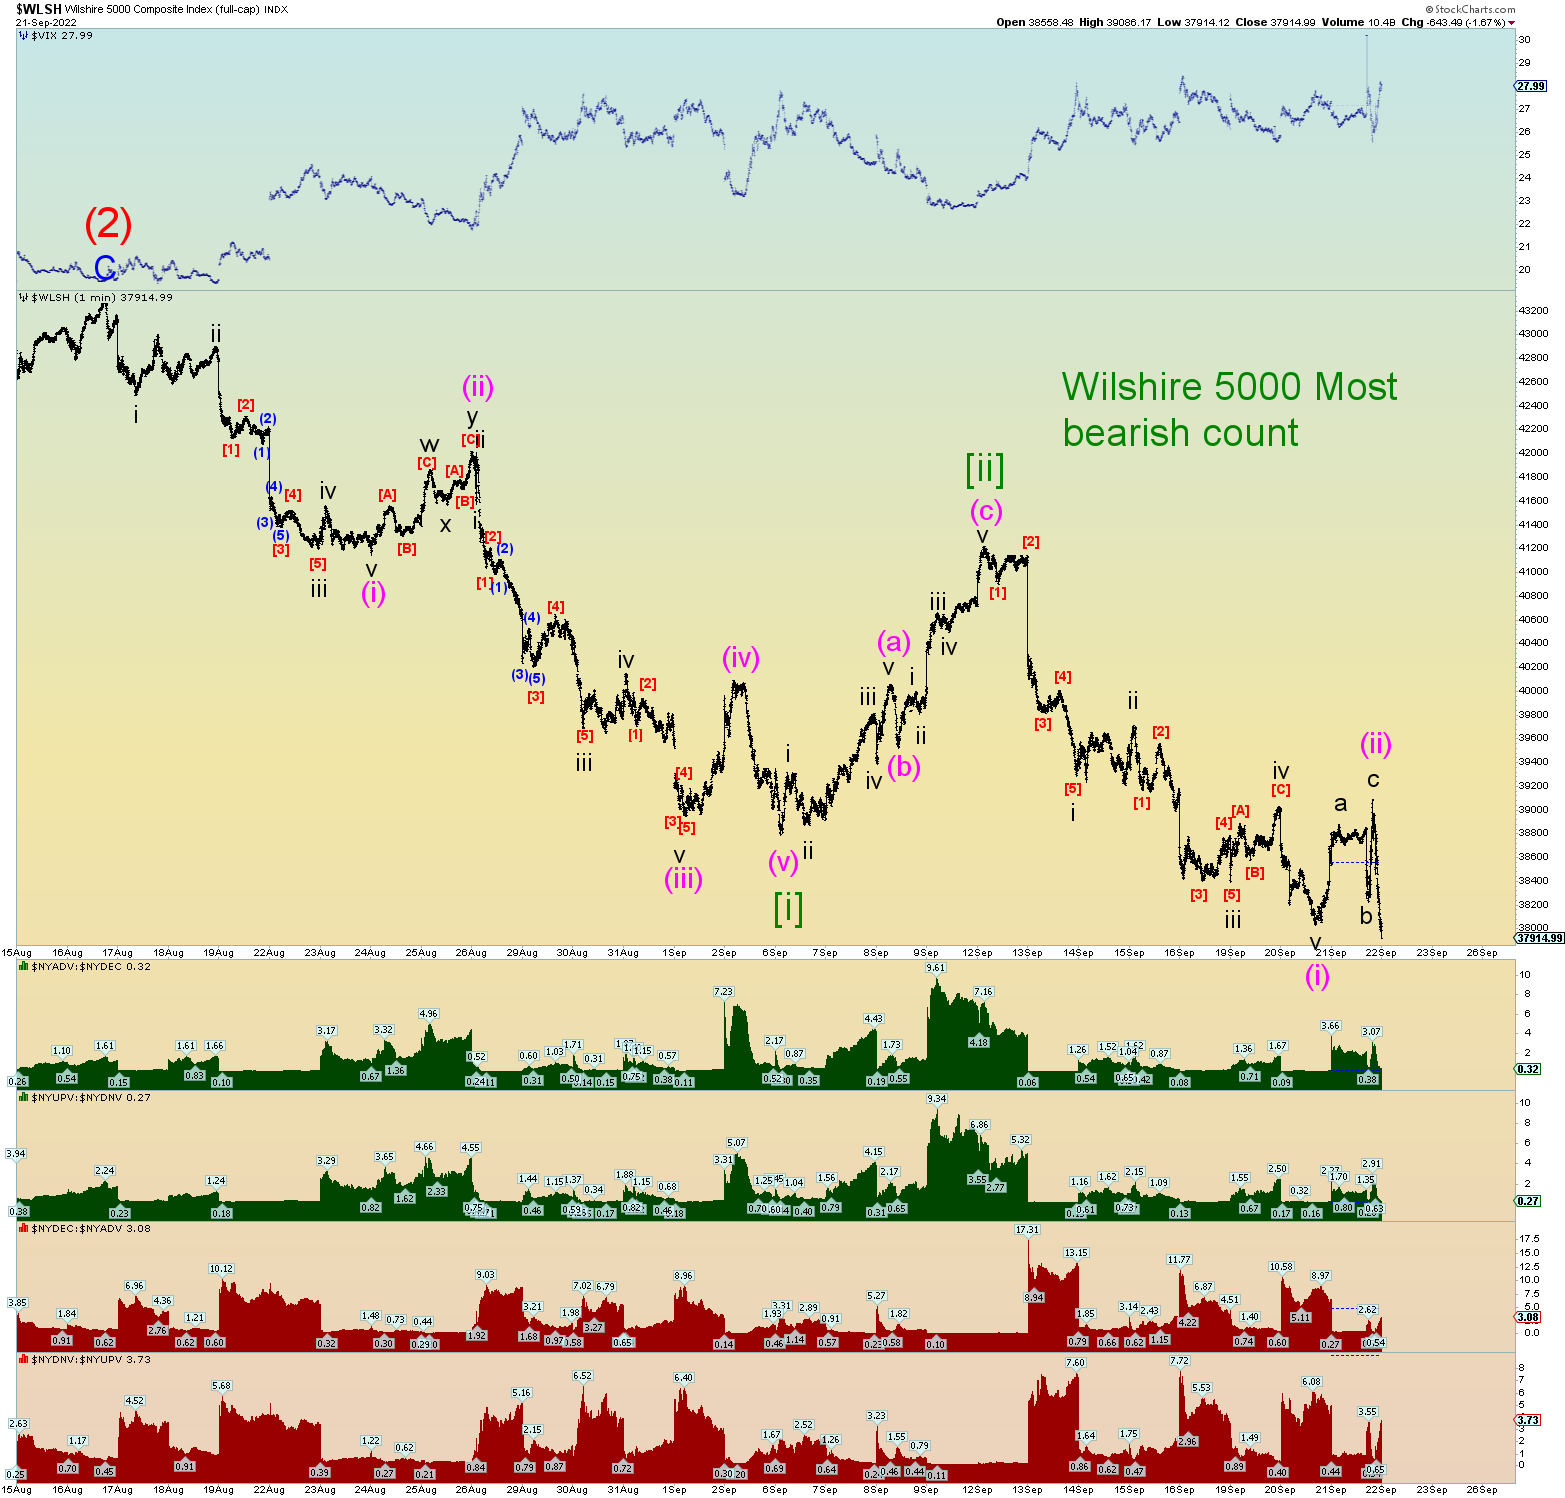
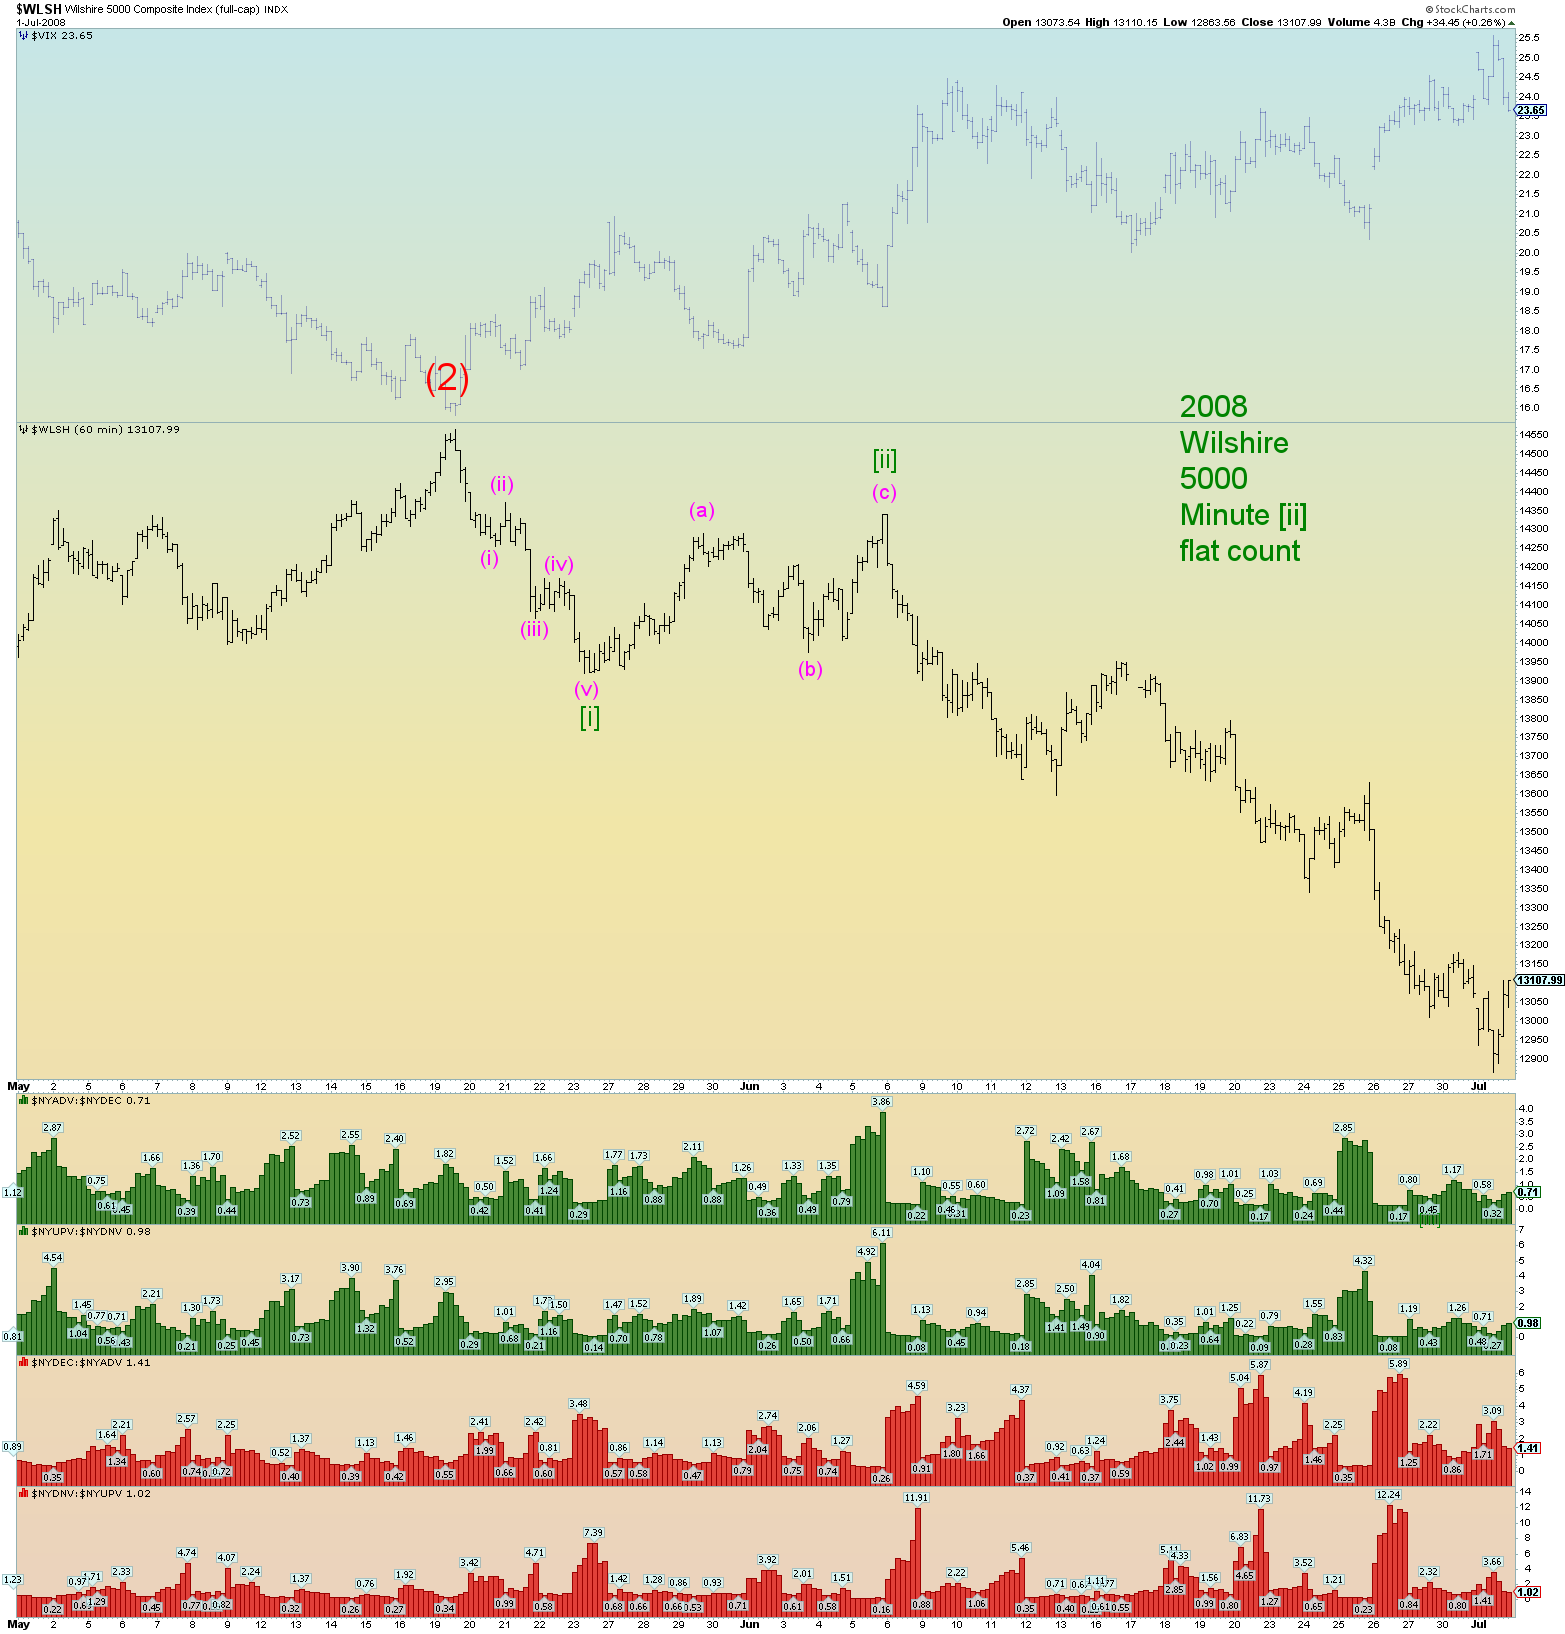
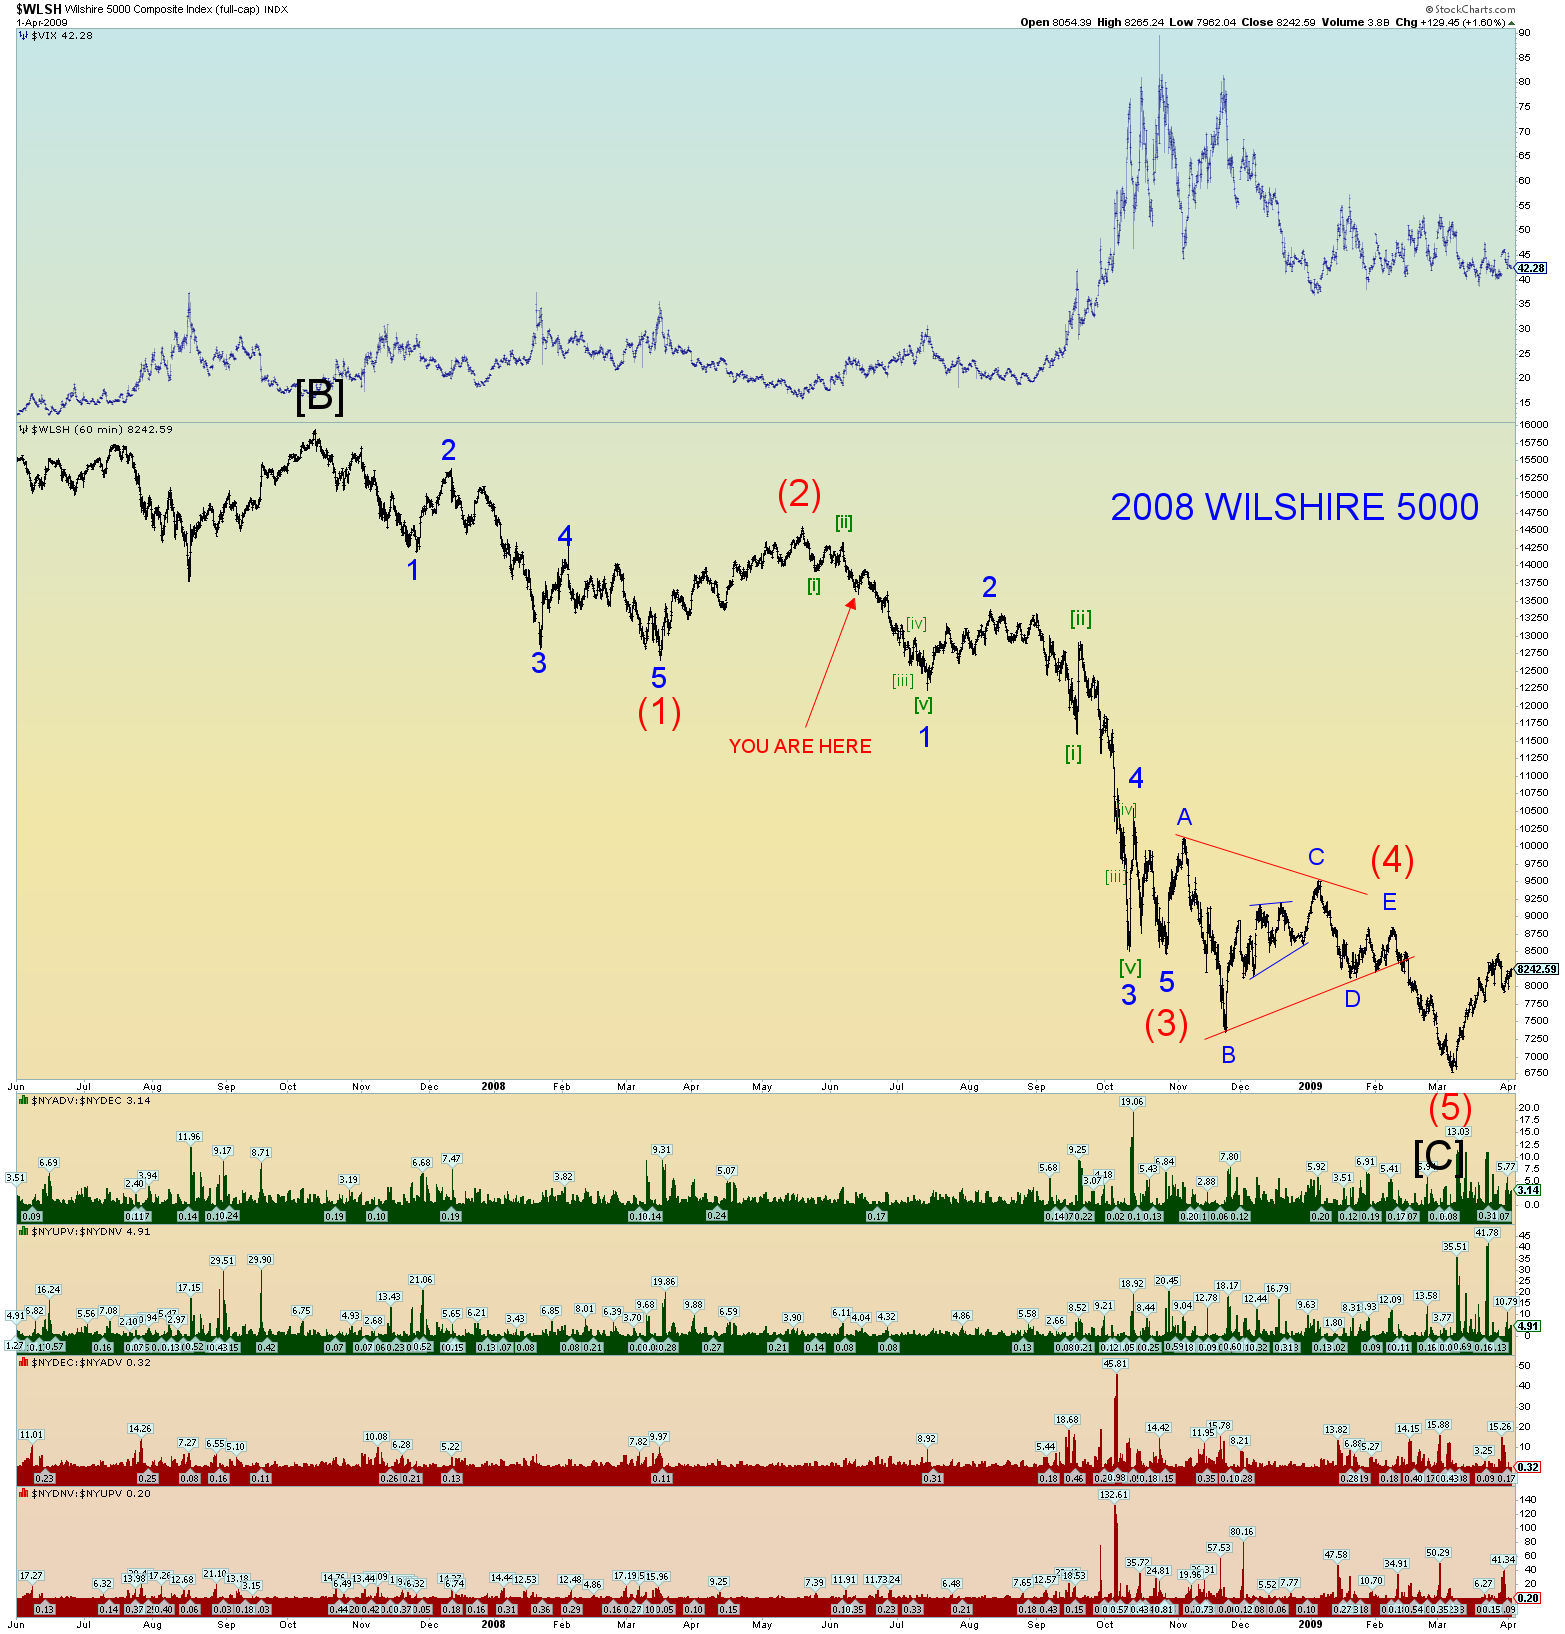
Therefore, the primary count remains that Minute [iii] of Minor 1 bottomed and the market is bouncing in a potential sharp Minute [iv] of 1 of (3). And yes, it was an algo driven day from deep oversold conditions and this is what happens in a developing nasty bear market. Just one look at 2008 will confirm the subwave bounces were stupendous.
The bottom line is I expect the SPX to close the recent gap down of which today’s prices started to poke into near the close. And after that gap is closed, market players will emerge, and more selling will ensue taking prices down in a Minute [v] of Minor 1 of (3) down.
That’s the call. Lots of people wanting to get out of this market. Higher prices above here should bring out more selling.