UPDATE
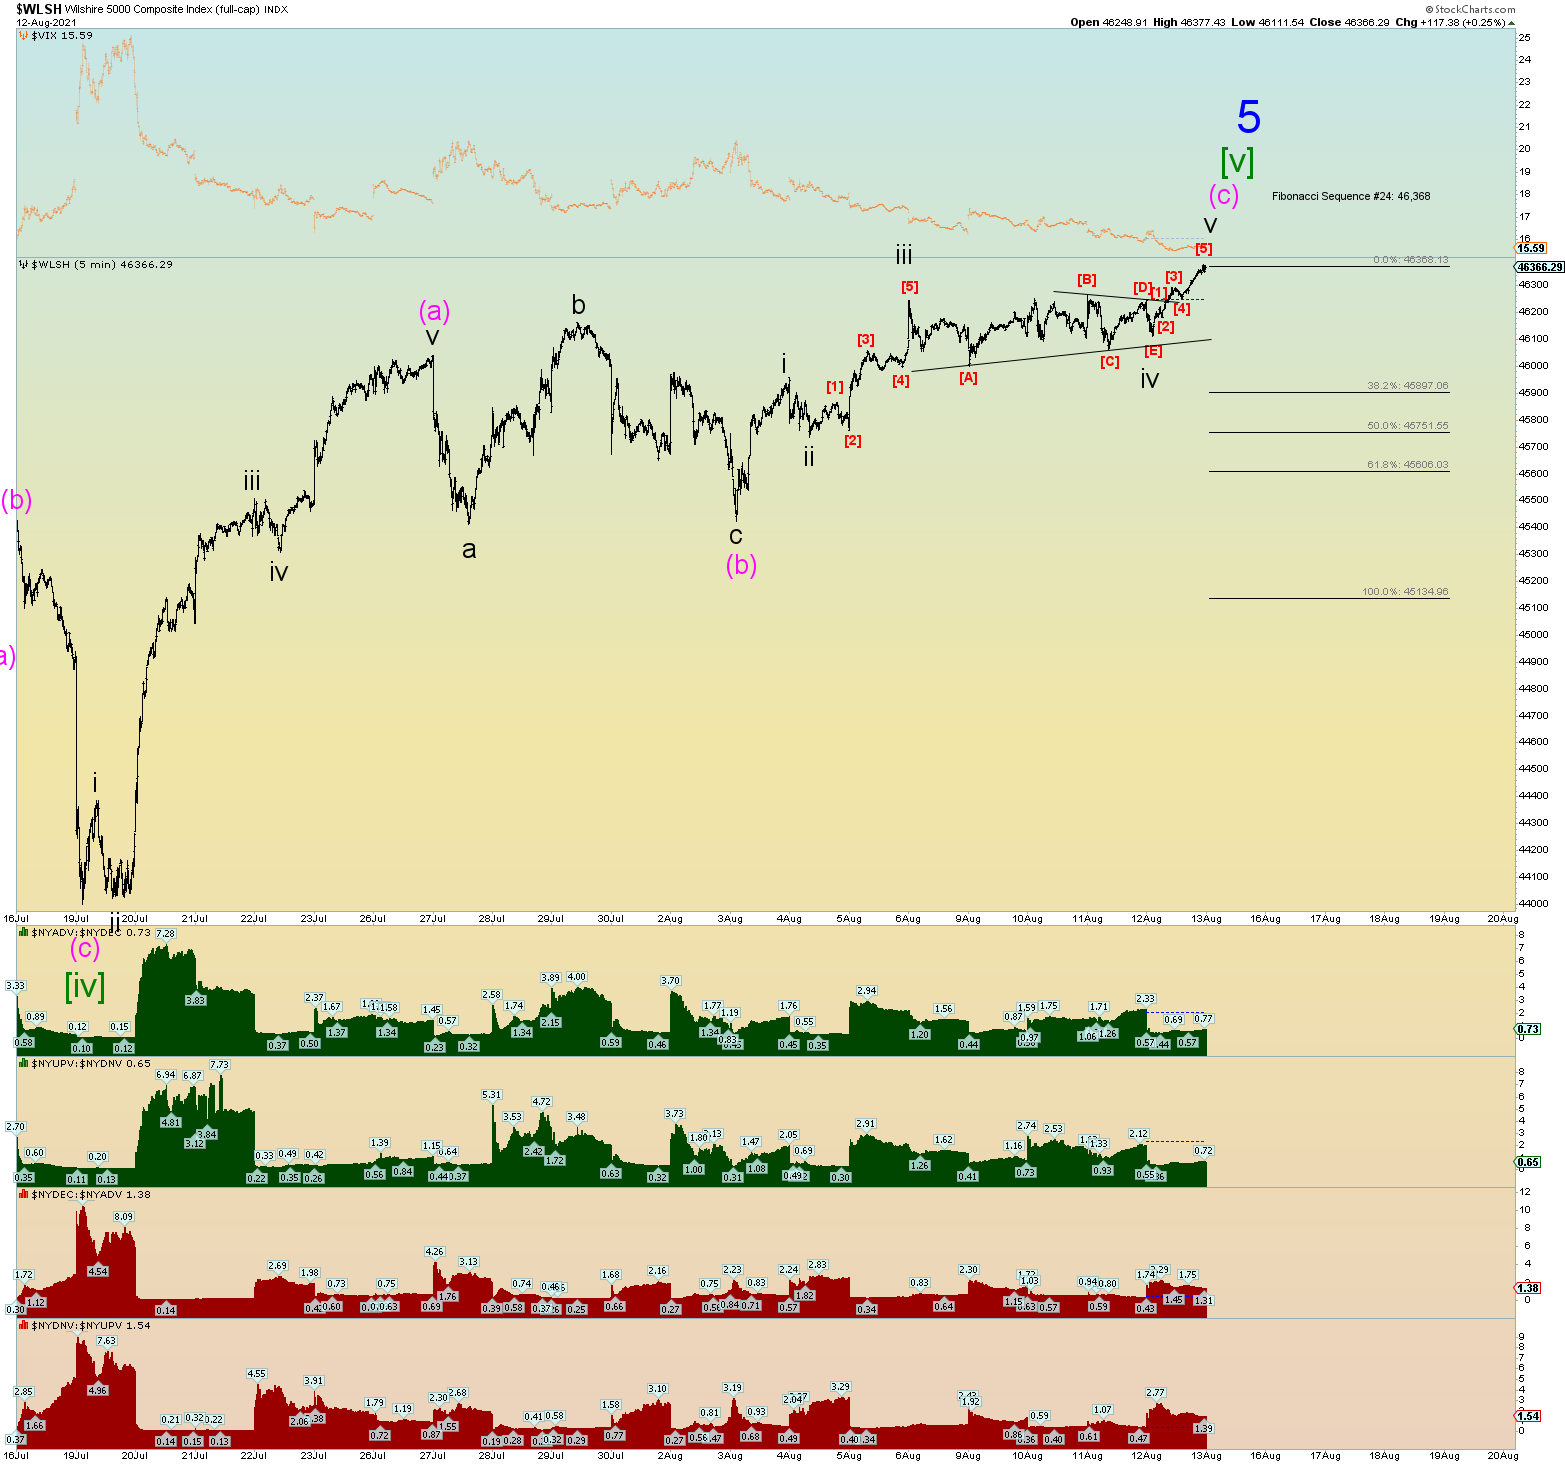
The NY Stock Exchange index was a flat close today, but internals were anemic. Ratios of .65 (up volume vs. down volume) and .73 (advancers vs decliners).
THE COUNTS
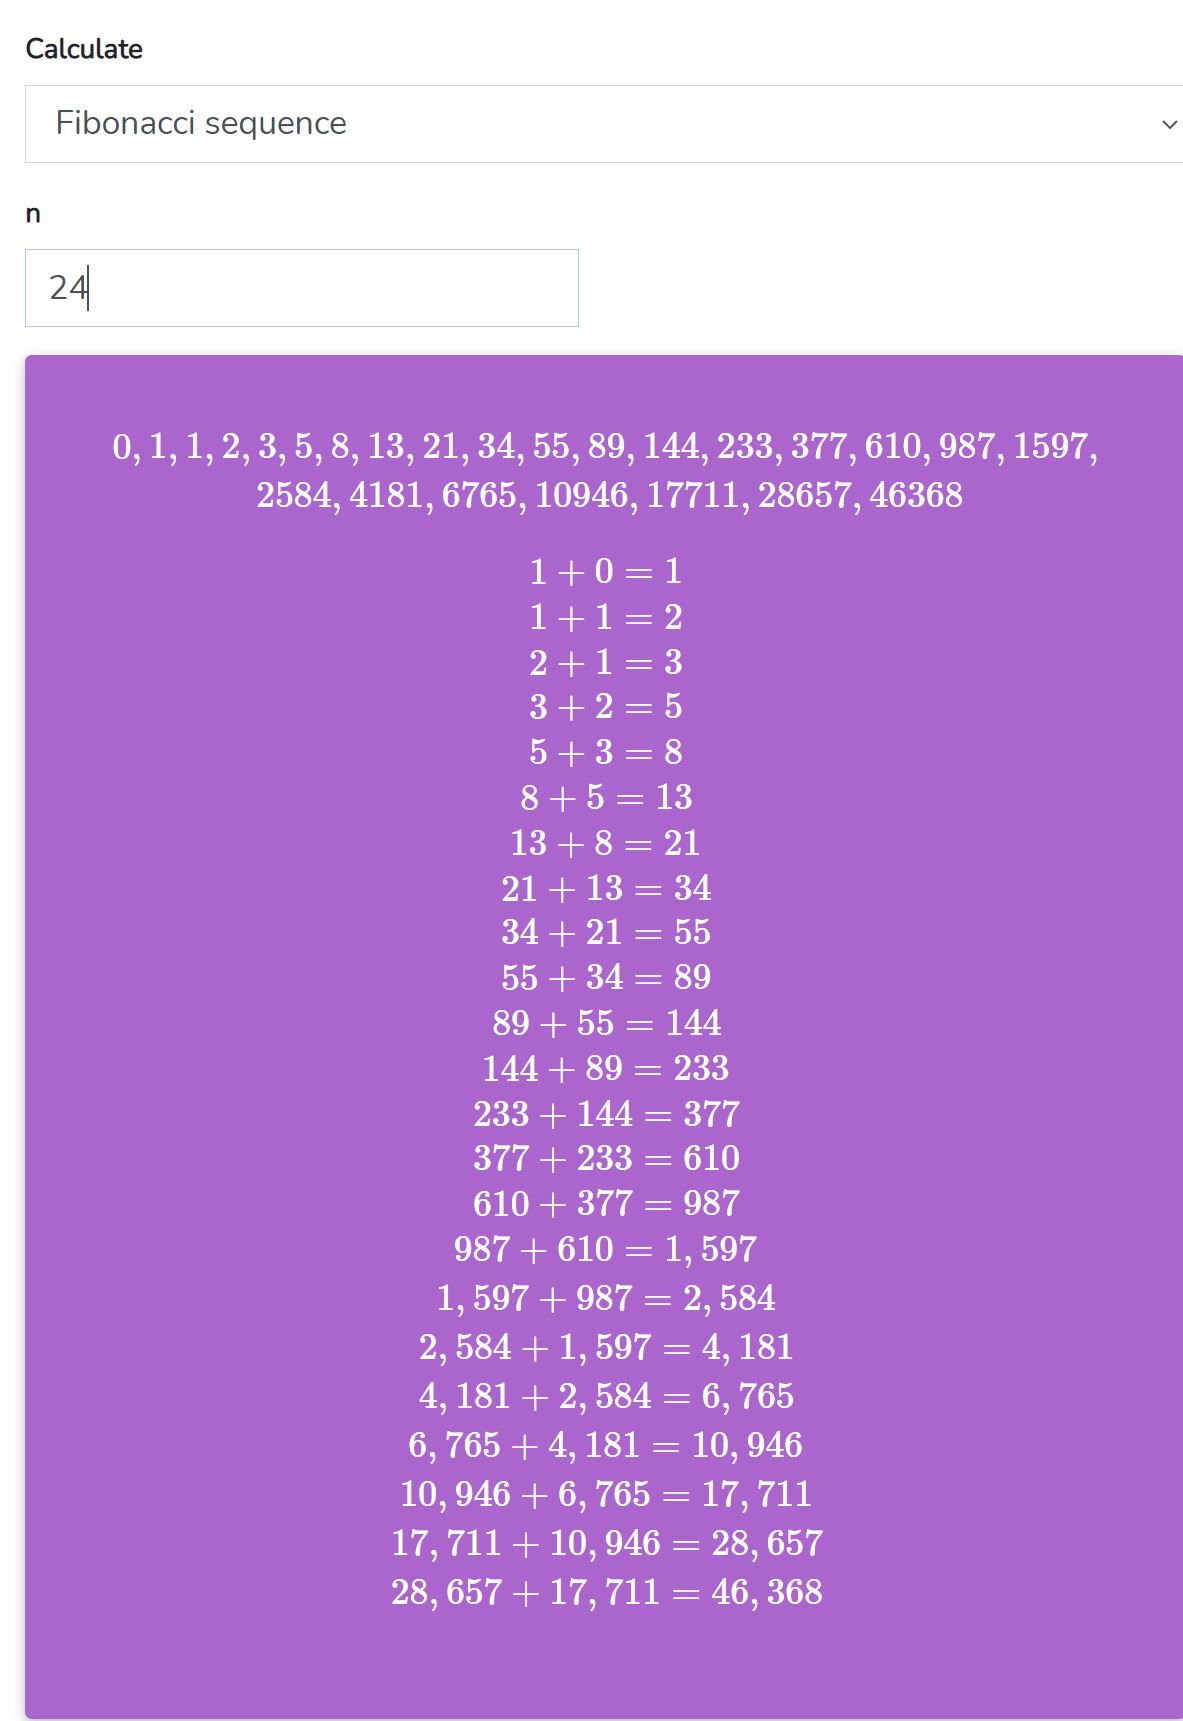
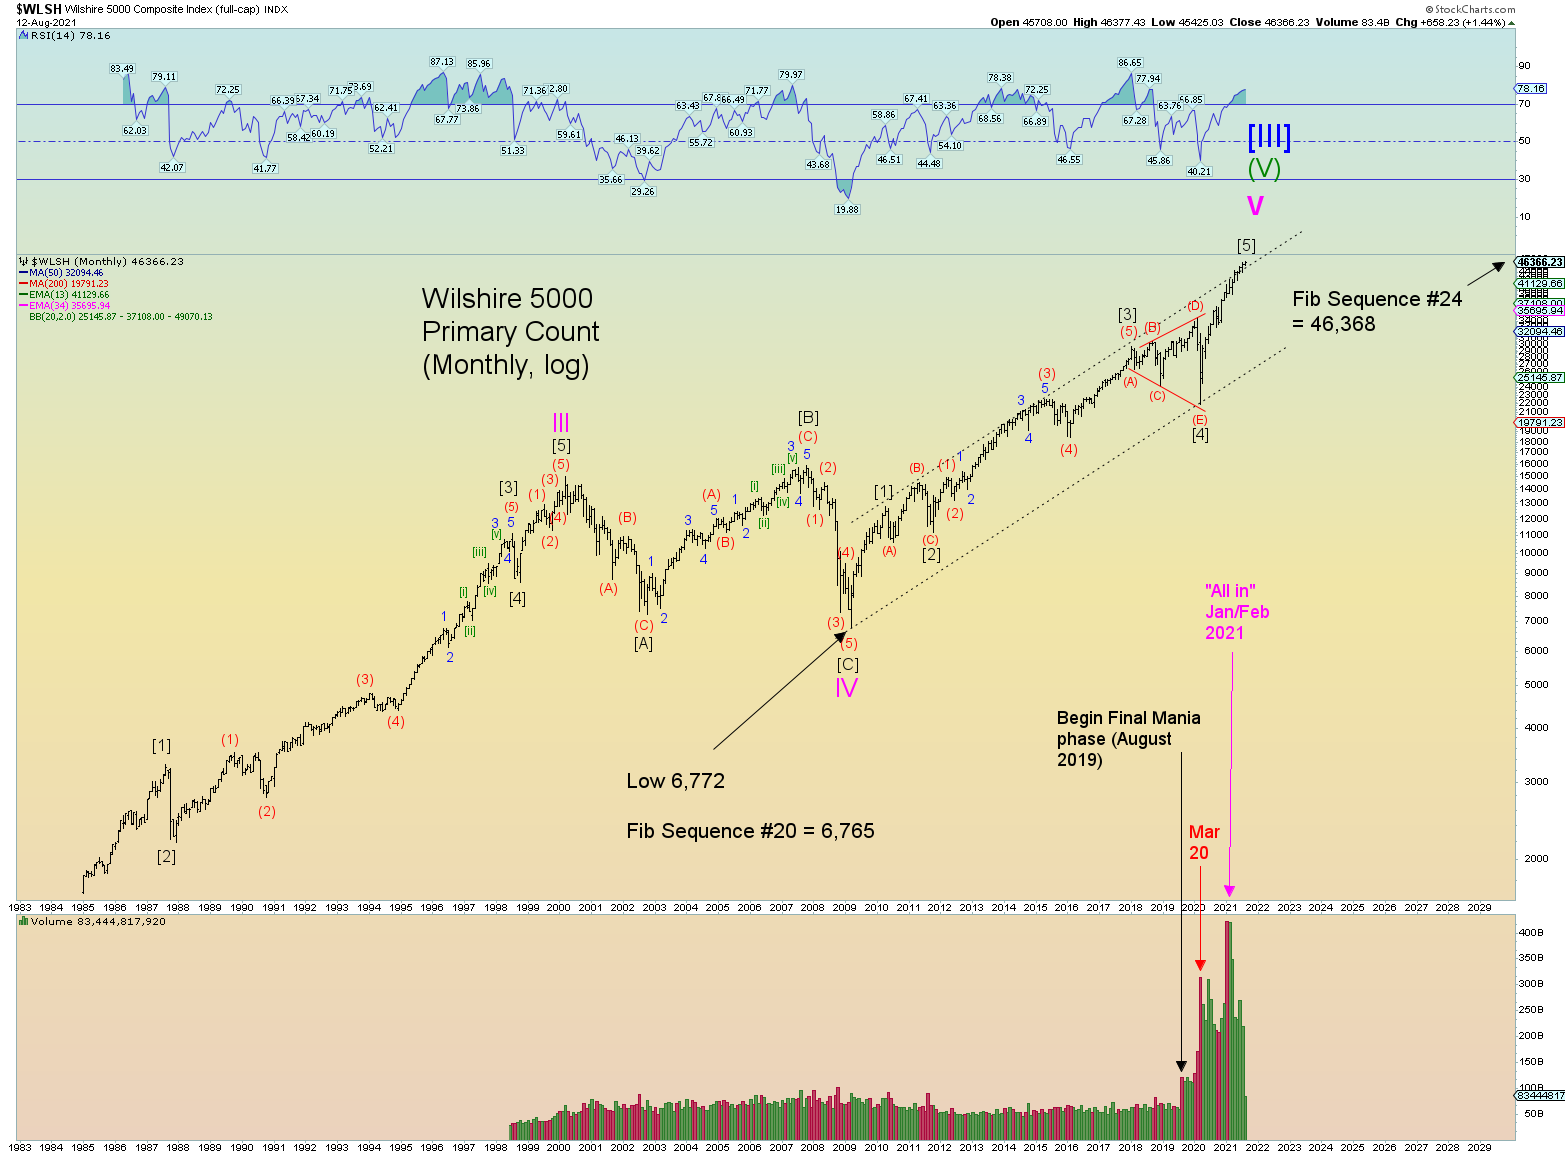
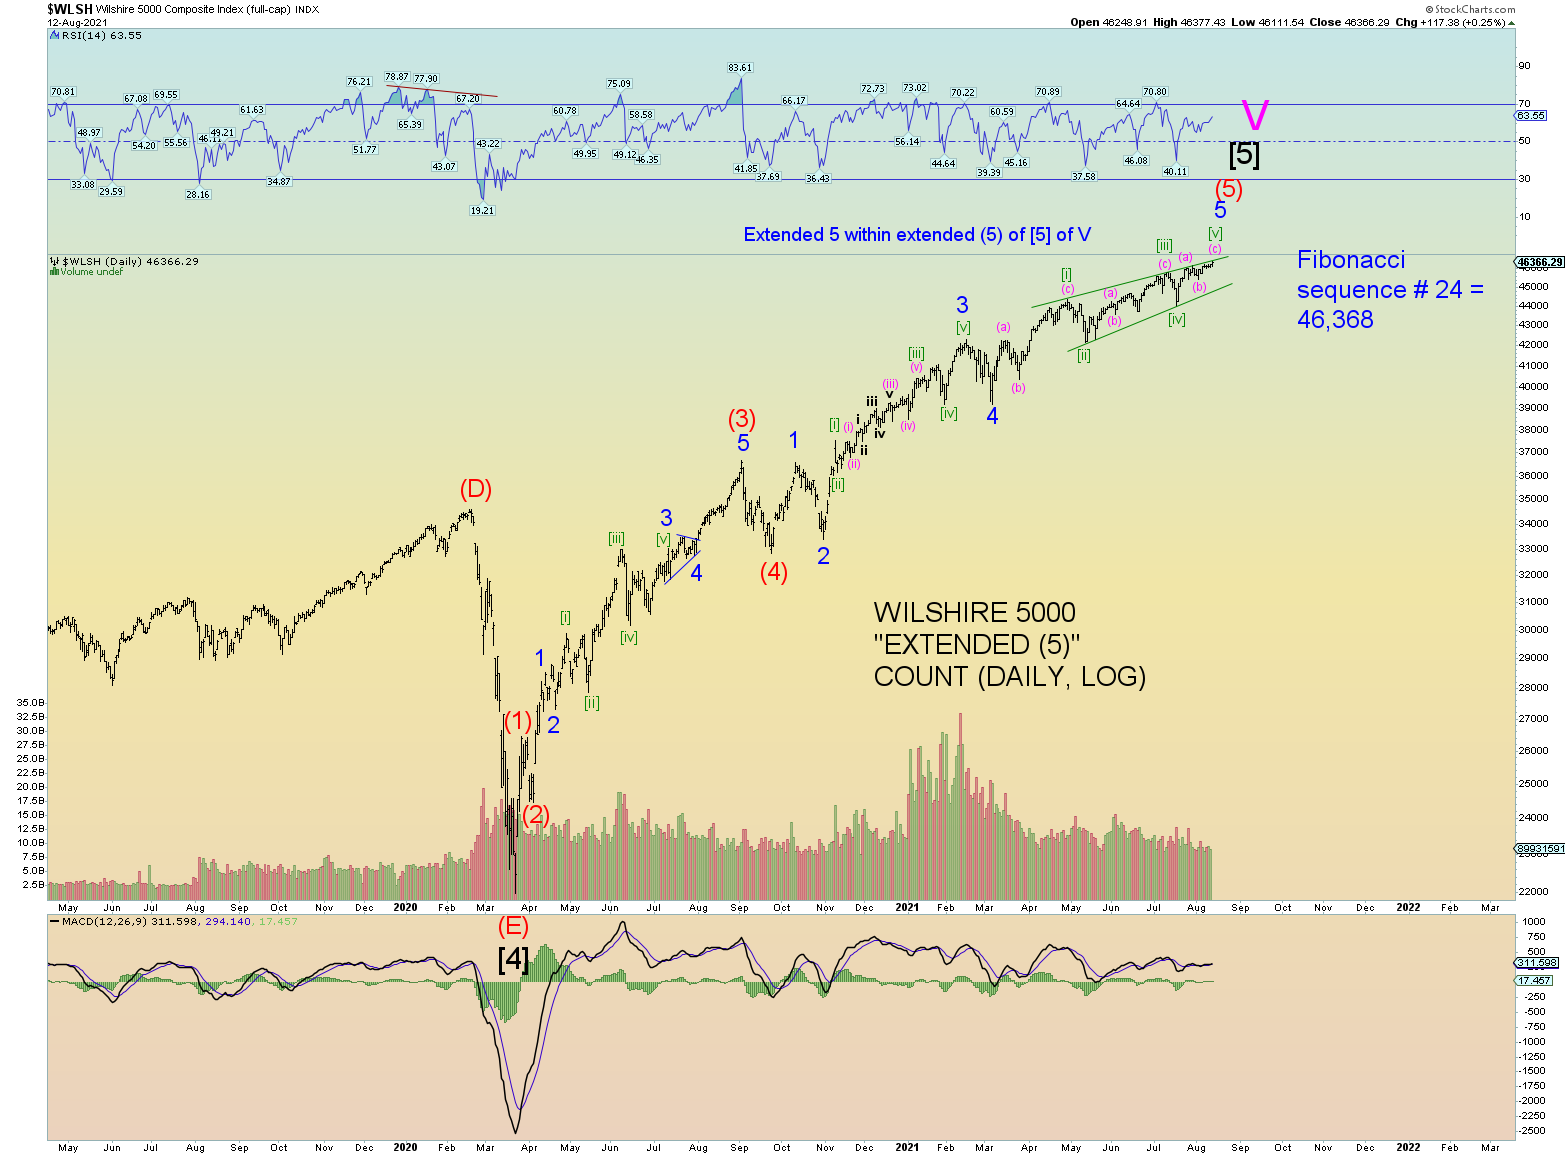
This blog has been hammering on the 24th Fibonacci sequence number of 46,368 as a possible target for “the top” of the Wilshire 5000 – which represents the total market. Today peaked at 46,377 but closed at 46,366.29. Doing the math the closing price is within 99.99% of the Fibonacci sequence #24 number of 46,368.
The major significant March, 2009 low (intraday) of Wilshire 6,772 was within 7 points of the Fibonacci sequence number 20 (6,765). The 2009 low was a significant Fibonacci sequence low and perhaps the 2021 high will be a significant Fibonacci sequence high. The next Fib sequence #25 is 75,025 which is way above these prices. Therefore if this Sequence #24 means anything we are looking at a major market top.
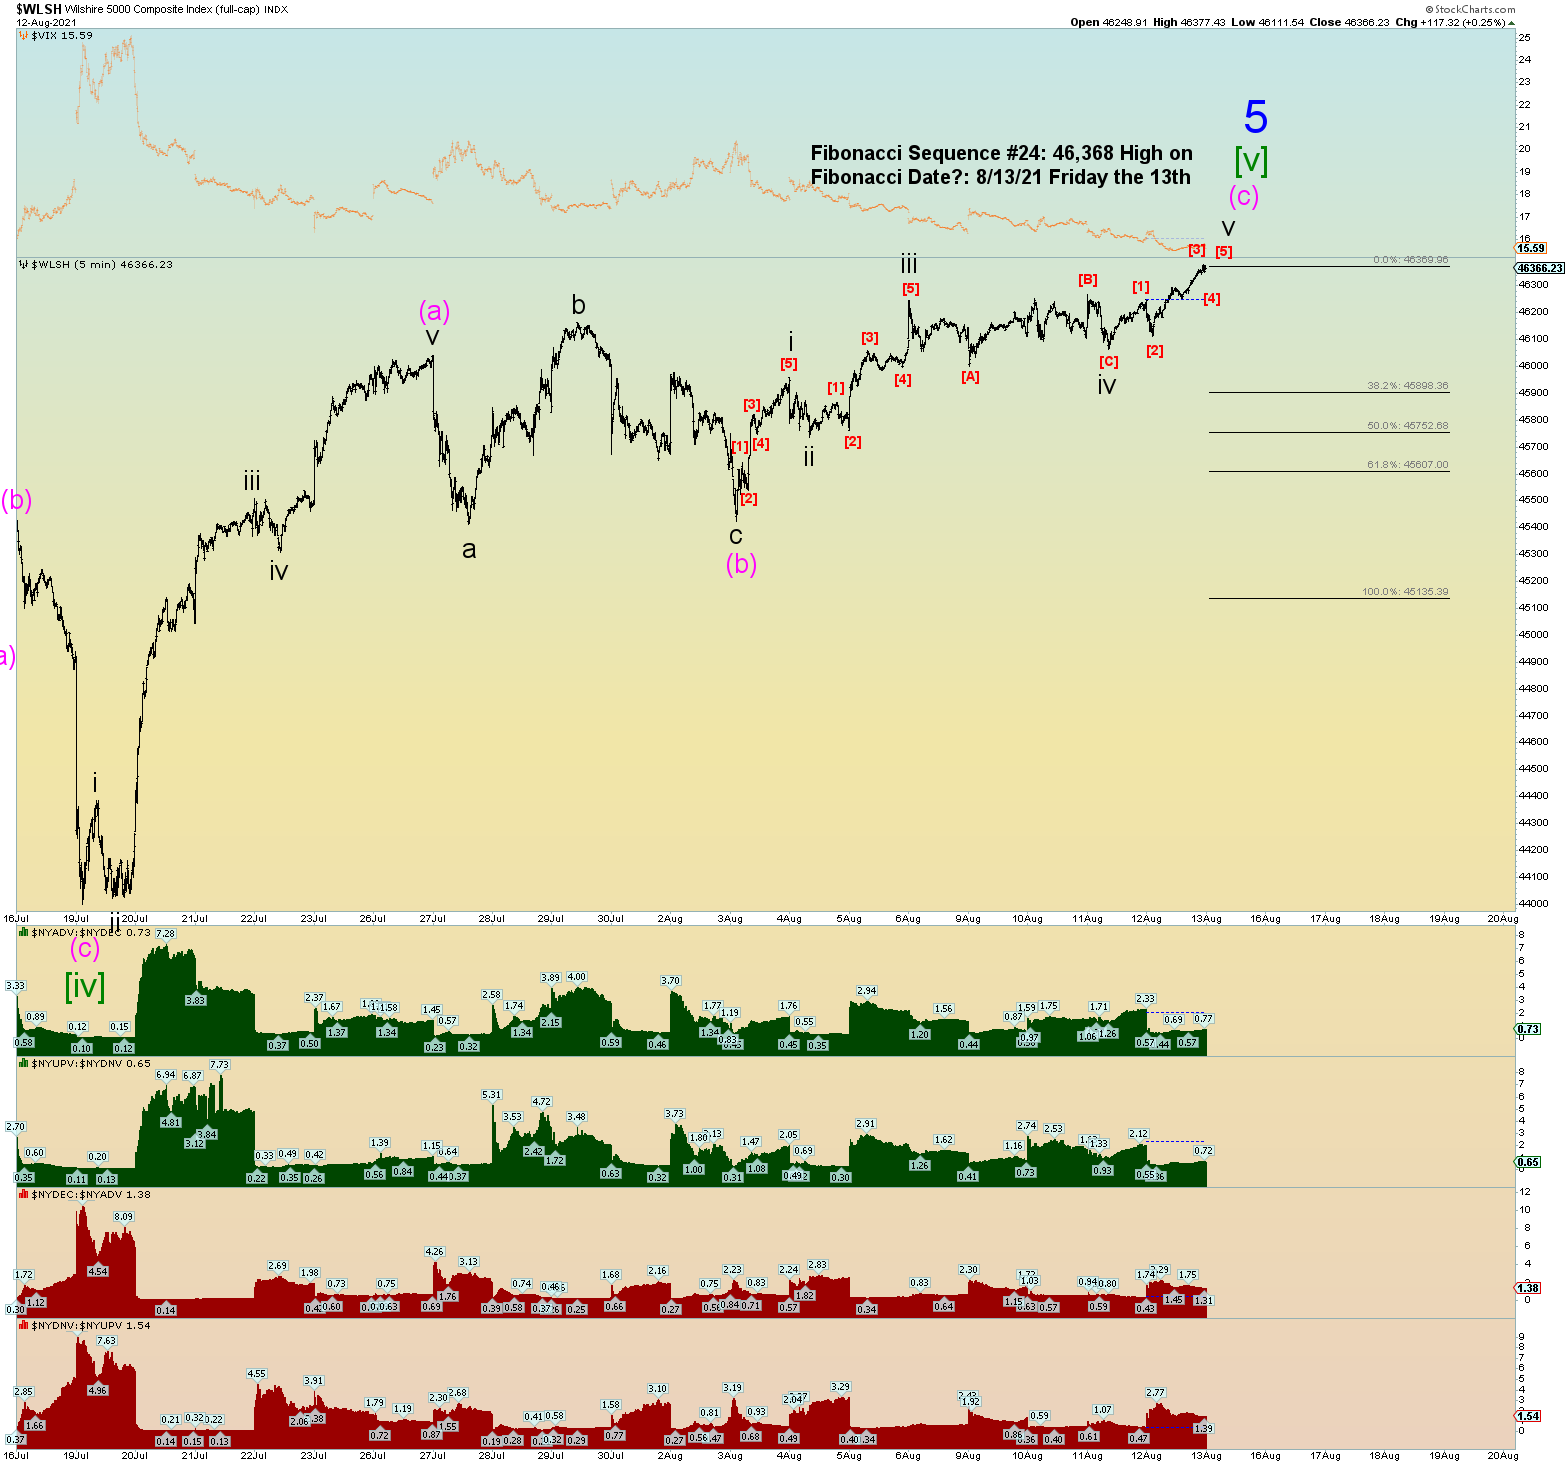
There are 2 best squiggly counts. If the market is to make an intraday high on the Fibonacci date of 8/13/21 (Friday the 13th) we have a count such as below:
(This still assumes the closing high of today of 46,366.23 stands!)
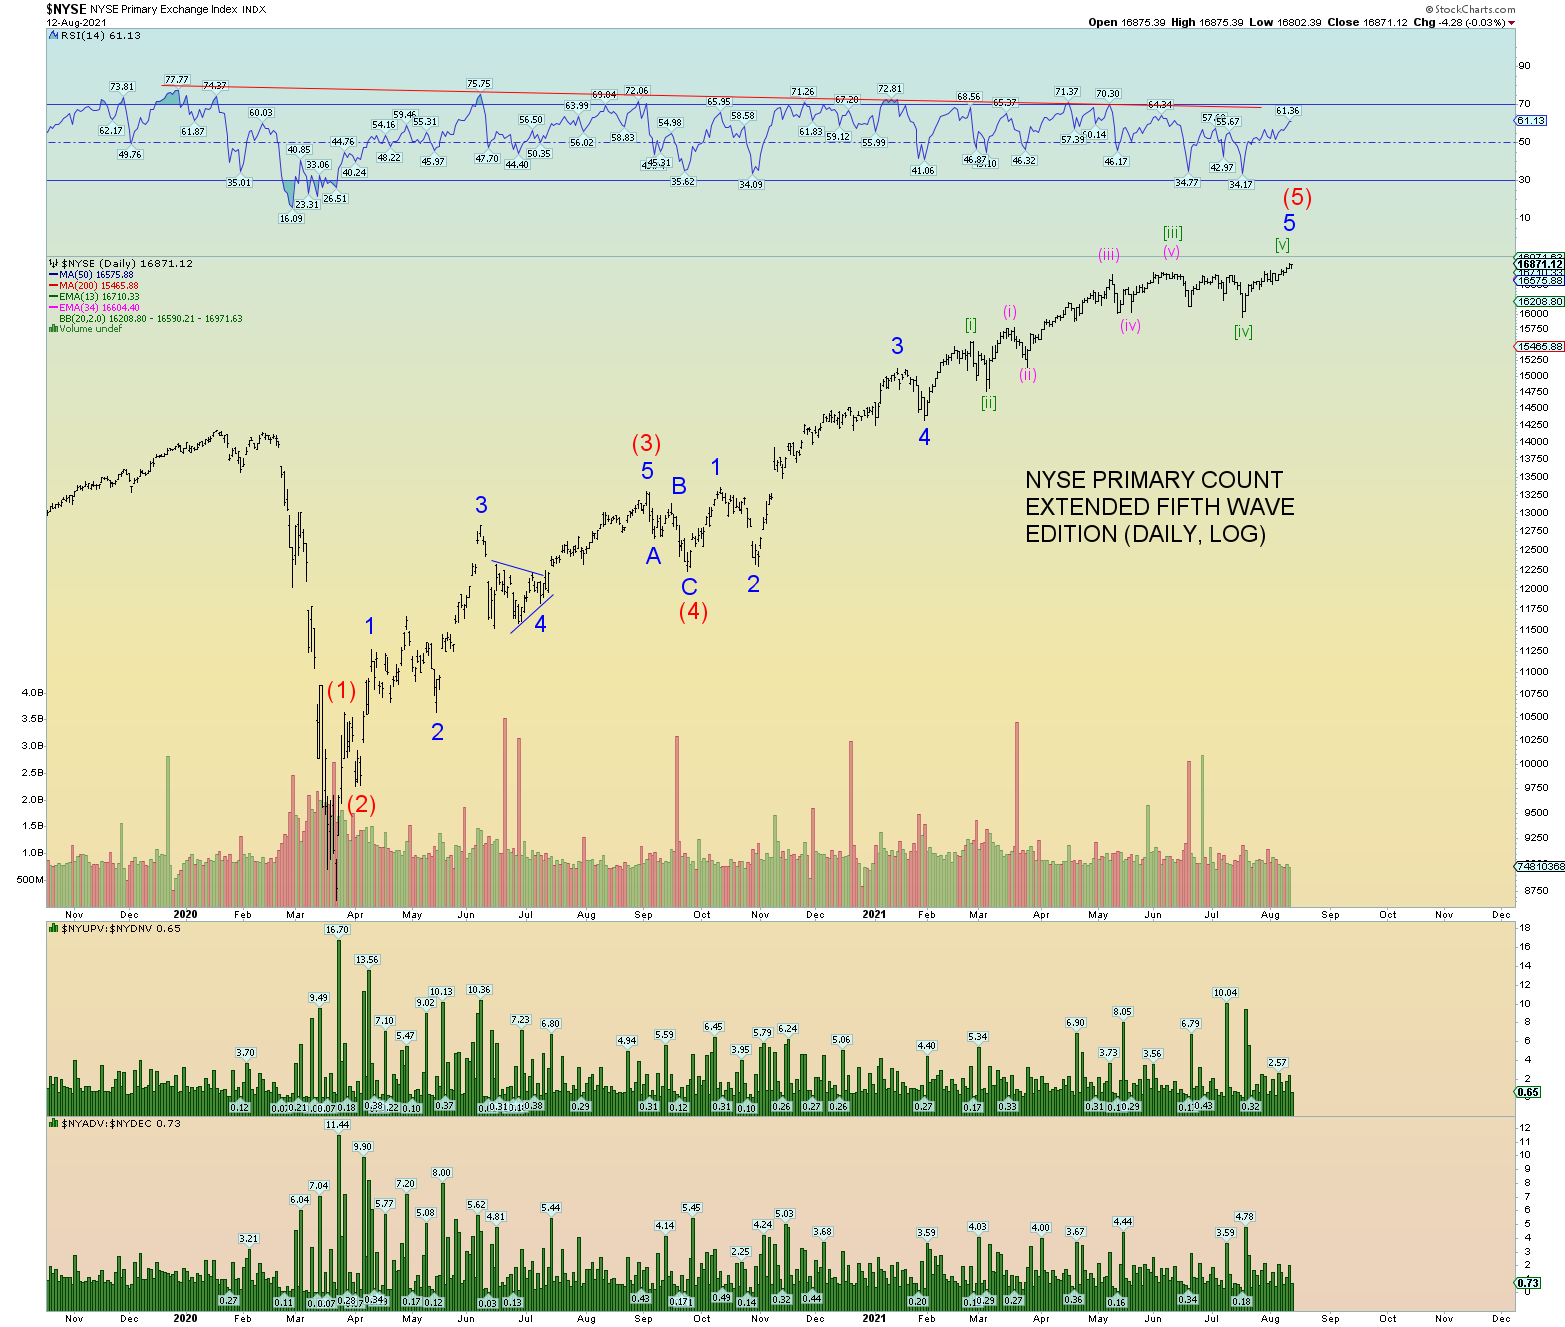
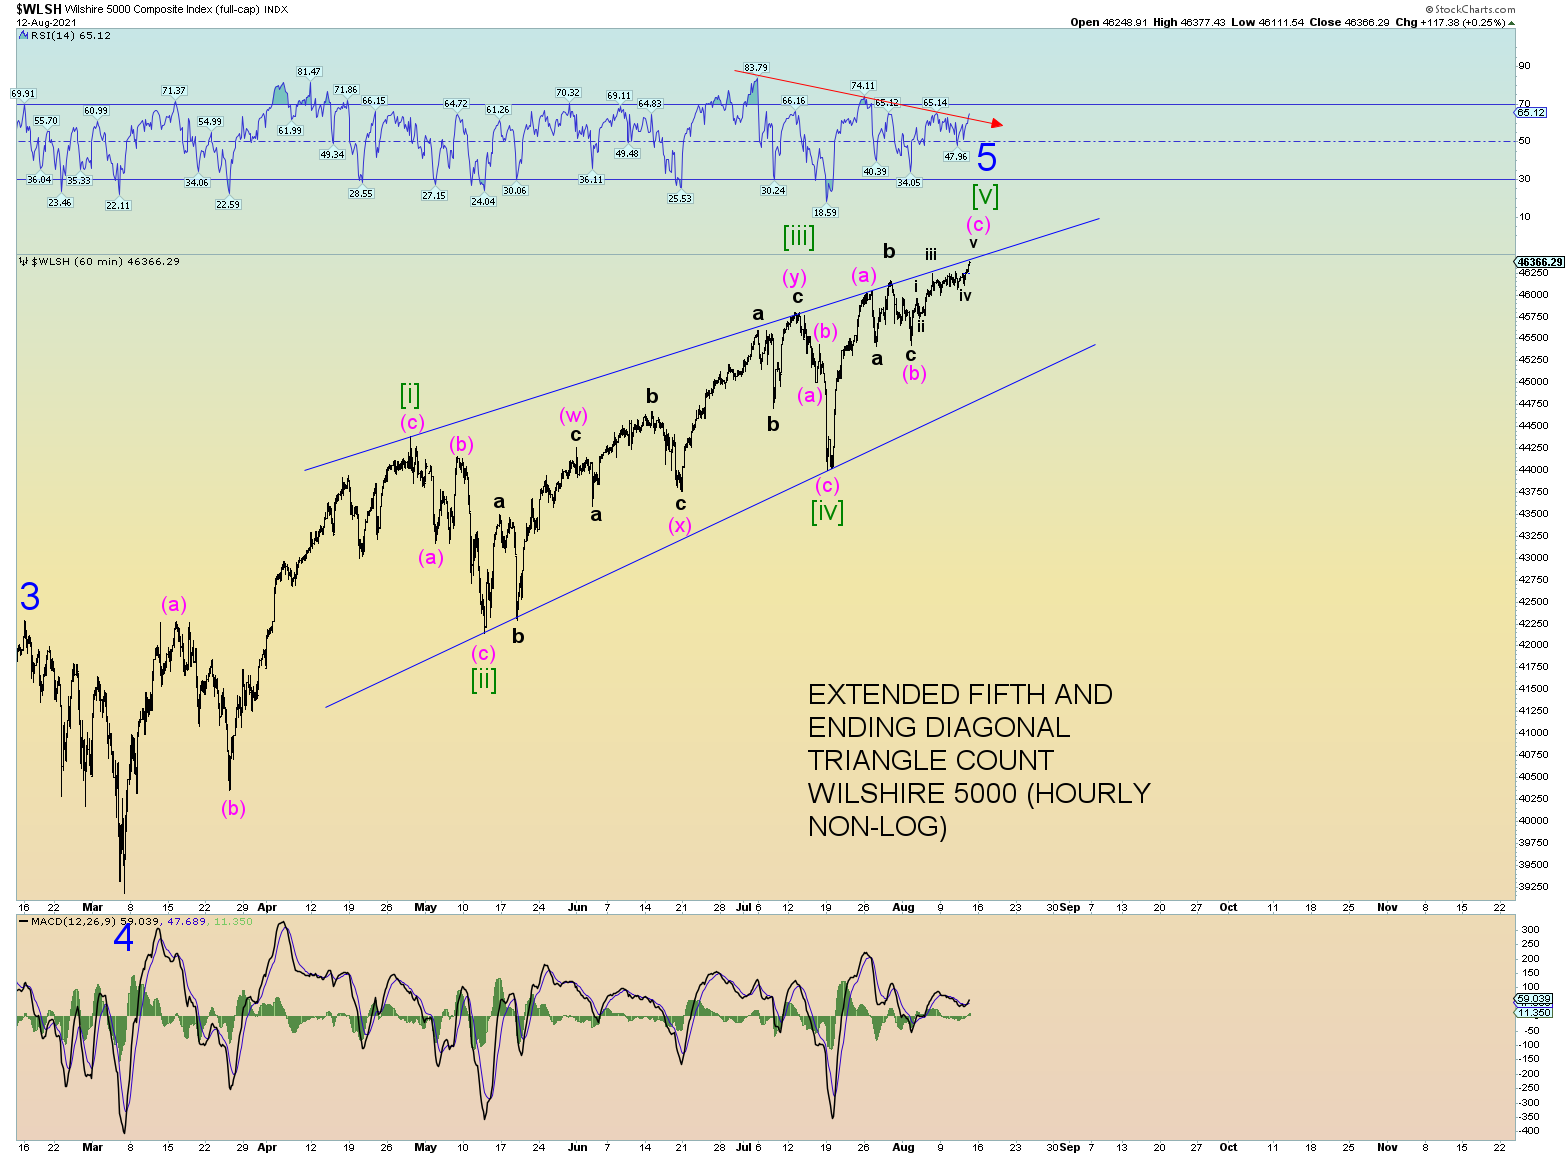
Or we have completed the wave structure.