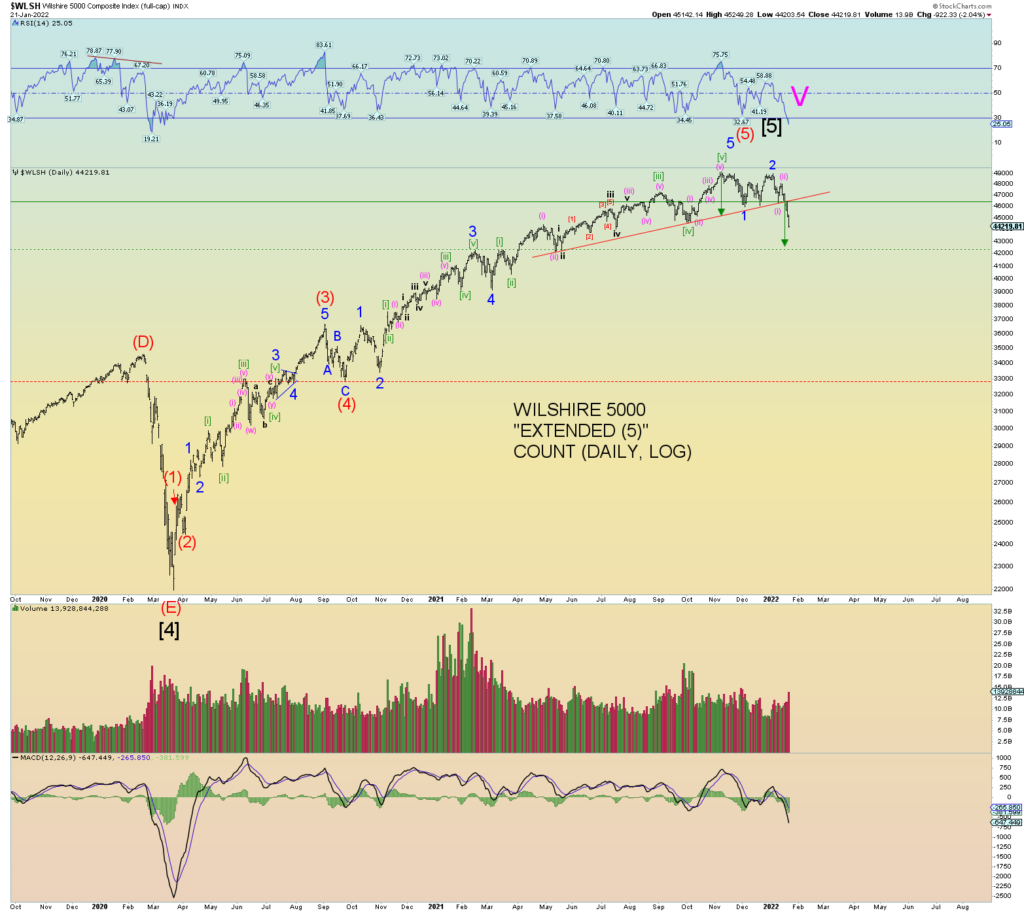
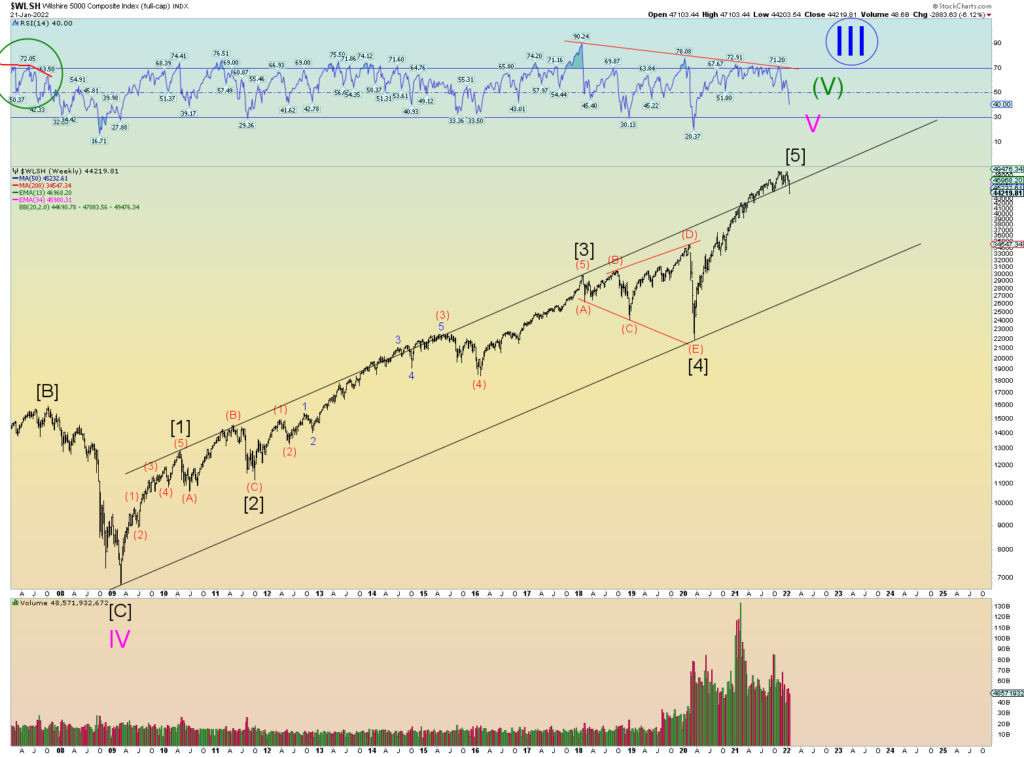
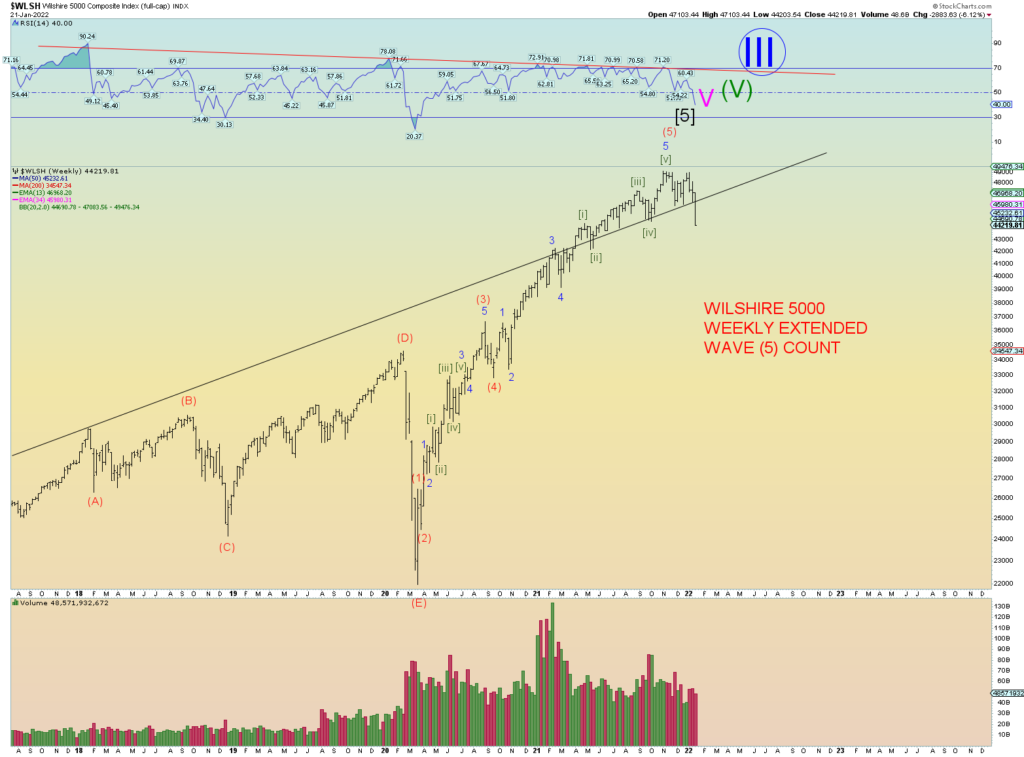
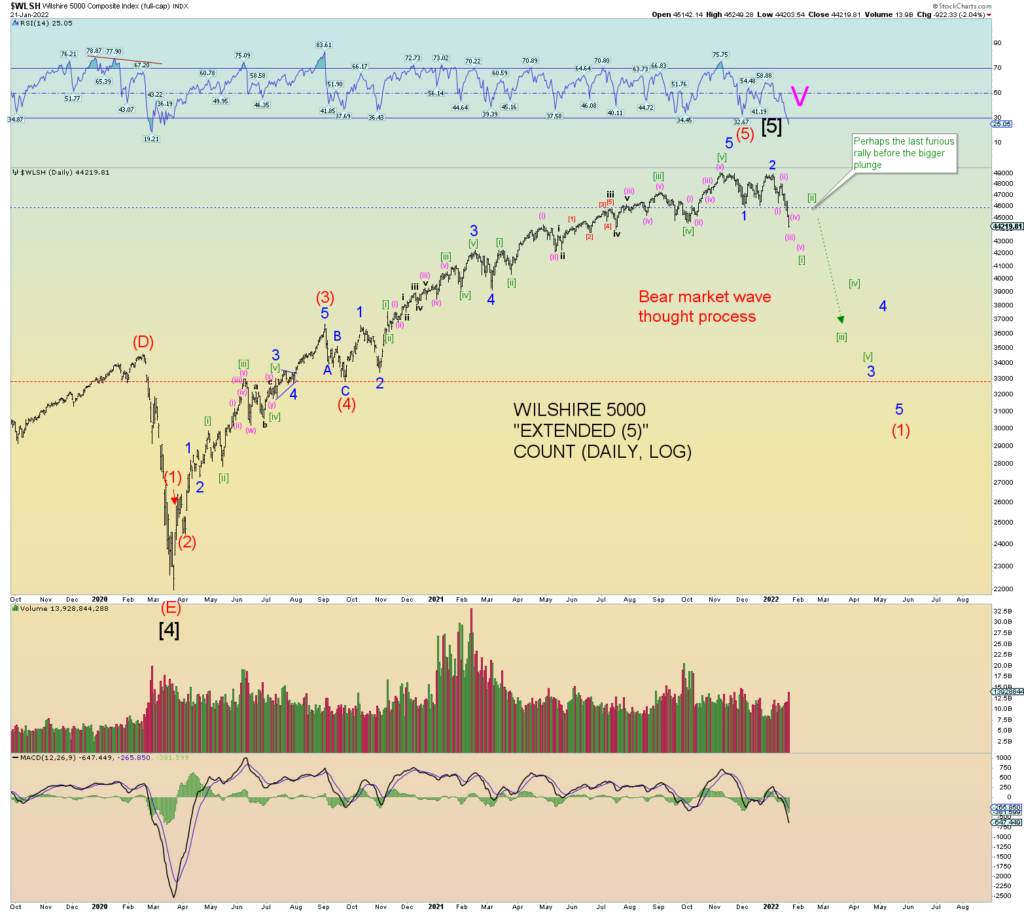
3 intraday reversals bear days in a row. The market probably just experienced a min- “third of a third” down. My attempt here at a squiggle count shows why this may be a “mini” third wave down. The Wilshire 5000 is now clearly impulsing down.
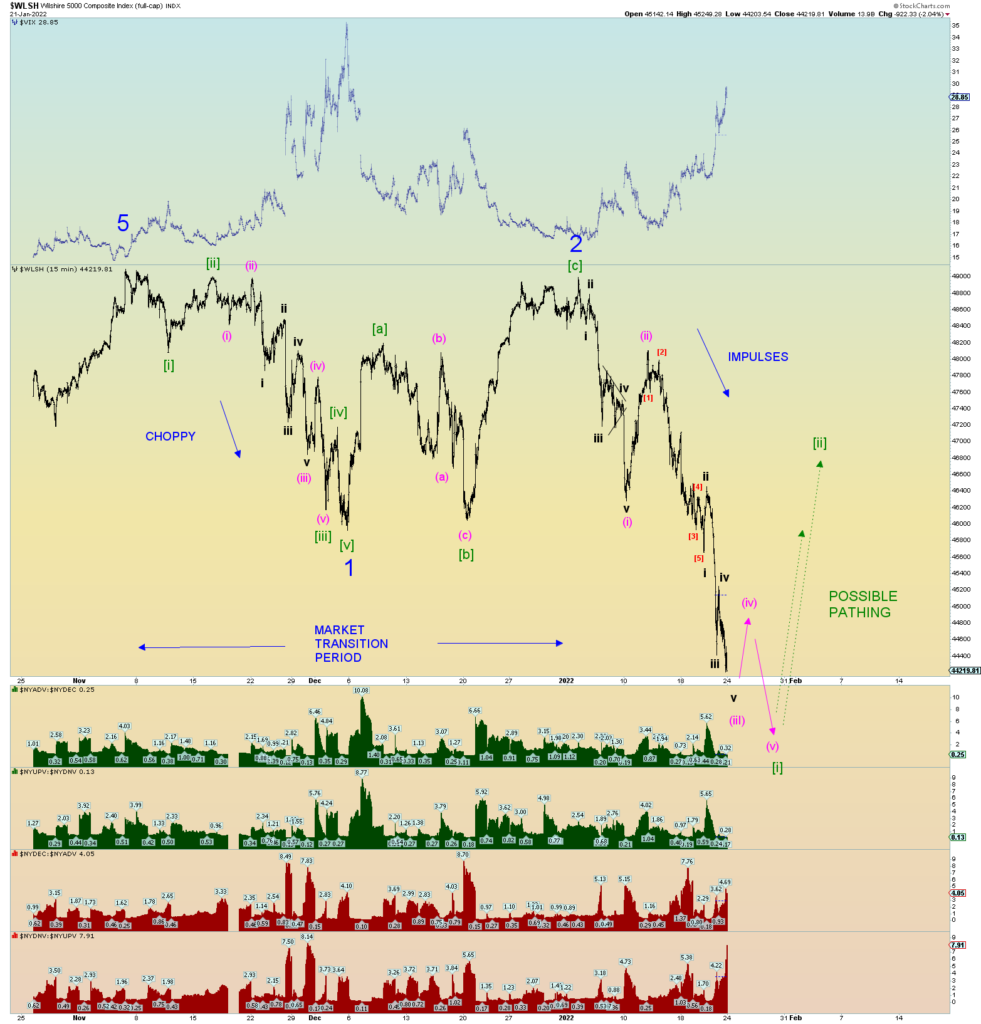
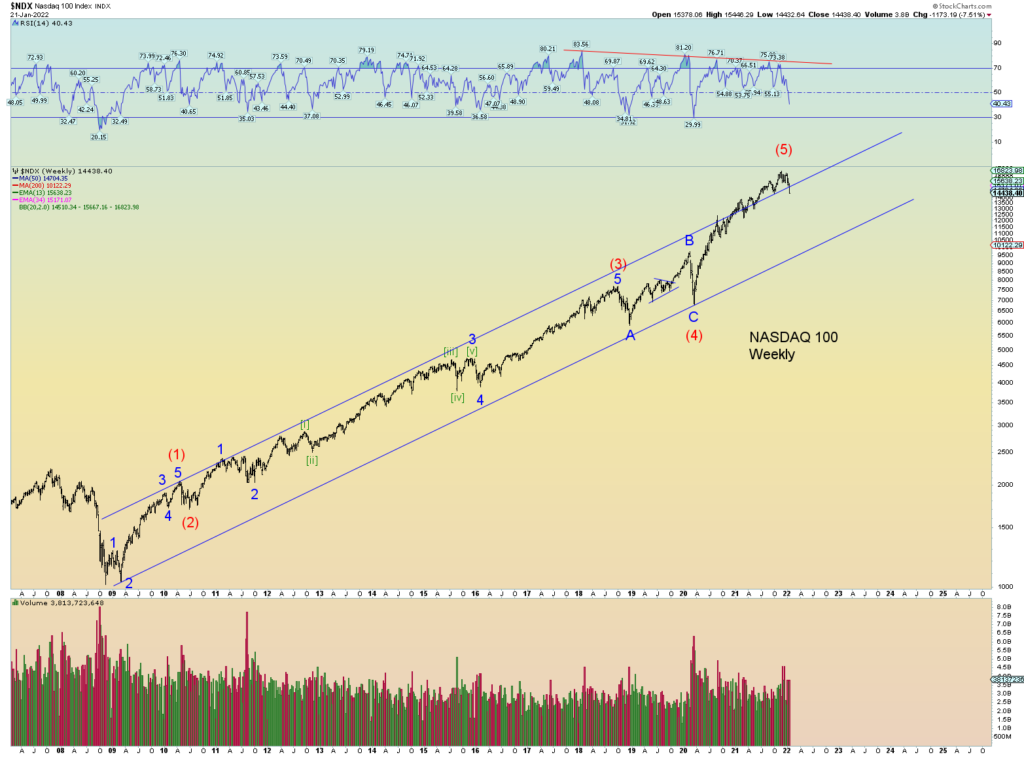
The following chart is a bear market wave thought process based on the extended wave (5) pattern to peak. The theory holds that prices will plunge back to beneath where the final wave (5) started which is just below wave (4). The bigger “oh shit” moment would be [iii] of 3 of (1) down. And specifically, within that structure wave (iii) of [iii] of 3 if you can imagine.
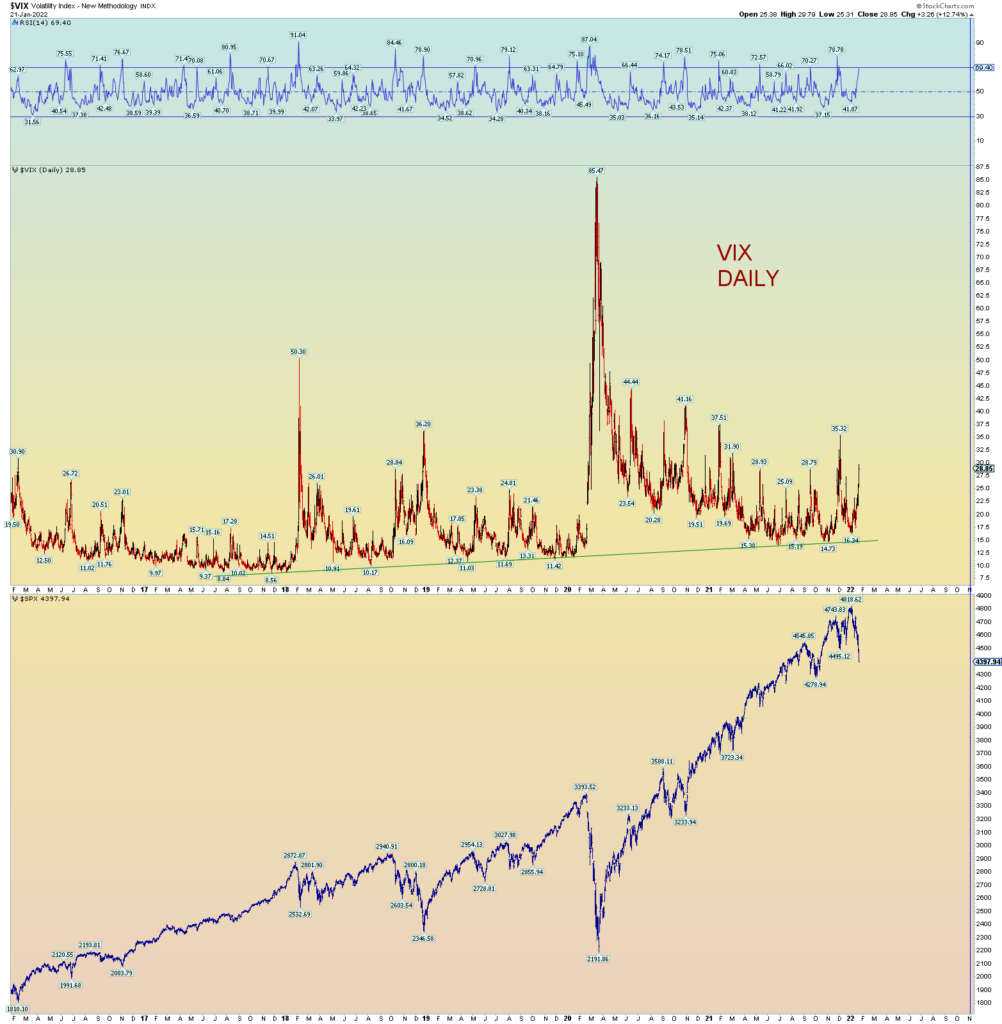
The VIX is still somewhat settled. No panic yet.
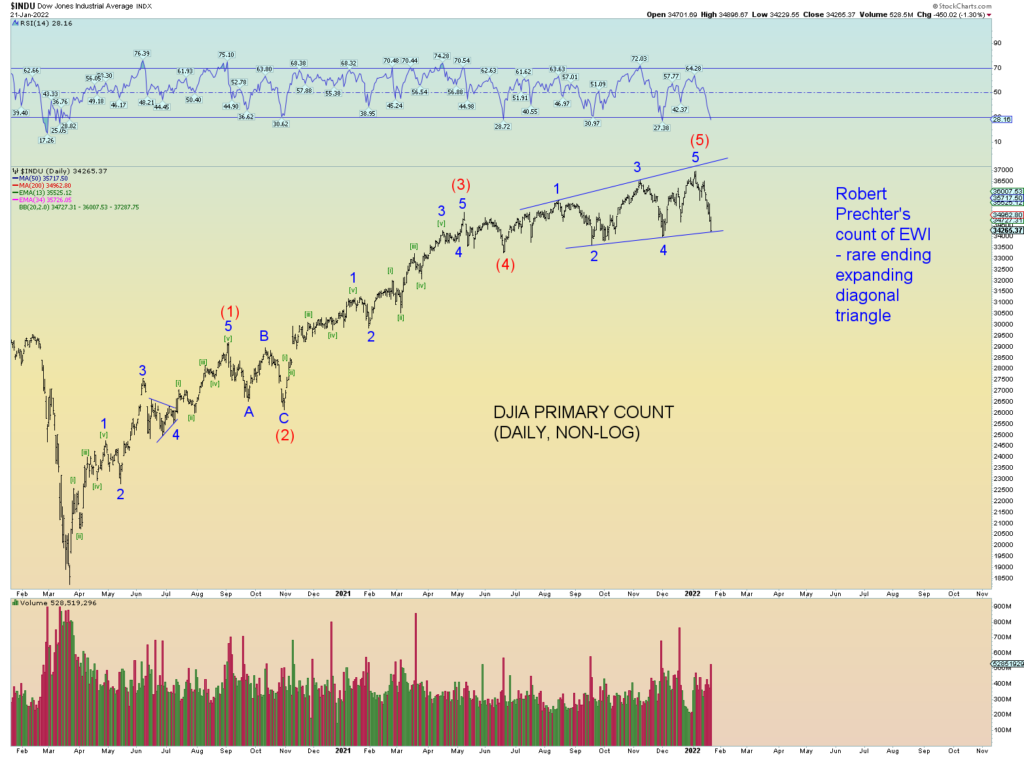
DJIA pattern at a key trendline.
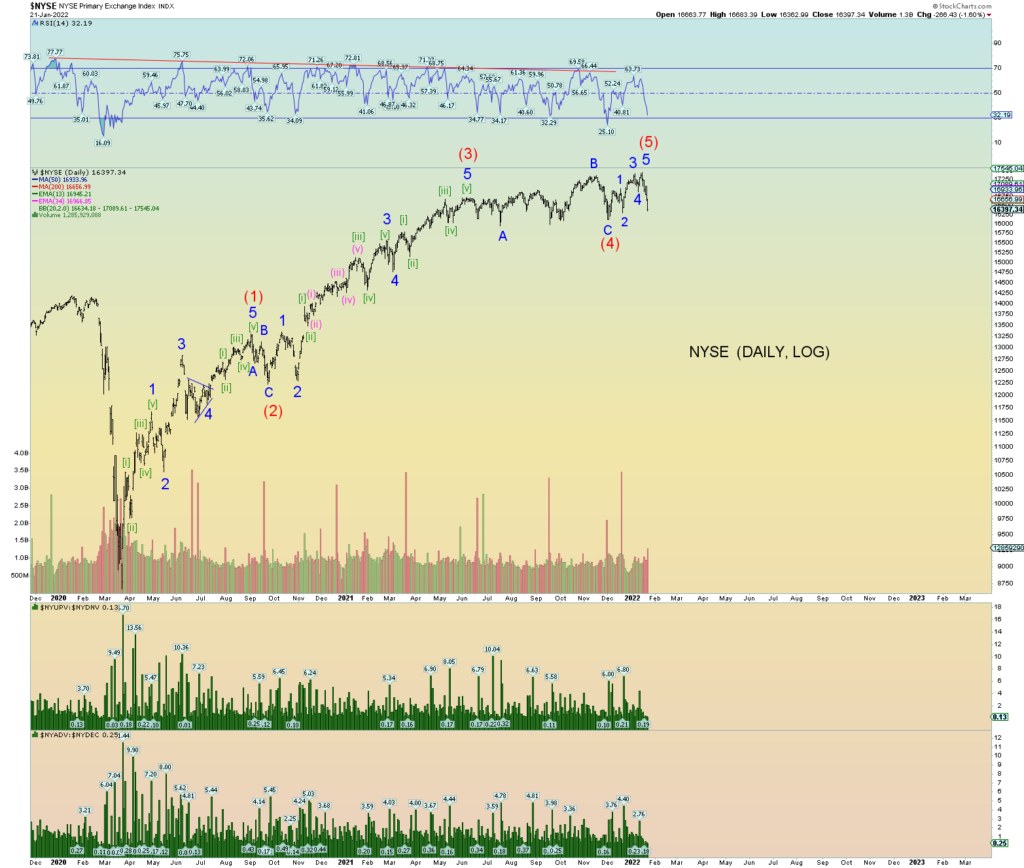
And the NYSE is just getting started.
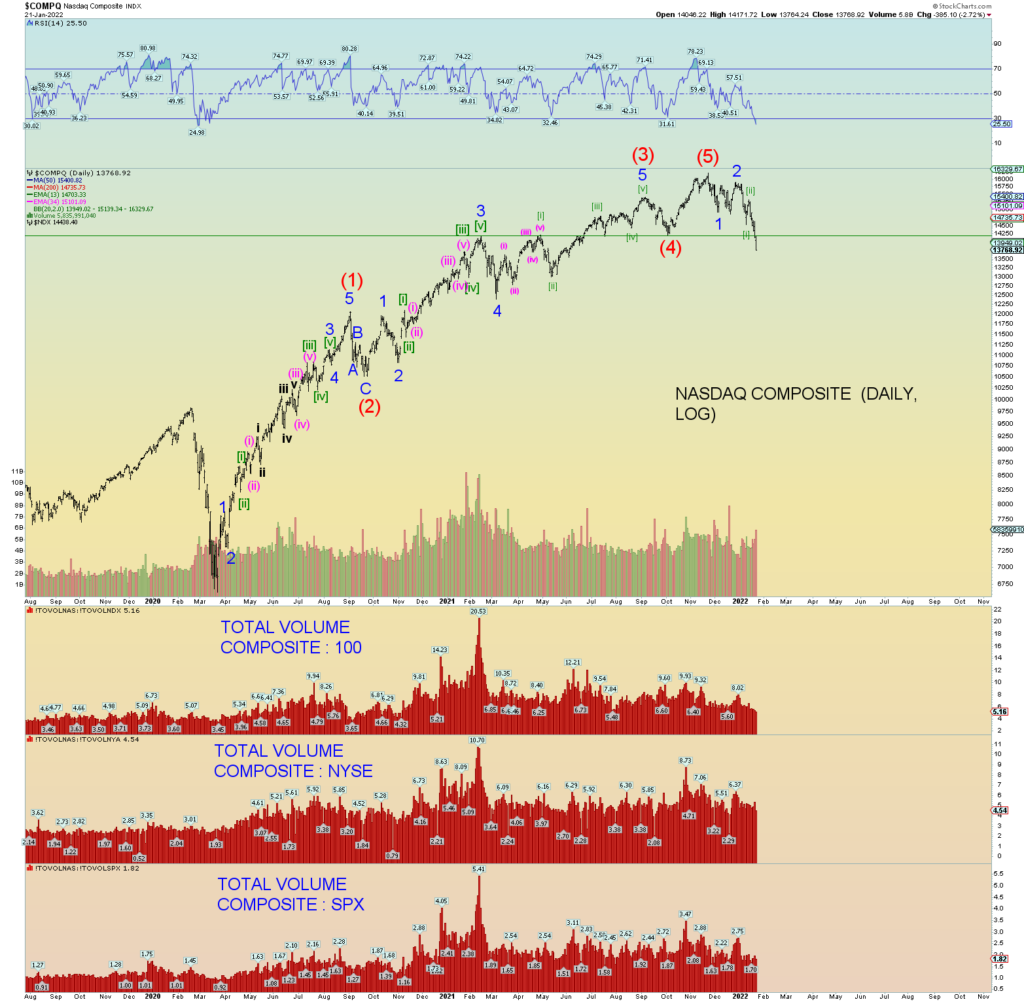
The Composite is now off 15% from absolute peak and clearly lost key support at and above the 14,000 range.
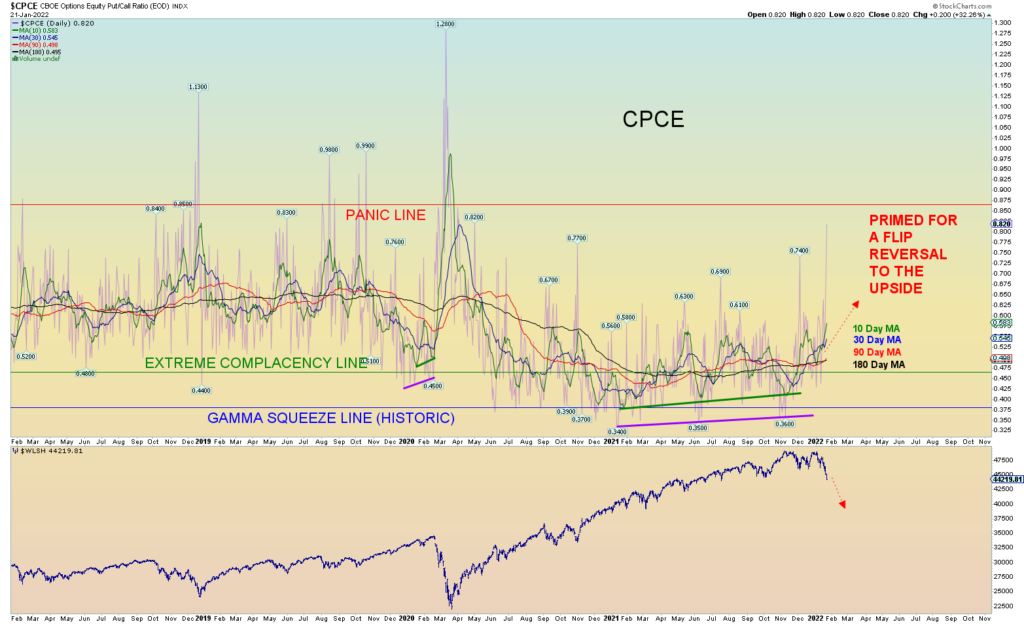
Finally, a print of .82 which I remind you is still biased more bullish than bearish. Not yet reached my panic line for the daily CPCE readings.
Short term head and shoulders target may be where [i] of 3 is eventually marked. The Wilshire daily is oversold for the first time since the panic in early 2020. An oversold market is where the danger can be as it can outright crash.
