Let’s talk price action, technicals, and other market stuff. Back on the day Russia invaded Ukraine, my market commentary was simple. I stated the following:
I was going to get very detailed in the market action analysis today. But I’ll make it simple. We have 5 waves down on both the Wilshire 5000 and Composite. Perhaps this is simply telling us this is the end of wave (1) down.
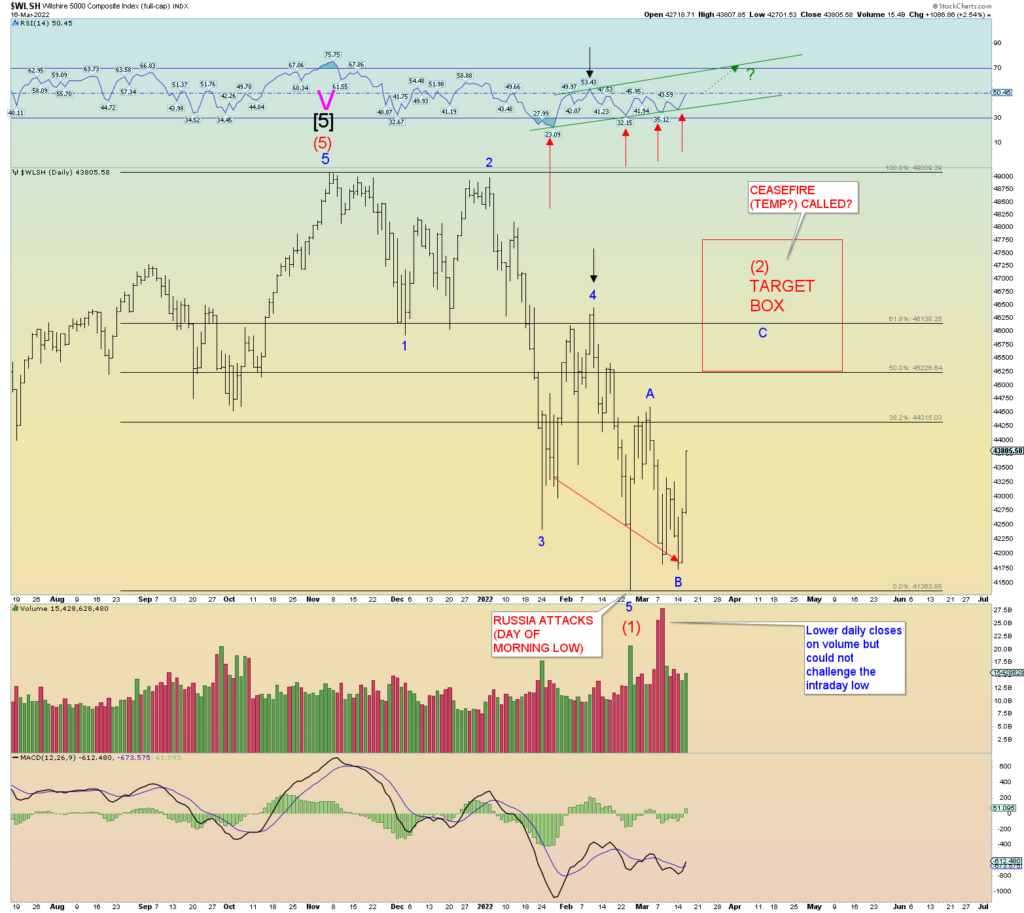
So far that morning price low of the day of invasion has held in the Wilshire 5000, DJIA, and SPX. You know what the saying goes…”sell the rumor (in this case war), buy the news (actual war)”. And so, the market has held up technically and the Wilshire has strong positive technical divergence on the RSI. Lower price closes and higher RSI strength. We may simply be in Intermediate wave (2) as was suggested back on the 24th of February.
If that is the case, I would expect – at minimum – a 50% retrace of the price drop from the early November peak.
Again, sell the rumor is the opposite of buying the news. Horrible things have happened since the 24th and the world markets are in distress. Yet, China bounced hard yesterday as did the US markets which now have a very strong 2-day run backed by numerous technical positive divergences.
All this to say is that if this is Intermediate (2), we are likely on the back-end wave C of (2). We had about 3 1/2 months from peak with diverging peaks in the SPX and DJIA so things are a bit disjointed at the Grand Supercycle top which one could expect.
The high red daily volume bars I point out in the chart below seems, at the moment, like a washout. Forced market action lower yet the intraday pivot low was not challenged. I expected a continued rise in heavy volume down pushing prices lower but that hasn’t happened – yet. Advantage: bulls.
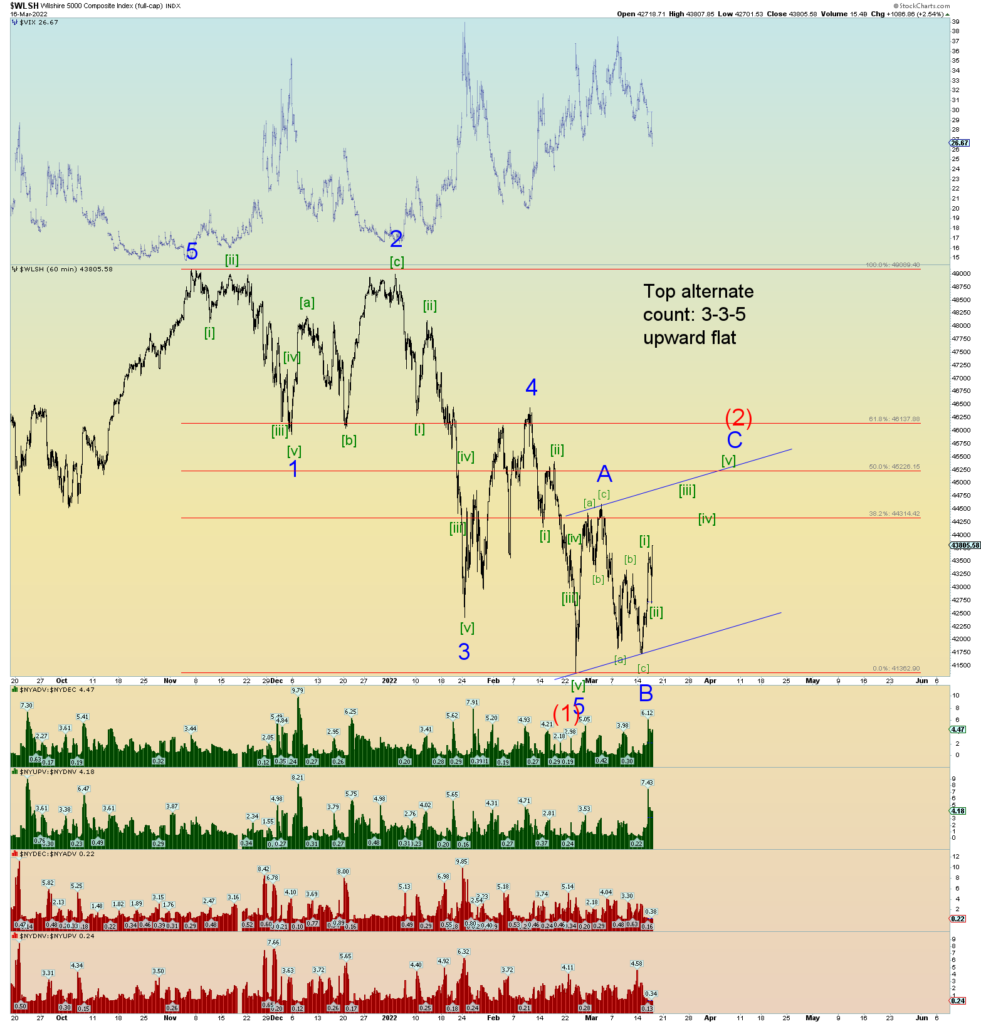
A possible squiggle count of (2) using the hourly. Would result in about a 50% retrace perhaps a bit more muted than was suggested with the daily chart above.
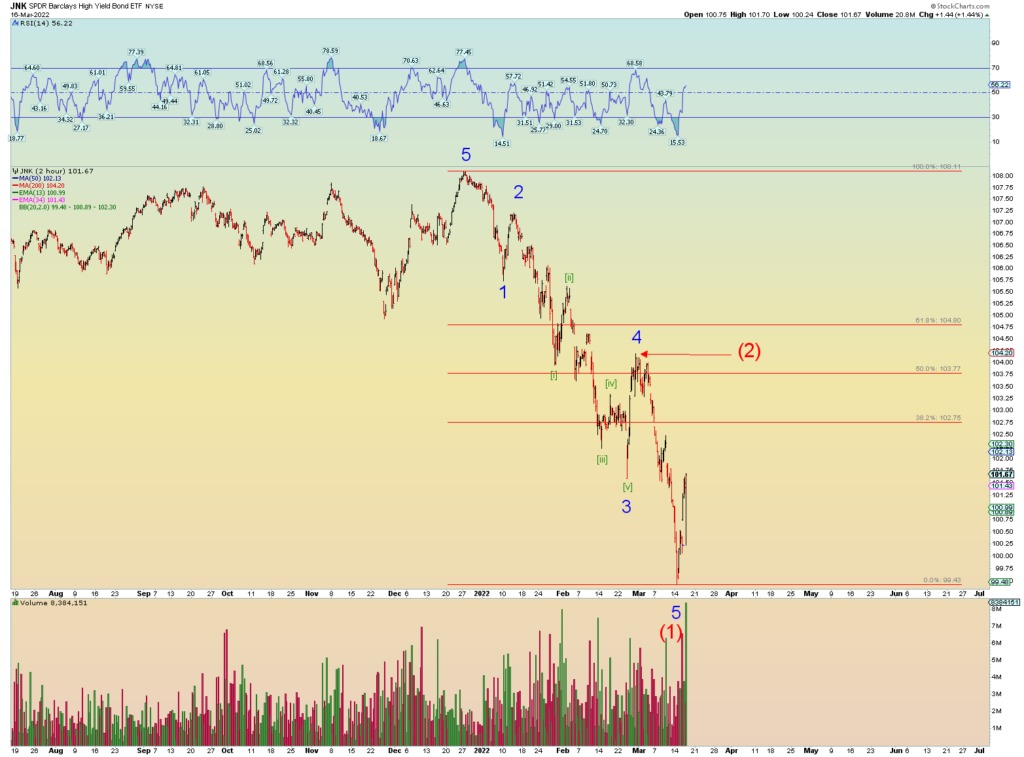
Junk perhaps bottomed in its own wave (1) down. This is important because if credit tries to repair itself a bit (nothing ever goes straight down!) the overall market should do the same. But ultimately it will fail. Like the Titanic, the fatal blow has already been dealt and many just do not realize it yet.
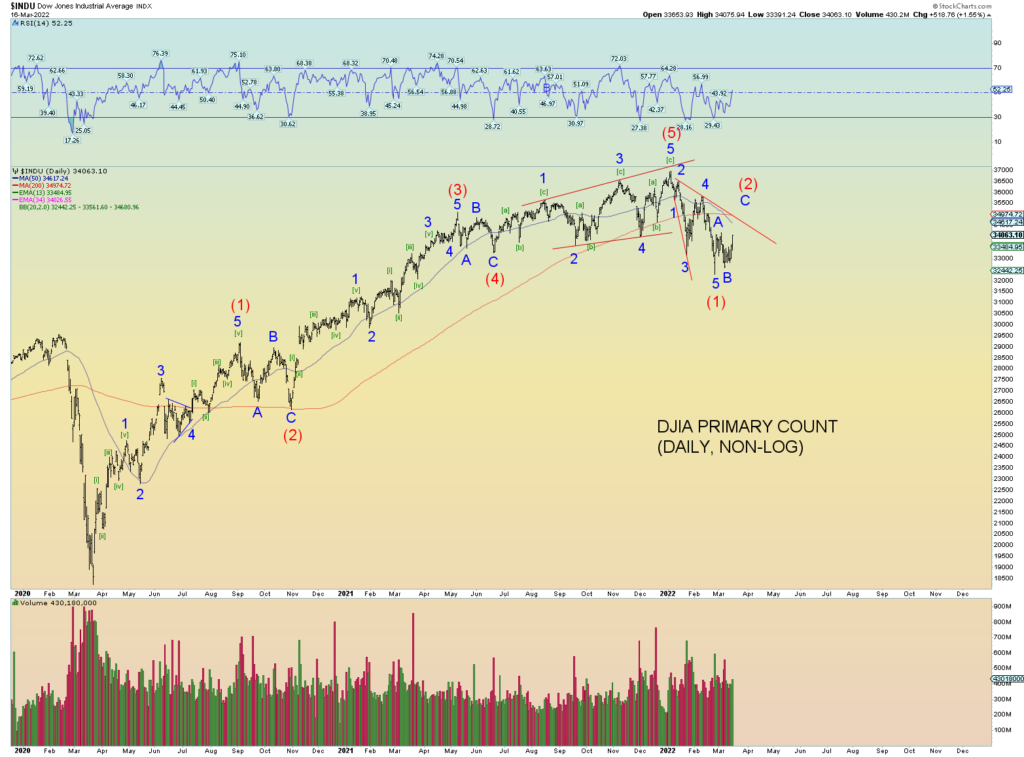
So, what would the DJIA and SPX look like if the 24th was the wave (1) actual low? Leading diagonal triangle. It works ok on the dailys at least.
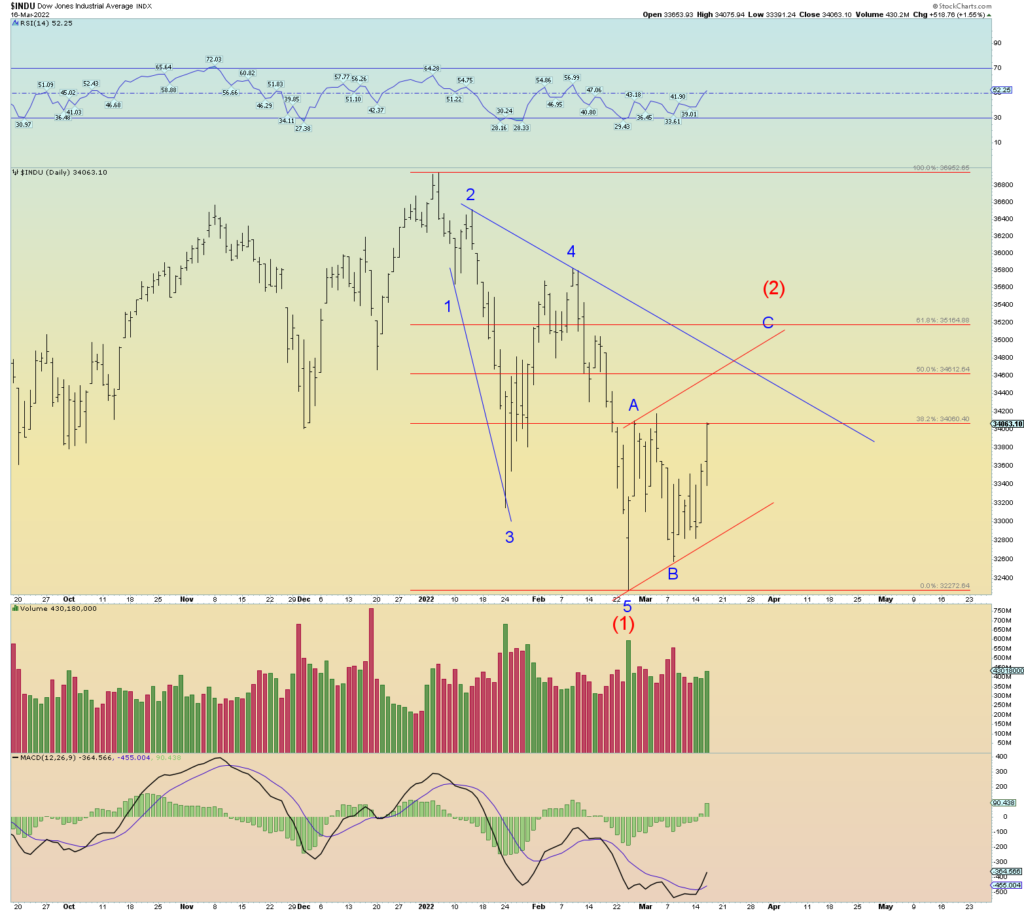
Remember, at a Grand Supercycle top, the waves are going to be in a state of transition going to the top and rolling over. Just look at the way the DJIA counts to its top. Also, a diagonal triangle.
On the DJIA chart below, it could be as simple as prices need to reach back toward the downward red trendline before resuming down in wave (3). As I said, if this is wave (2) we are likely on the tail end of things which being wave three – C – is the strongest and will get everyone excited about the market again before pulling the rug out. This is why the “news” is to be ignored in wave counting. The Ukraine War has demanded that equity prices keep going lower but so far they have not since the opening war salvo. This is the contrarian nature of markets.
But contrarian markets aside, a Ponzi scheme is just that – worth zero. Once a Ponzi scheme is identified it goes (correctly) toward zero despite 100% negative sentiment. There is no “contrarian” saving play. I propose that one day in the future the markets will practically do the same despite negative sentiment for they are mostly all a Ponzi scheme also.
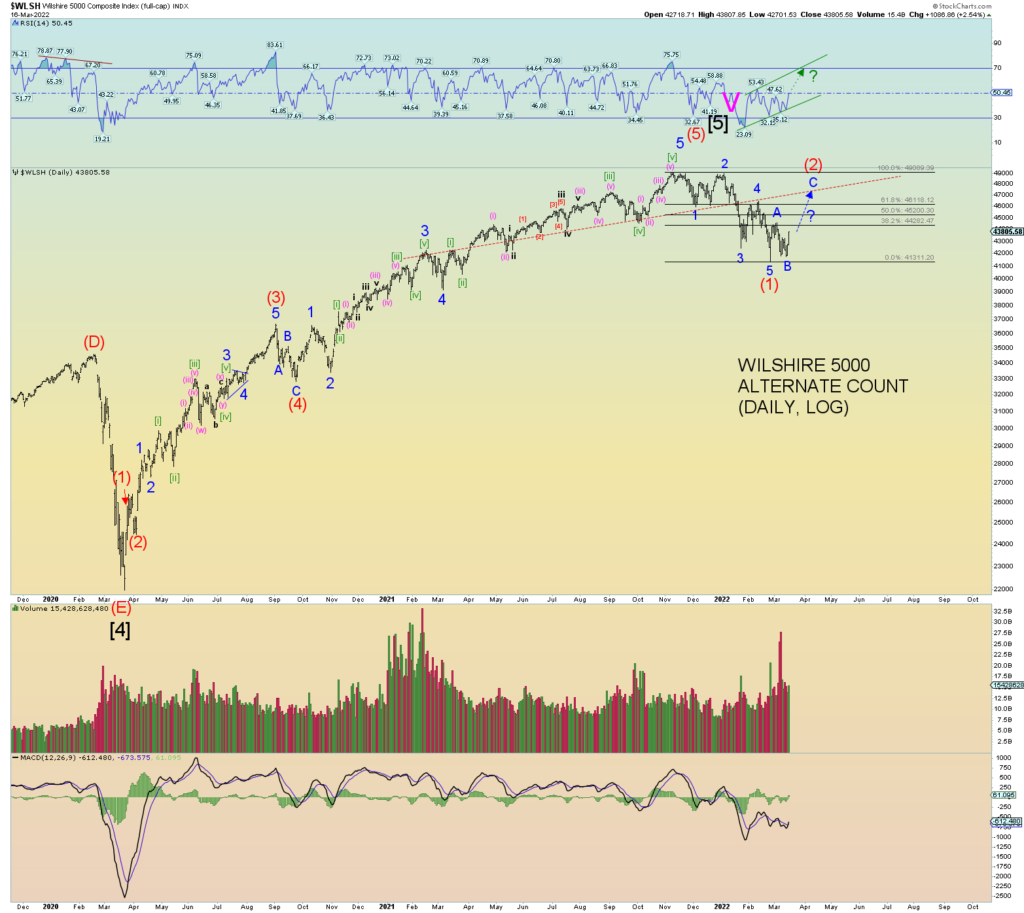
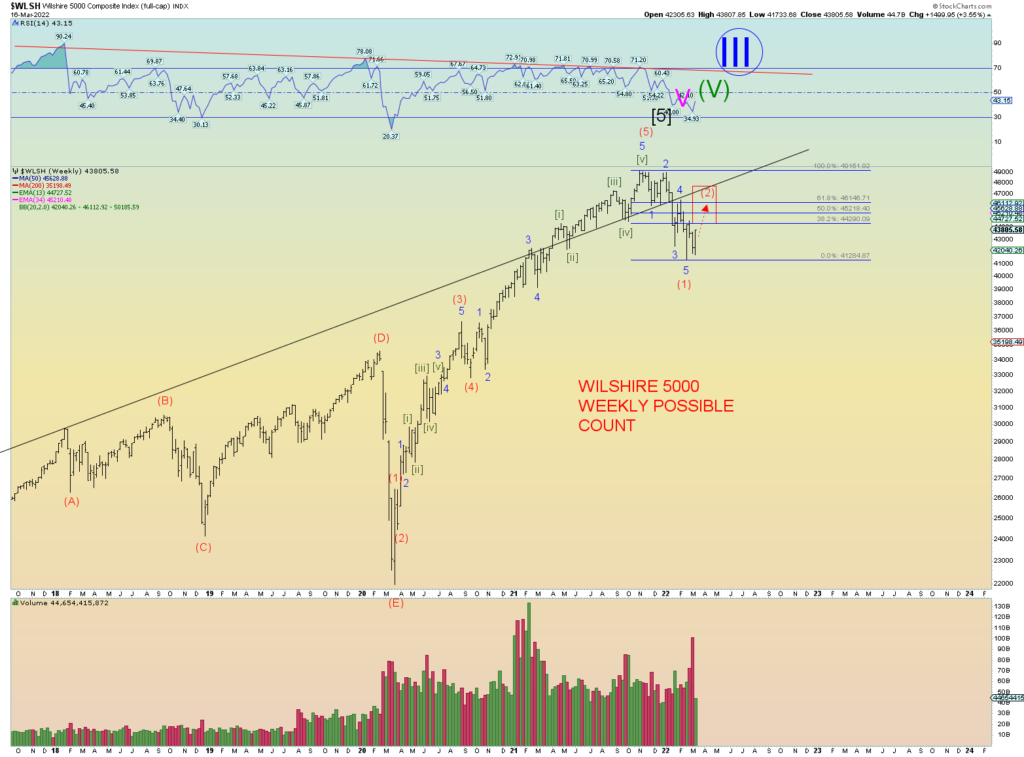
The ultimate price rise would be a backtest of the upper channel line shown on the weekly. That would take prices above Minor 4 of (1) down.
Ok now that we got that count scenario out of the way, let’s look at what we currently actually have as waves. We have a series of one-twos so far and nothing more. Therefore, despite all my fancy market projections stated above, it would really be easy to just rollover and die in an earth-shattering “middle of the third” wave lower. The market is not to be trusted at this point. Roller-coaster waves of 2-3 % swings overnight into the daily sessions is exhausting. A high steady VIX could explode (capitulate) much higher. And although many think that certain markets have already capitulated, the overall US market has not. There has been nothing close to a”90%” downside across-the-board day just yet.
So, despite all the above I’m still bearish until proven otherwise. BUT, if this count is correct, it has run out of options. The market needs to go lower immediately for the bearish count to bear fruit.
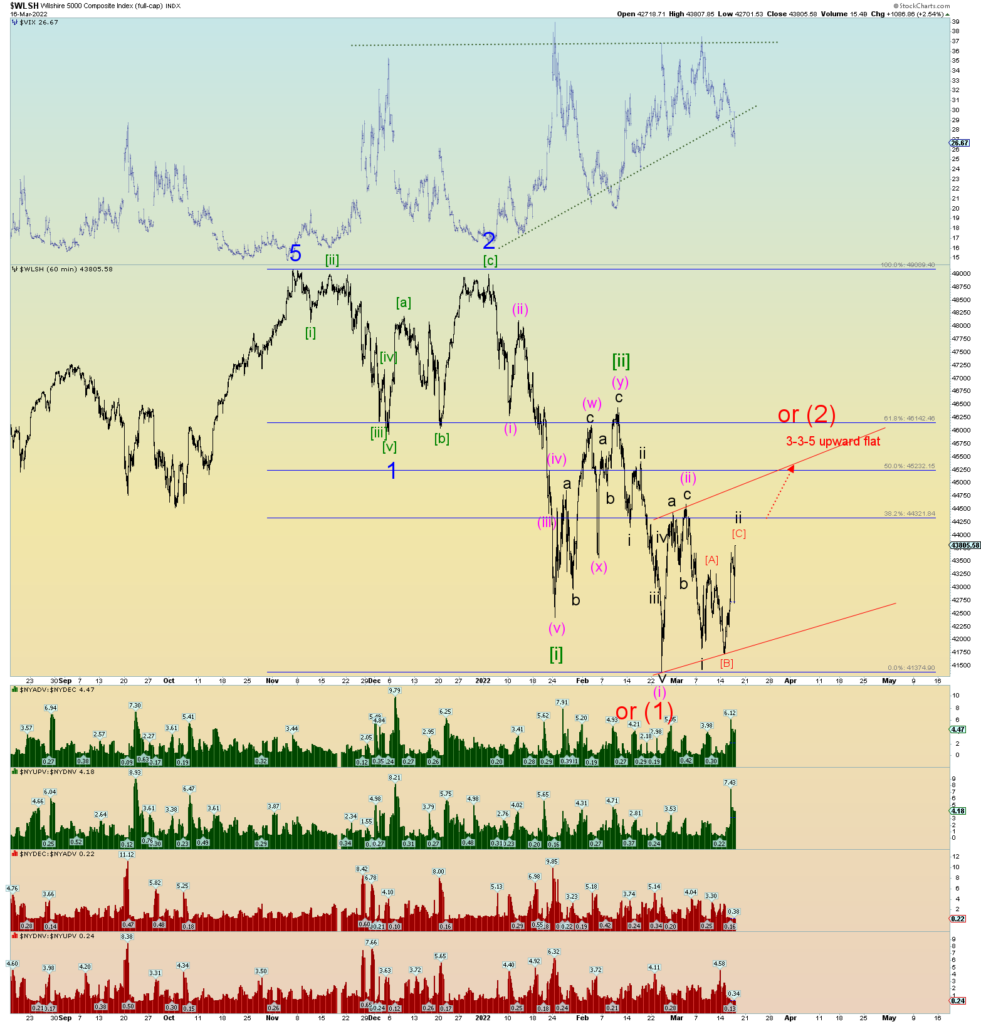
A price push to the down trendline would still keep prices below pink (ii). This is still the primary count because until proven otherwise, we have not broken the rule of “lower highs” just yet. “Selling the rip”.
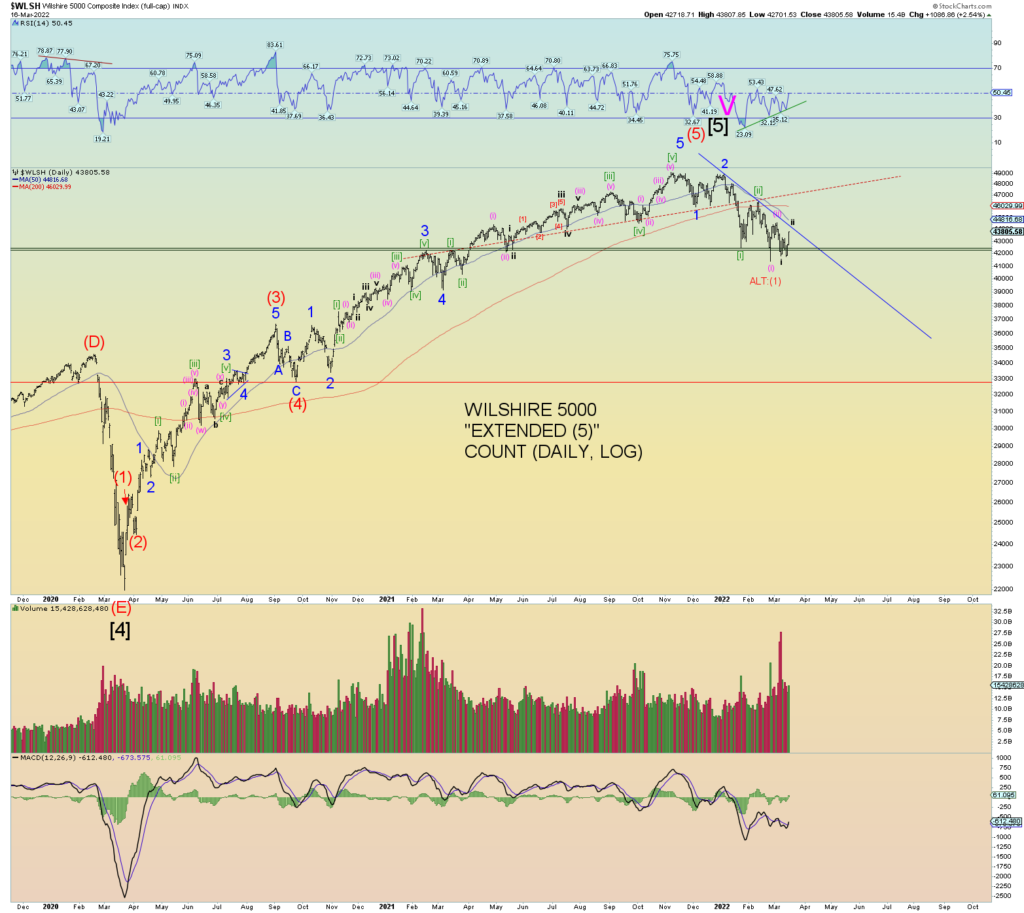
CONCLUSION
Good market technicals and certain wave counts in other indexes suggests we are in wave C of (2) and it has a bit further to play out. YET even so, I primarily count the Wilshire 5000 and until pink wave (ii) as shown on the above chart gets taken out along with the down trendline, the more bearish count remains as primary. I felt I need to address the other option more vocally than I have been.
It comes down to this: a price rise above pink (ii) likely means the Wilshire 5000 is in Intermediate (2). So, despite the positive technicals and what not, until and unless the series of “lower highs” is nullified, the more bearish count remains as primary.