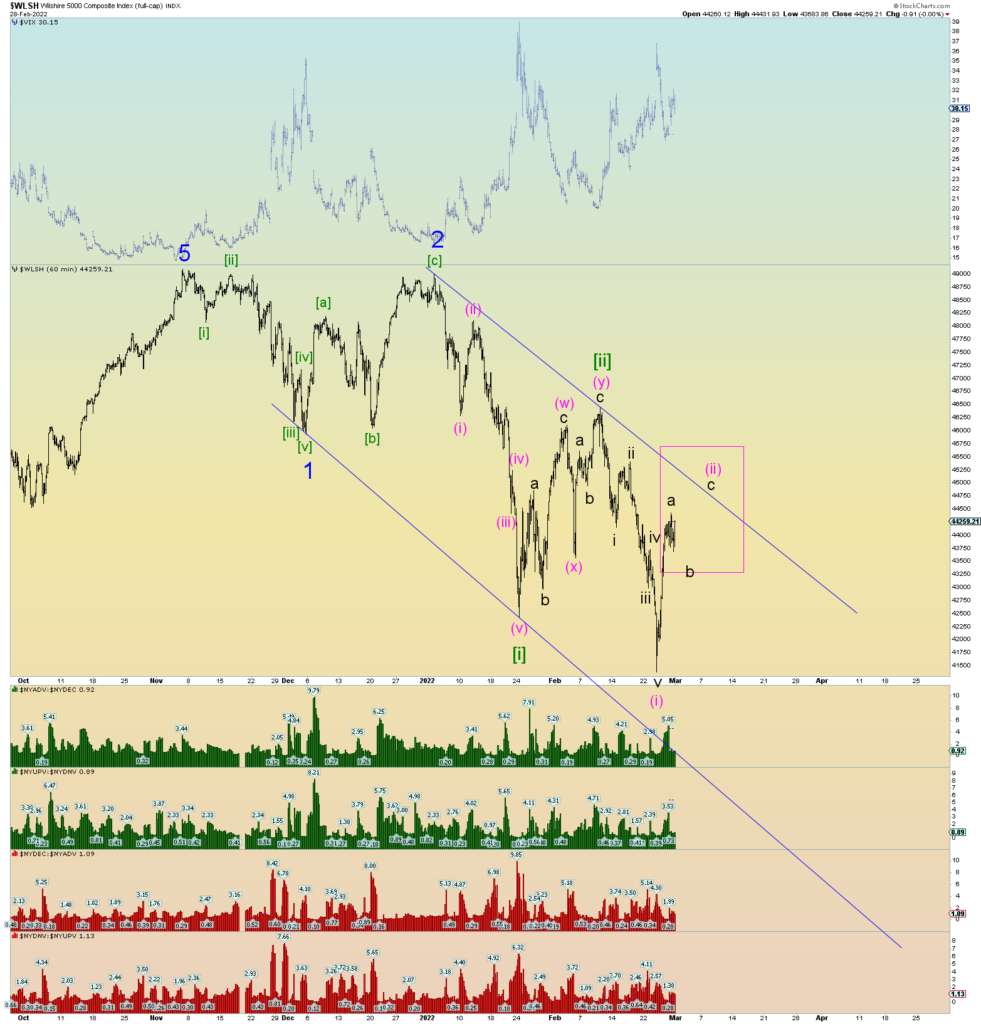
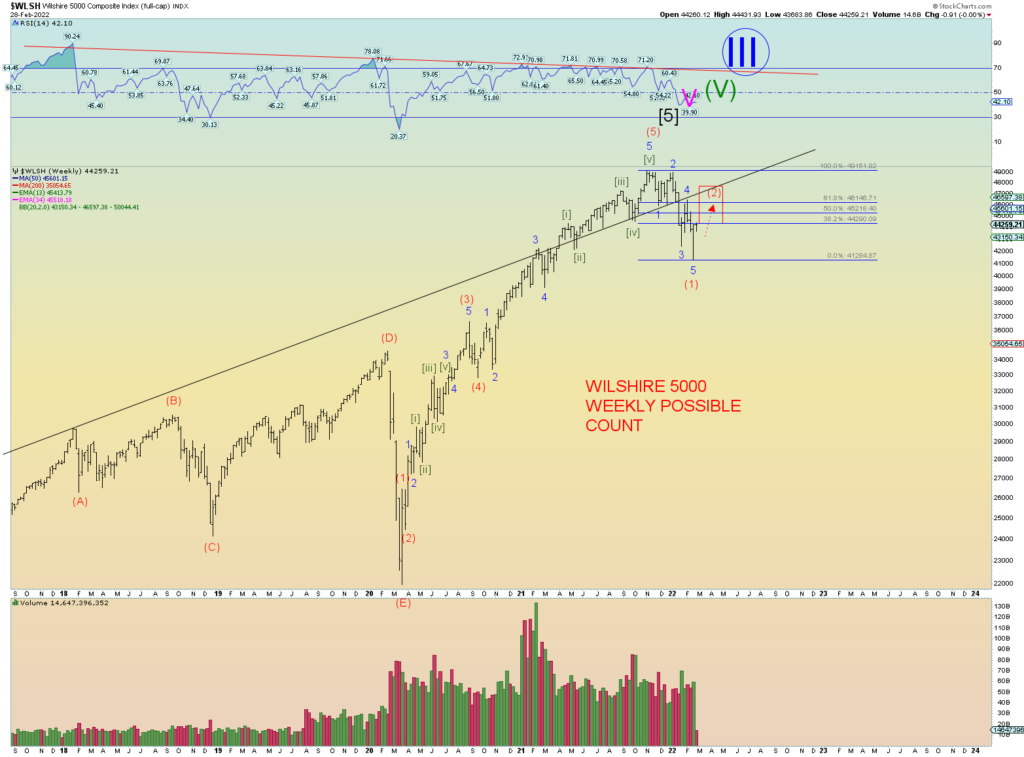
There are two basic competing primary wave counts in the Wilshire 5000 at the moment. The first is that the current rebound is merely a subwave (ii) of [iii] of 3 down and it will turn down sooner rather than later and prices will be capped from going to much higher. The chart below shows the count. At most we have about a week or so and perhaps prices top out at or near the blue downtrend line.
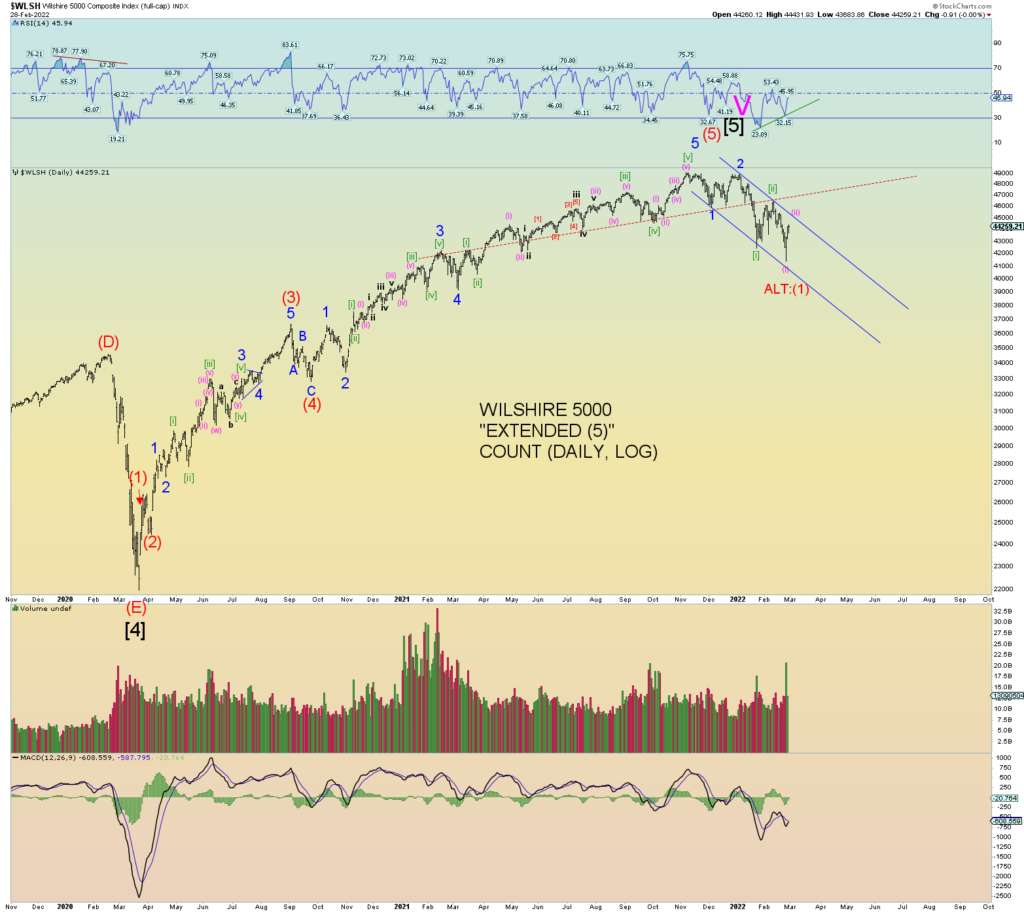
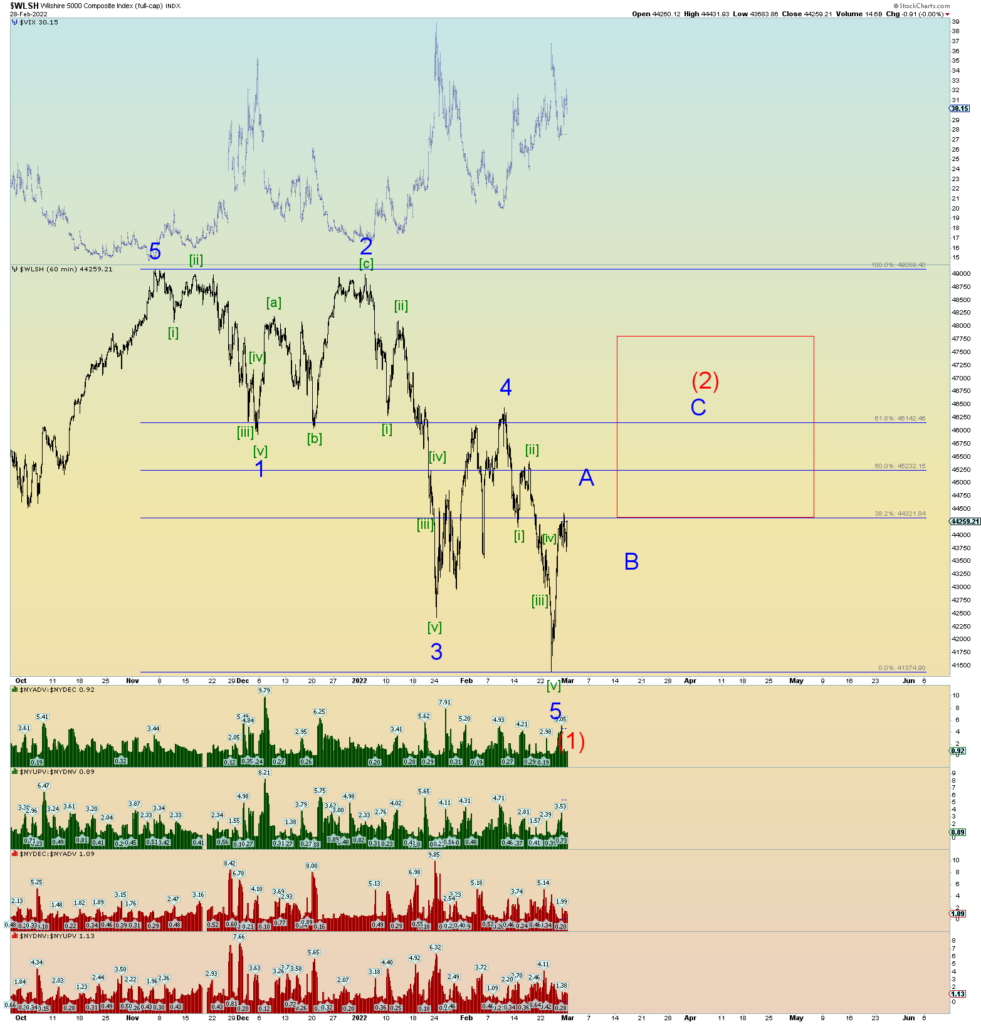
The second count is similar in structure yet is a more sustained rally scenario in both time and price. Instead of a minuette subwave (ii) we are actually looking at Intermediate (2) and it will take some time to develop. Yet prices should not reach a new all-time high so regardless both counts are similar in that regard. There is a lot going for this count including that market internals have been actually tame relative to the outsized VIX moves.
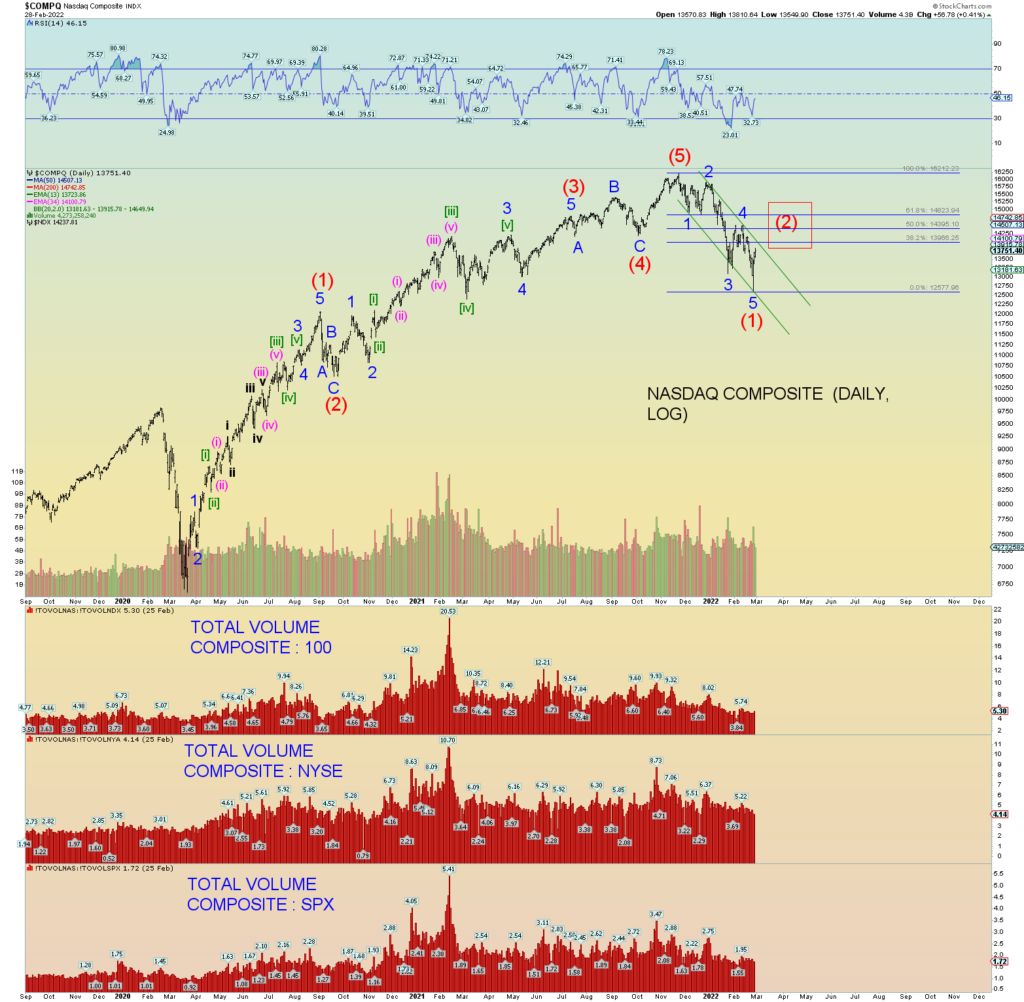
The NASDAQ Composite supports the count above in that it too has a very good 5 wave structure down which implies a corrective of the entire 20+ % drop is being corrected upwards before a continuation of bearish price action.
CONCLUSION
There is a myriad of reasons to support both counts at the moment. The more bearish count “predicts” that a 90% down day across the board in both volume and declining issues is “due” very, very soon, yet it hasn’t even come close to happening which can be seen as both bearish and bullish.
Bullish in the sense that the dip is being aggressively bought and selling has been orderly since the November peak. Yet that can also be gauged as bearish. The dip buying fever has not been broken and only a bear market can break that fever. Teh NASDAQ briefly dipped into bear market territory yet was bid up again.
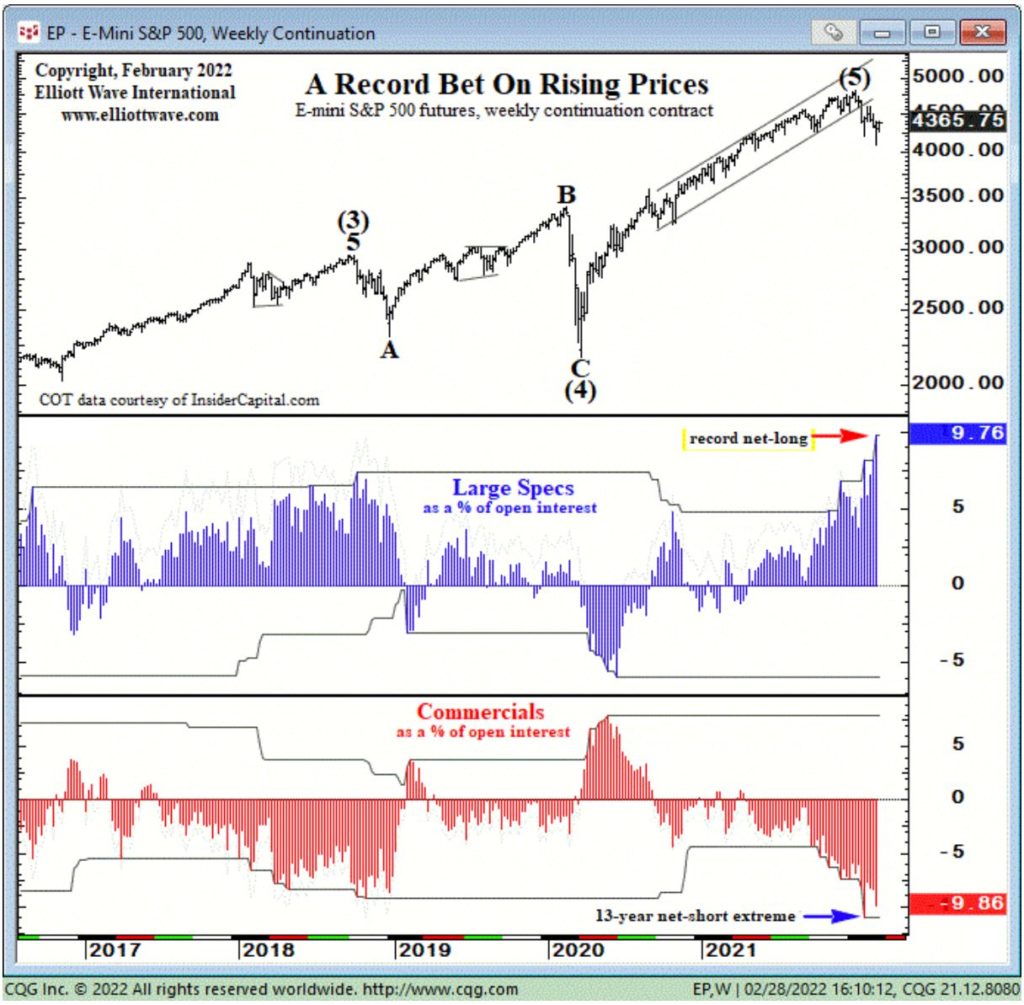
For instance, Elliott Wave International (click my links to left to become a FREE club member) showed that the commitment of traders report on Friday reached an all-time high Large Specs “long” stance. So, despite a possible WWIII starting, they are as bullish as ever buying the dip and adding to the long positions. Though this is not a great “timing” sentiment, it is very illustrative that despite what you hear, you can see what the market is doing; and that is speculative buyers have remained excessively bullish which can be viewed as ultimately bearish.
But again, this is not a great timing chart. So, we await to see over the next few days of what count will prevail.
I favor the more bearish count in part because the SPX and DJIA have not yet had a bonafide 5 waves down.
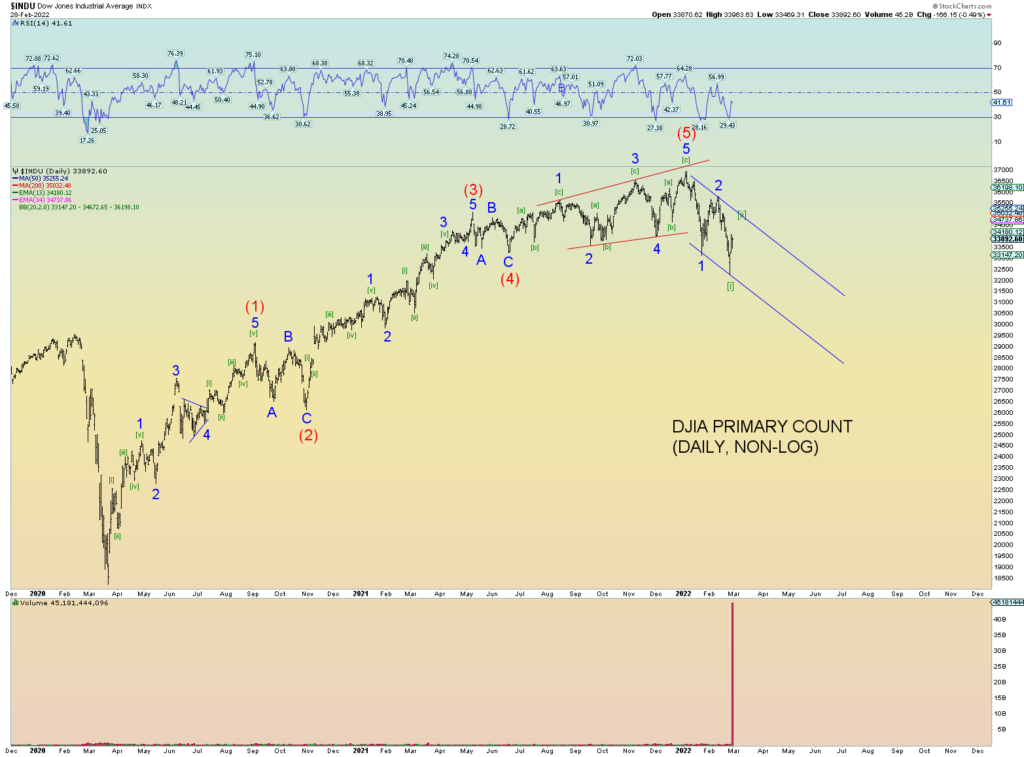
The DJIA count shows the conundrum. There is room for more price advance yet keeping in line with the overall wave structure. The DJIA could advance another 3% or so over the next week or so and the wave structure shown below would remain perfectly intact.
