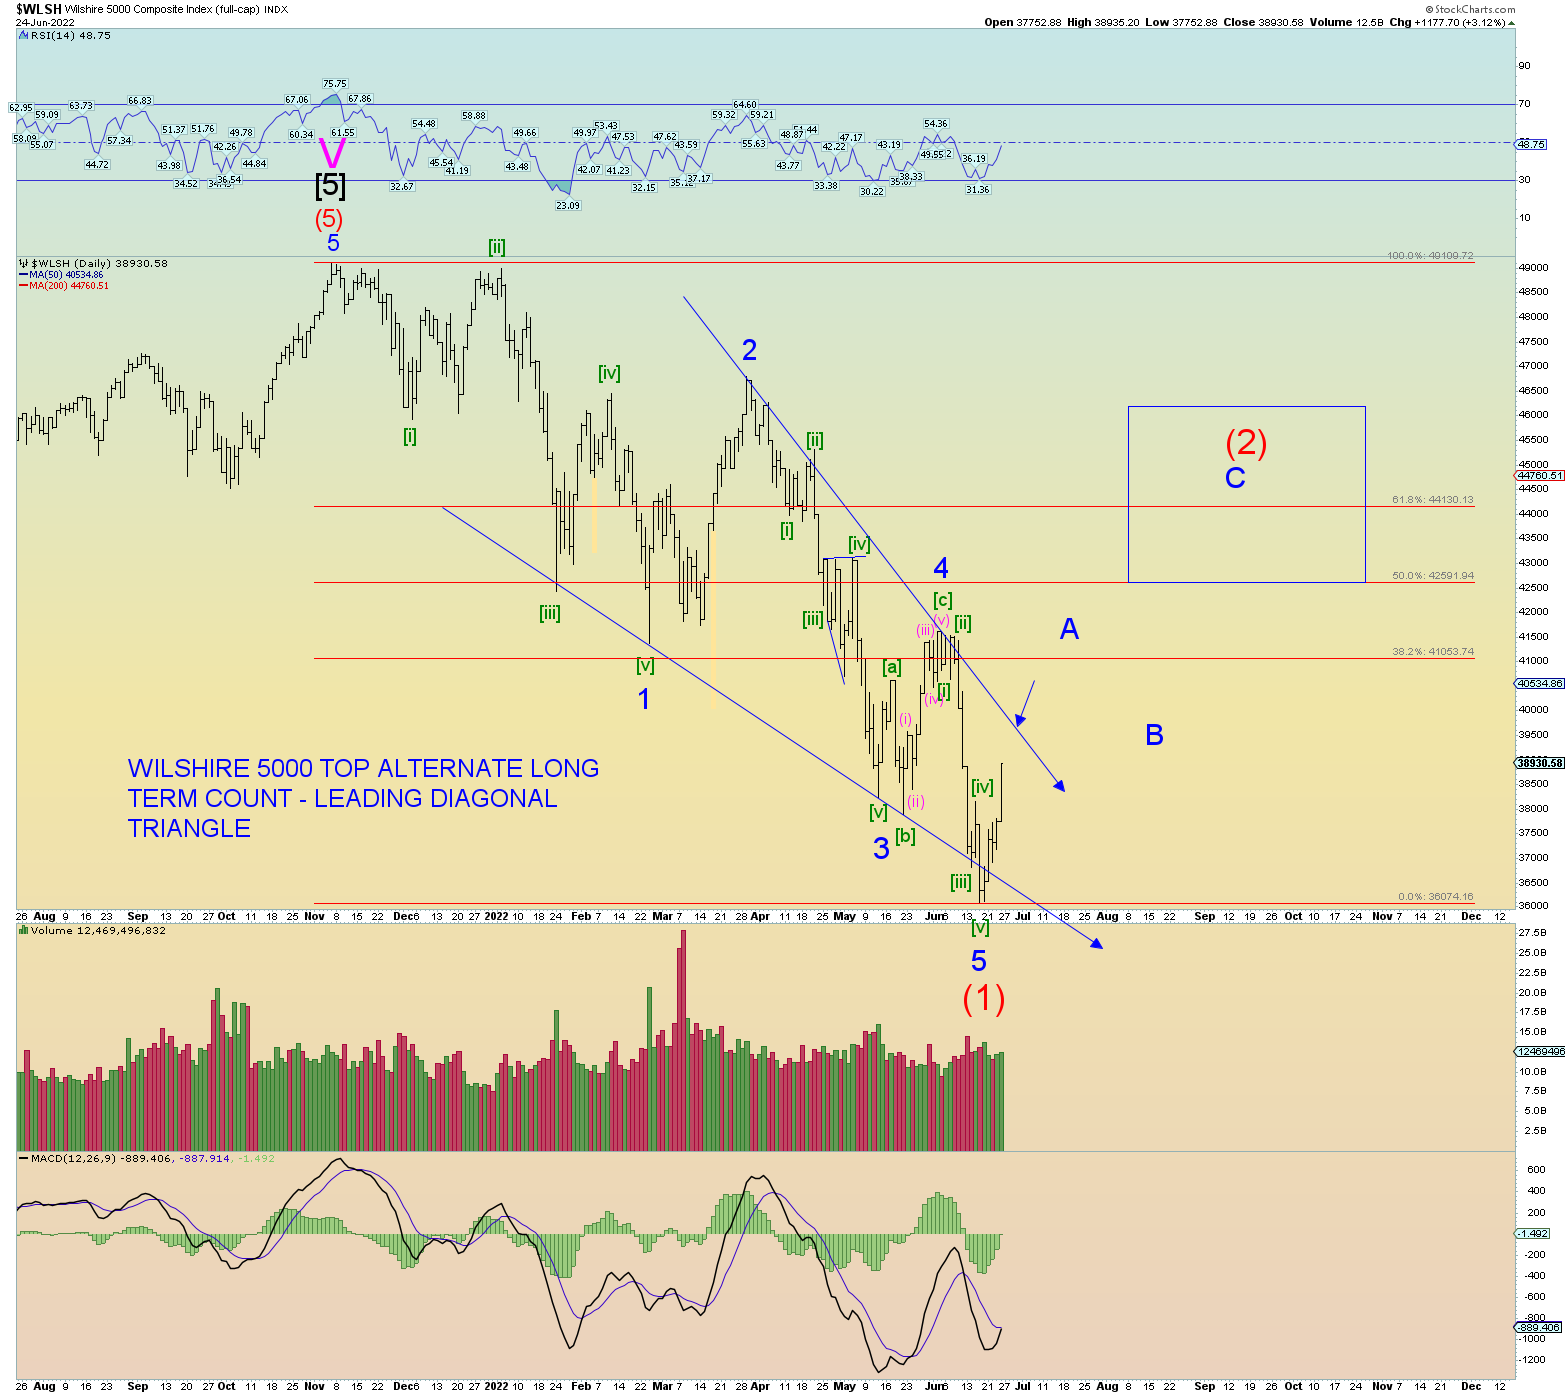
Update: I’ll post the alternate medium-term count that has the market tracing up much deeper and longer and thus nullifying the count of Minute [ii] of 3 of (3) down. There are many reasons this is not the top count, #1 being that the market has just experienced a very rare “negative” Zweig breadth thrust event. Reason #2 is because all wave structure formations involving waves (1) – (2), 1 -2, [i] – [ii] all take the shape of a potential “bullish” falling wedge.
But regardless, an SPX rally sustained above 4015 would require a reevaluation. But until then this count remains on the backburner. Incidentally, EWI has this pattern on their radar.
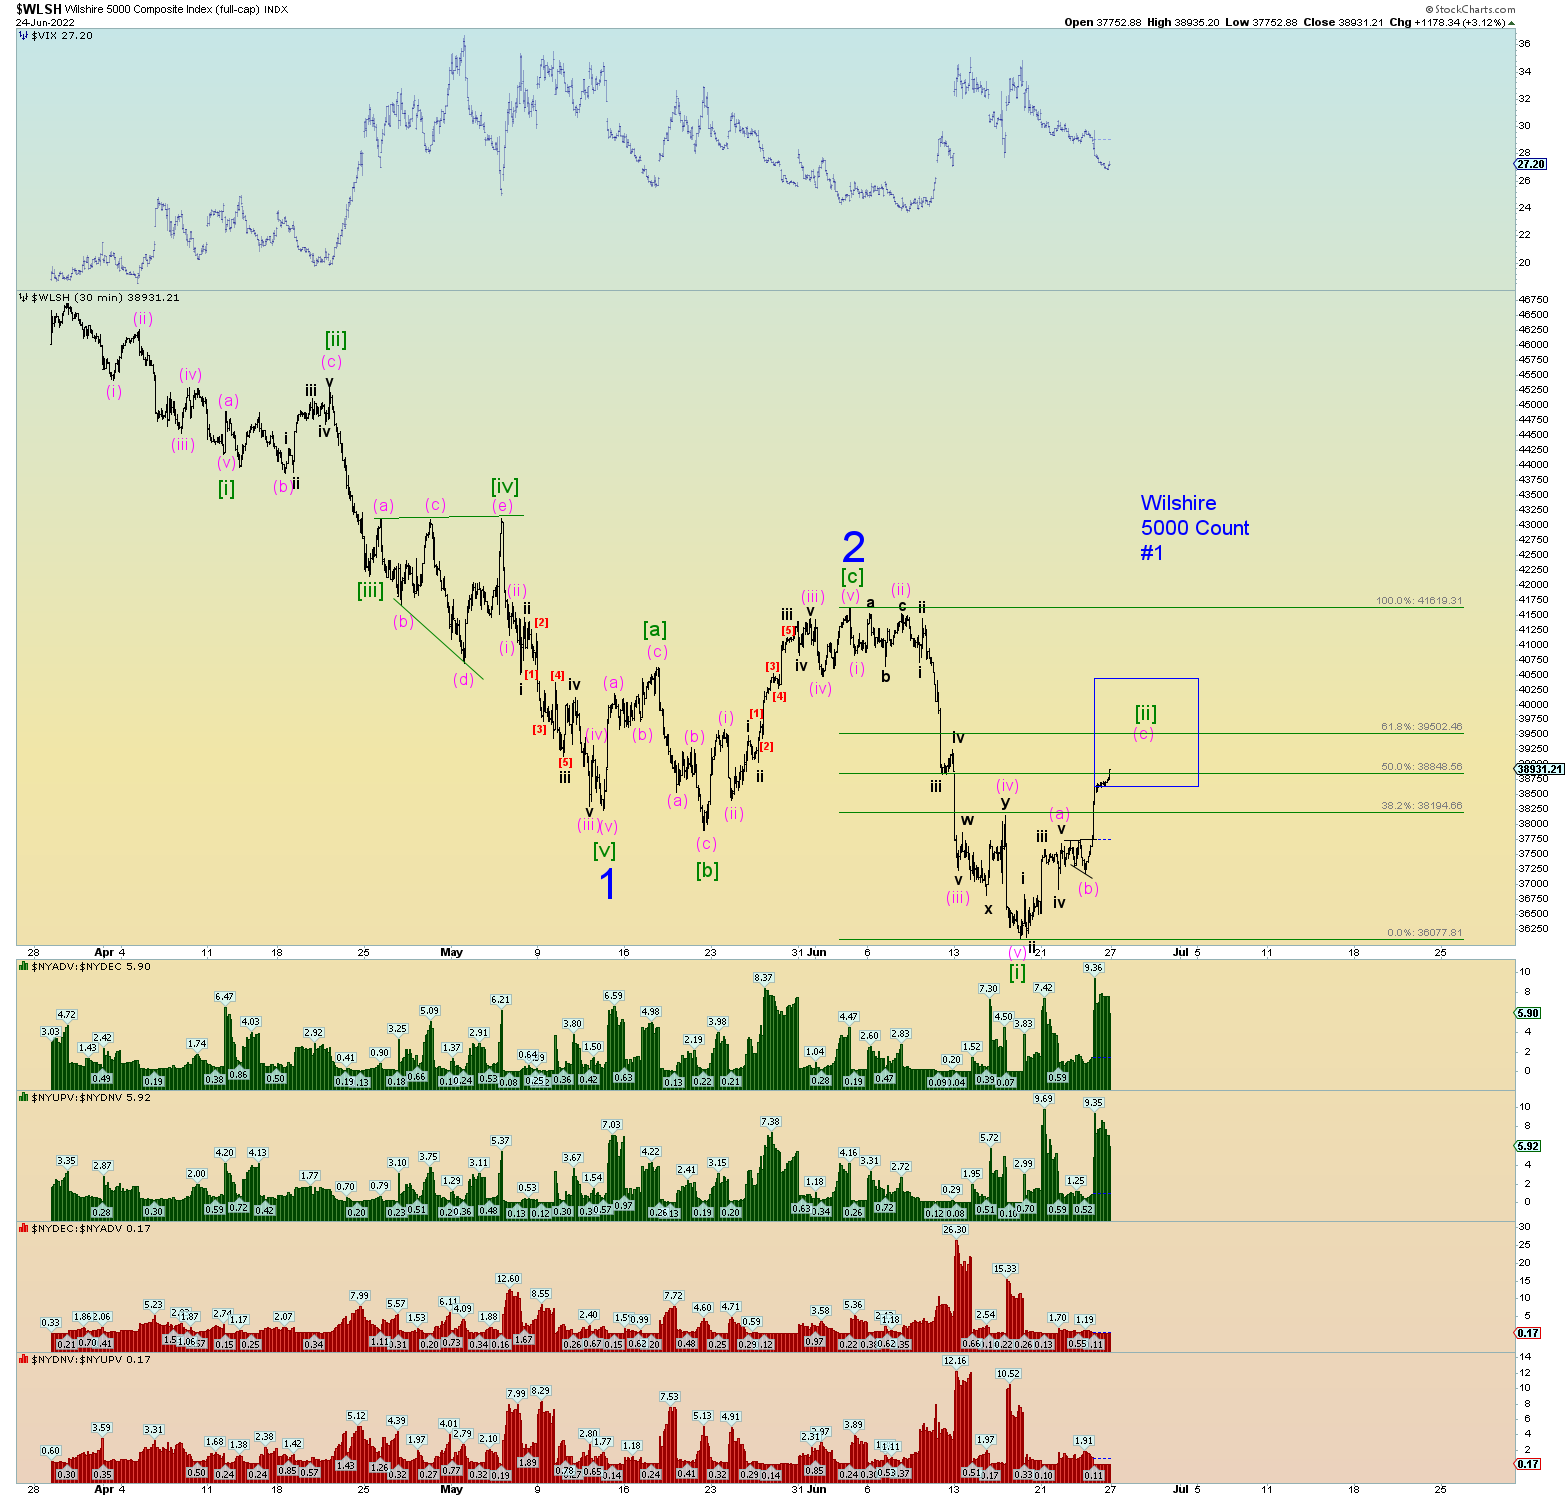
But do note that prices may rise to meet the upper trendline (small blue arrow) which also corresponds with the rapidly falling 50 DMA.
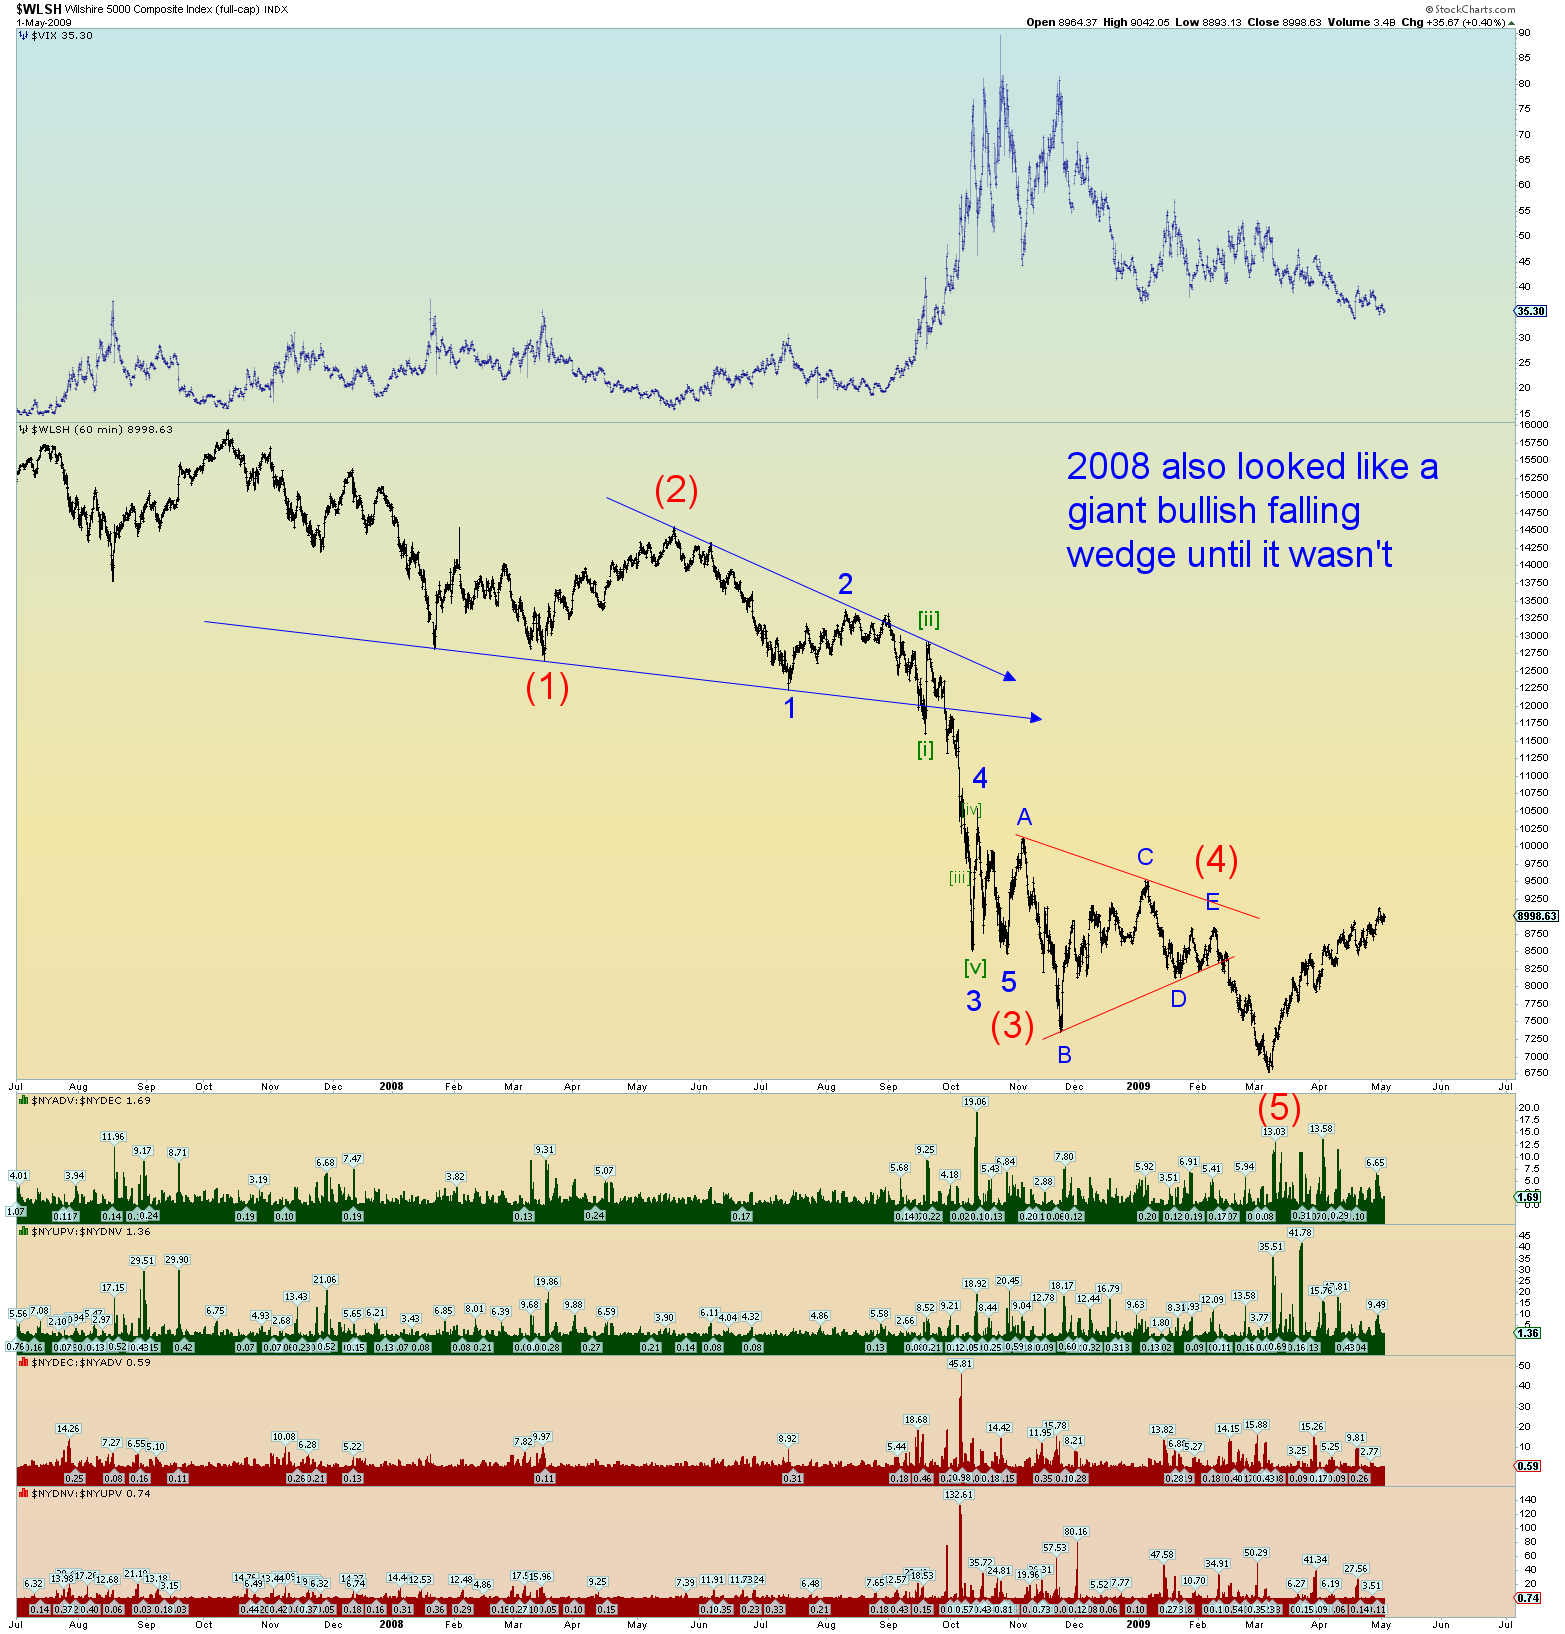
Incidentally 2008 also looked like a giant falling wedge until it wasn’t. But note how Minute [ii] rallied to meet the upper trendline. Then total market destruction.
ORIGINAL POST
The market finally popped in what we count as Minute [ii] of Minor 3 of Intermediate wave (3). In theory, this is the last major rally wave prior to a “third of a third” wave down resulting in a technical and social mood sentimental breakdown of the market.
Minute [ii] will probably backtest the base channel formed by waves (1) and (2). A rejection of this channel should result in severe selling intensity that surpasses anything we have seen to date and advance prices lower in a cascading plunge. Thats the theory of Elliott Wave.
We have 2 ways of counting Minute [ii]’s form. The first uses the Wilshire. A simple (a)-(b)-(c) rally.
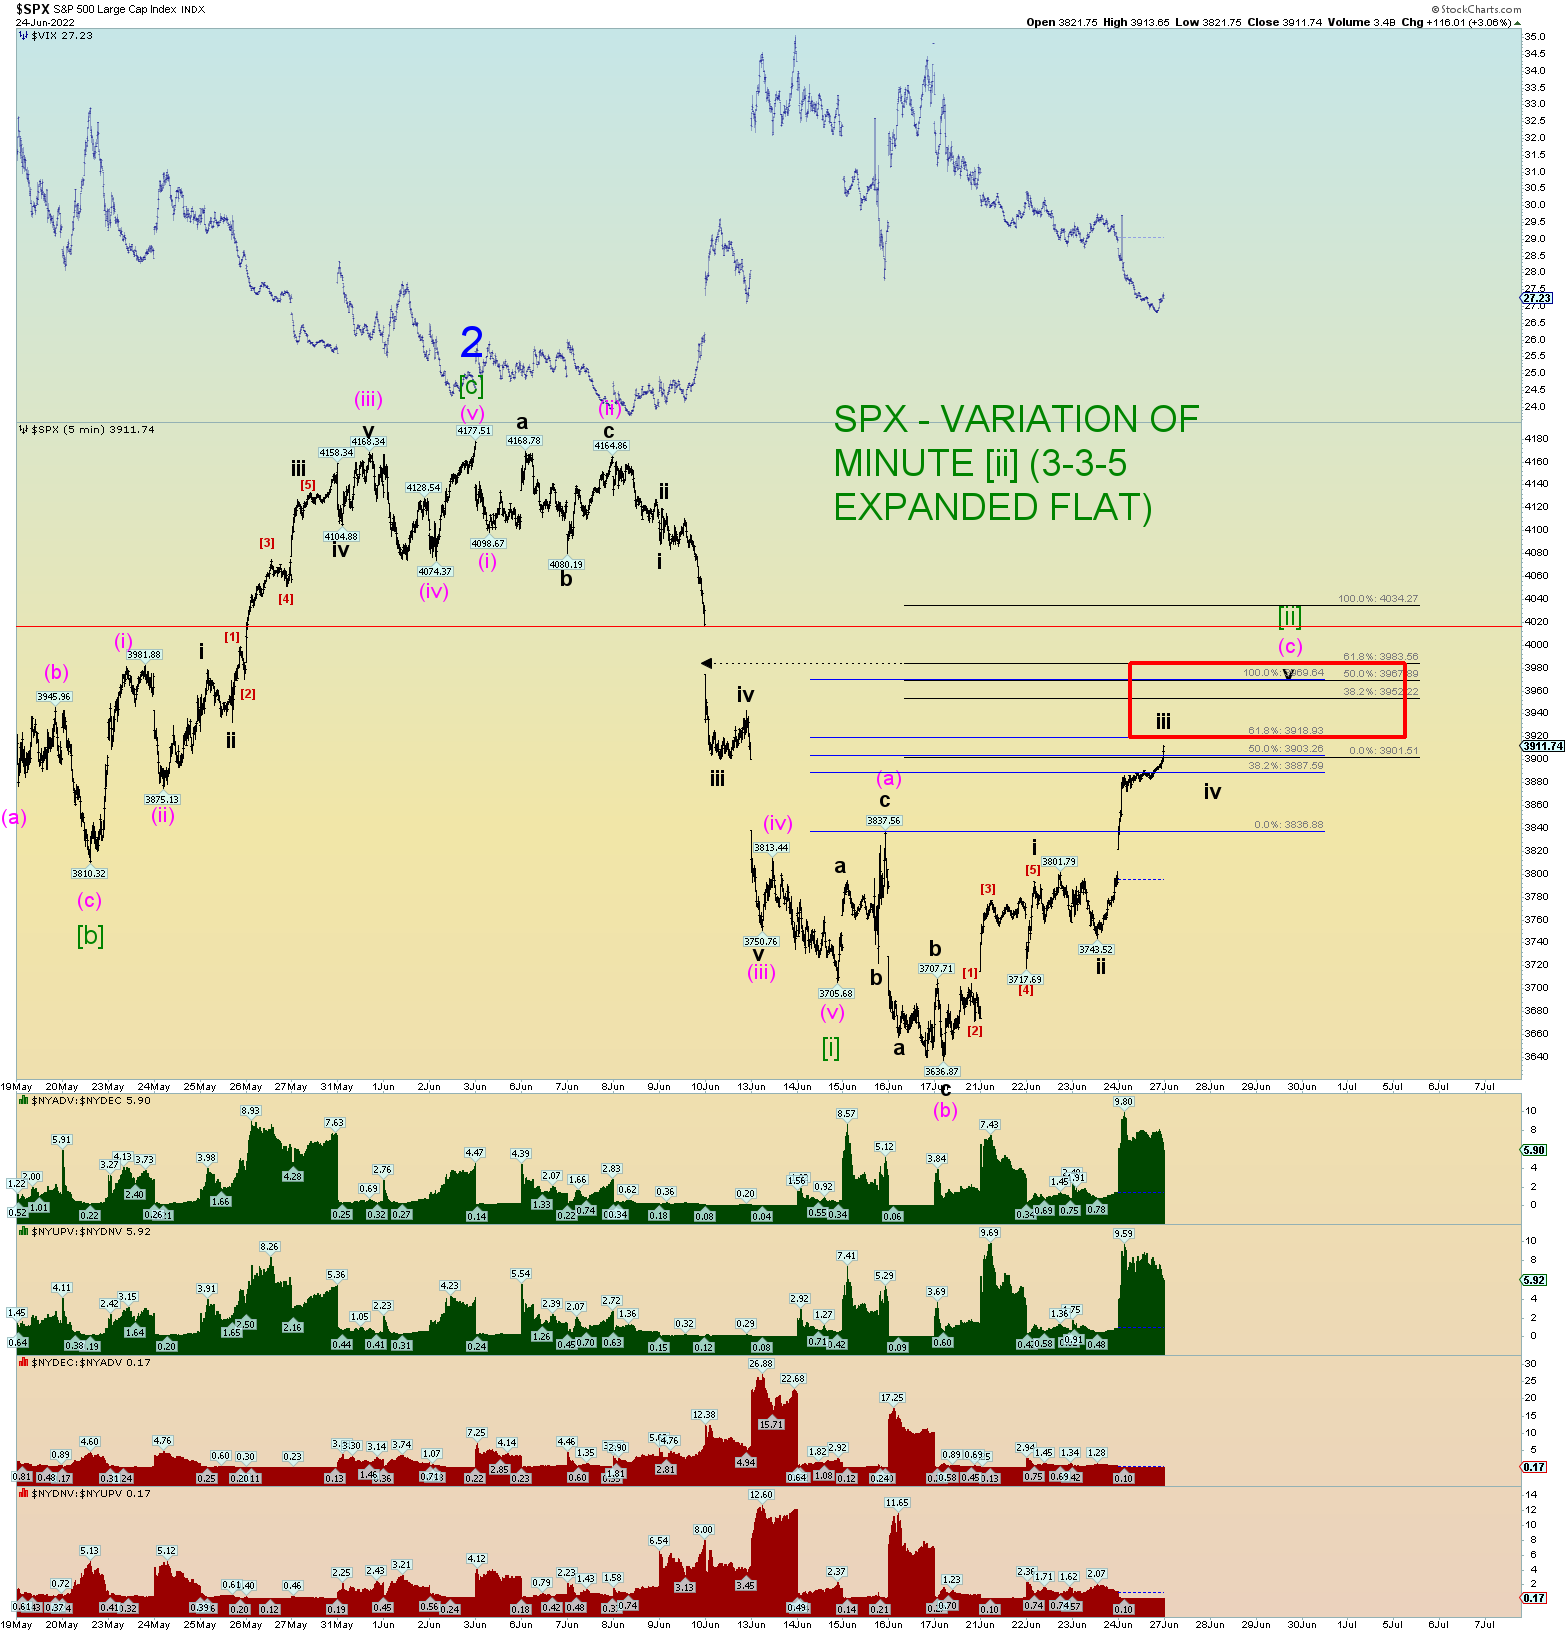
The second way of counting Minute [ii] is shown with the SPX. It shows Minute [ii] as an expanded 3-3-5 flat count much like we show the next higher Minor 2 as an expanded flat count.
If you recall how we derived the target range for Minor 2’s expanded flat count, we can do the same with Minute [ii]. The lower target would be where wave (c) extends .618 beyond the length of wave (a). That lower target is 3918. The upper target in this case is where wave (c) extends 2.618 (the extreme) times the length of wave (a). This upper target is about 3970 SPX which begins to challenge the open “breakaway” gap down. Thus, the target range box shown in red is from 3918 – 3970.
A move to 4015 SPX to close the breakaway gap (red horizontal line) would be a very robust retrace but not wholly unexpected. As has been pointed out in times past, the 2008 plunge saw Minute [ii] of Minor 3 of (3) a very robust squeeze that reached very deep. But it all sold off soon enough.