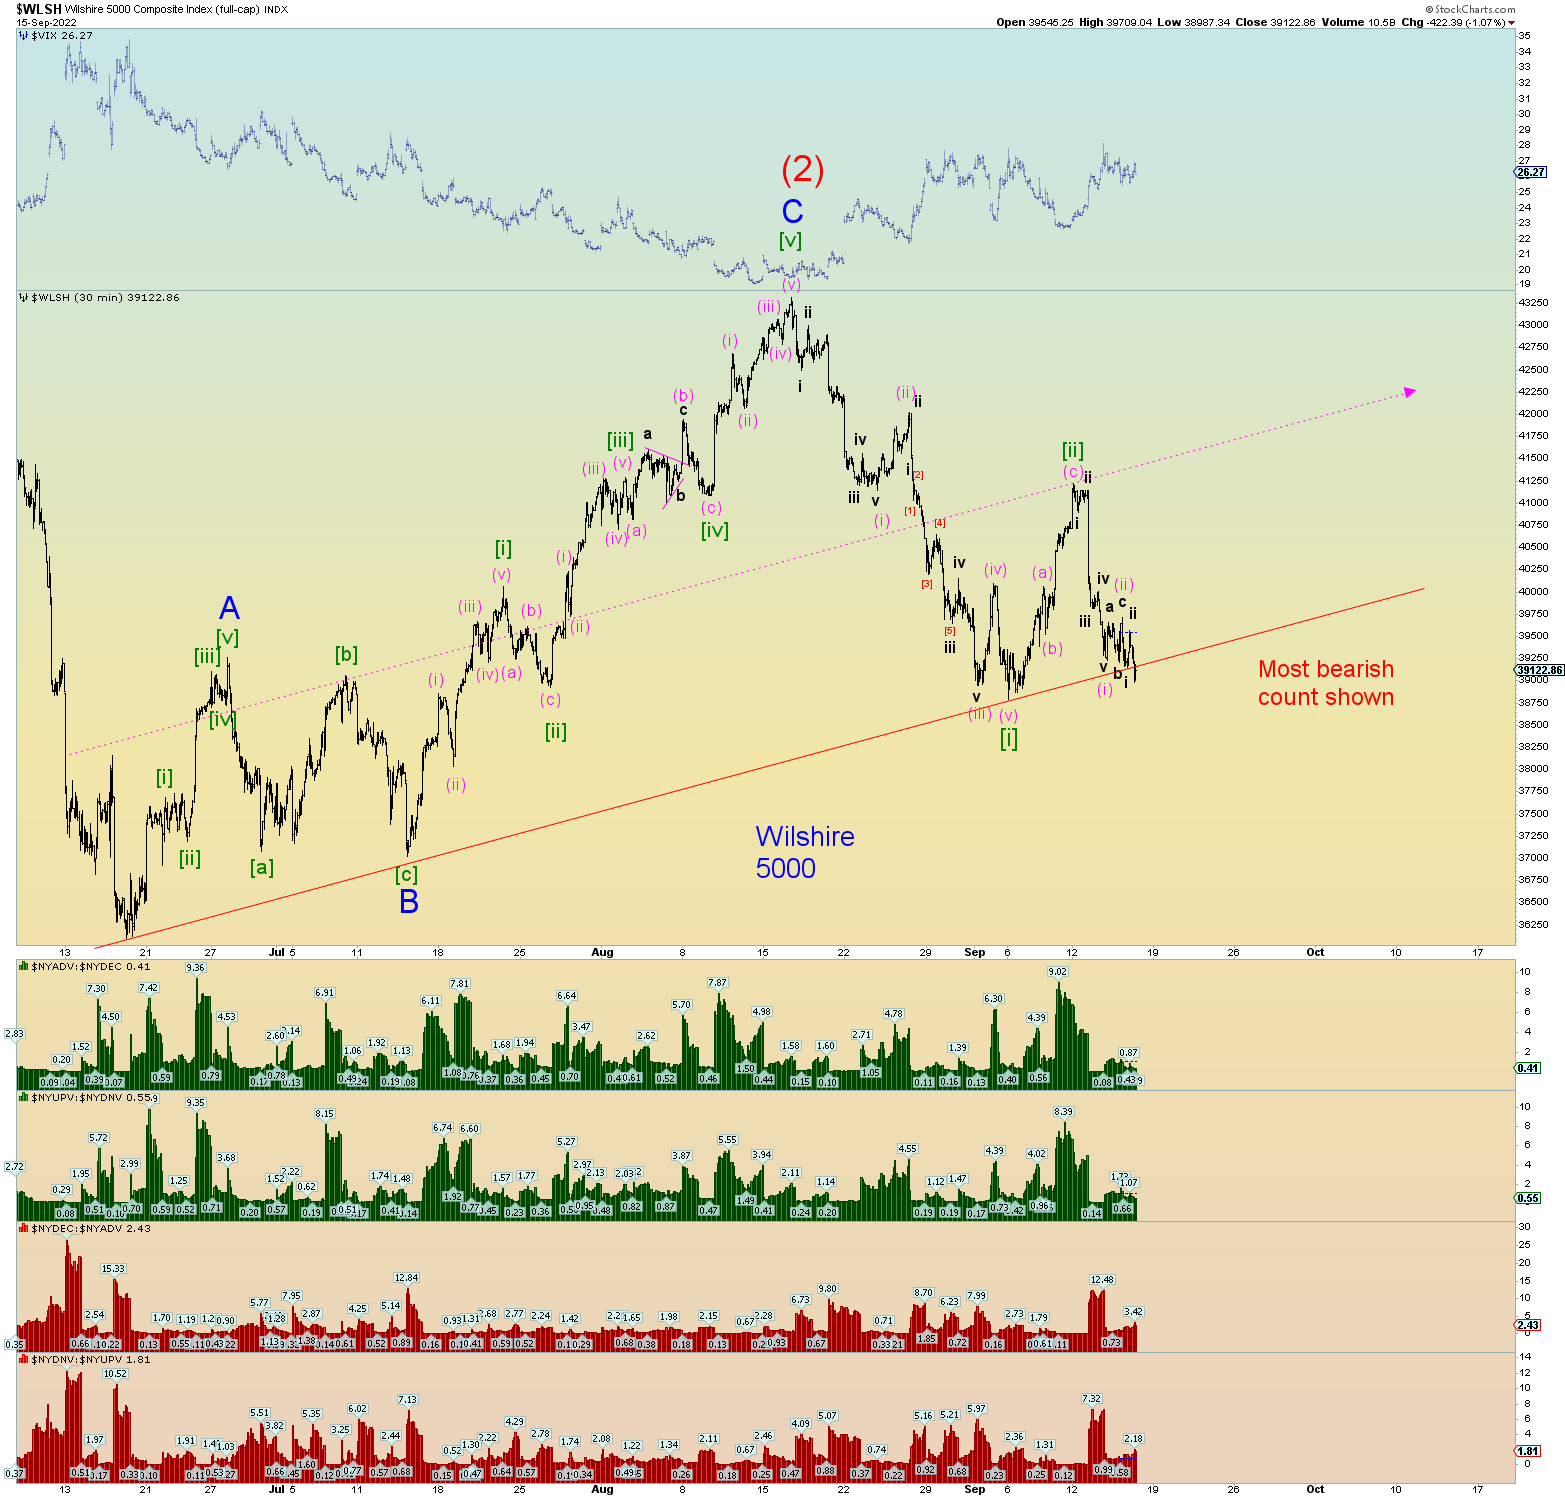
The same two “bullish” counts from yesterday’s – [ (ii) or [ii] ] – count applies if we get a ramp upwards in prices, perhaps a “last hurrah?”. However, prices have decidedly closed beneath the thin red neckline, so I have highlighted the most bearish count below.
Again, overnight futures may play a determining factor as sometimes they do.
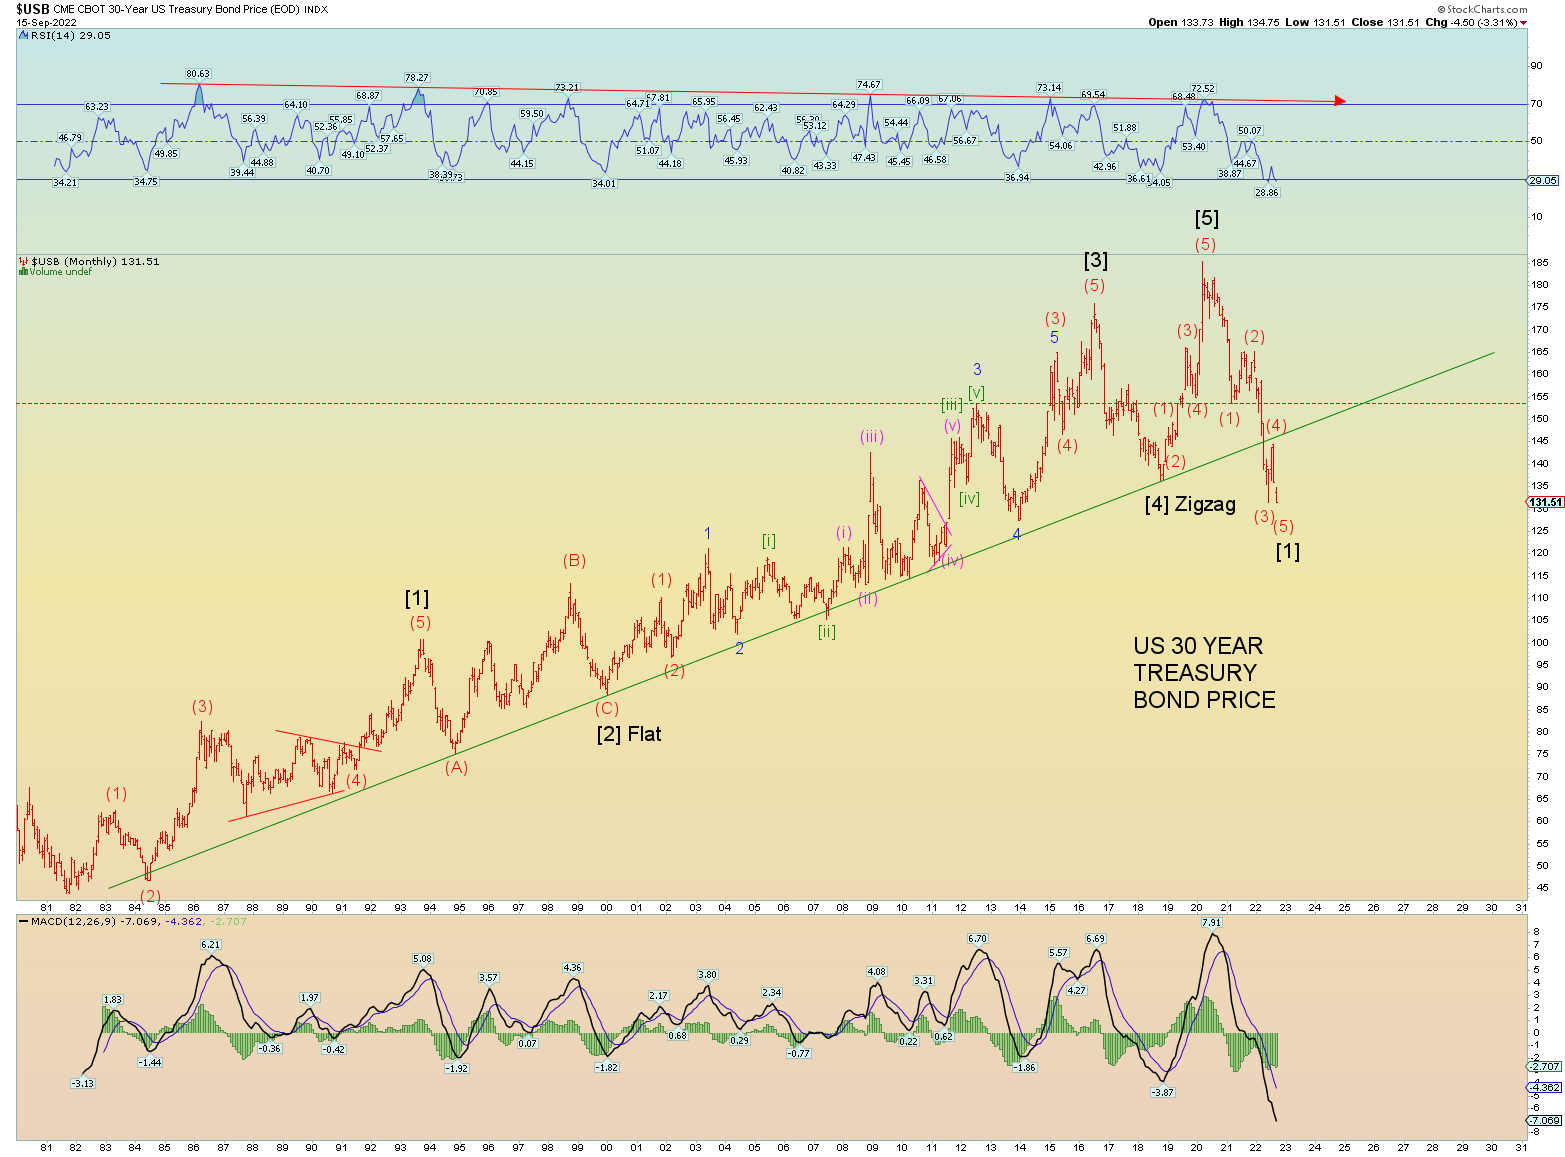
This chart really does tell the overall story. The 40-year bond bull market is over. We have entered a new era and it is not optimistic.
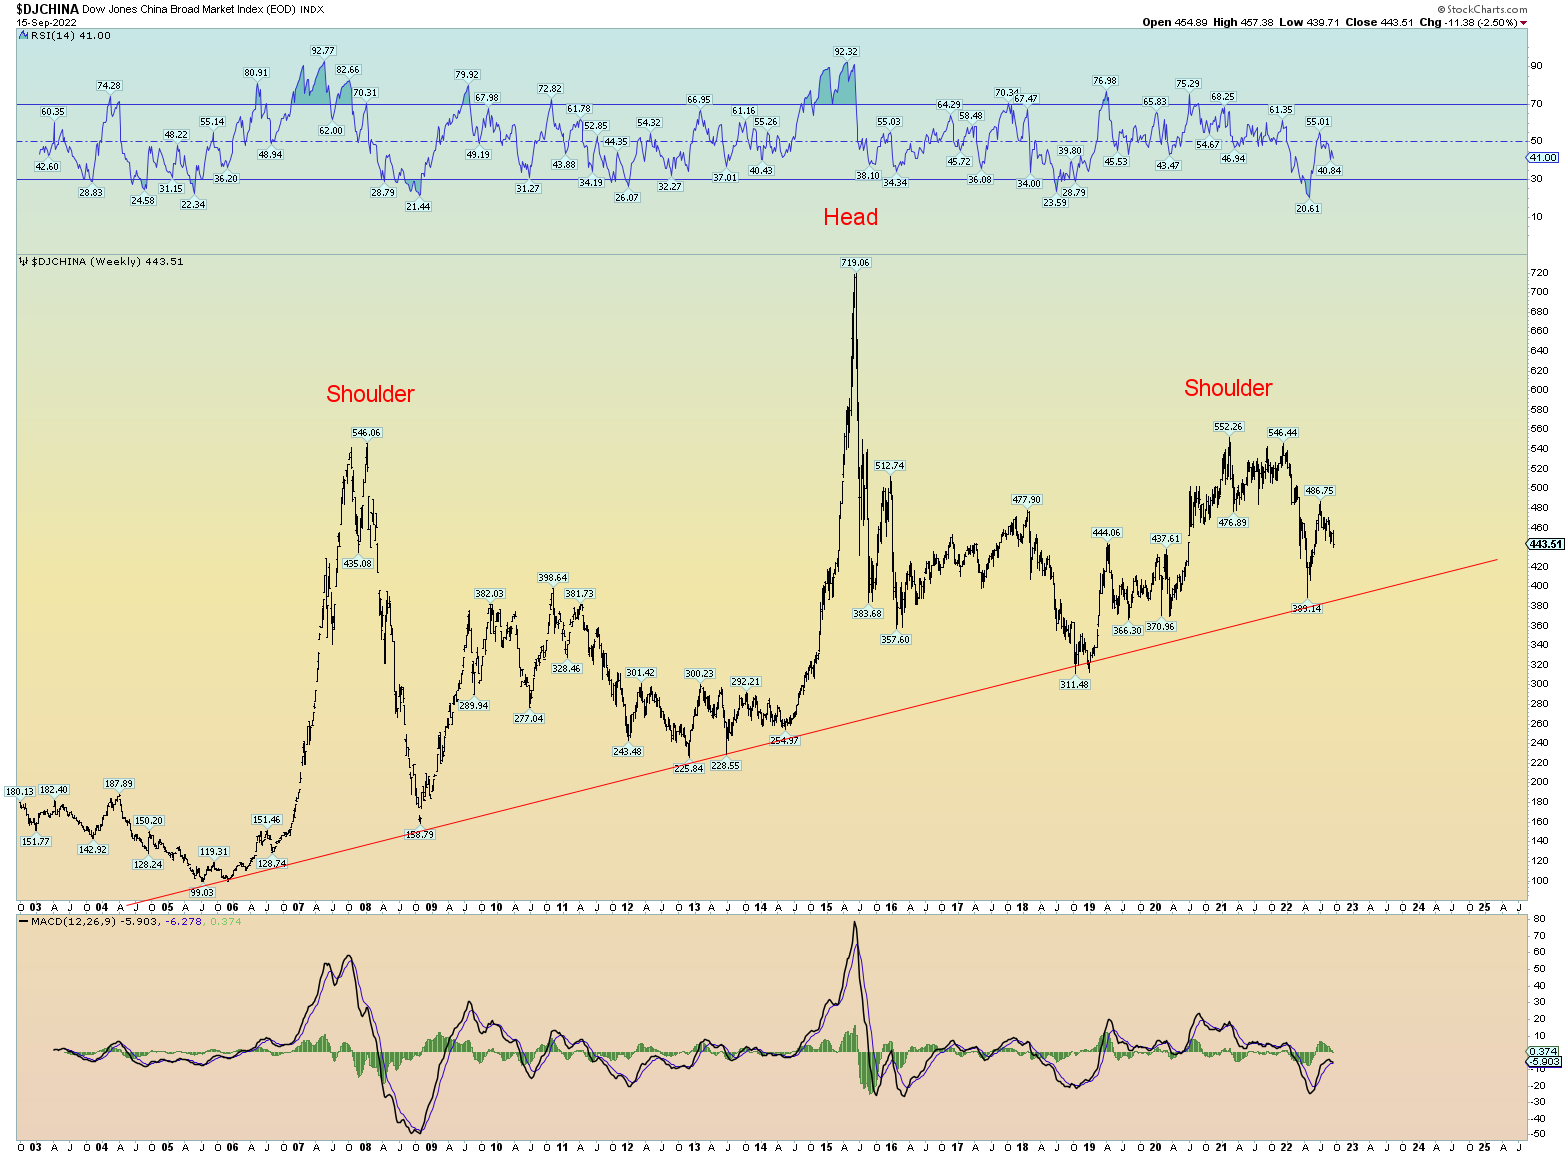
This may be wishful thinking, but did the Chinese market just crack? Plunging social mood = war.