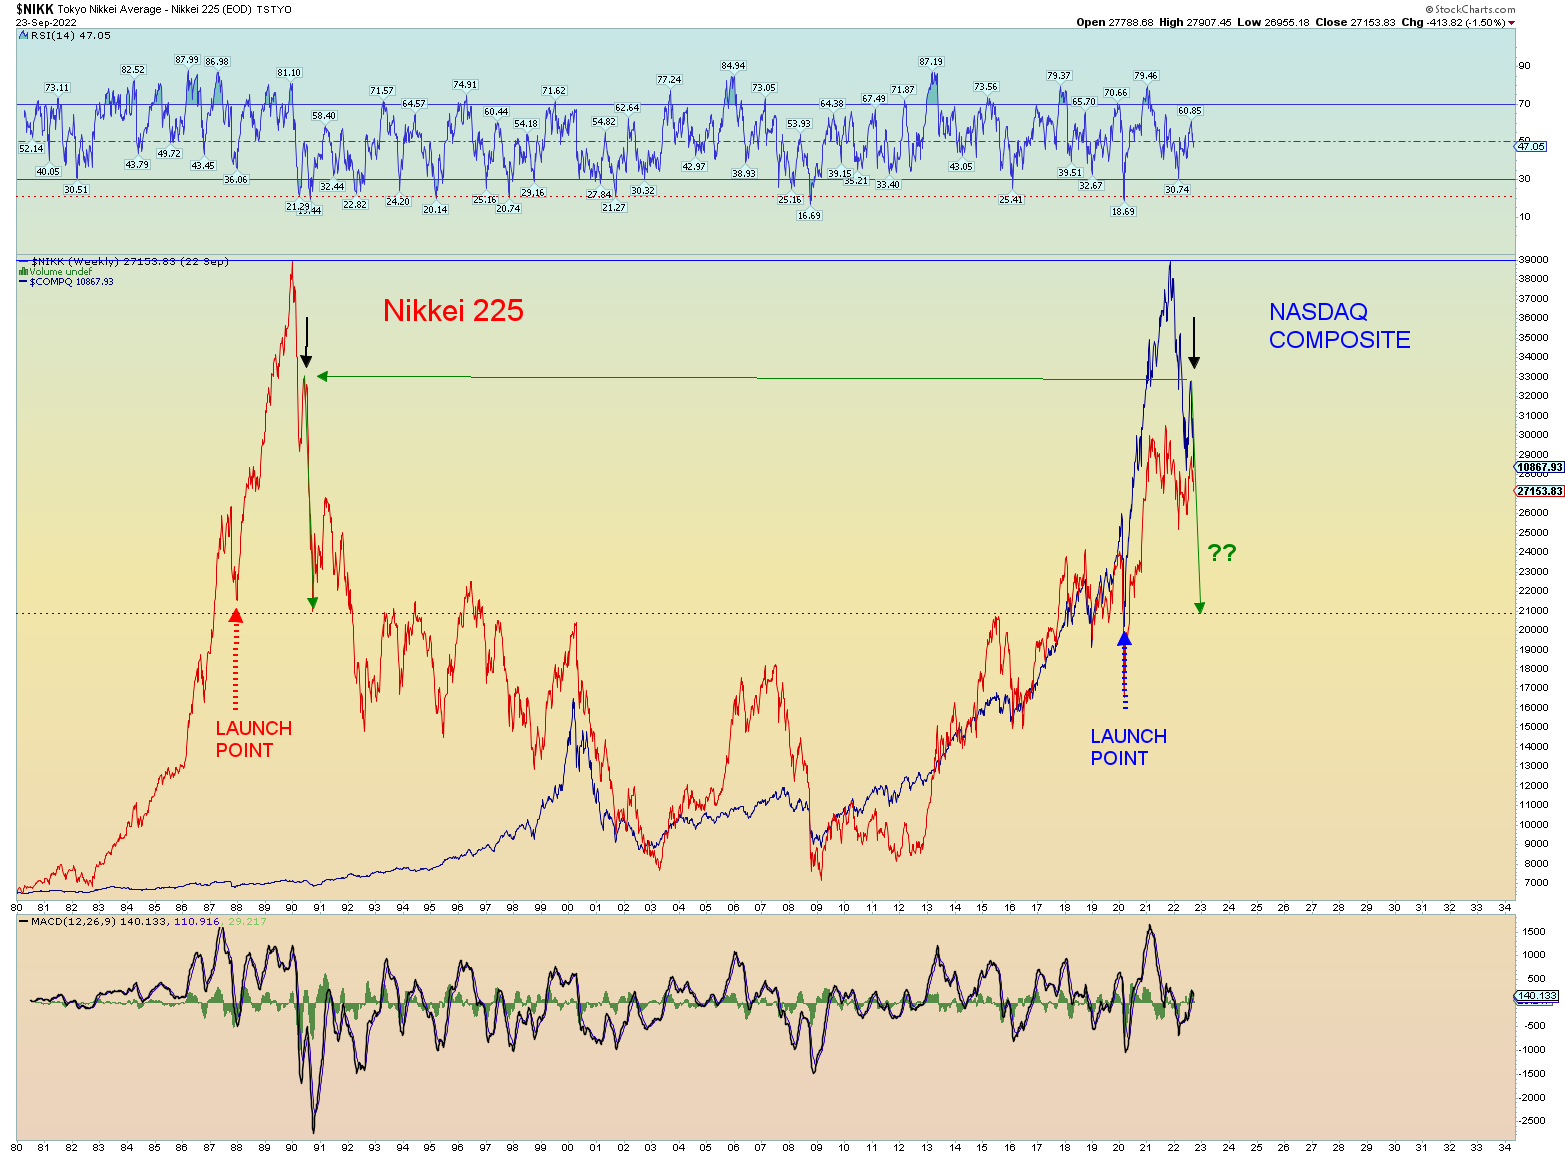
This is a cool chart. I’ve shown it months before.
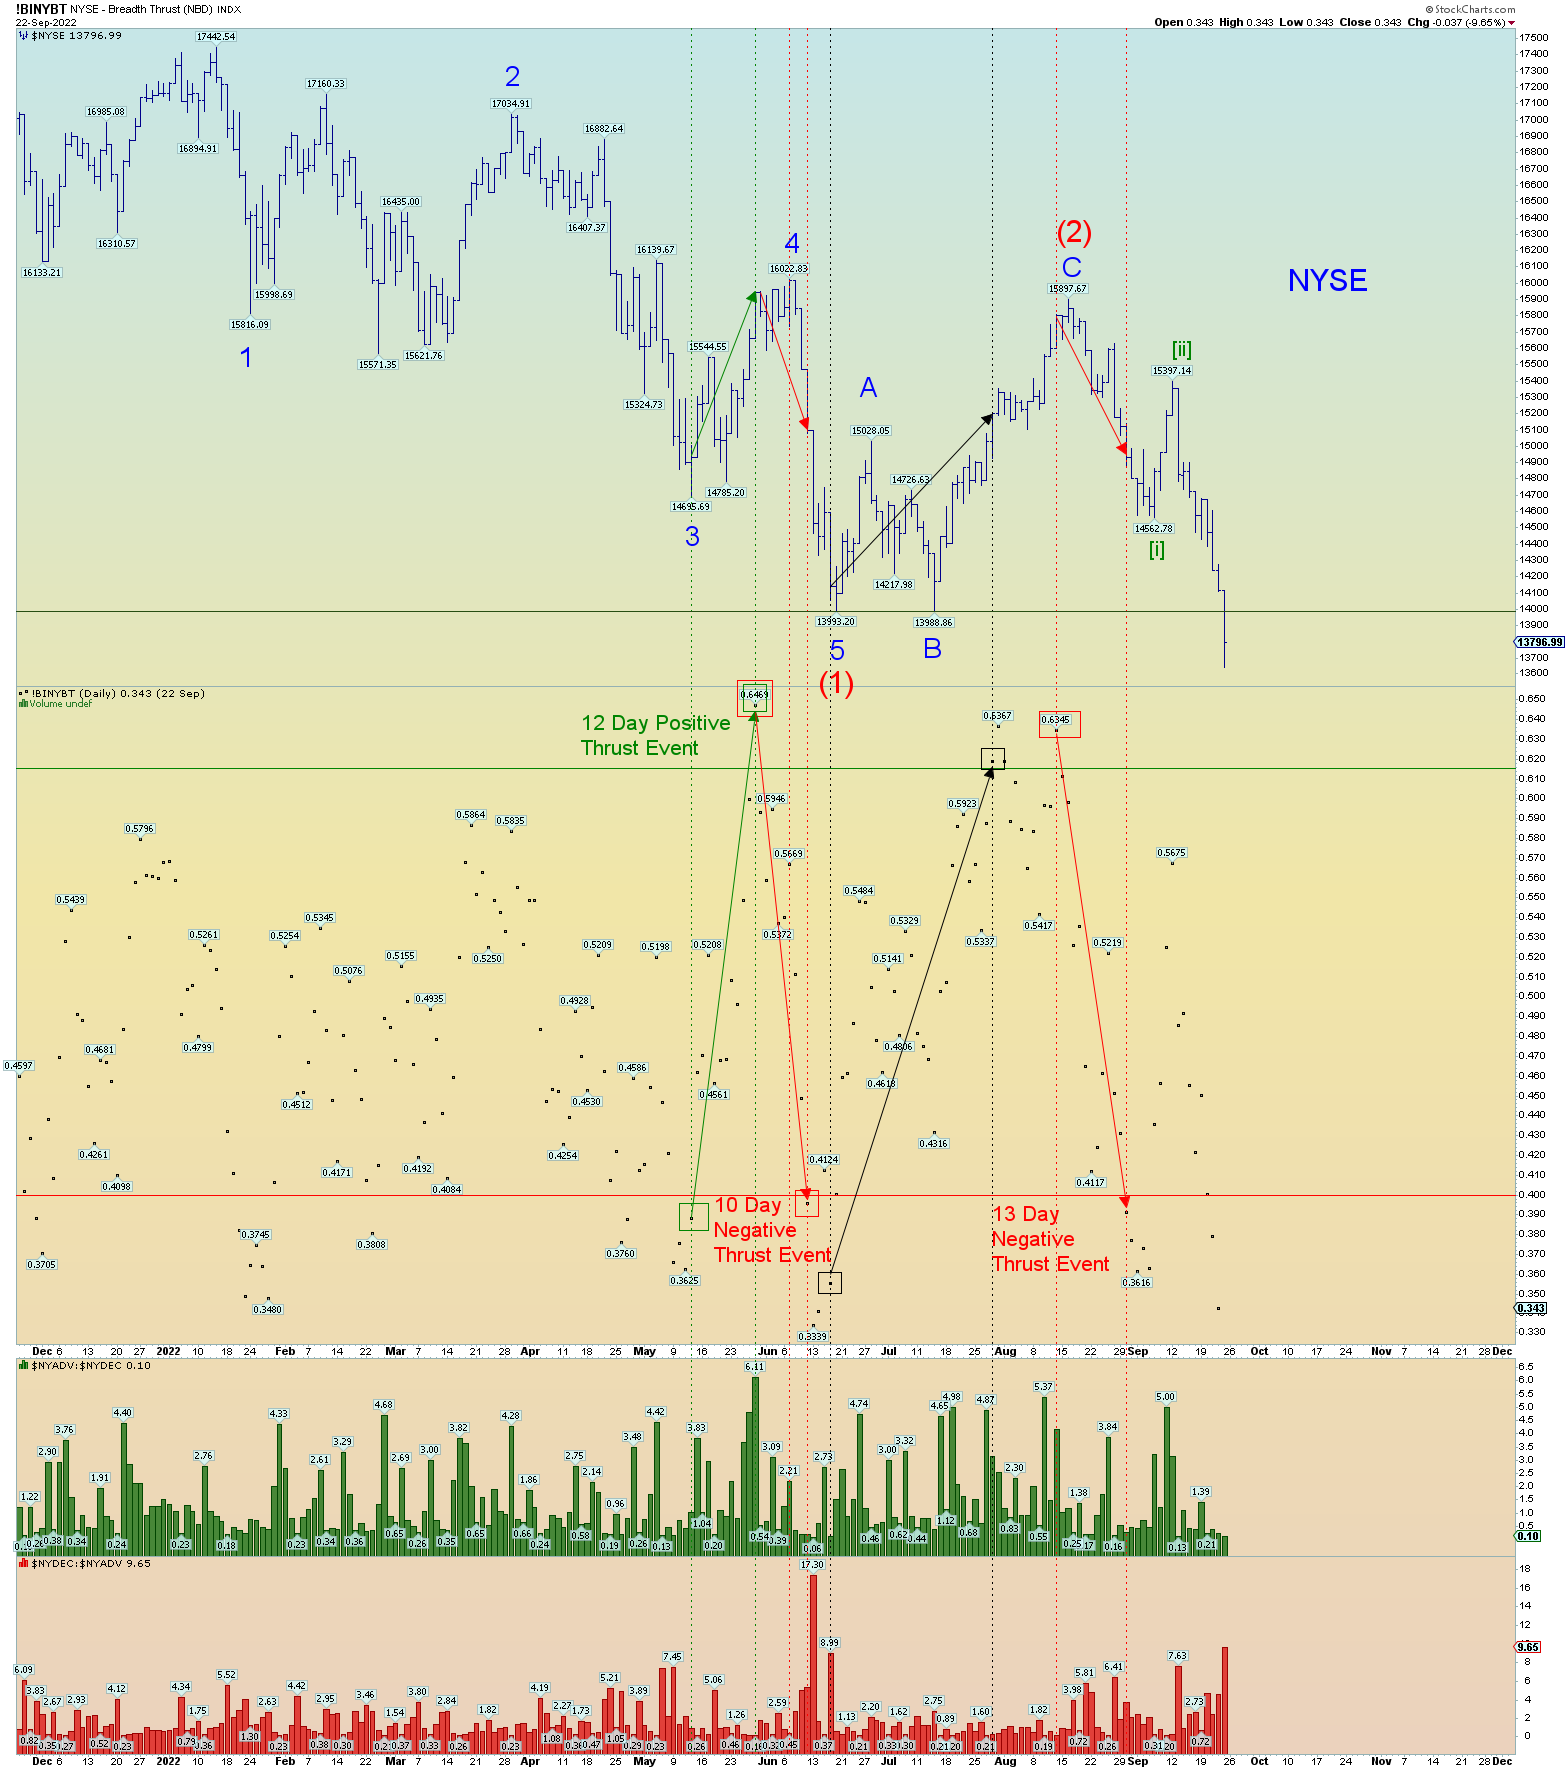
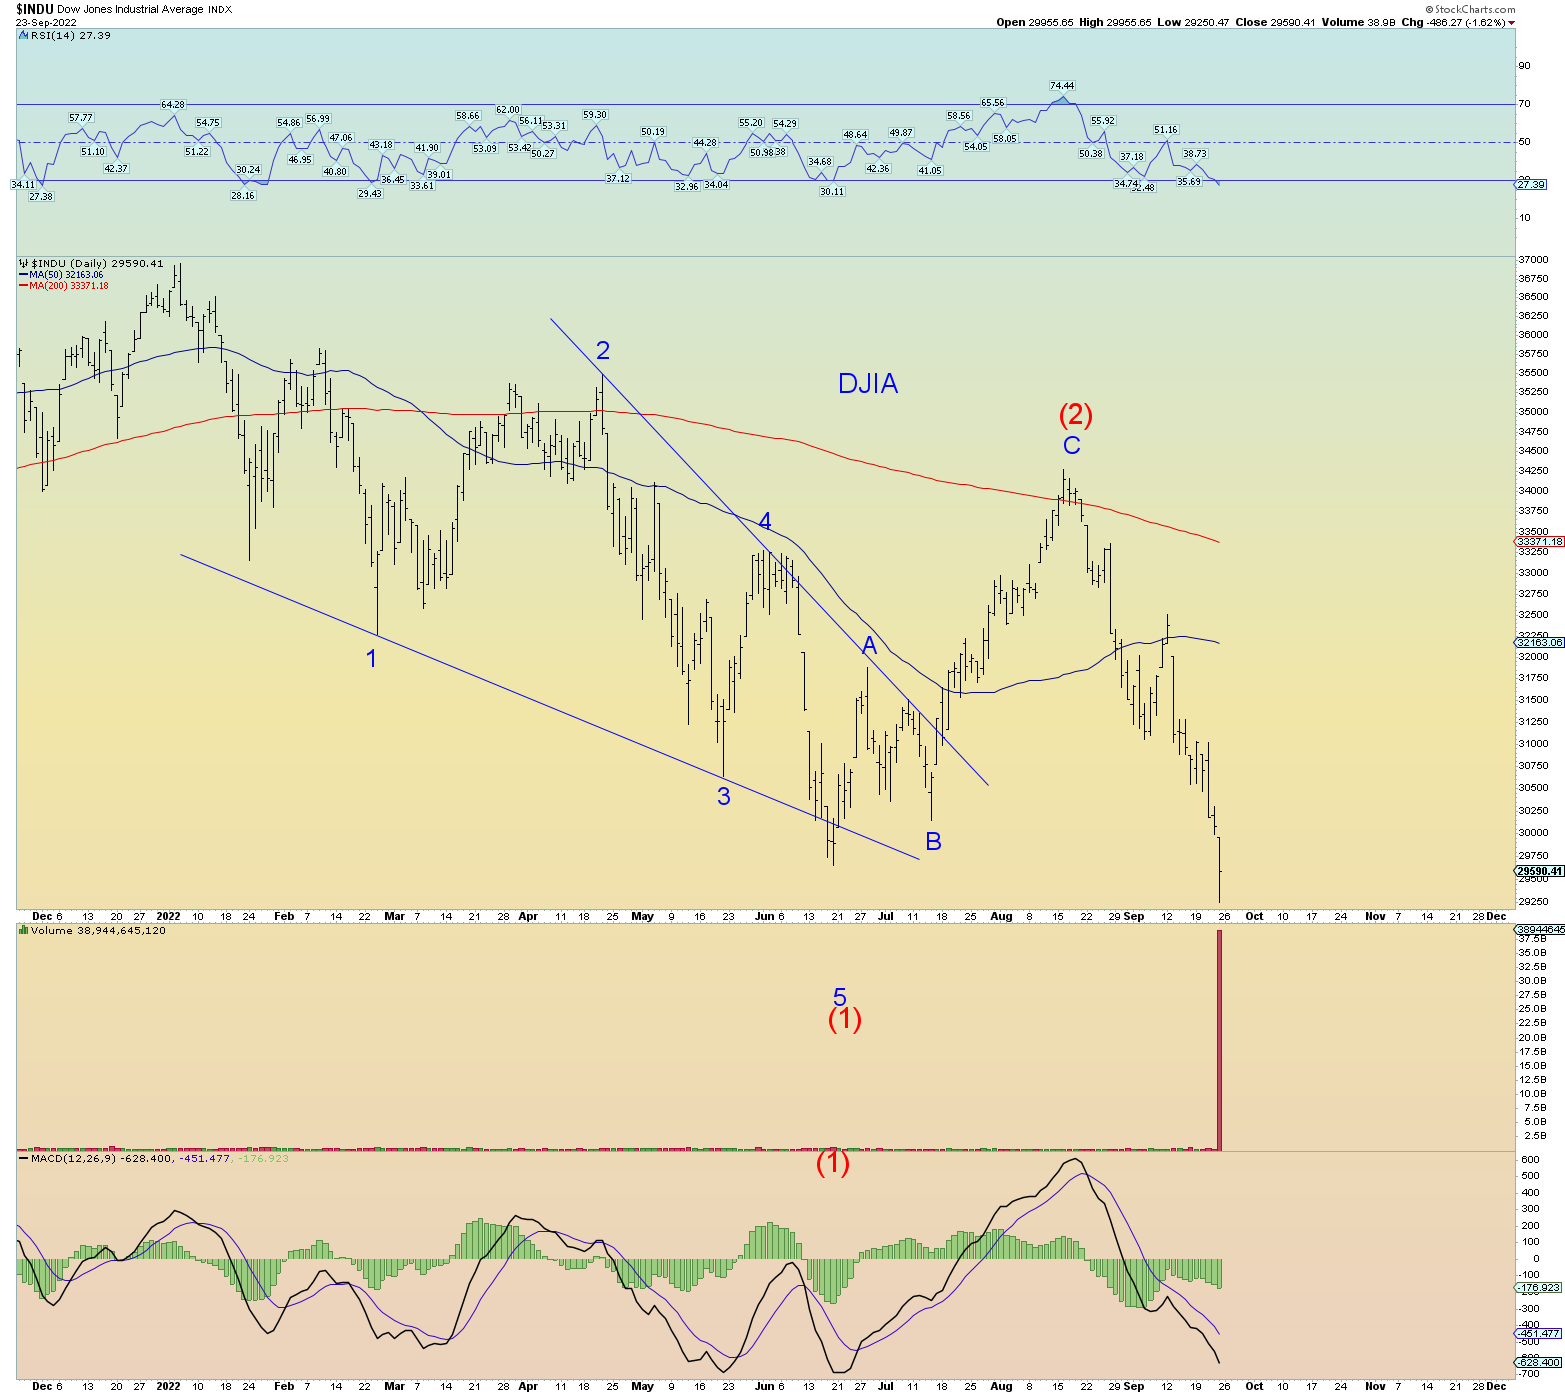
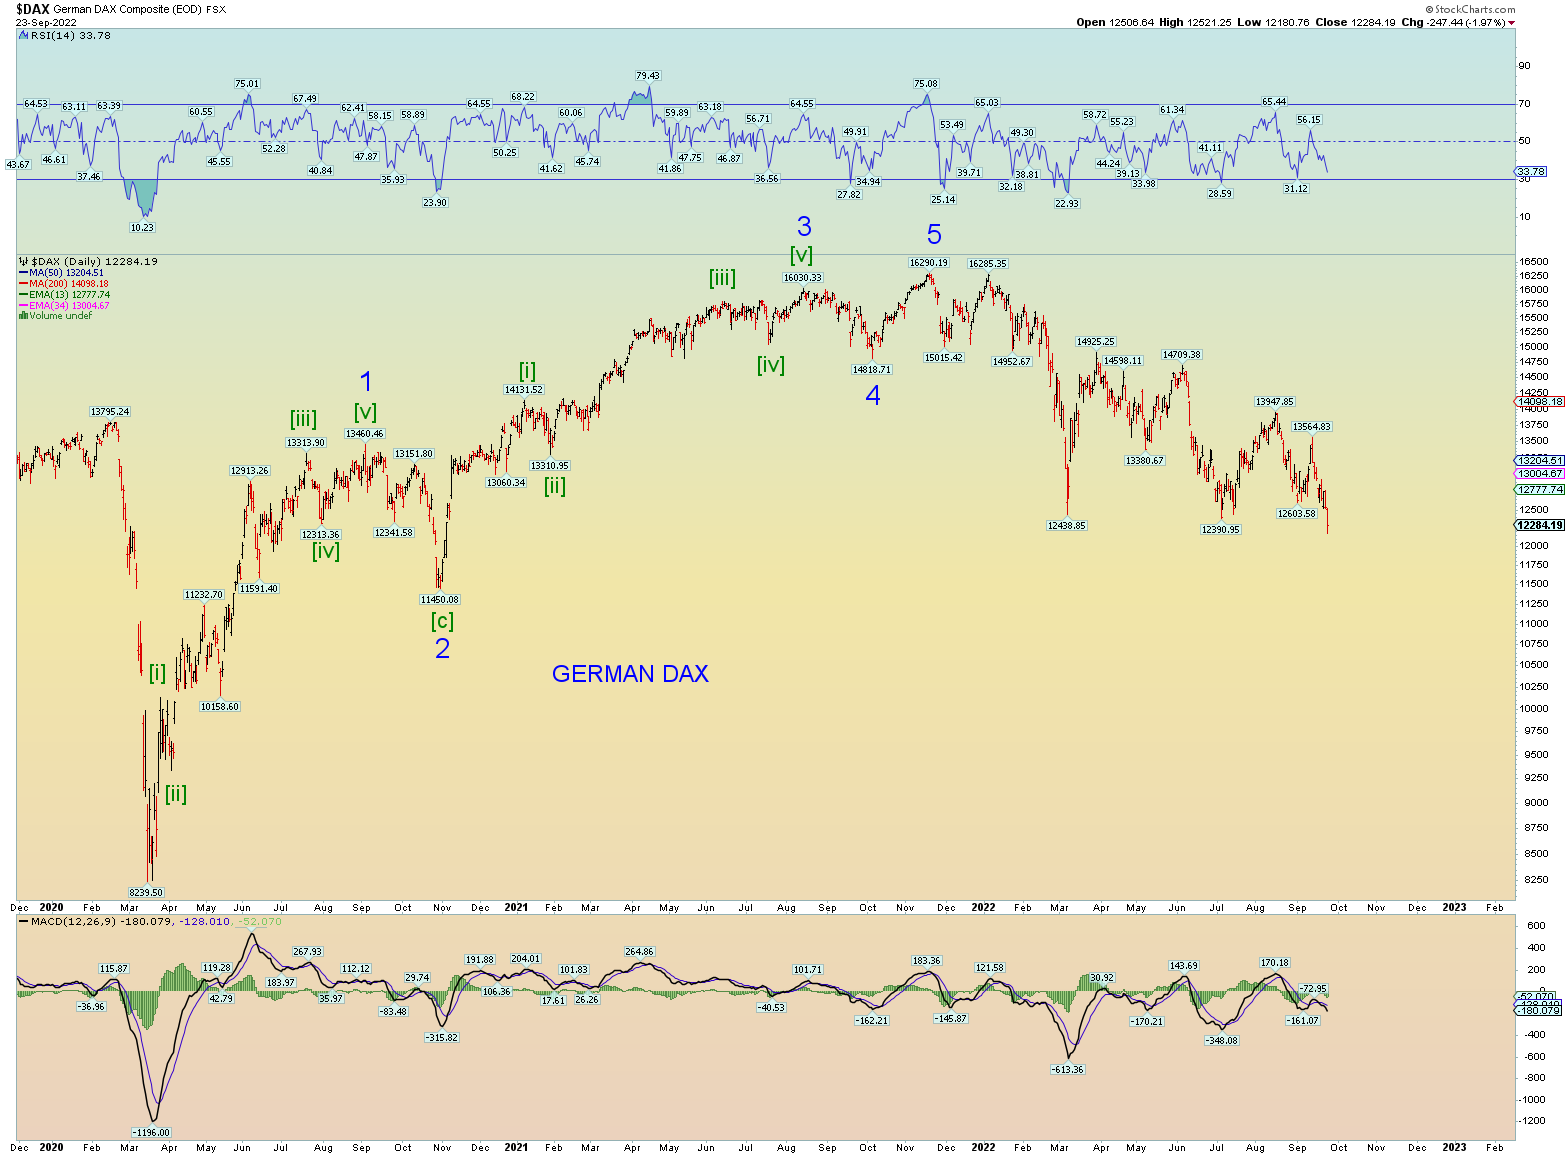
Prices breaking under the June 2022 low in the NYSE and DJIA.
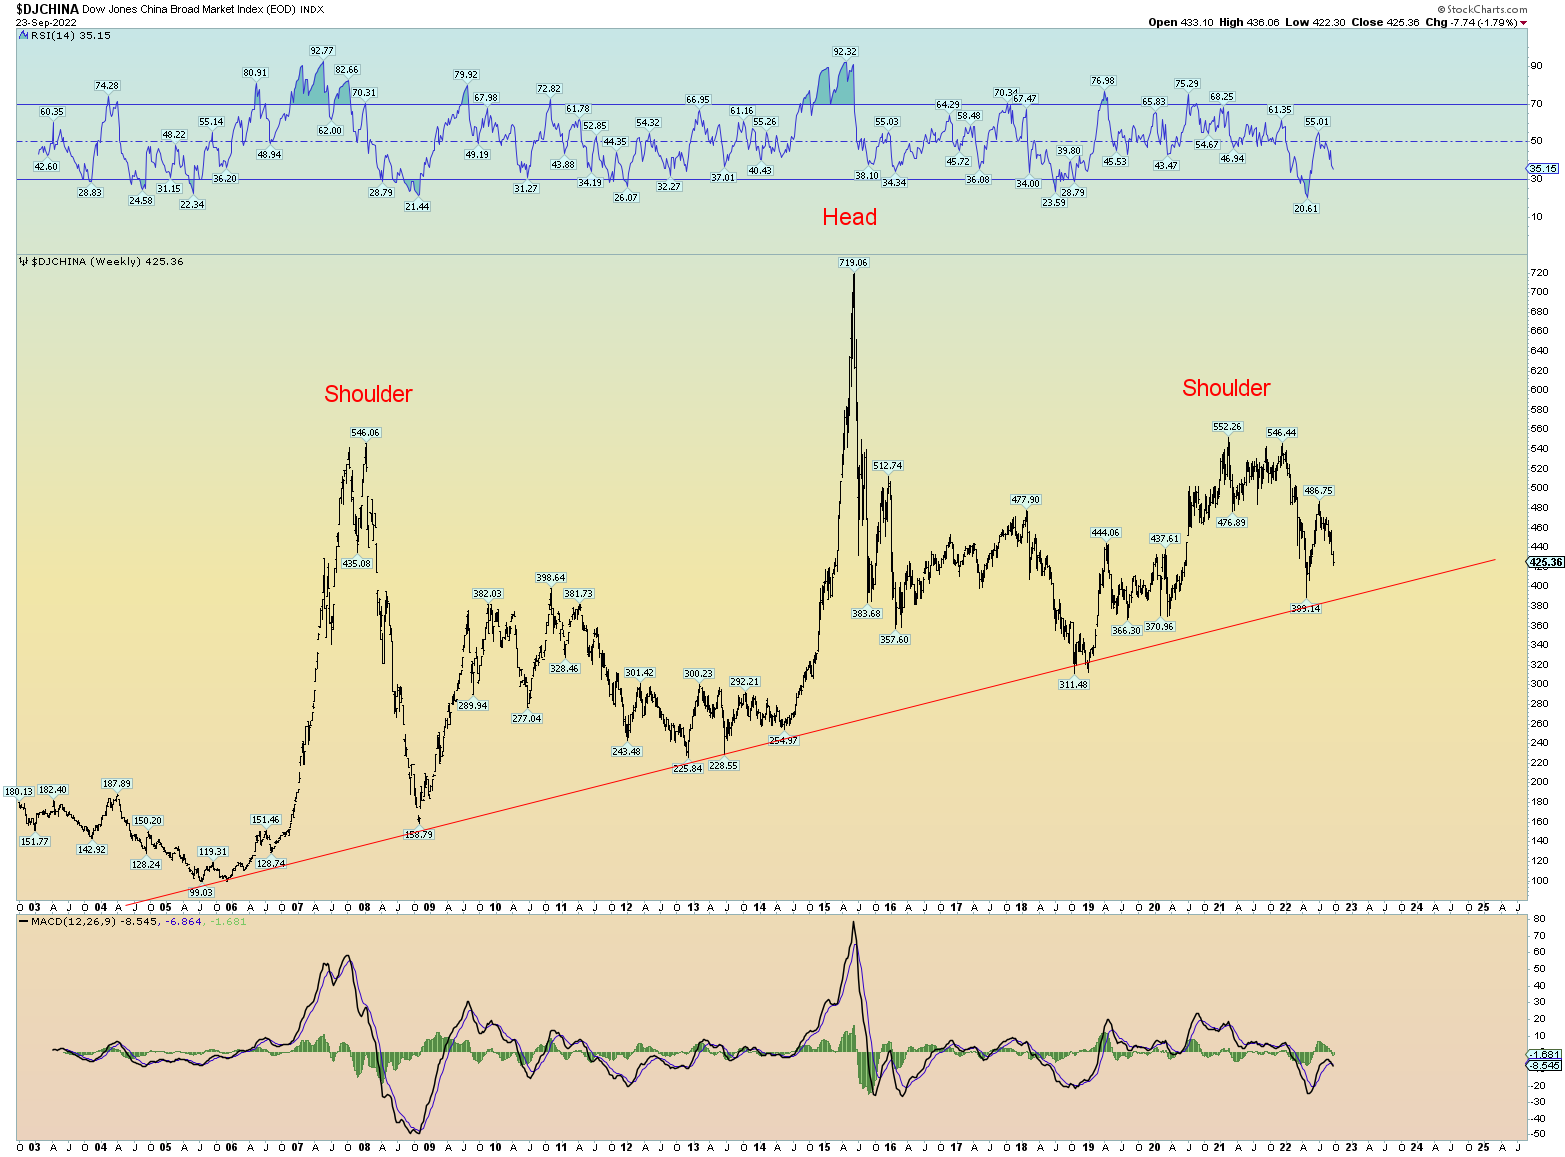
China also breaking lower. Bad omen for global social mood. I have of course been predicting China invades Taiwan and the global war goes “hot”.
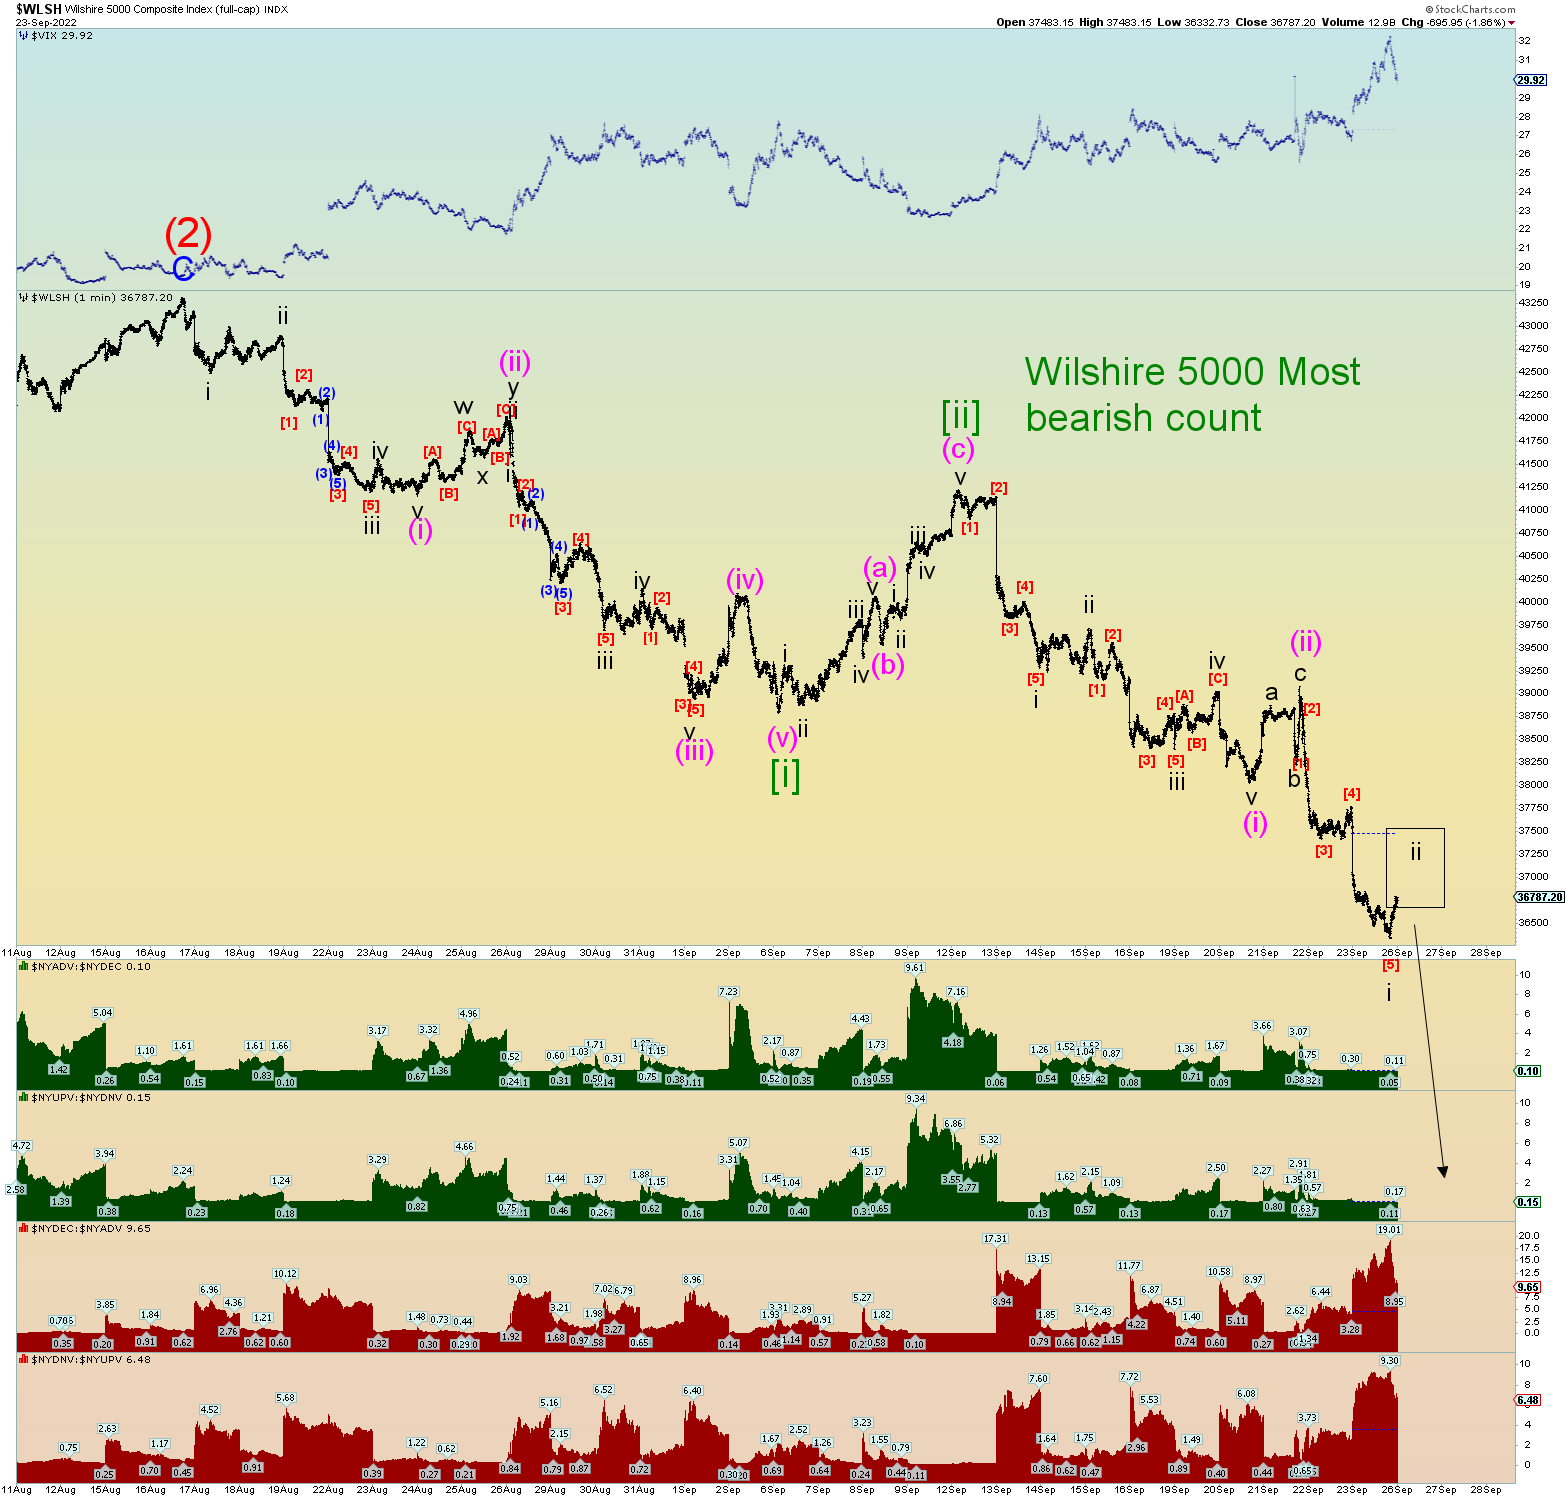
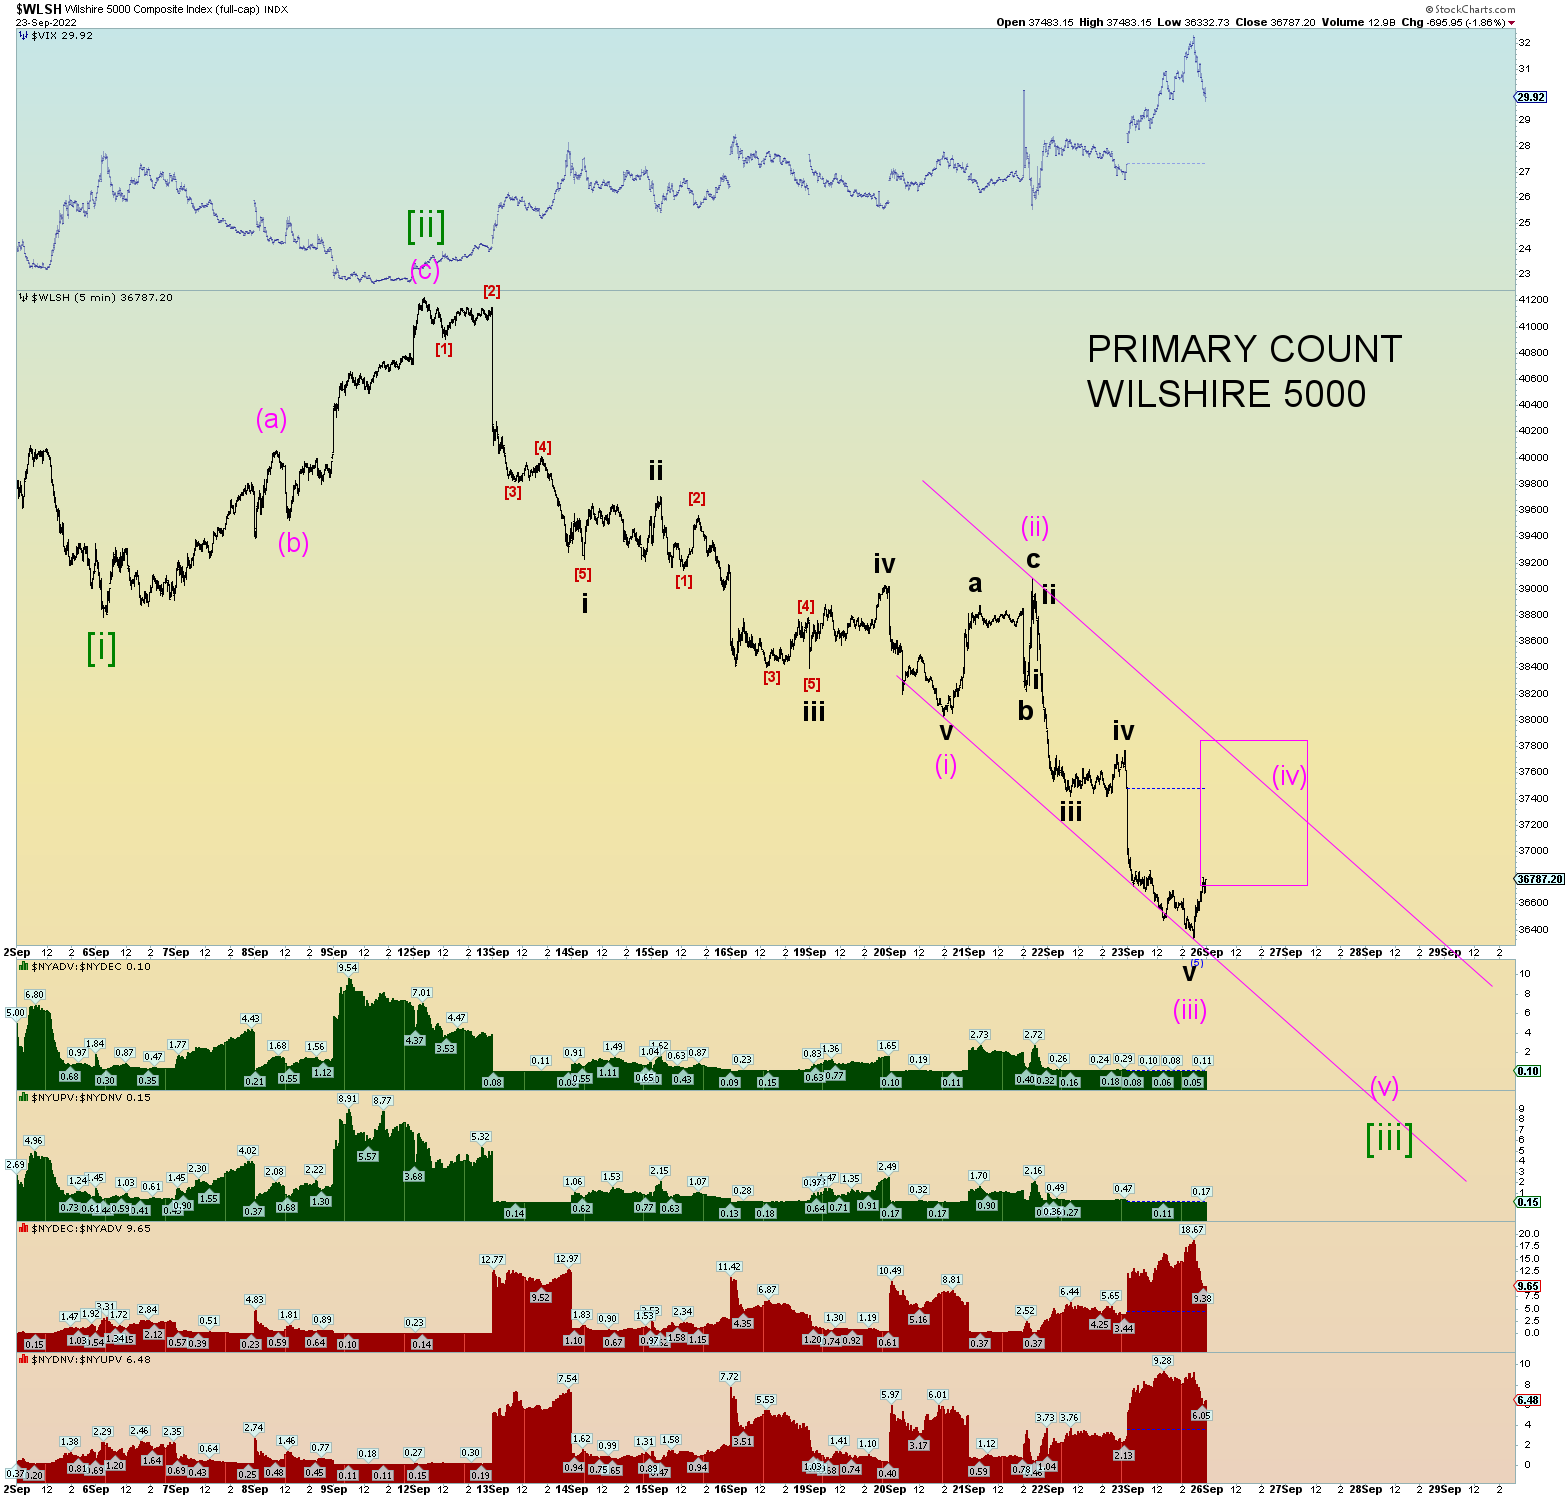
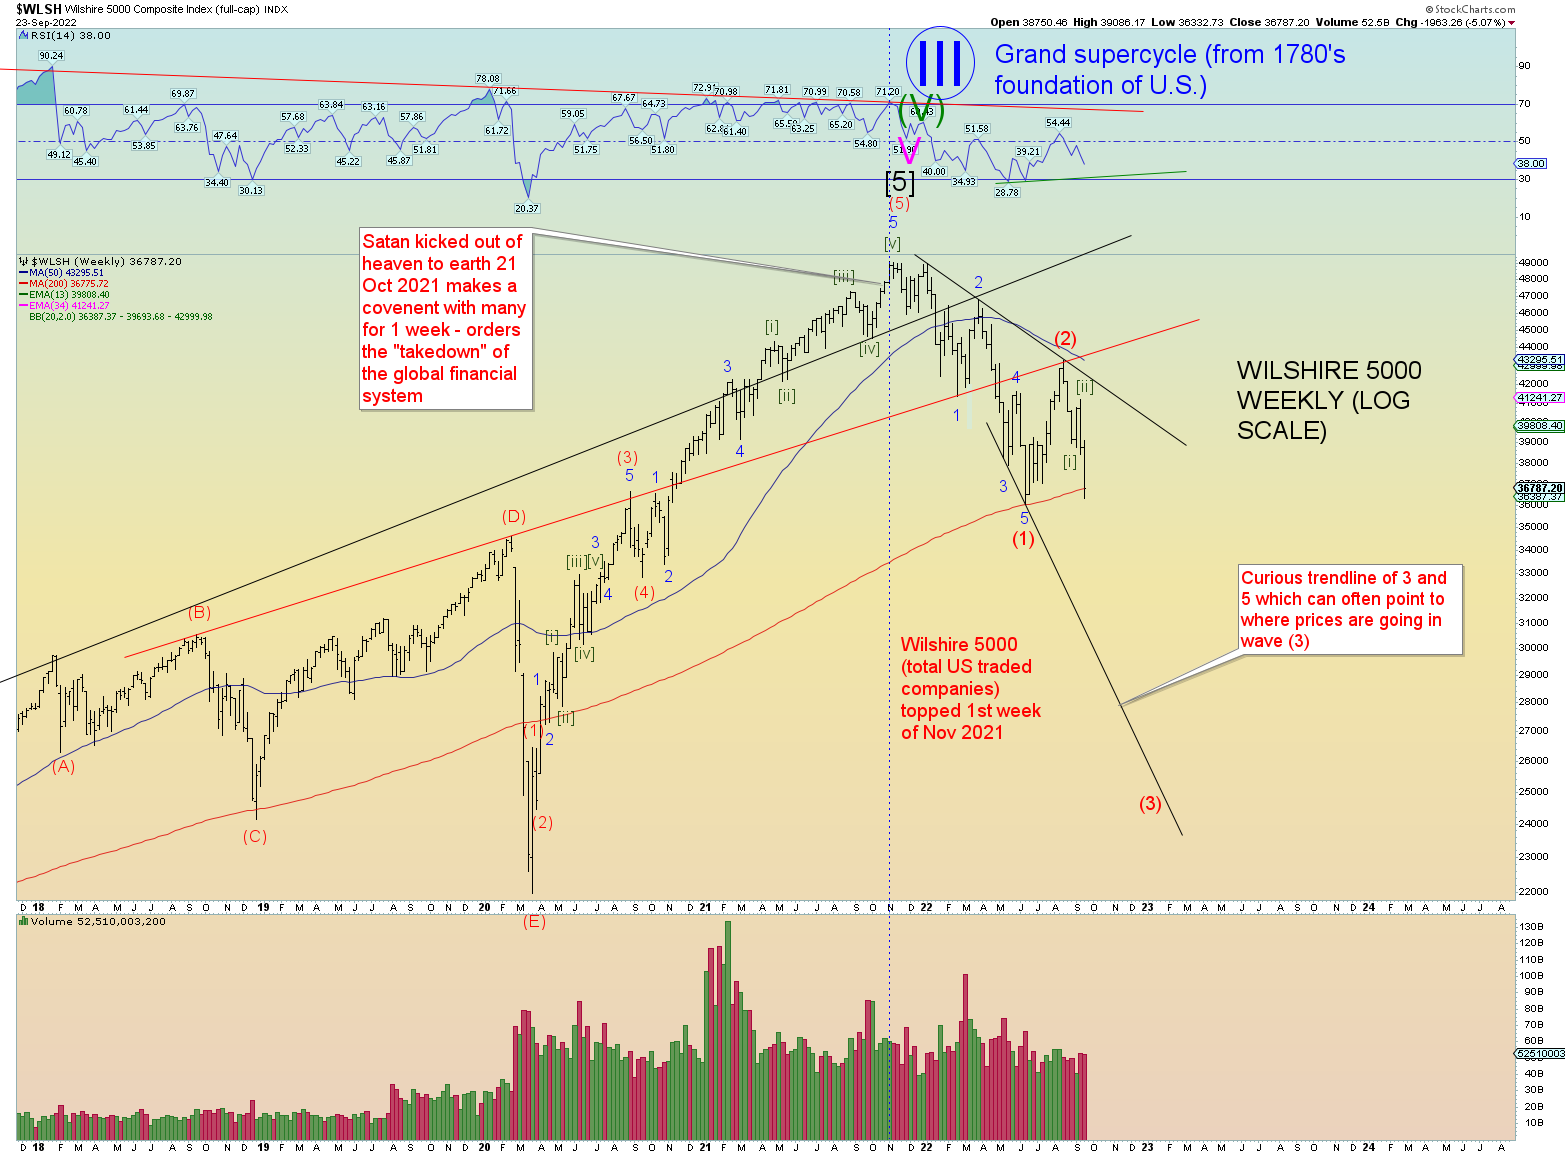
Wilshire counts. Gving the benefit of the doubt again to the market and counting today’s low as wave (iii) of [iii] of 1 of (3). Wave (iv) could close today’s SPX gap down.
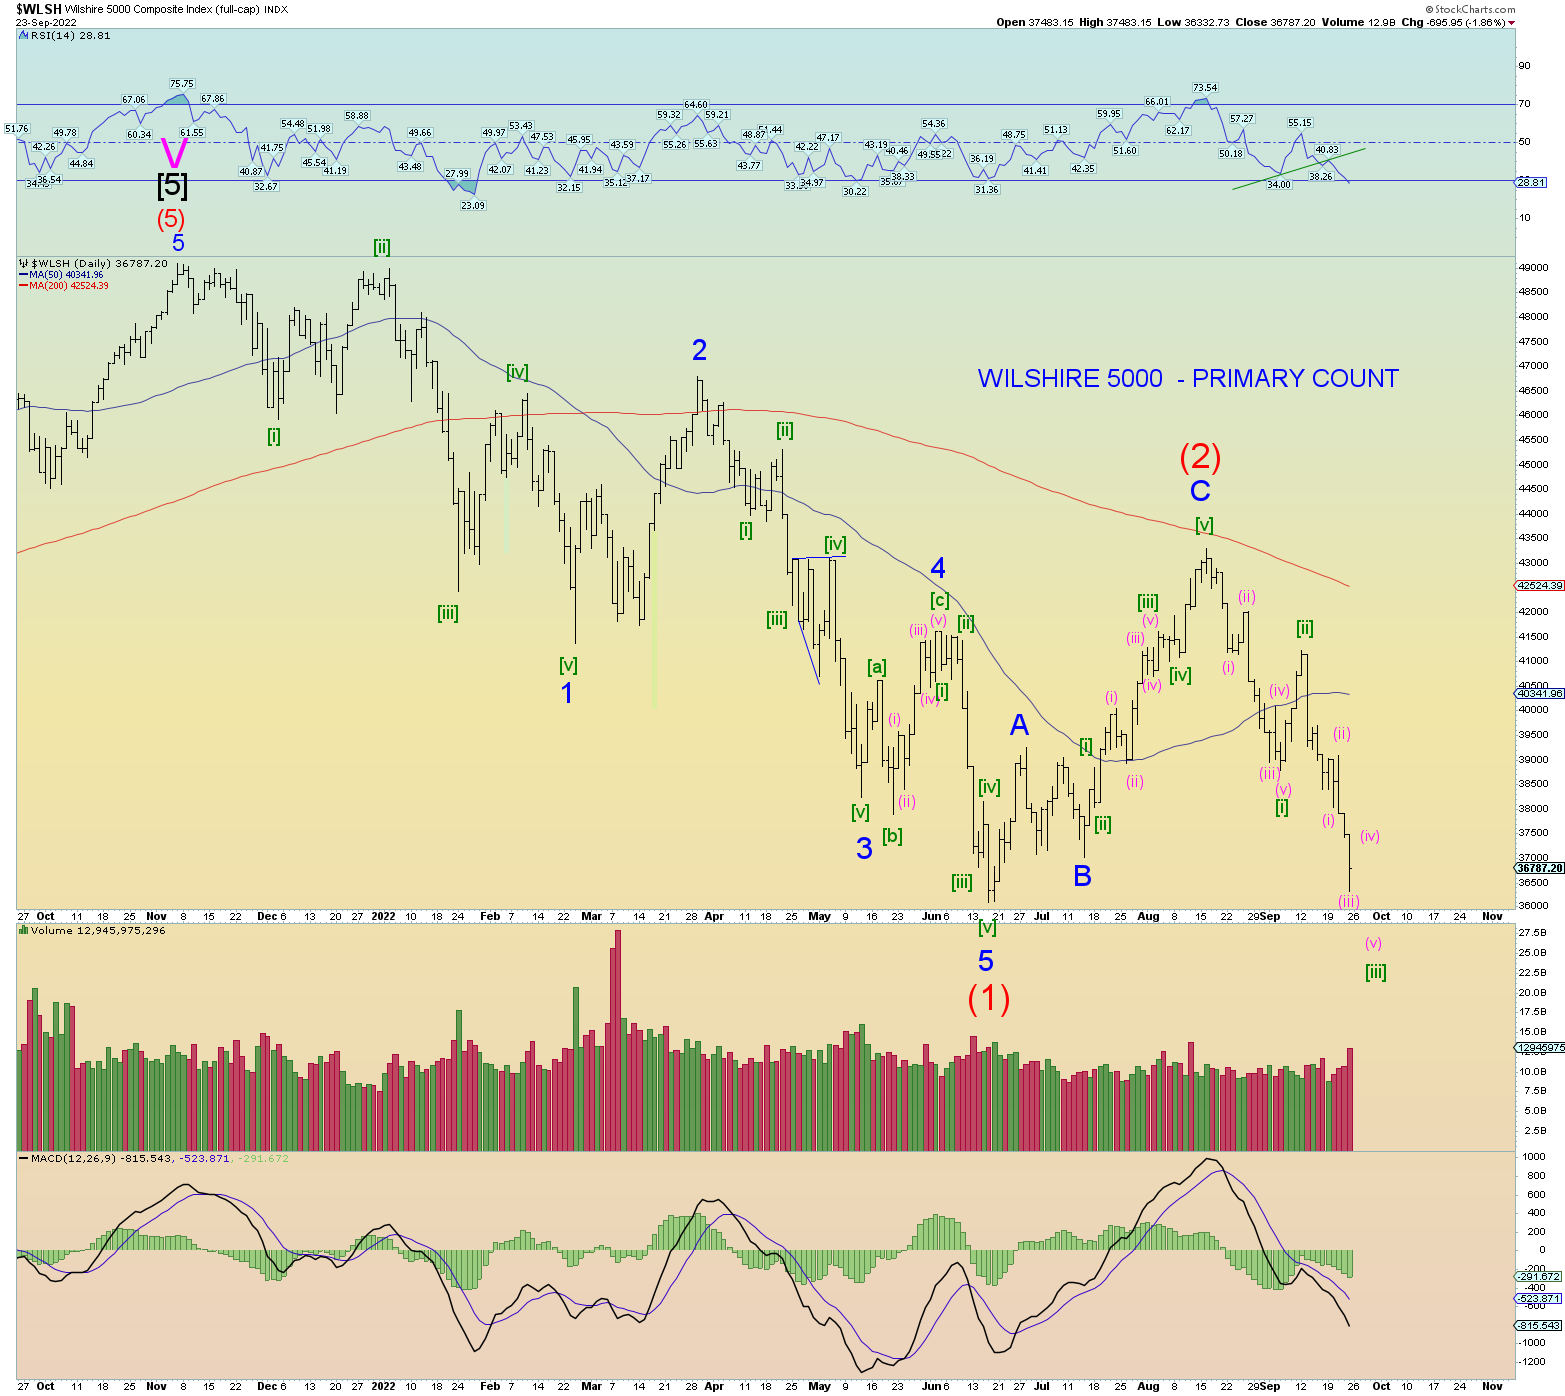
The most bearish count. This proposes that it hasn’t even begun yet to collapse. Allows for an even a robust bounce On Monday but the bottom falls out after that.