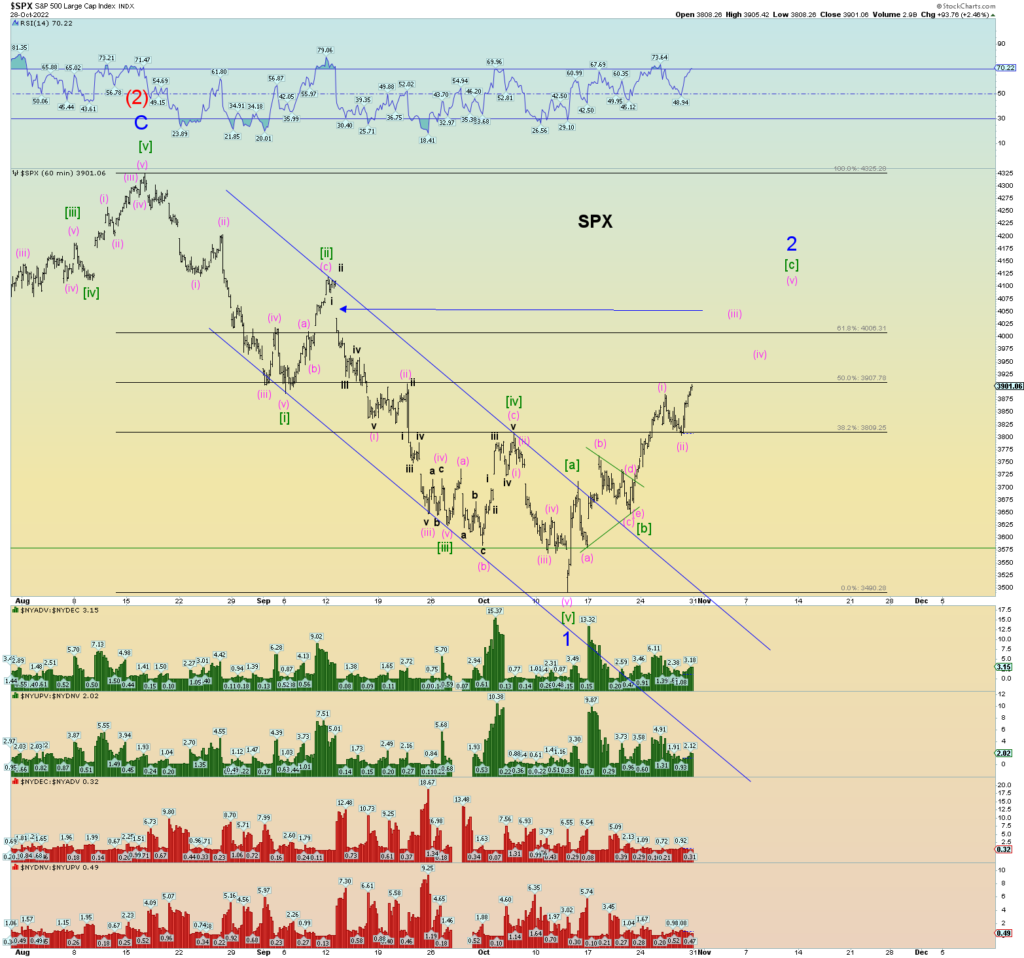
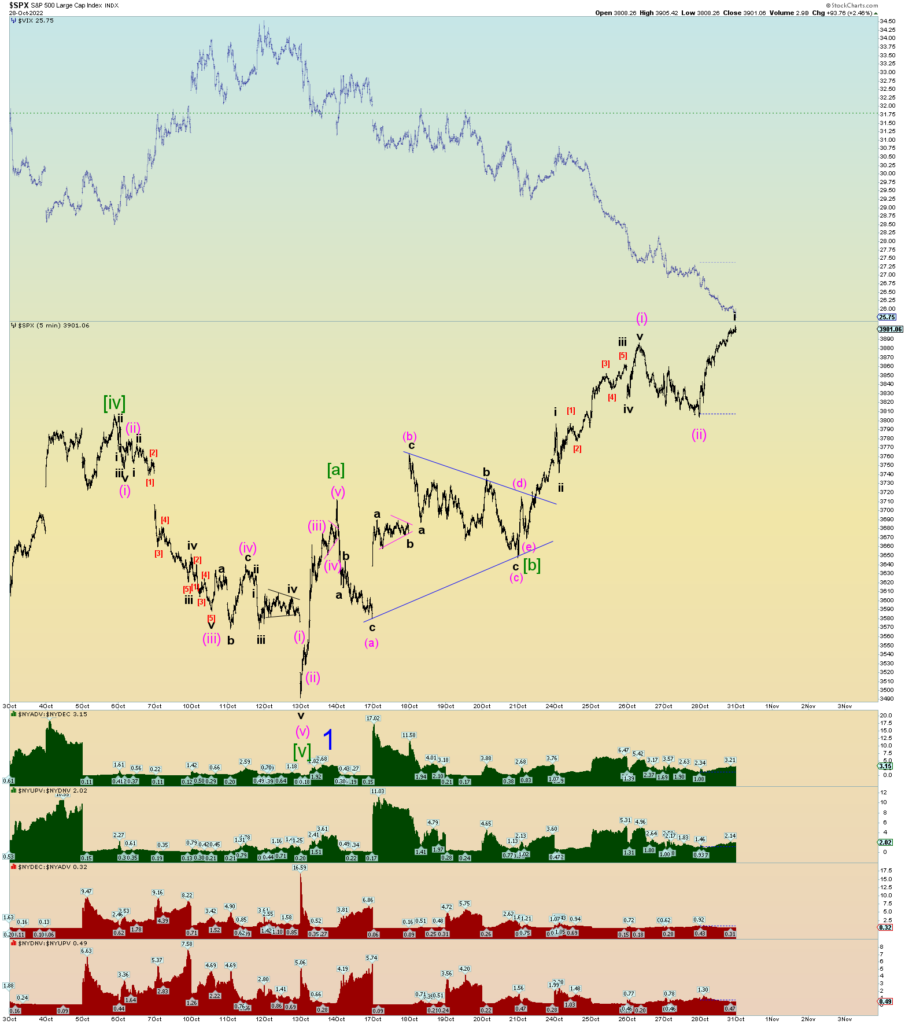
Well, today was a kick in the nuts for bears. The market is likely heading higher, perhaps closing the open gap down in the SPX. Today may have even triggered a NYSE “breadth thrust event” (13 days) as I like to call it. I won’t have that data until Monday though from Stockcharts.
Therefore, the count is much like Intermediate wave (2) in that wave “C” of (2) stretched itself out very bullishly (and then collapsed). It seems Minor 2 of (3) is doing the same. Wave [c] of 2 is stretching itself out to the fullest perhaps.
200 DMA seems “hell or bust”.
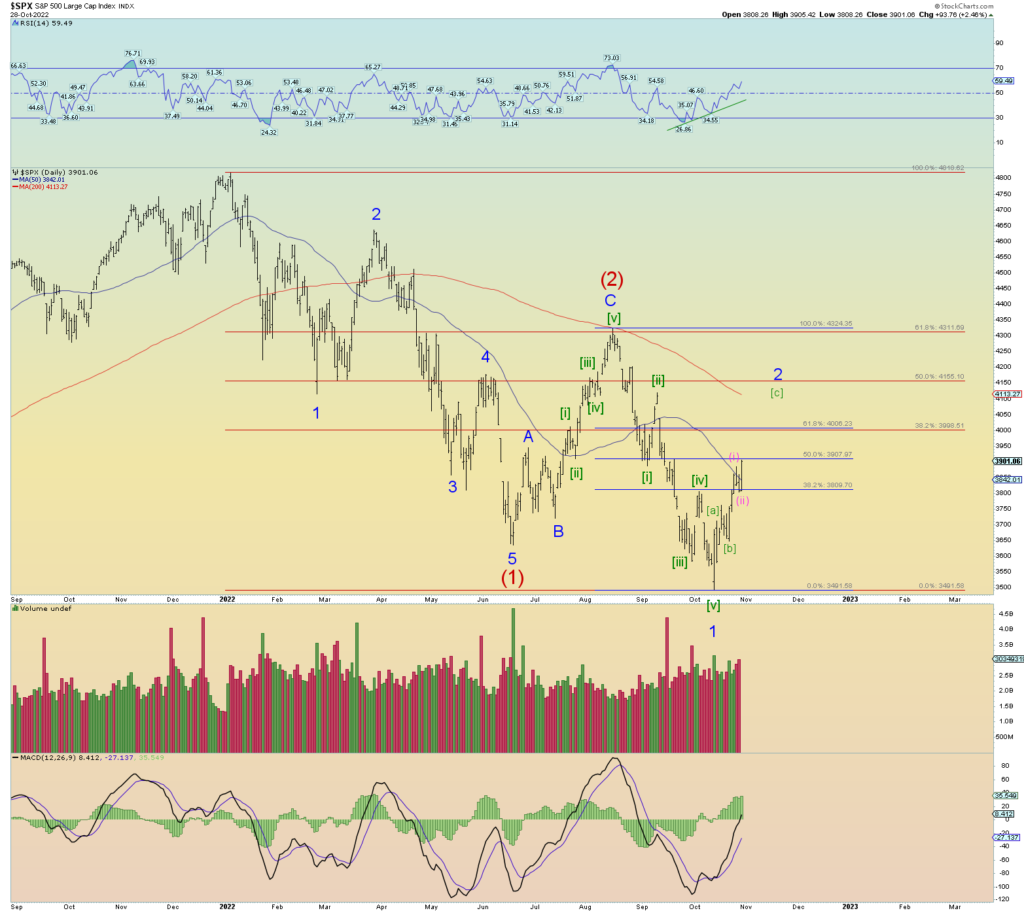
200 DMA seems a likely target.
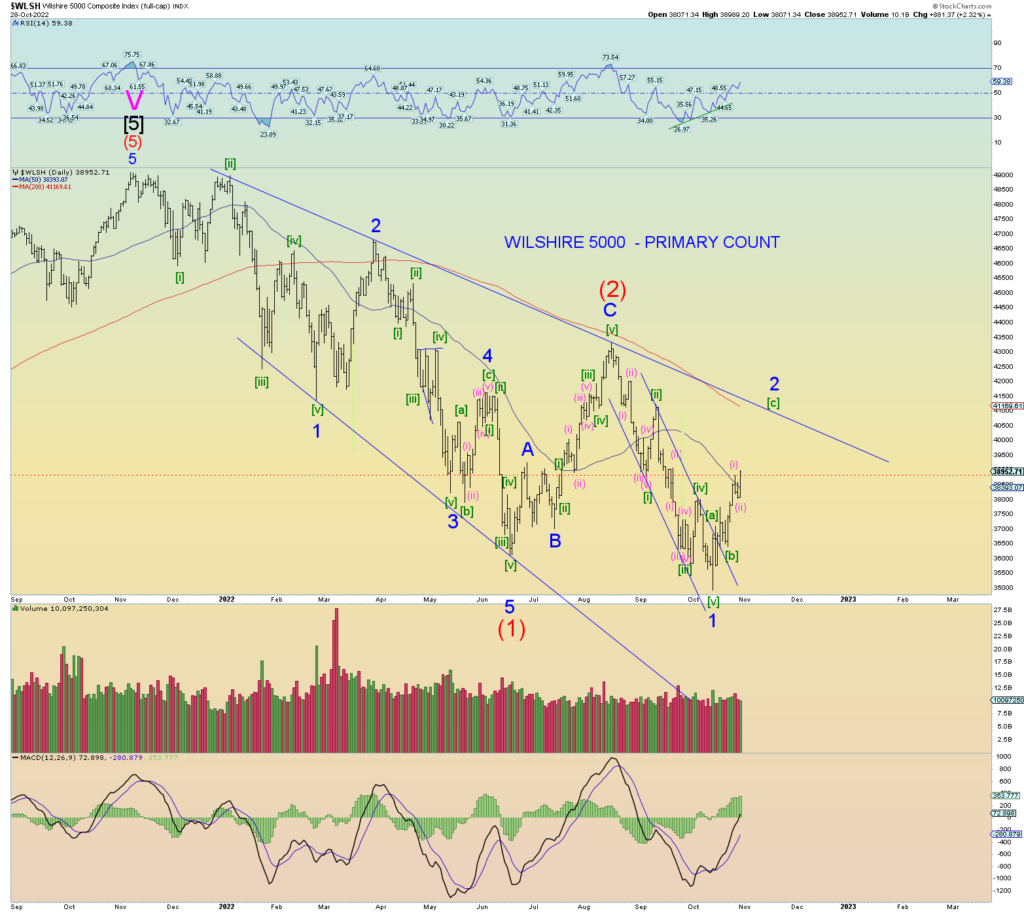
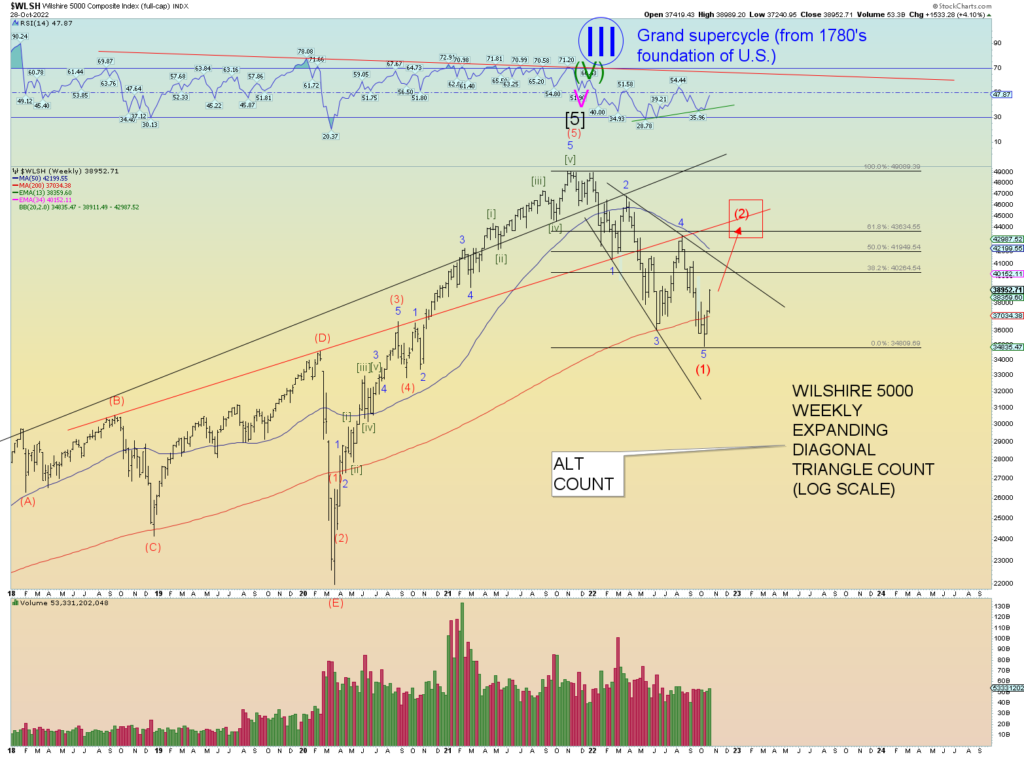
The ultimate long term alternate count is that Intermediate (1) finished at the low and we are in an aggressive Intermediate (2) that will retrace quite some distance at least a Fibonacci 61.8% of the entire drop and perhaps even more.
At what point does this count come into play? The hourly squiggle chart (The first SPX chart in this post as shown above) is what we should be looking at. No need to get ahead of things. First things first. Allow the market to stretch its legs all the way to 4100 if need be before we talk about other counts.
