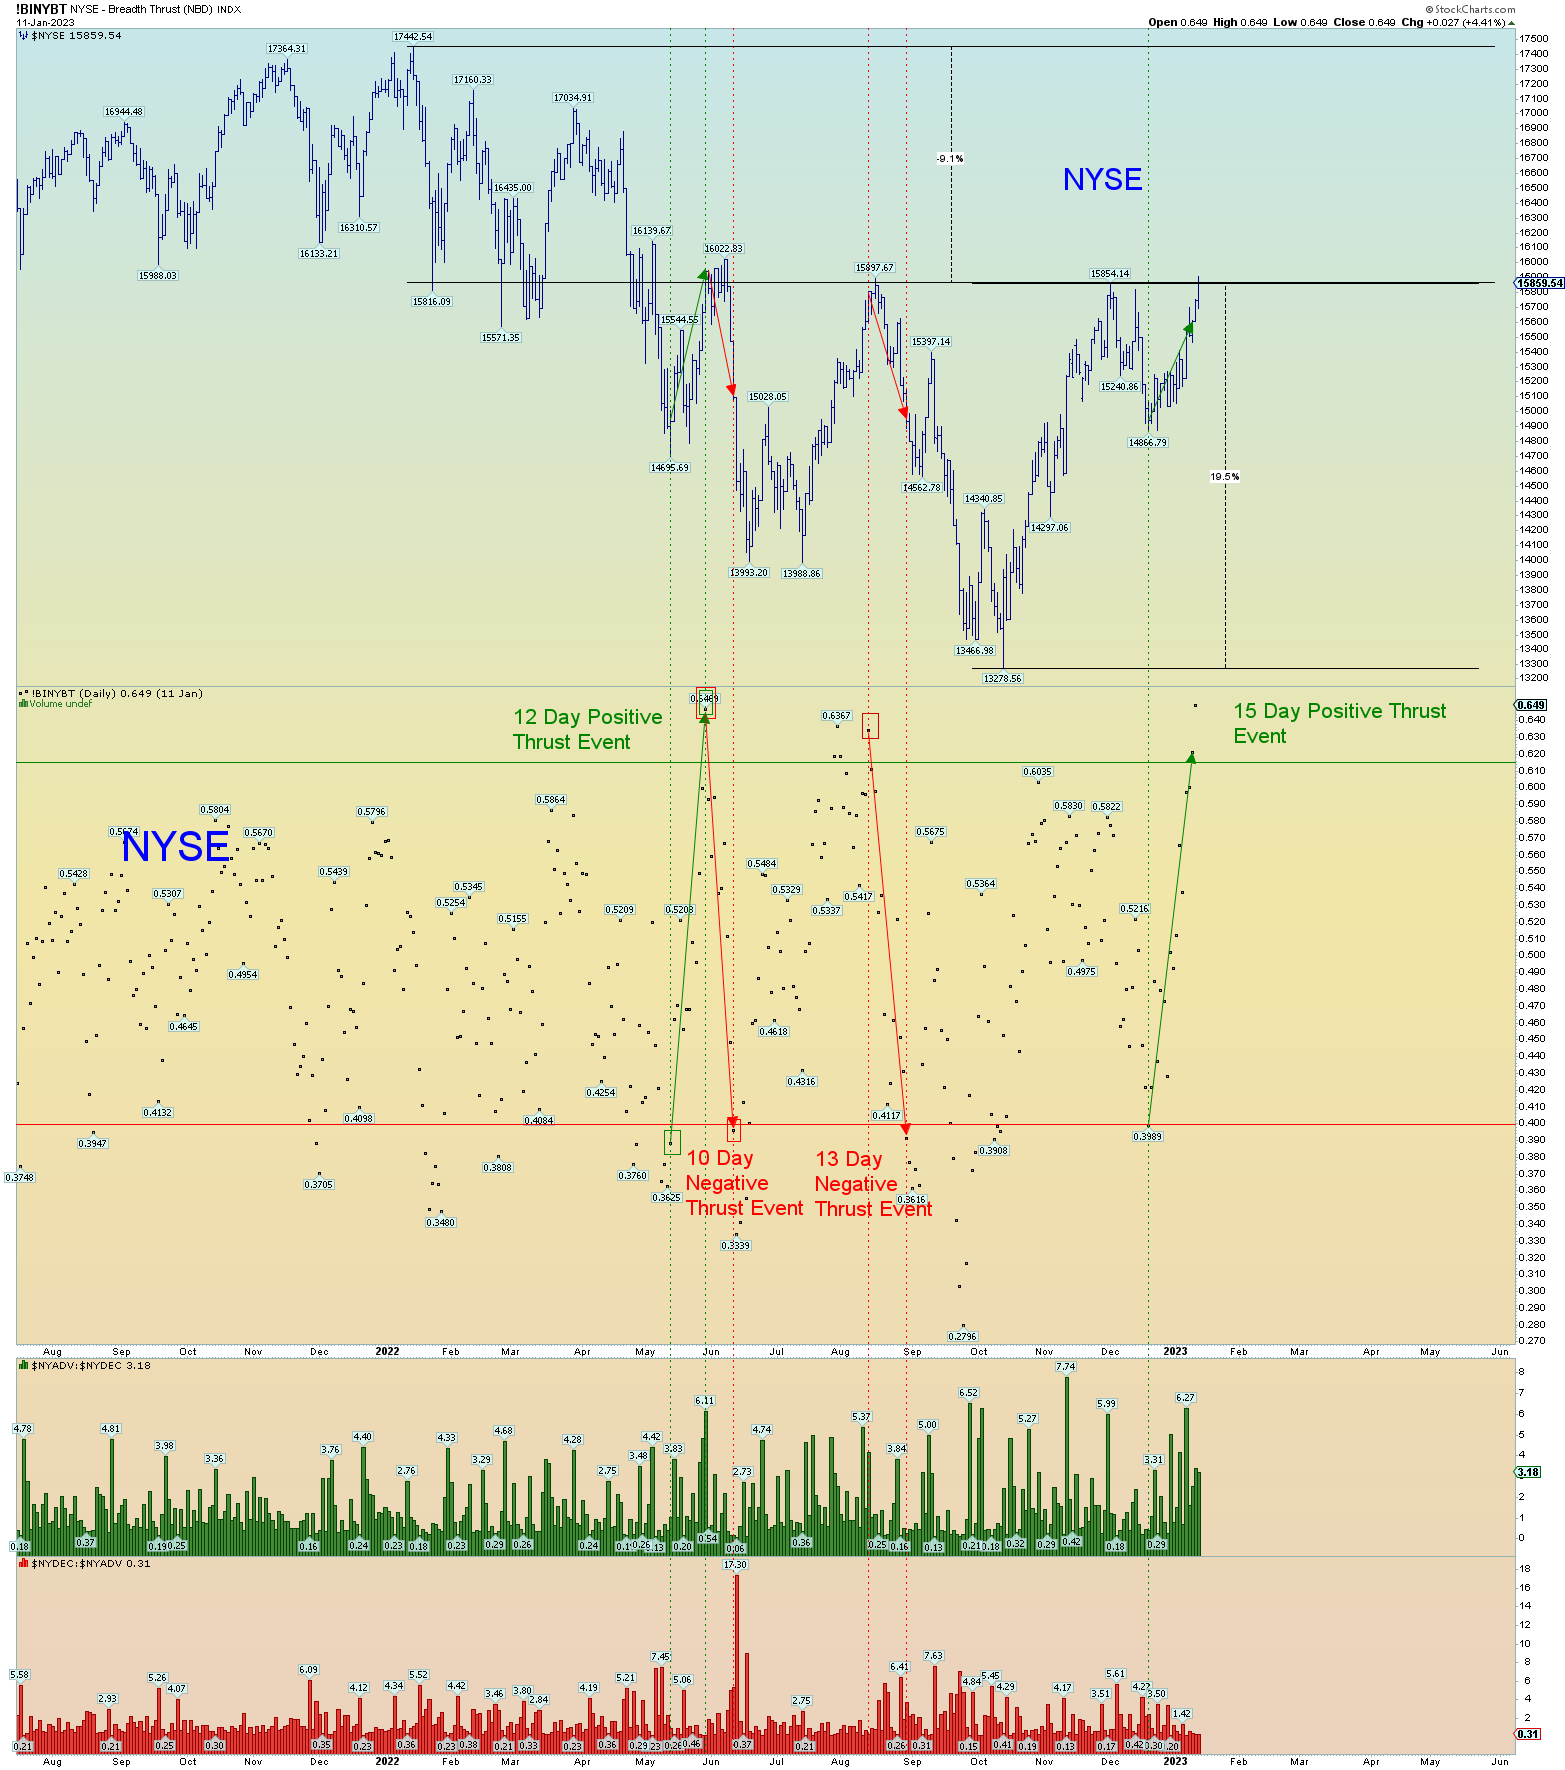
The NYSE highest close since late May 2022. About 9% off its all-time highs and 20% off its October lows. Hardly the worst marker ever. Of course, the other indices are in much worse shape. It remains a highly fractured market.
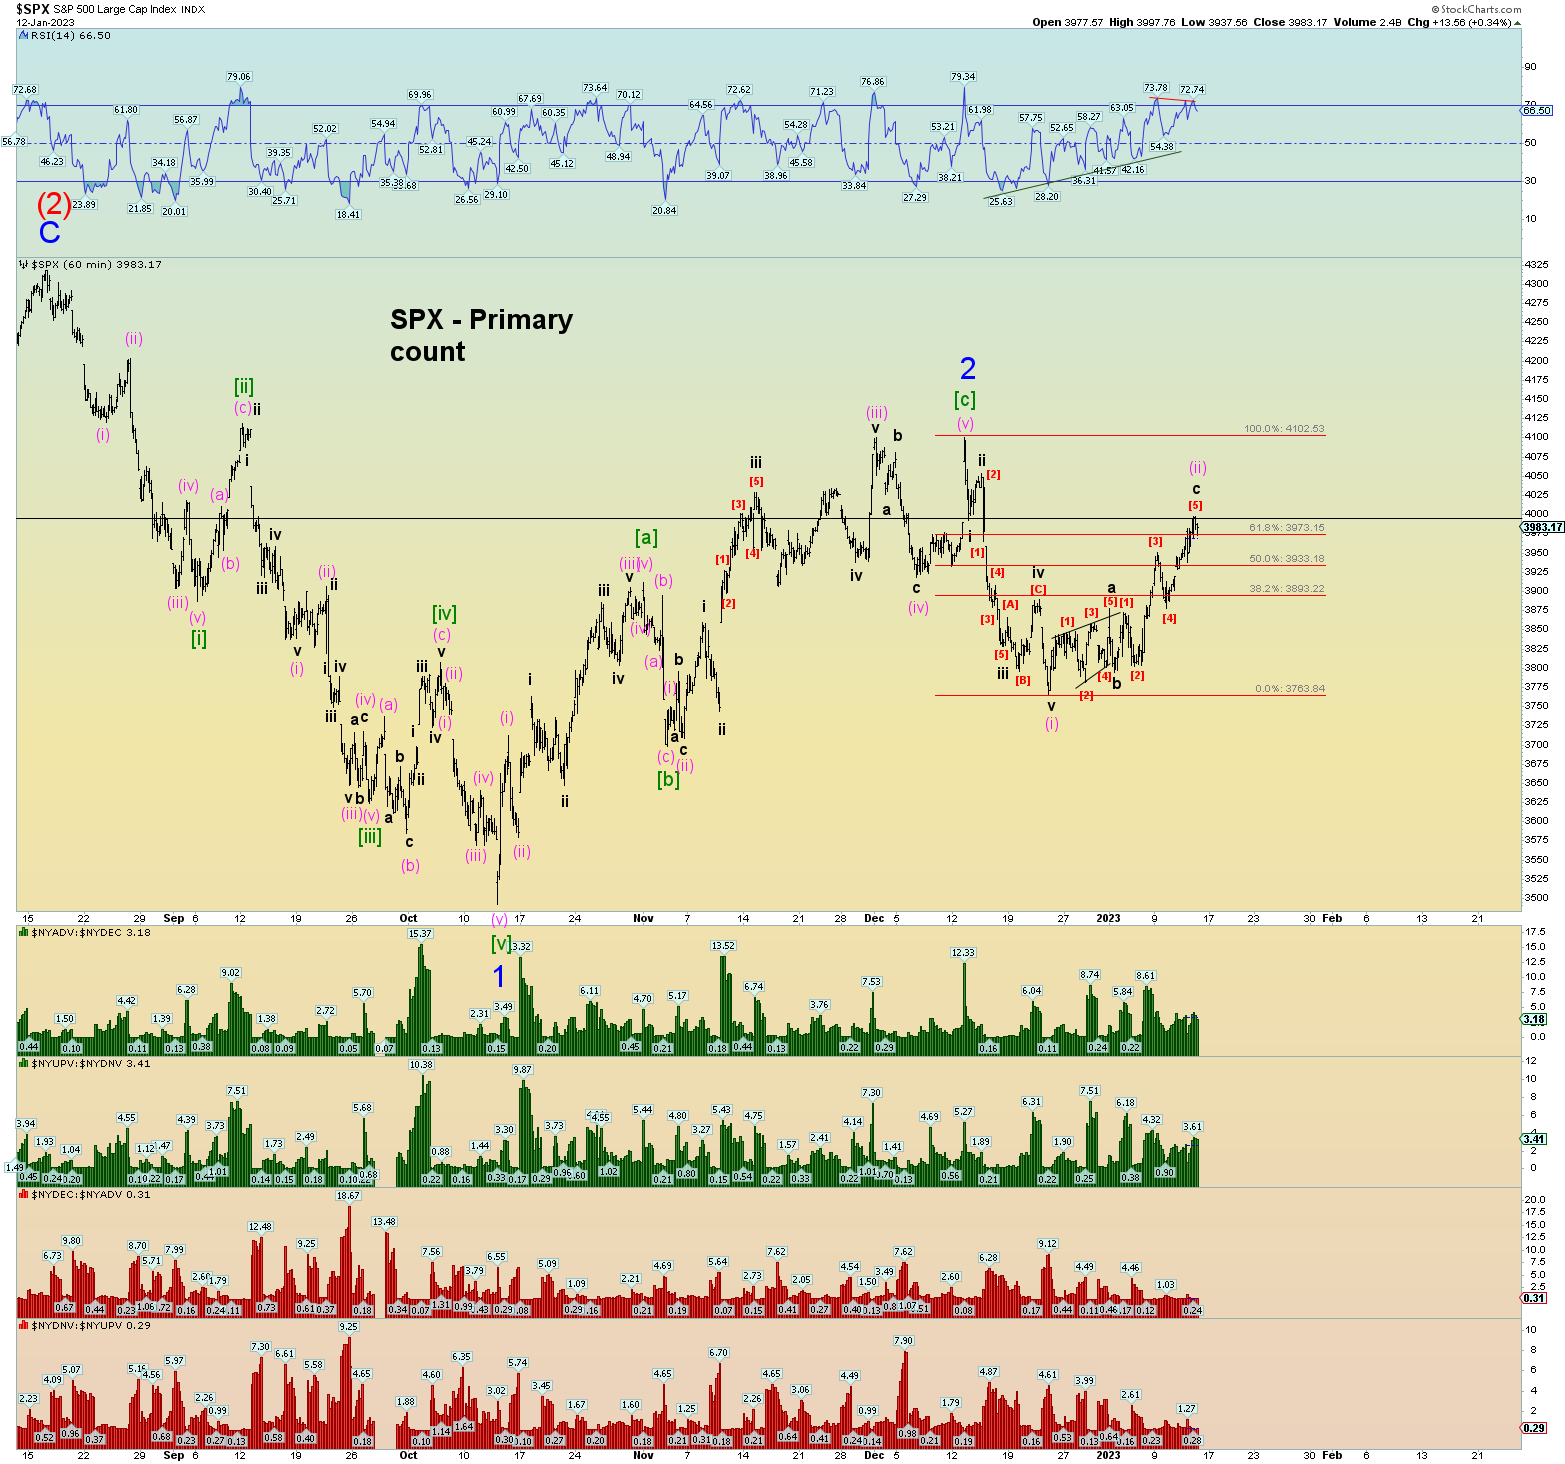
The SPX has completely filled the top of the opening gap down from a month ago. If prices go above its December peak, then the alt count that has been shown will kick in.
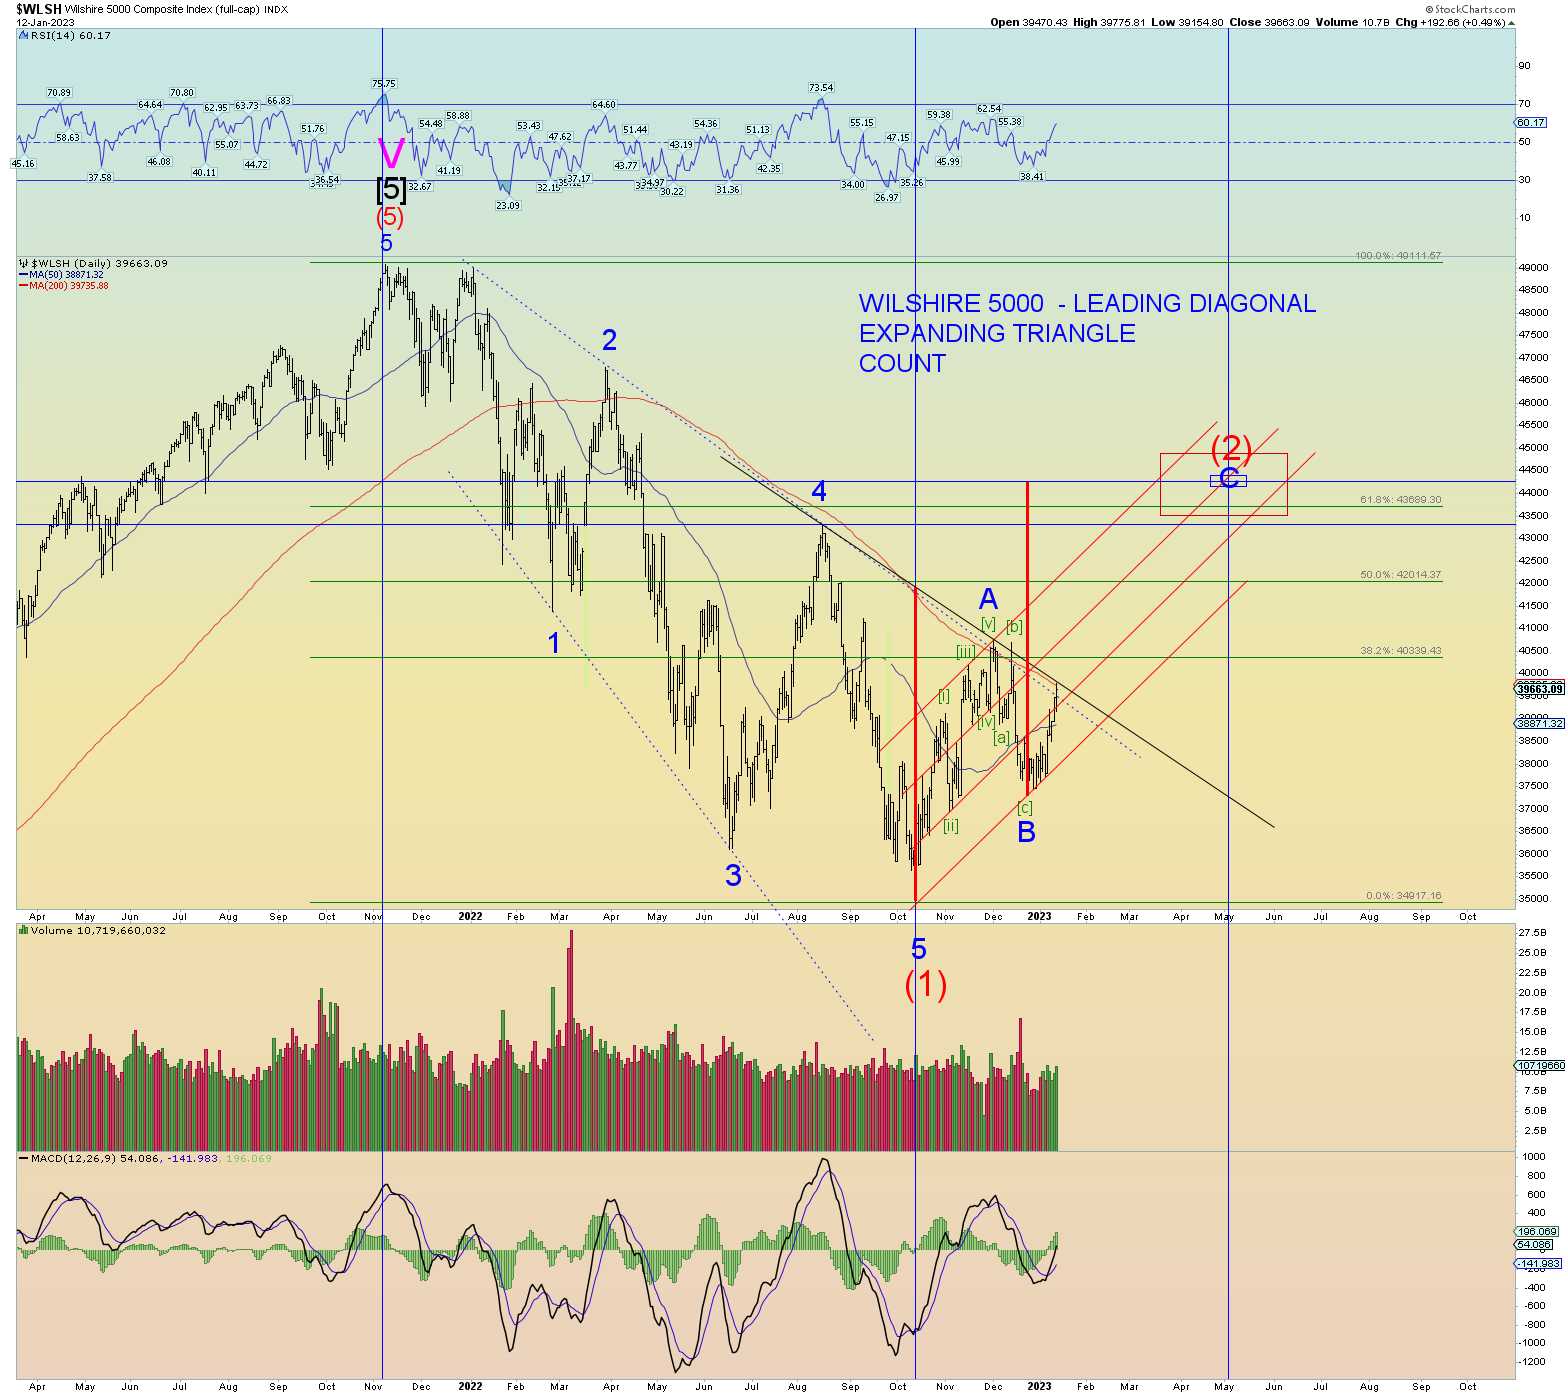
I think I went kinda hog wild on this chart. The red up channels represent possible price pathing and targets if we are indeed in Intermediate (2) which, having the NYSE just trigger a positive breadth thrust event seems likely.
Unless things turn down like ugly like now.
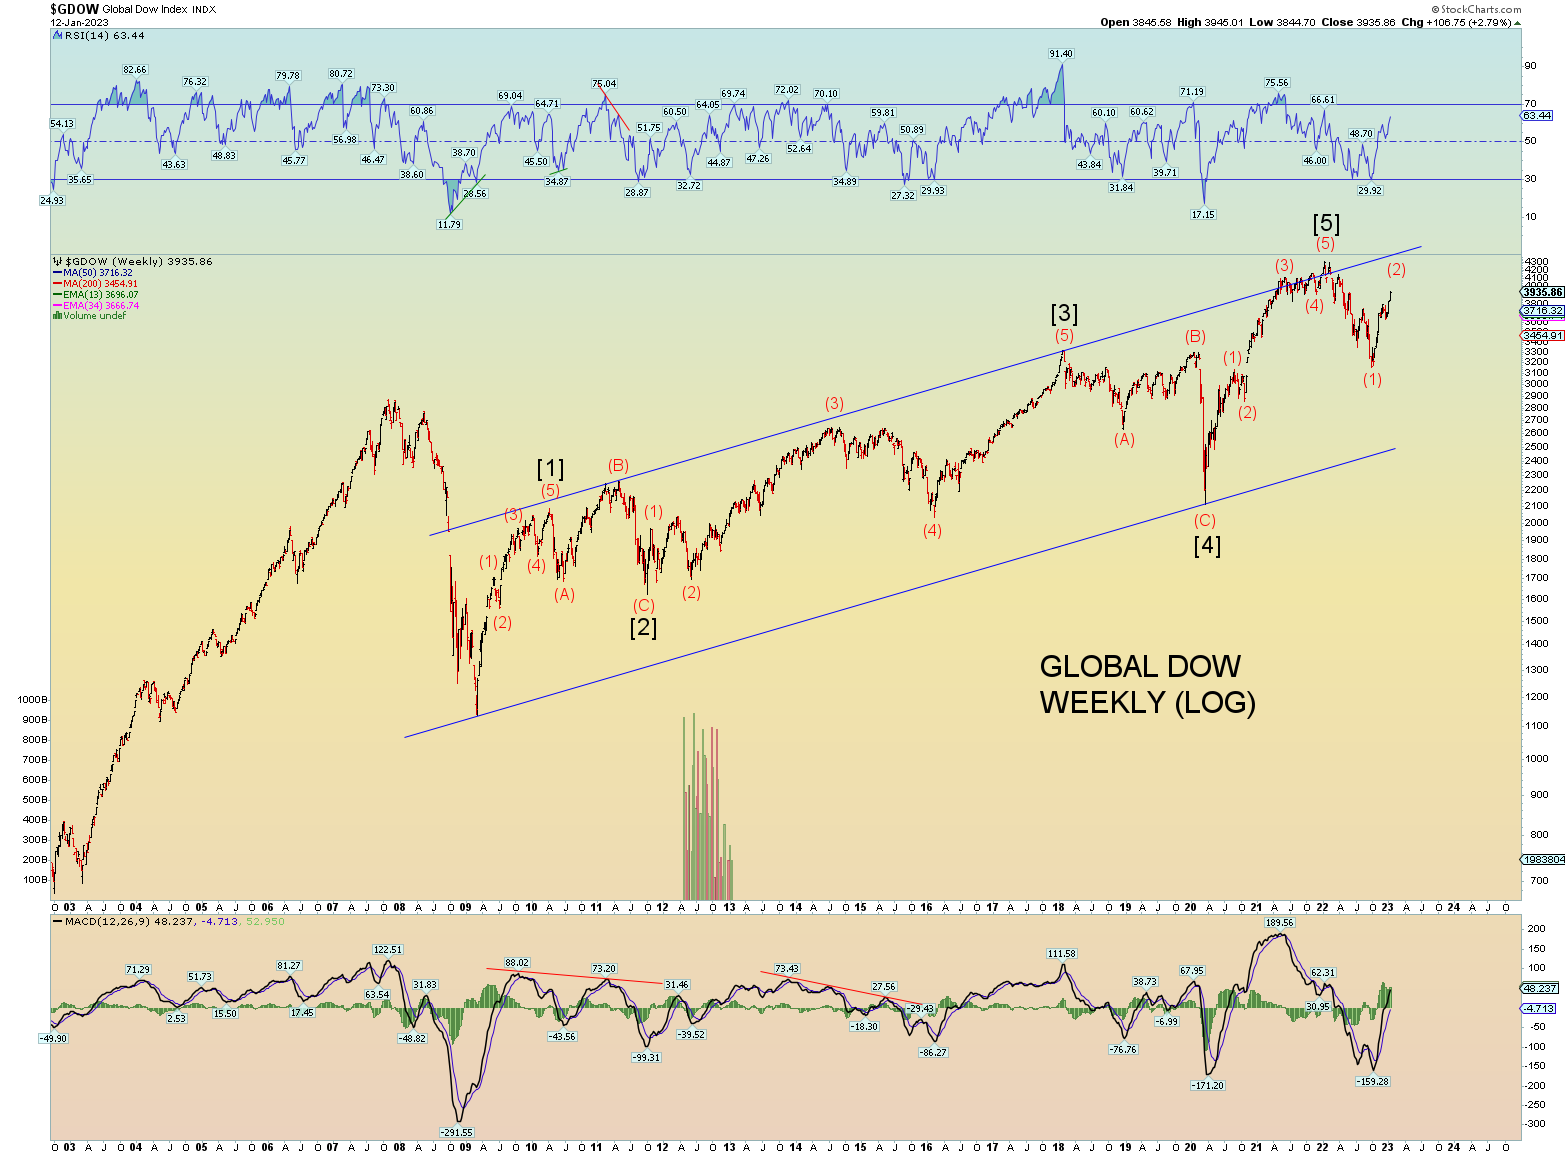
Aggressive Global Dow