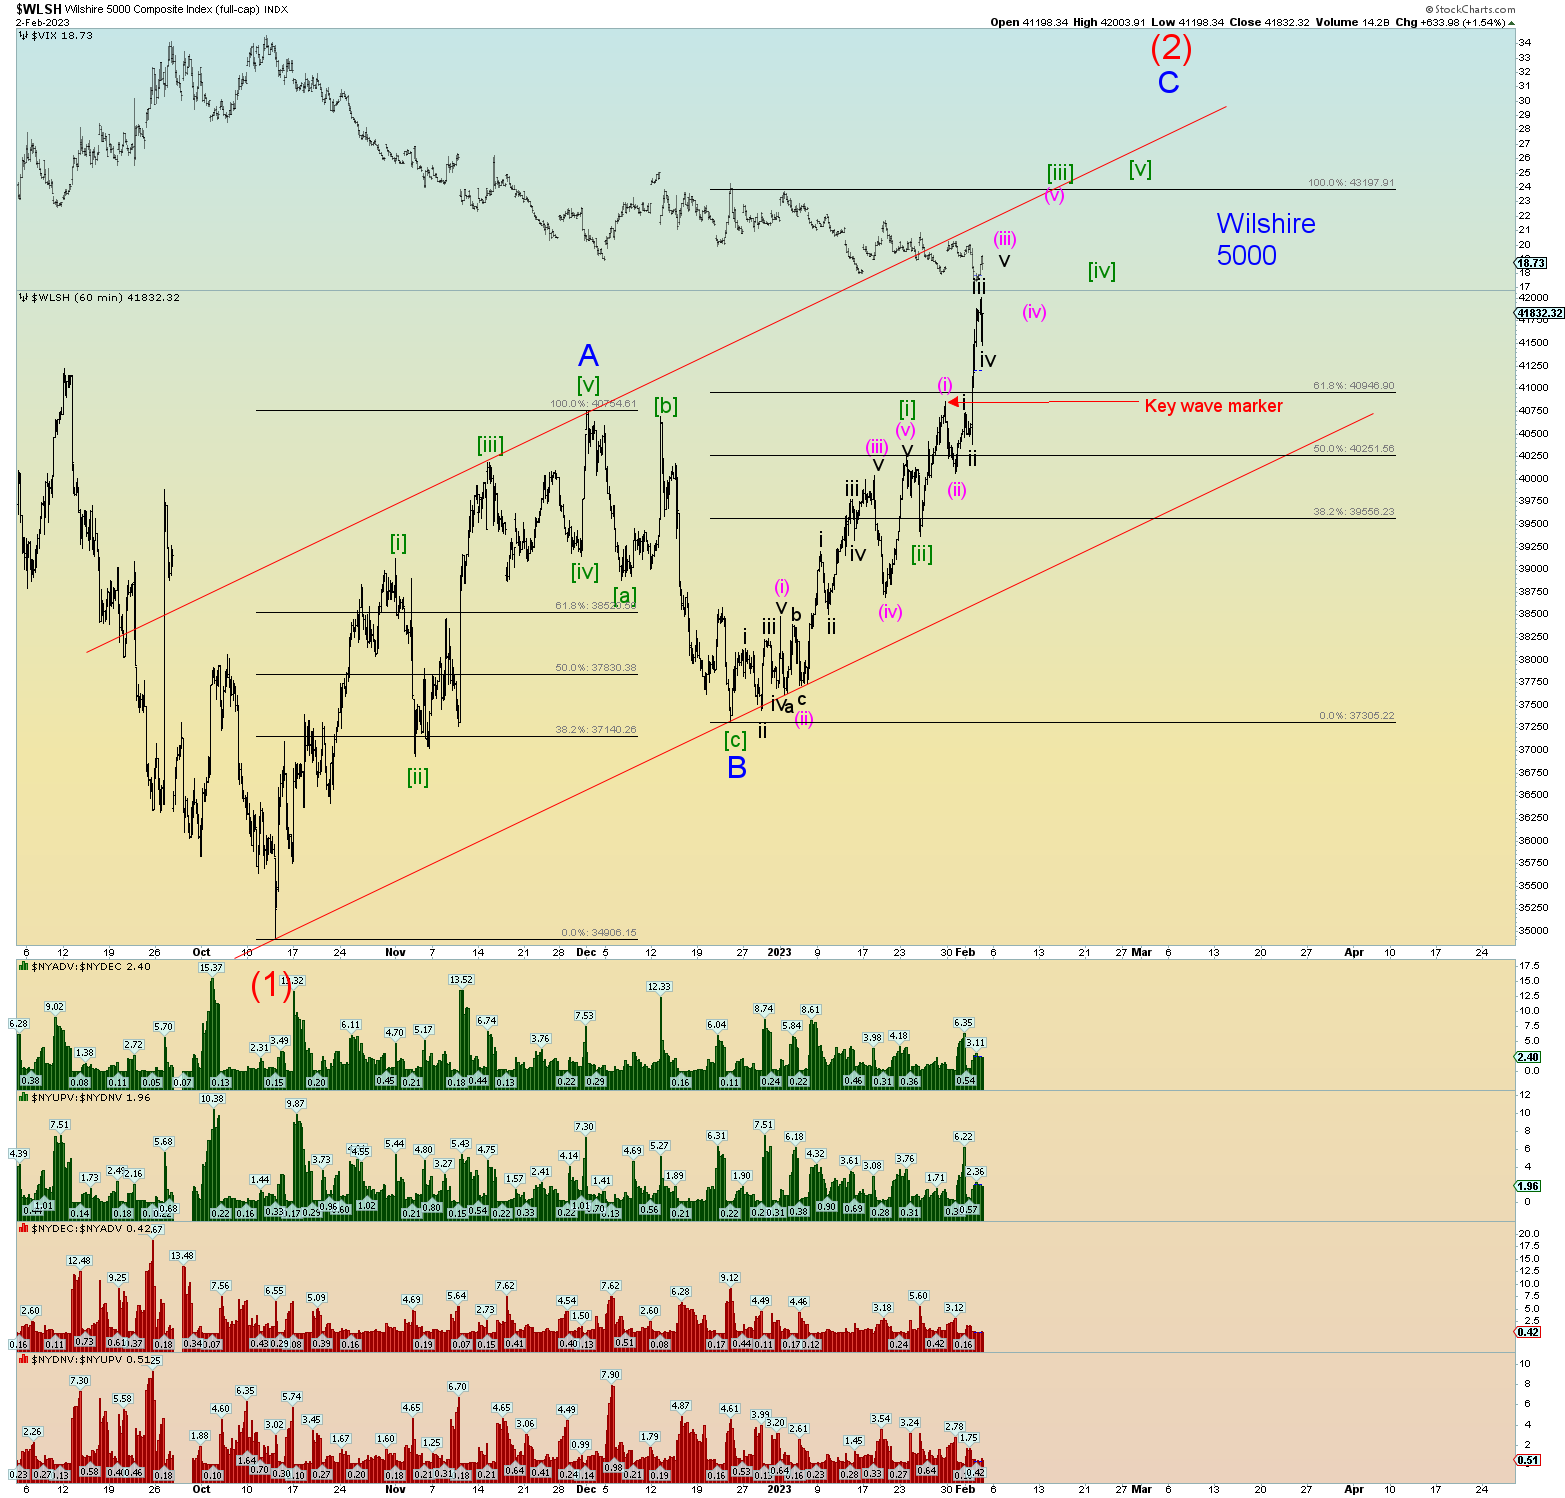
Ok. We were guessing based on market internals and the wave structure we would be in wave (iii) of [iii] of C of (2) up and the last several days has proven that was the best count. We have a key marker in place. The best count has wave C of (2) finishing up. How long and how high? Thats why we count squiggles.
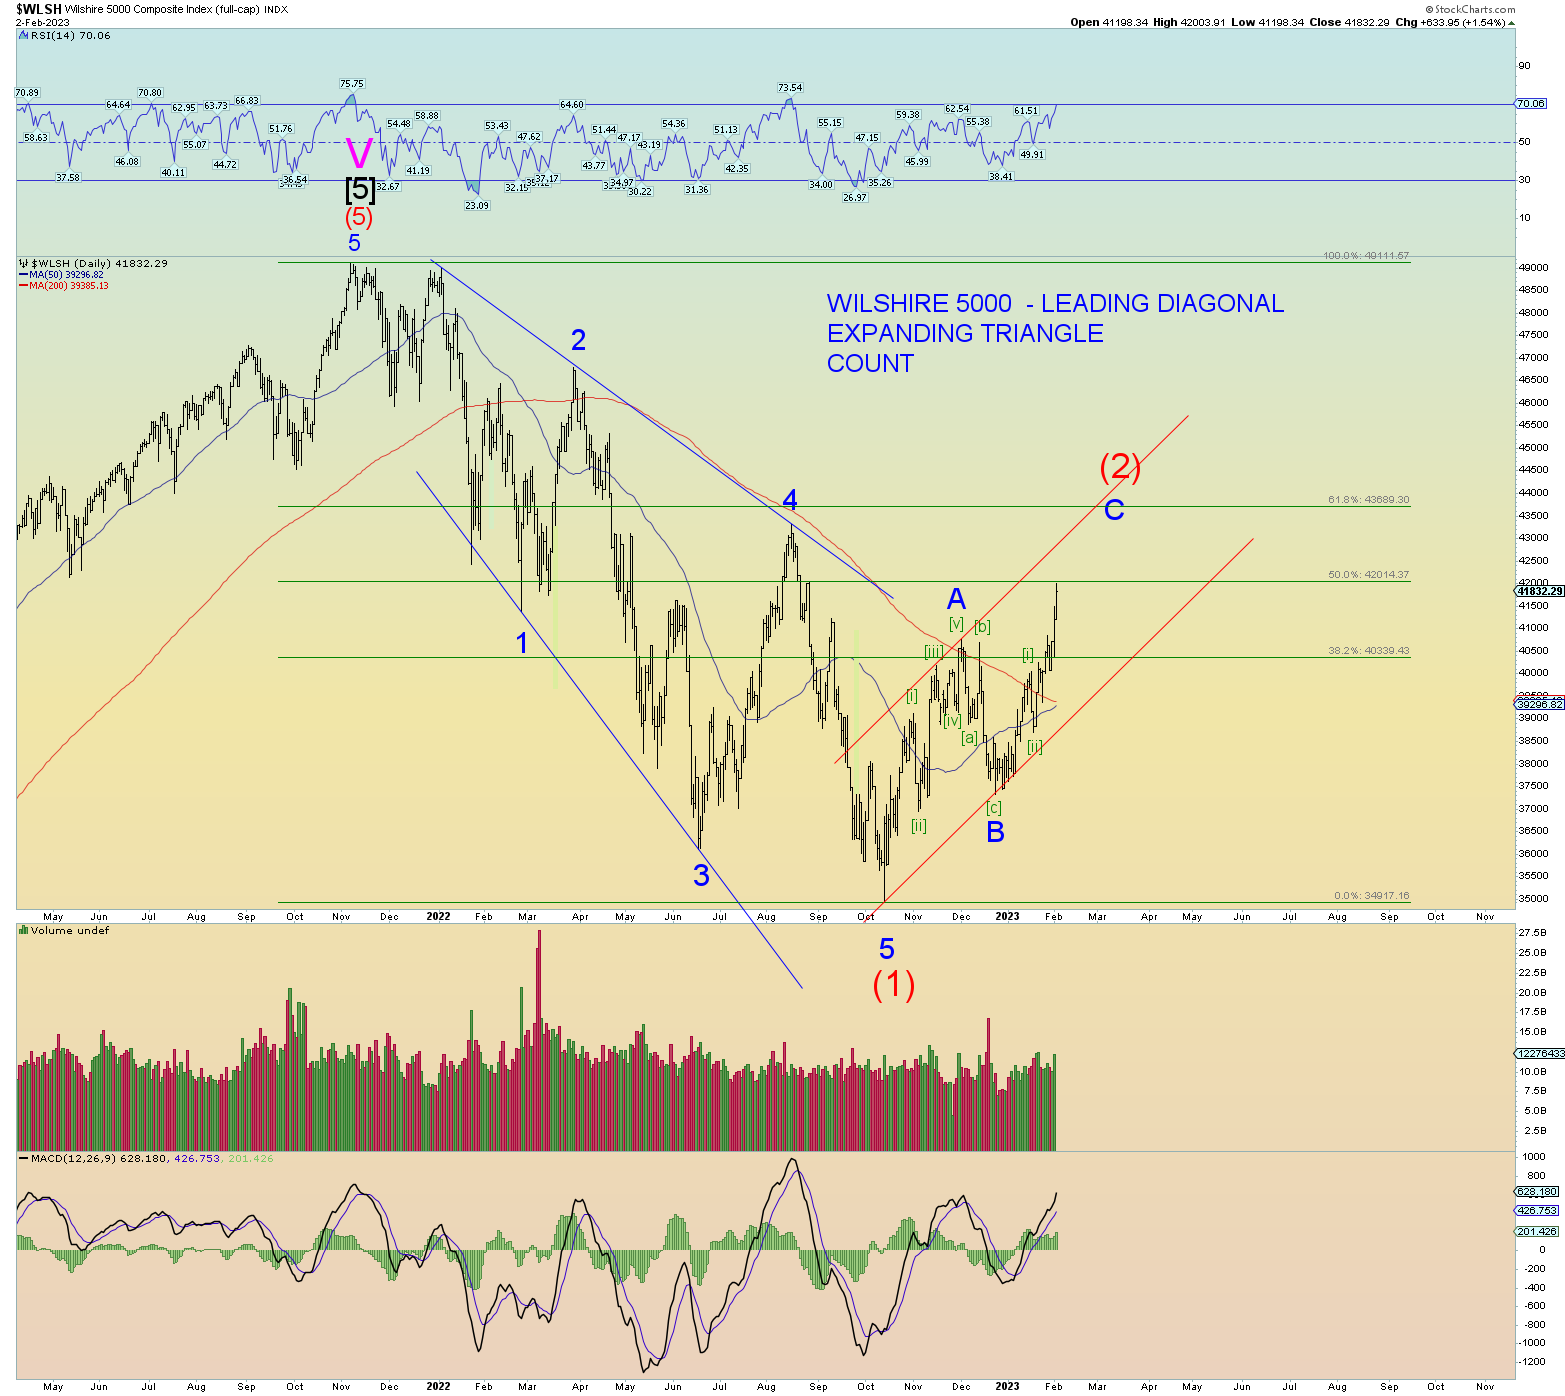
The double Fibs show wave size relationships between waves A and C. I just made a Fib graph over wave A and duplicated it and placed the bottom at wave B. This lets us see easily when wave C = wave A in length which can be a common wave relationship in an A-B-C wave structure.
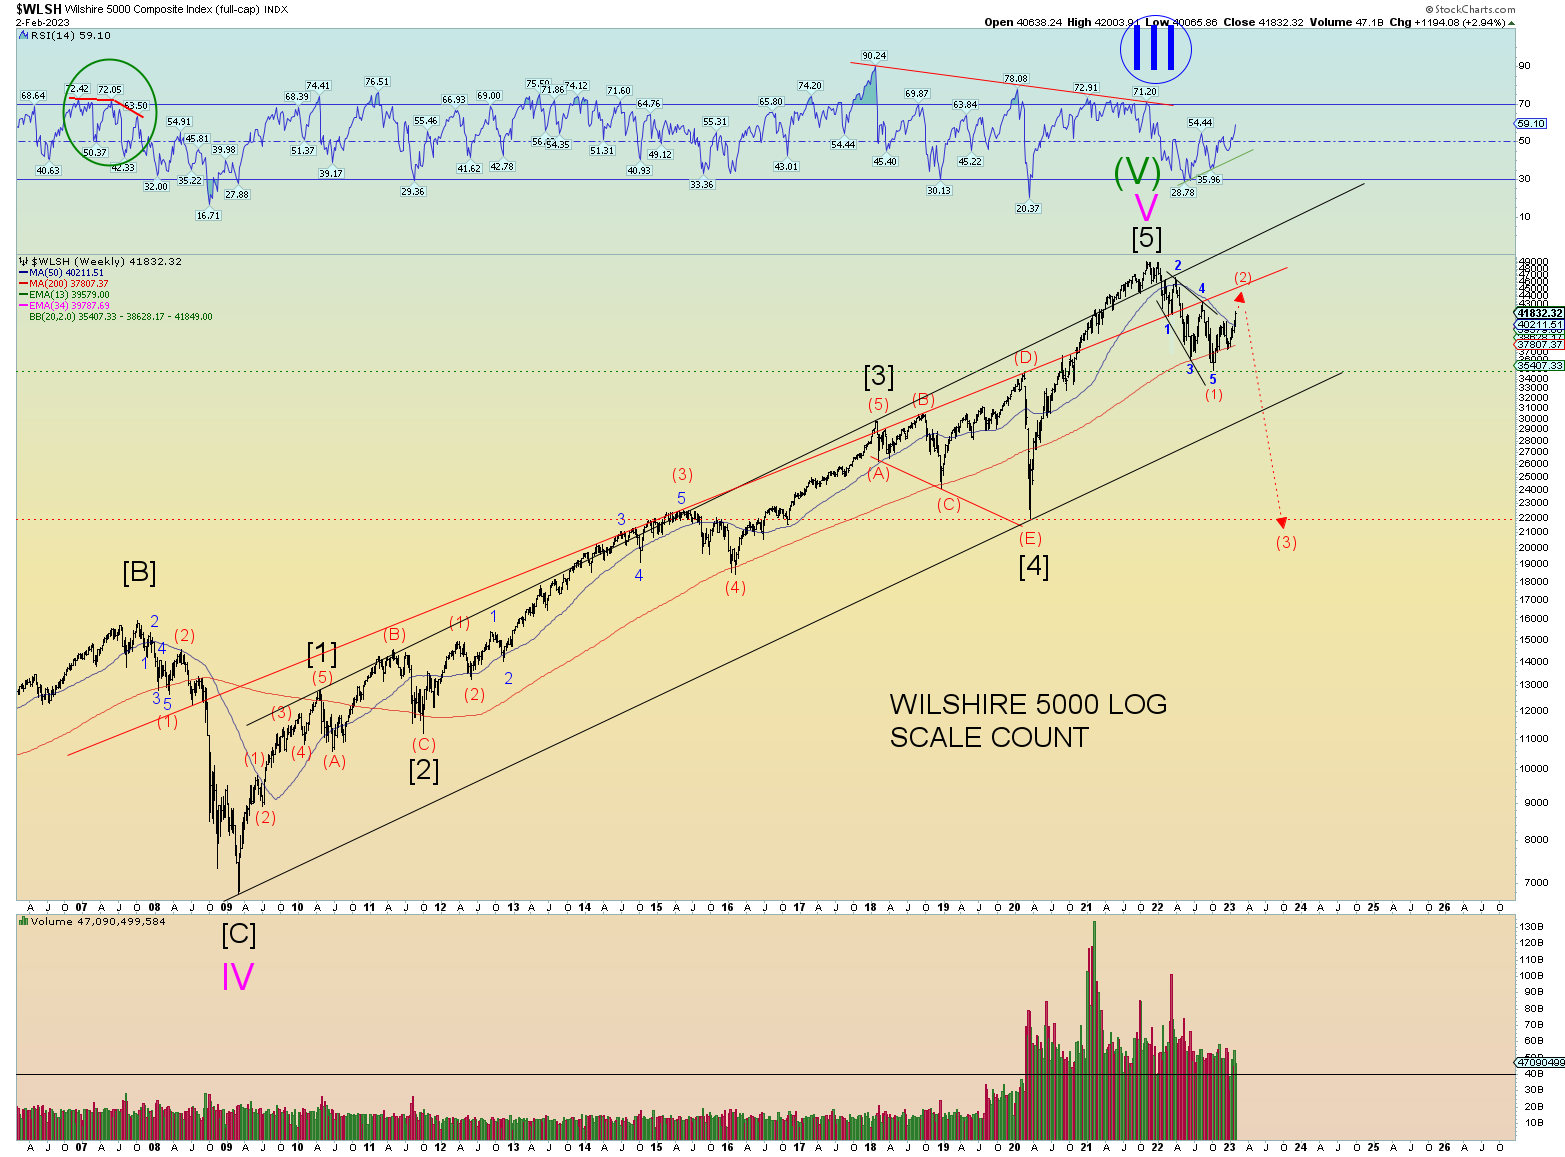
Overall, the Wilshire 5000 has reached a 50% overall retracement from all-time peak of November, 2021. I suspect prices will poke above wave peak of 4 of (1) down eventually.
The weekly suggests also that will happen to fulfill the double positive divergence in the RSI. An extreme price would be a “backtest” of the upper red trend line.
In other words to get back to an “extreme” bullish state of affairs, the market needs to re-conquer and get above this line. My prediction is that it will not be able to.
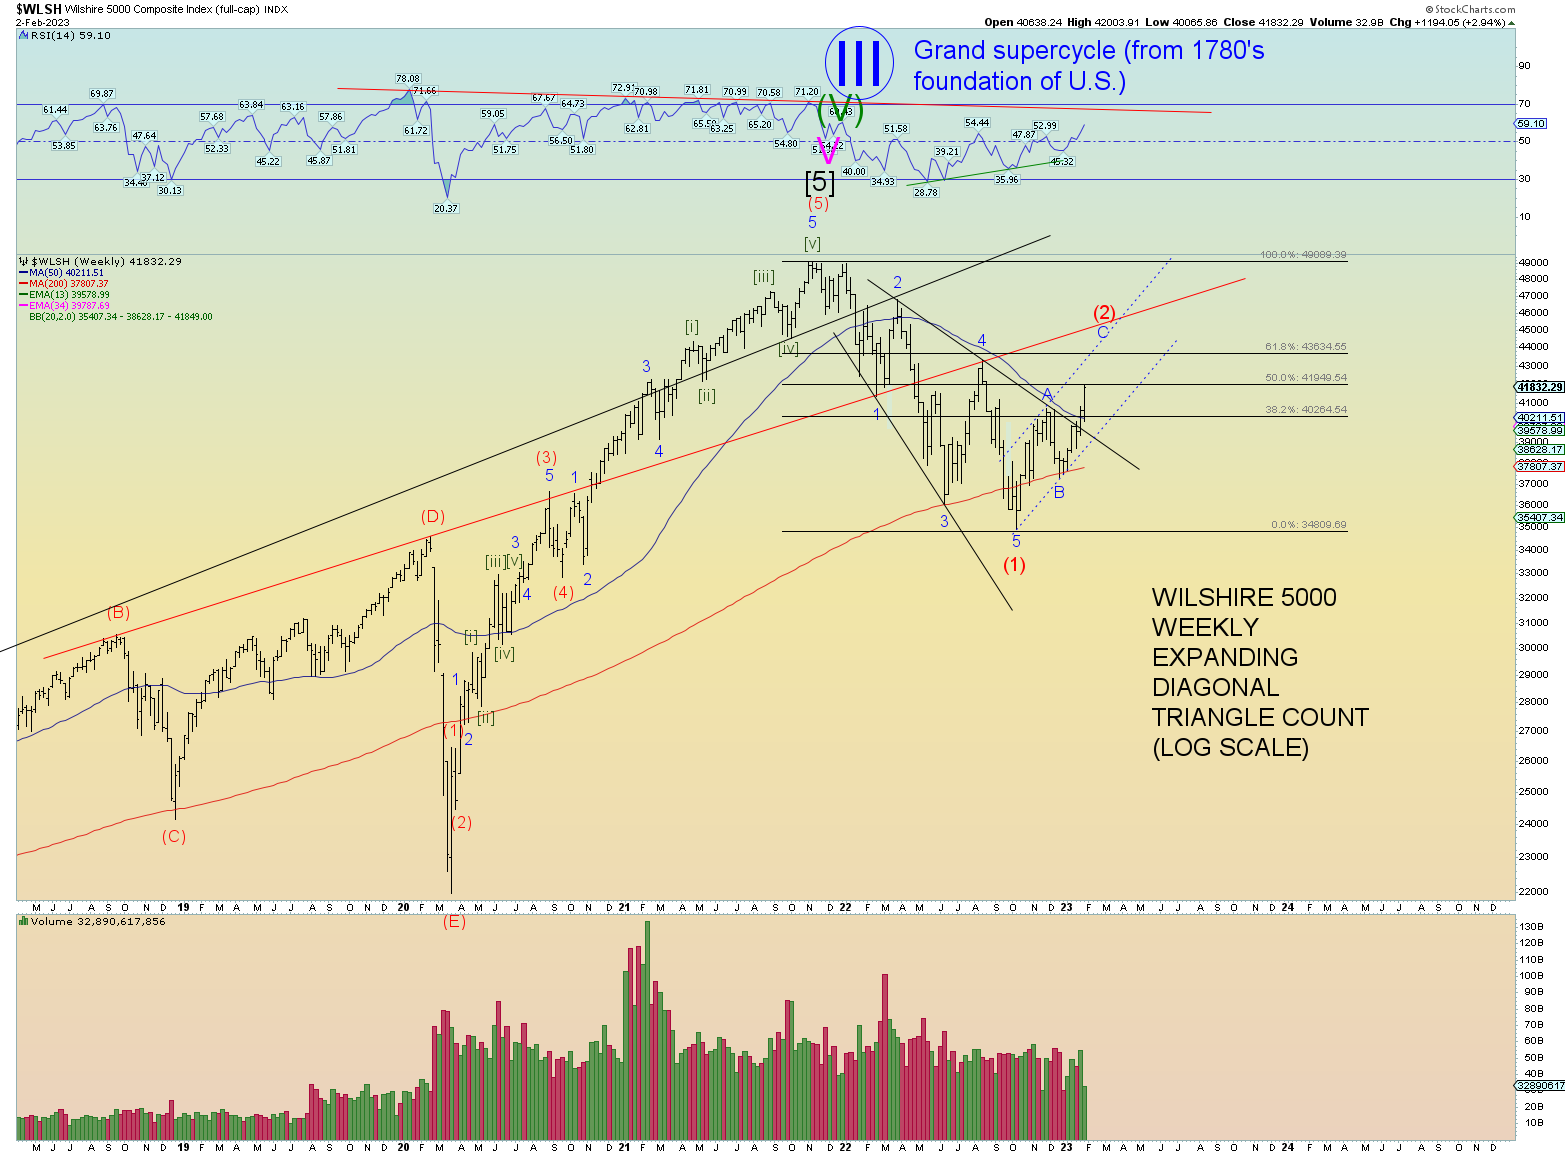
An idealized wave count and structure shown below. The Wilshire settled at the October 2022 low at the major support of the early February 2020 peak wave (D) of [4].