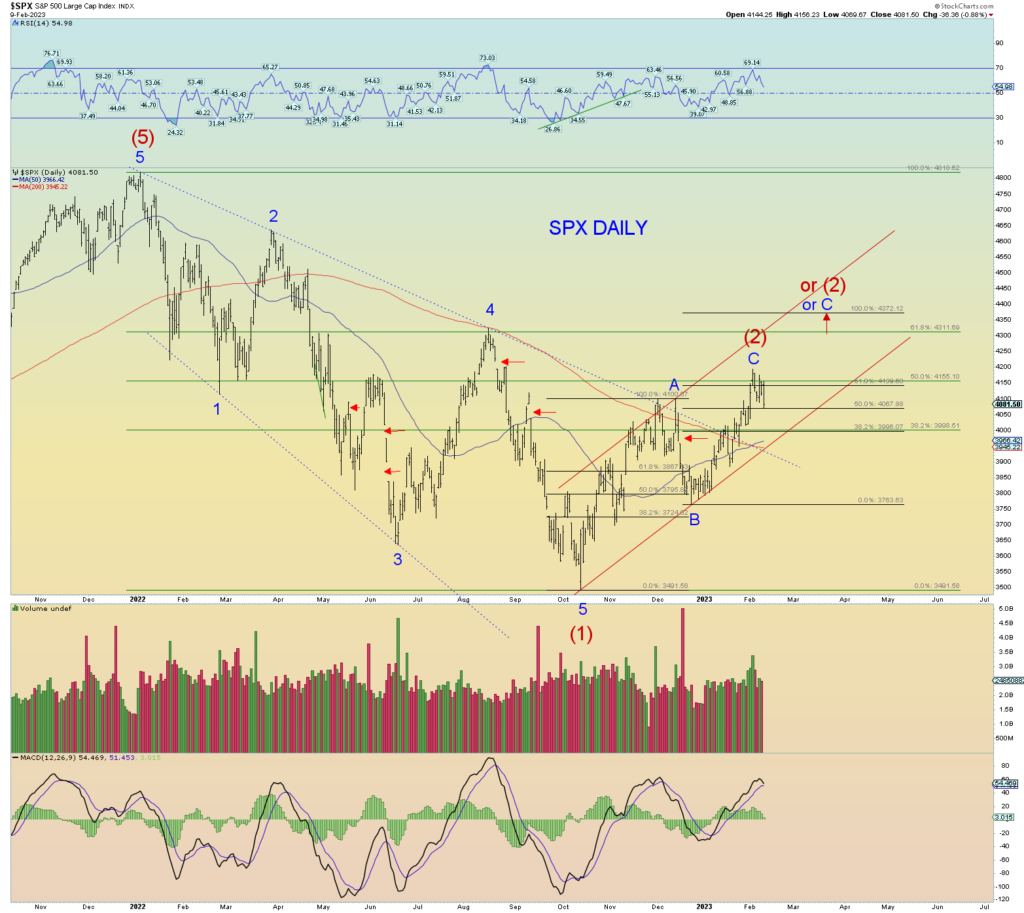
Again, things are looking shaky for the rally. We have solid overlap now of the key wave marker. The structure looks fine just as it is. 50% retrace and about 4 months time seems reasonable.
Prices are in the area where gap downs have occurred and remained open for a bit. The open gap at the top of 4 of (1) is still intact.
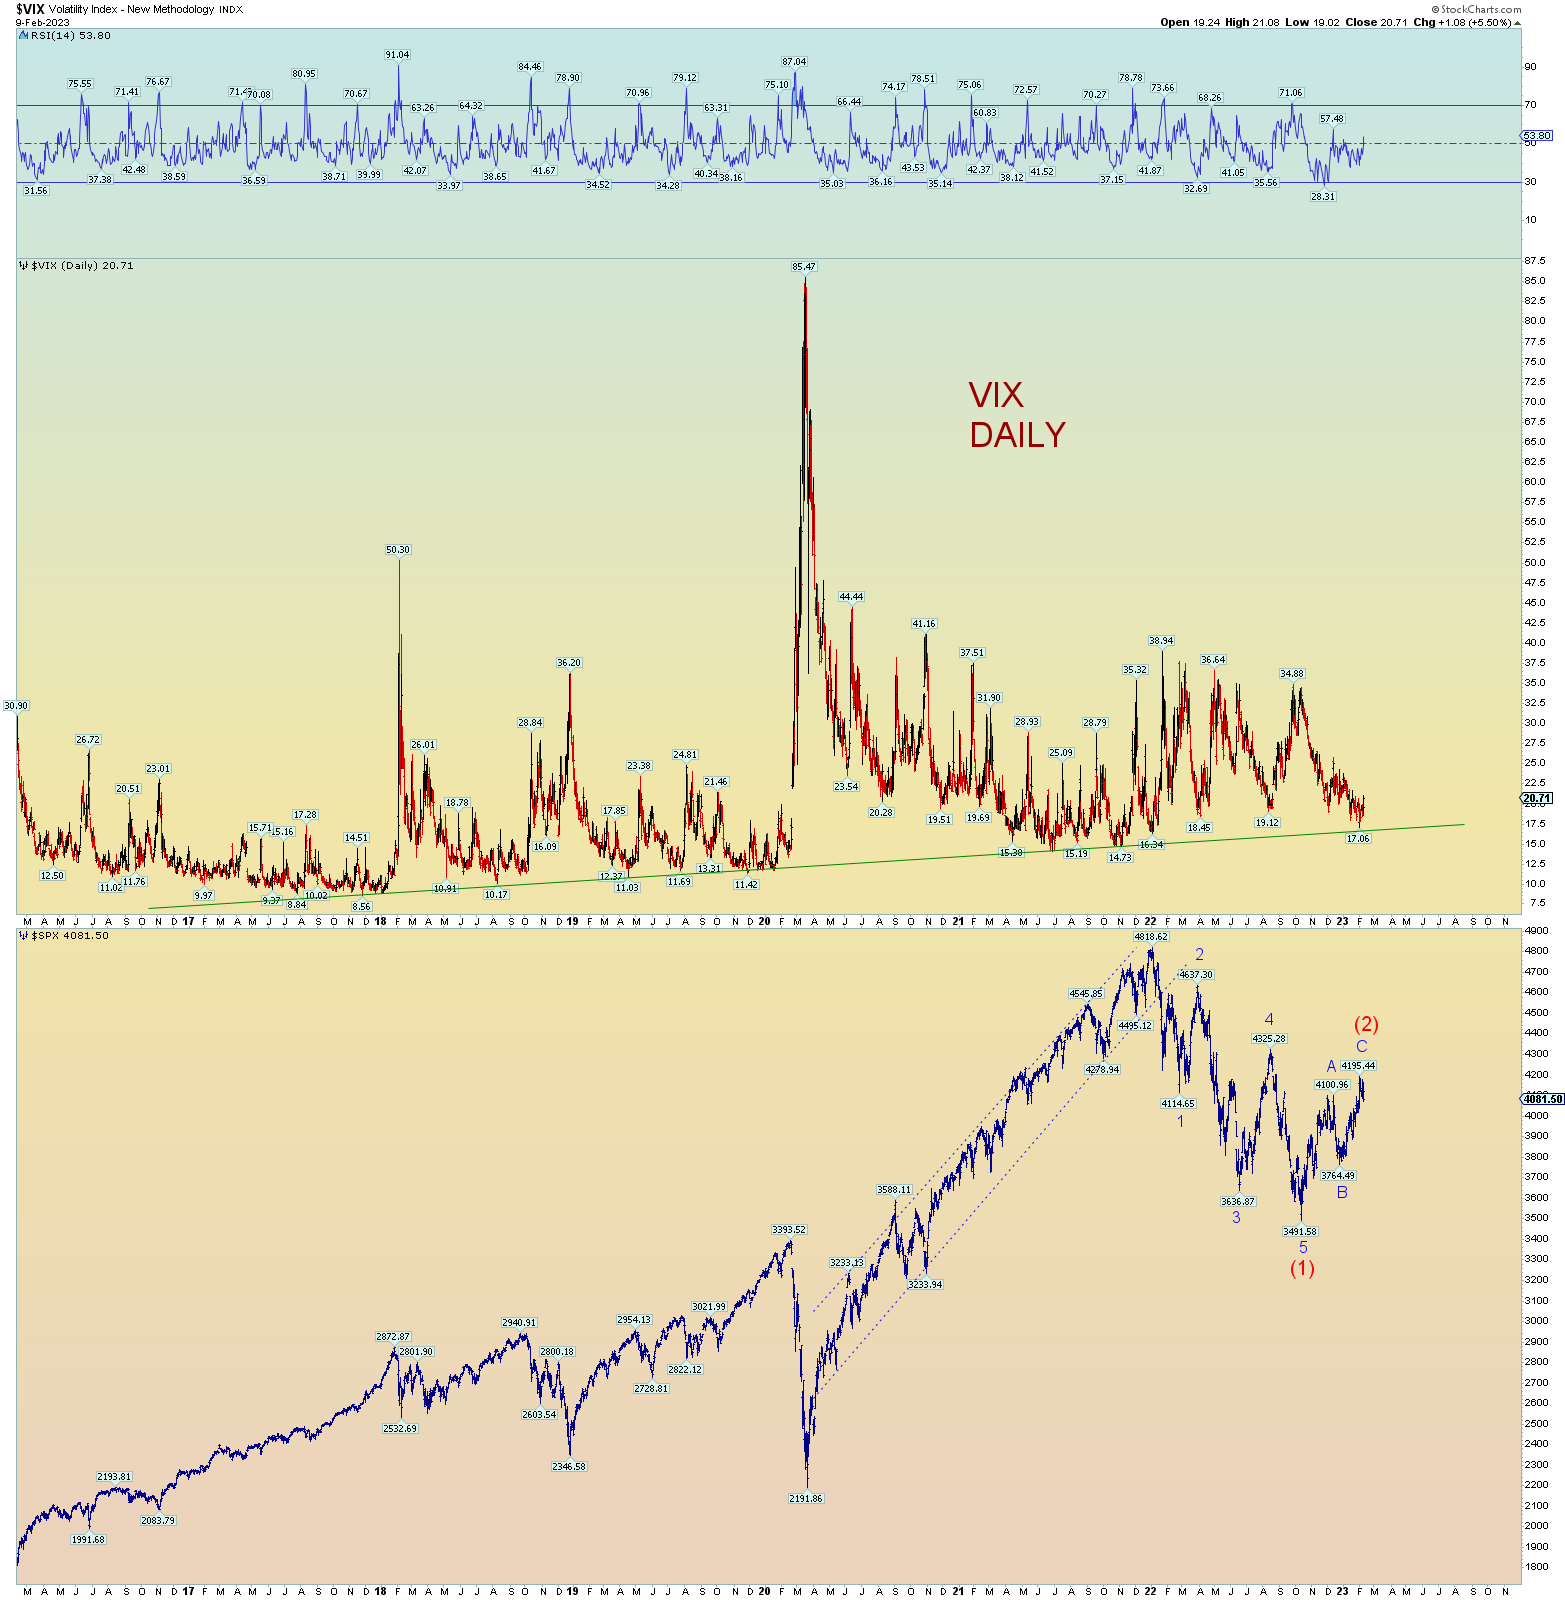
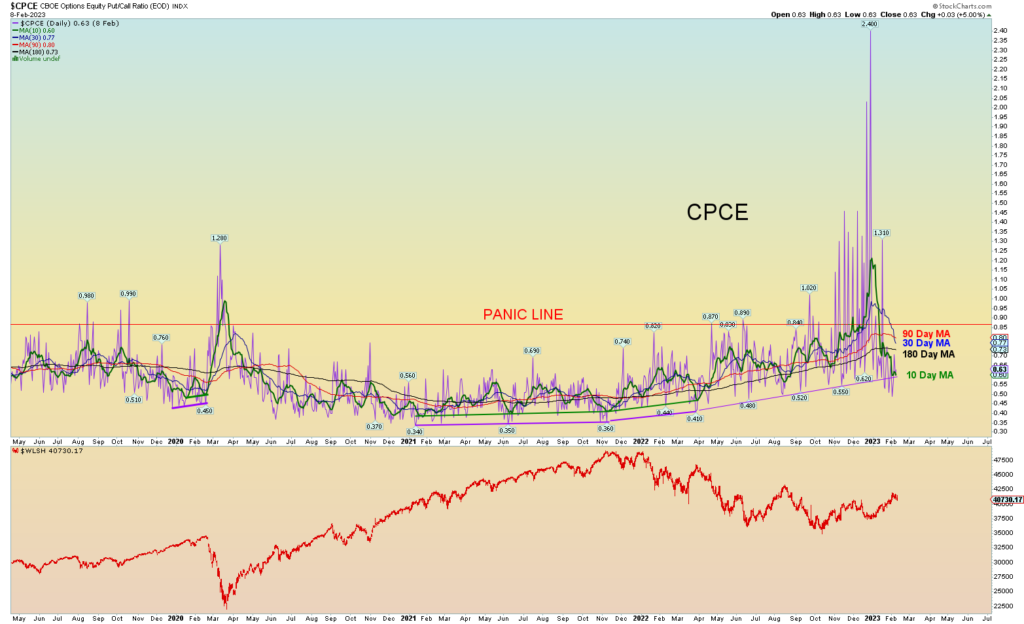
Both the VIX and the CPCE have flipped from bearishness to bullishness. Sentiment is again ripe for a market downturn.
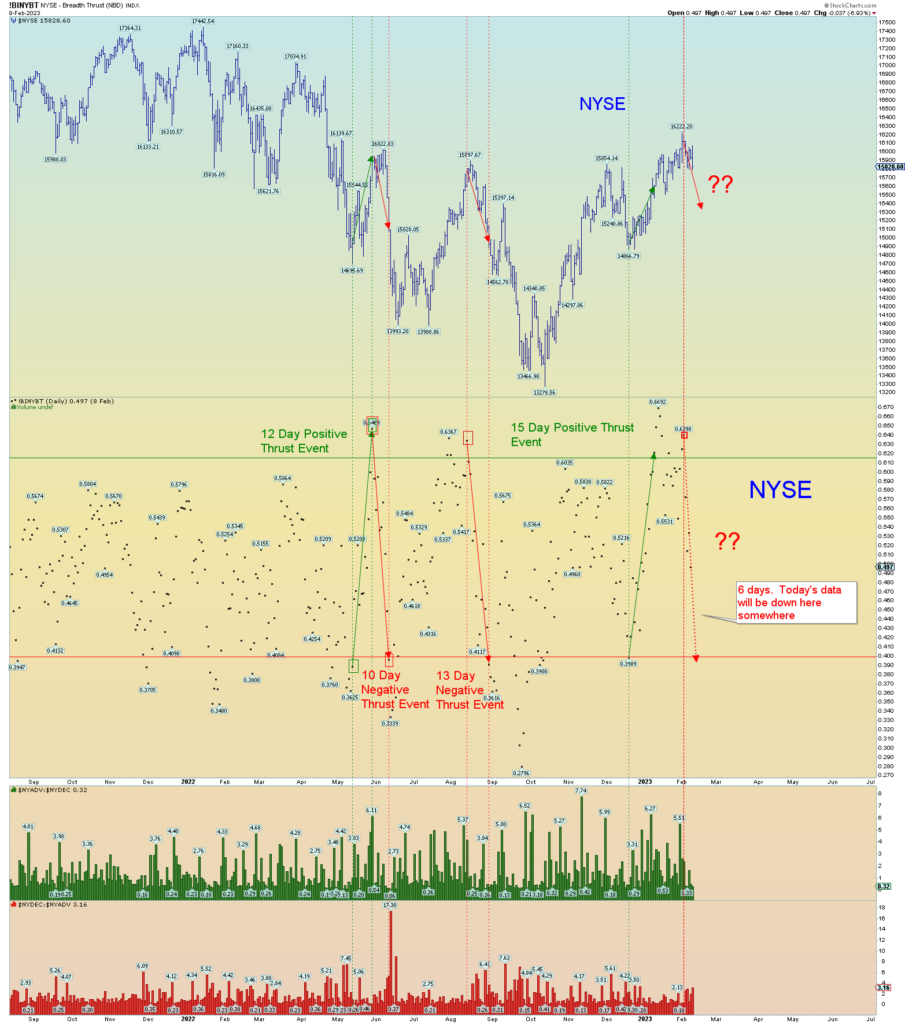
The NYSE shows a rapidly dropping loss of thrust. If we have one huge down day within the next 4 days, it may trigger another “negative breadth thrust” scenario. And after these scenarios trigger, you can see more selling of significance occurs. We had 2 marginal positive events, but prices advanced not so much.
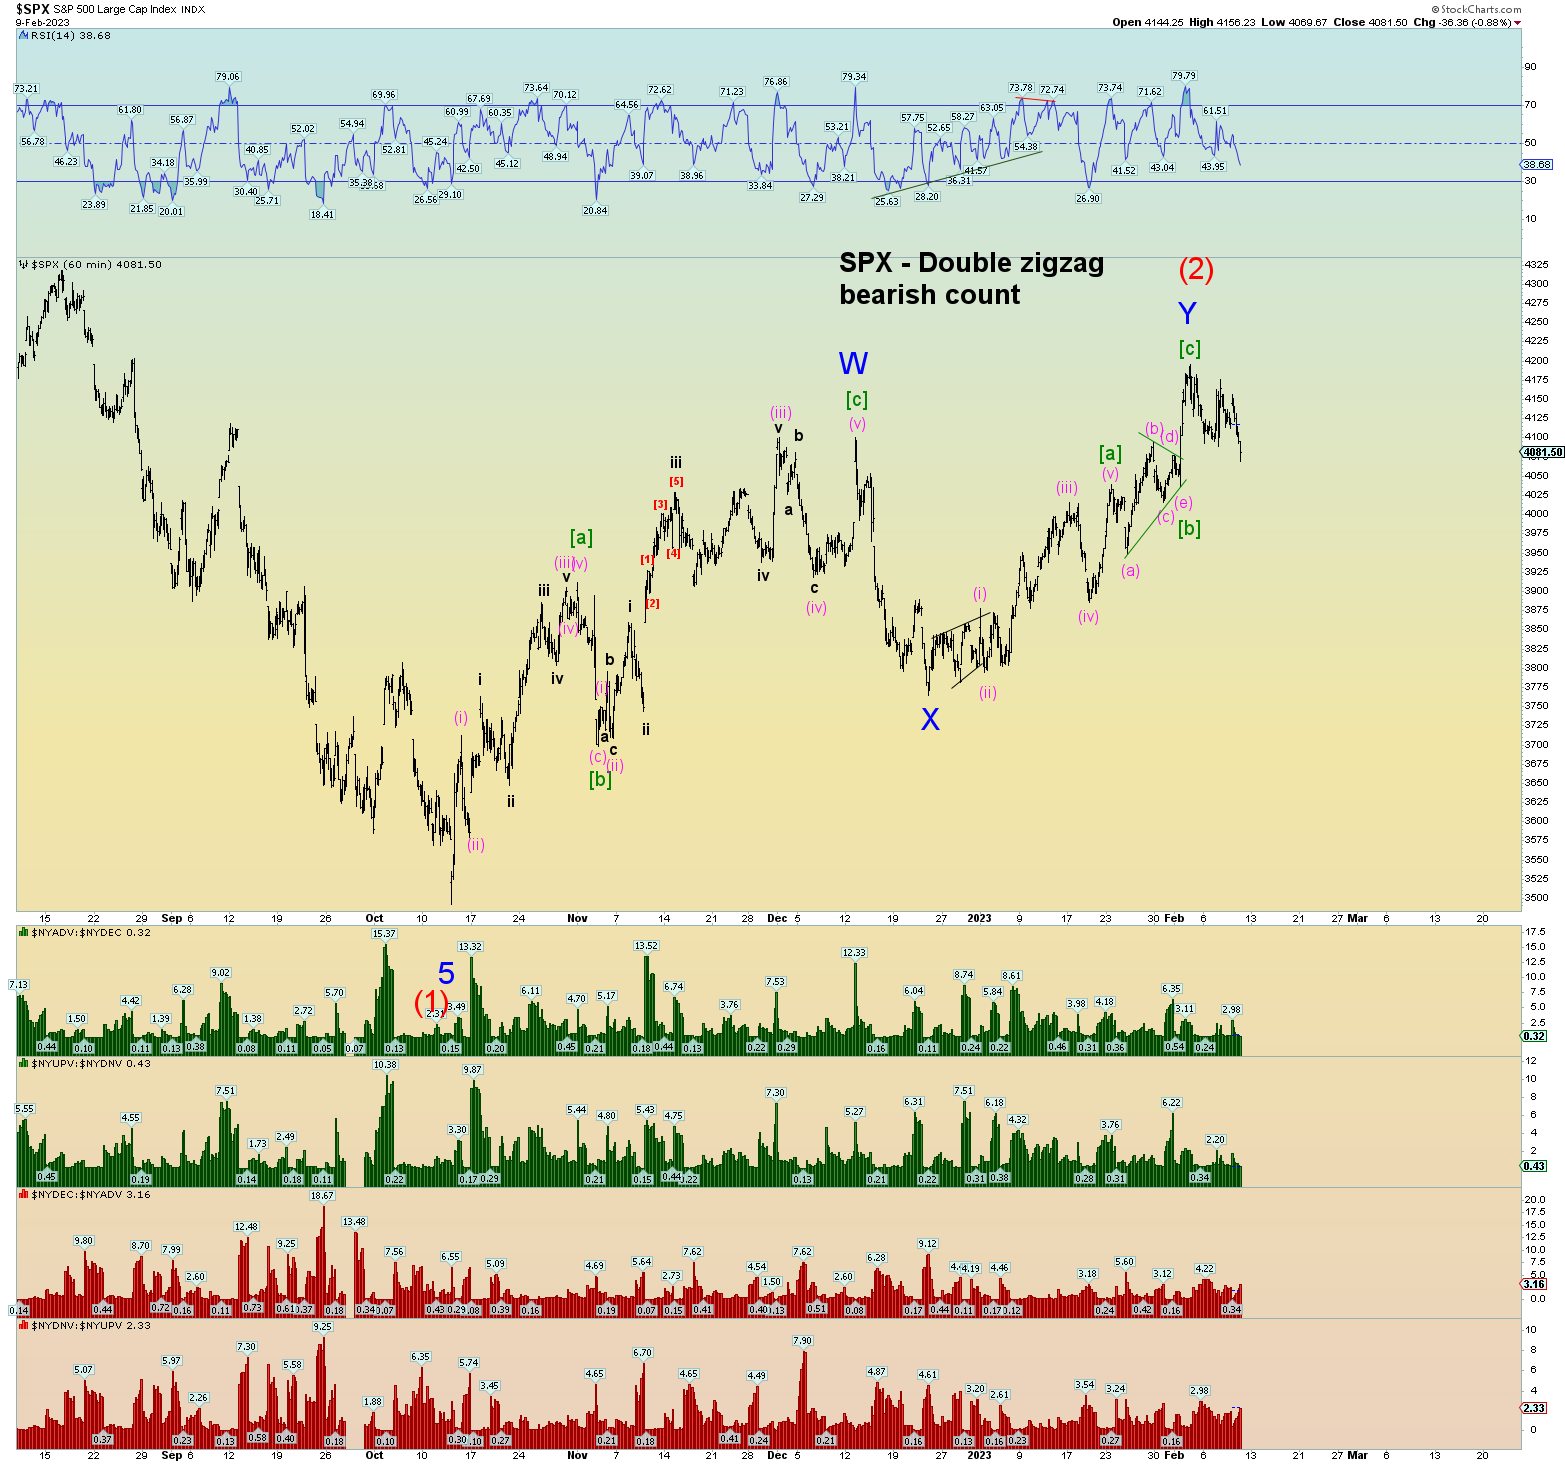
Playing around with squiggle counts if wave C has indeed topped. Double zigzag would fit best.