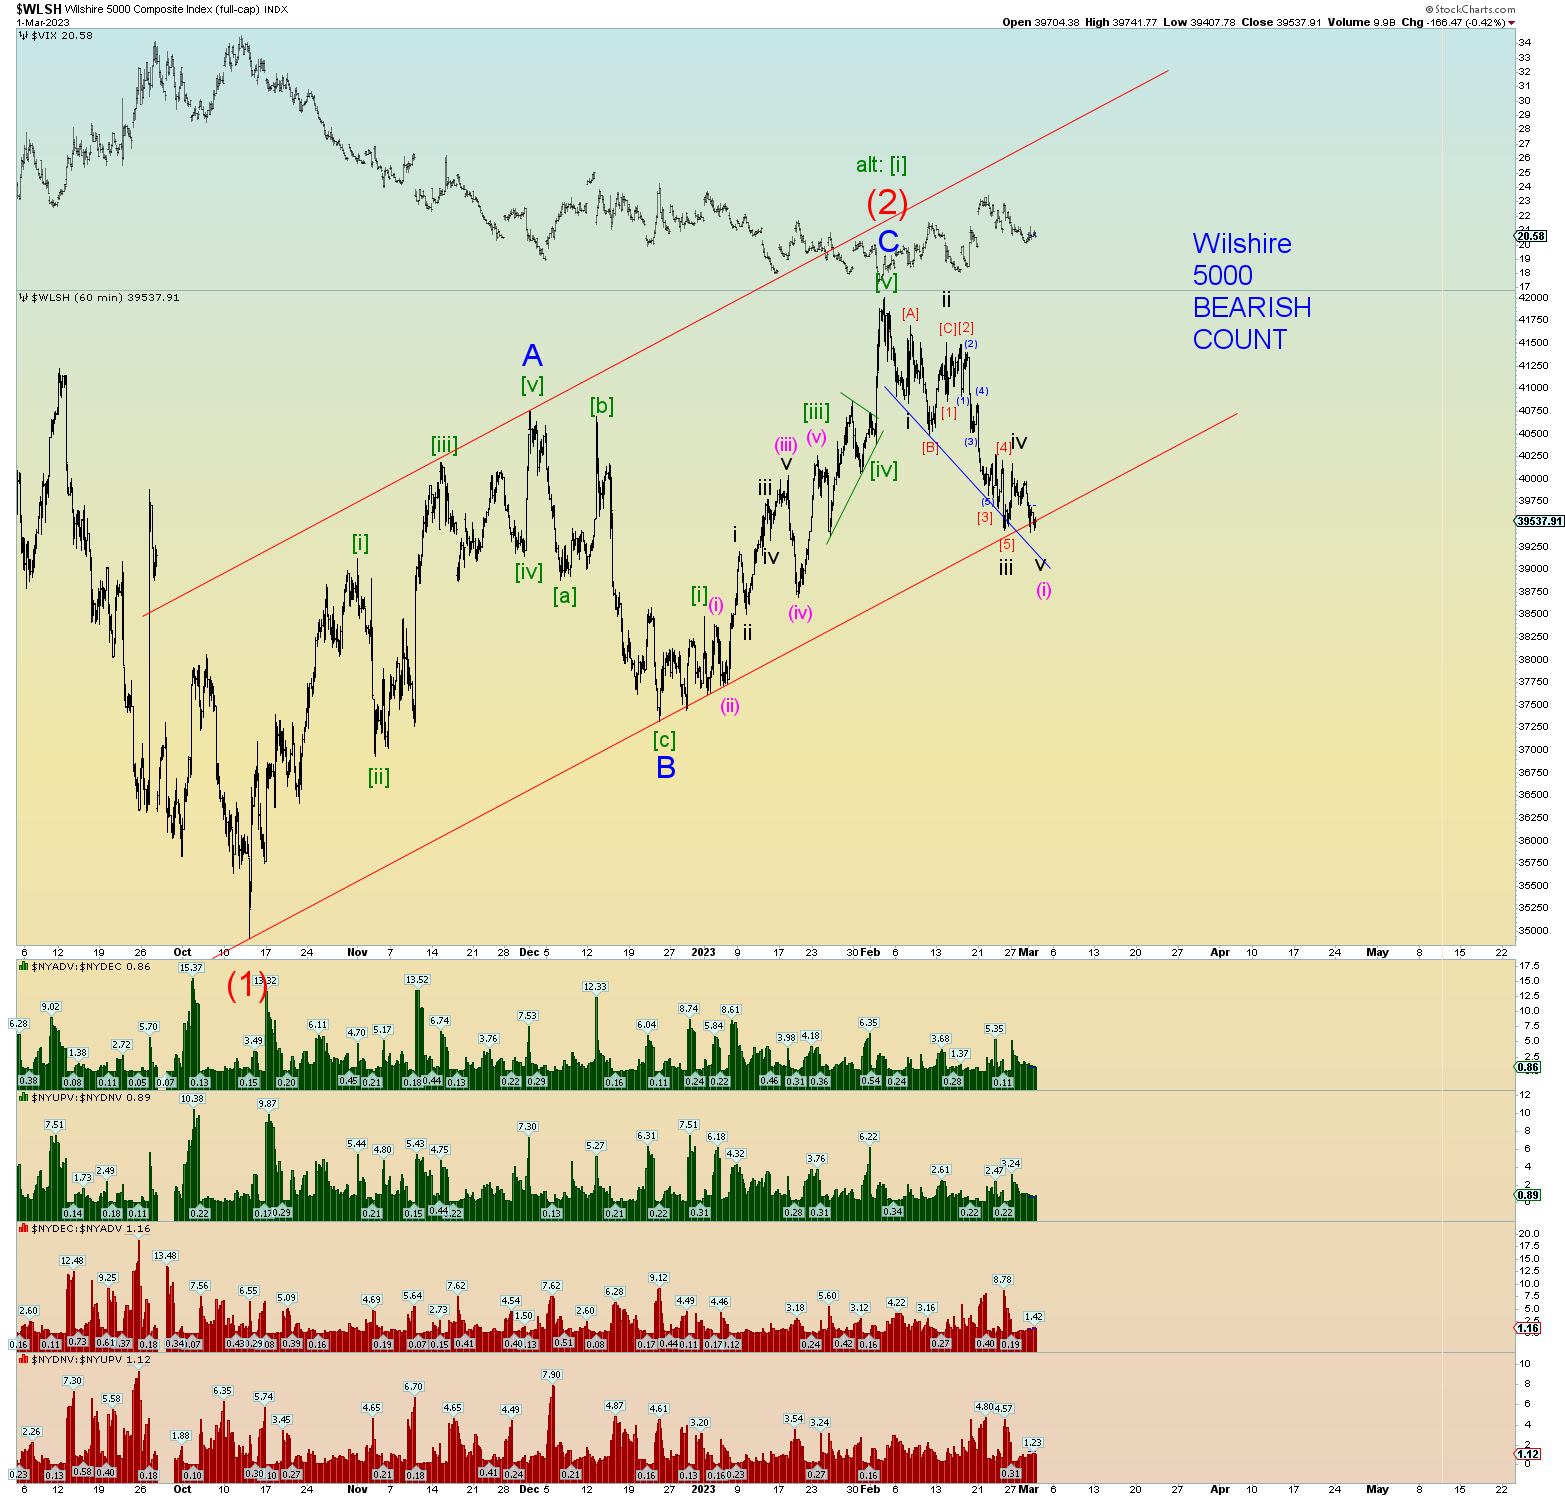
That’s more like it! We have what looks best as an impulse structure down which is a clue that the market “correction” upwards to (2) was over at the recent peak.
Note that the Wilshire also had a seemingly 5 wave structure down from A to B, but the SPX had made a different high than A. That is not the case now.