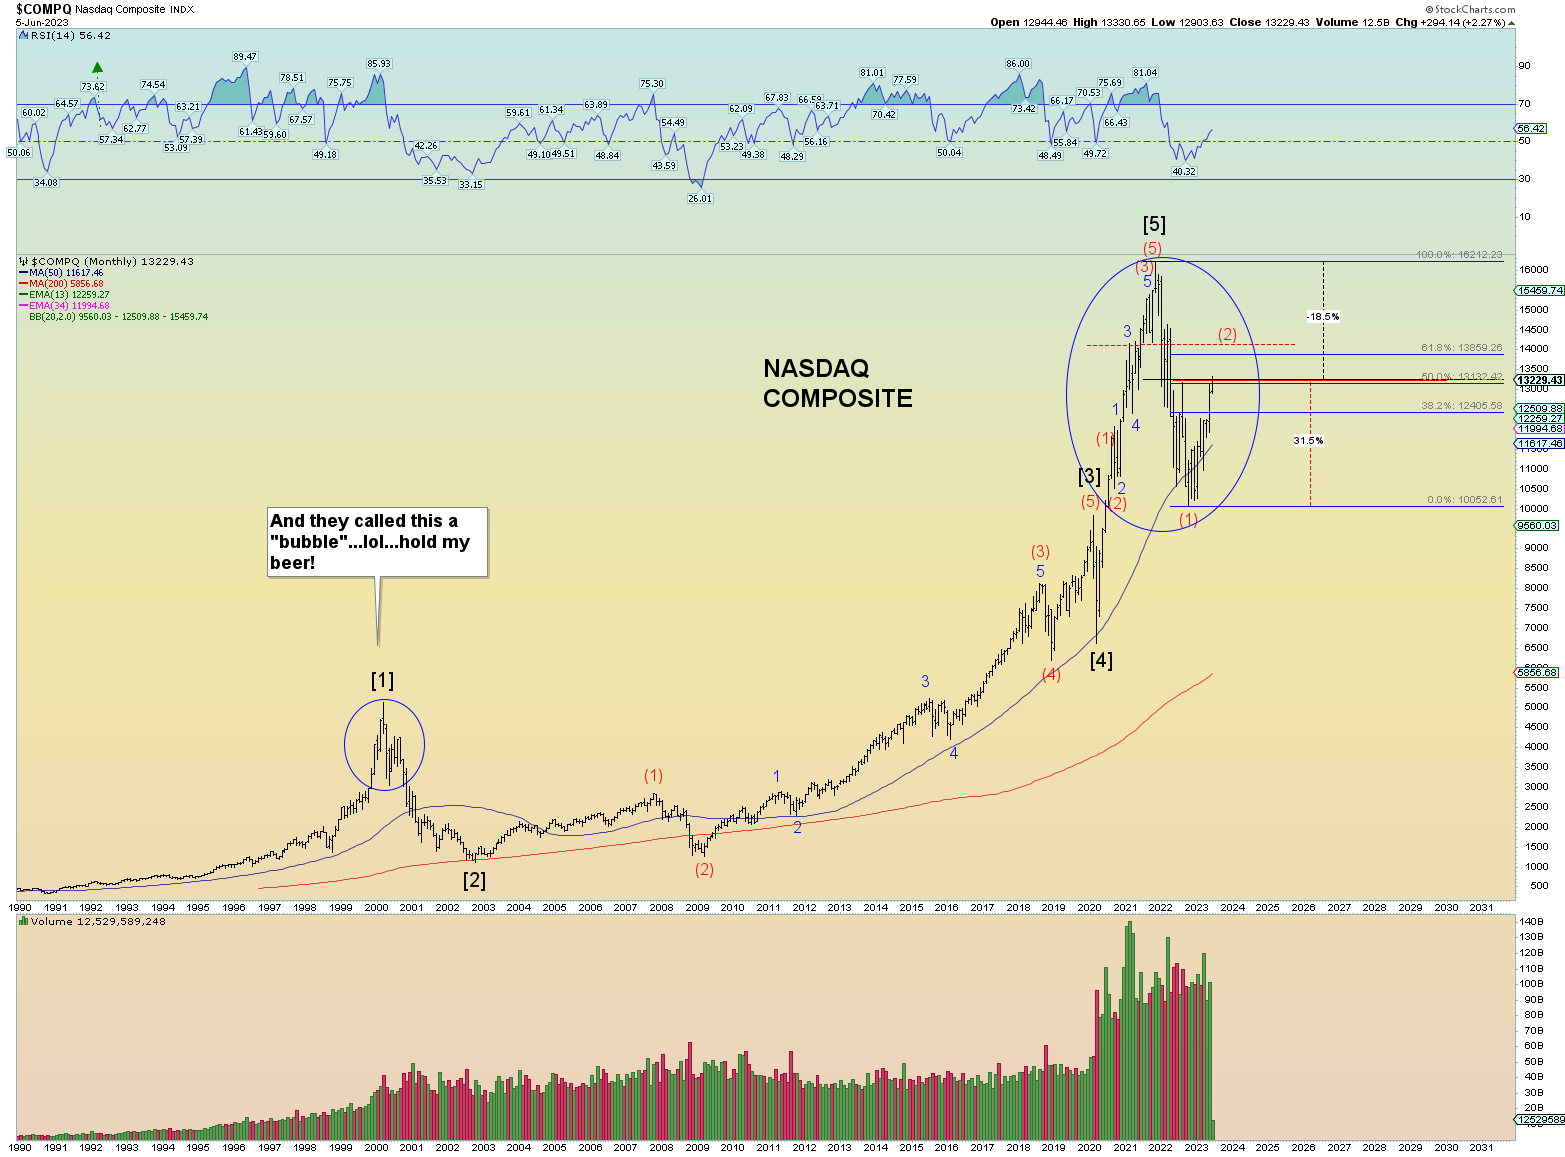
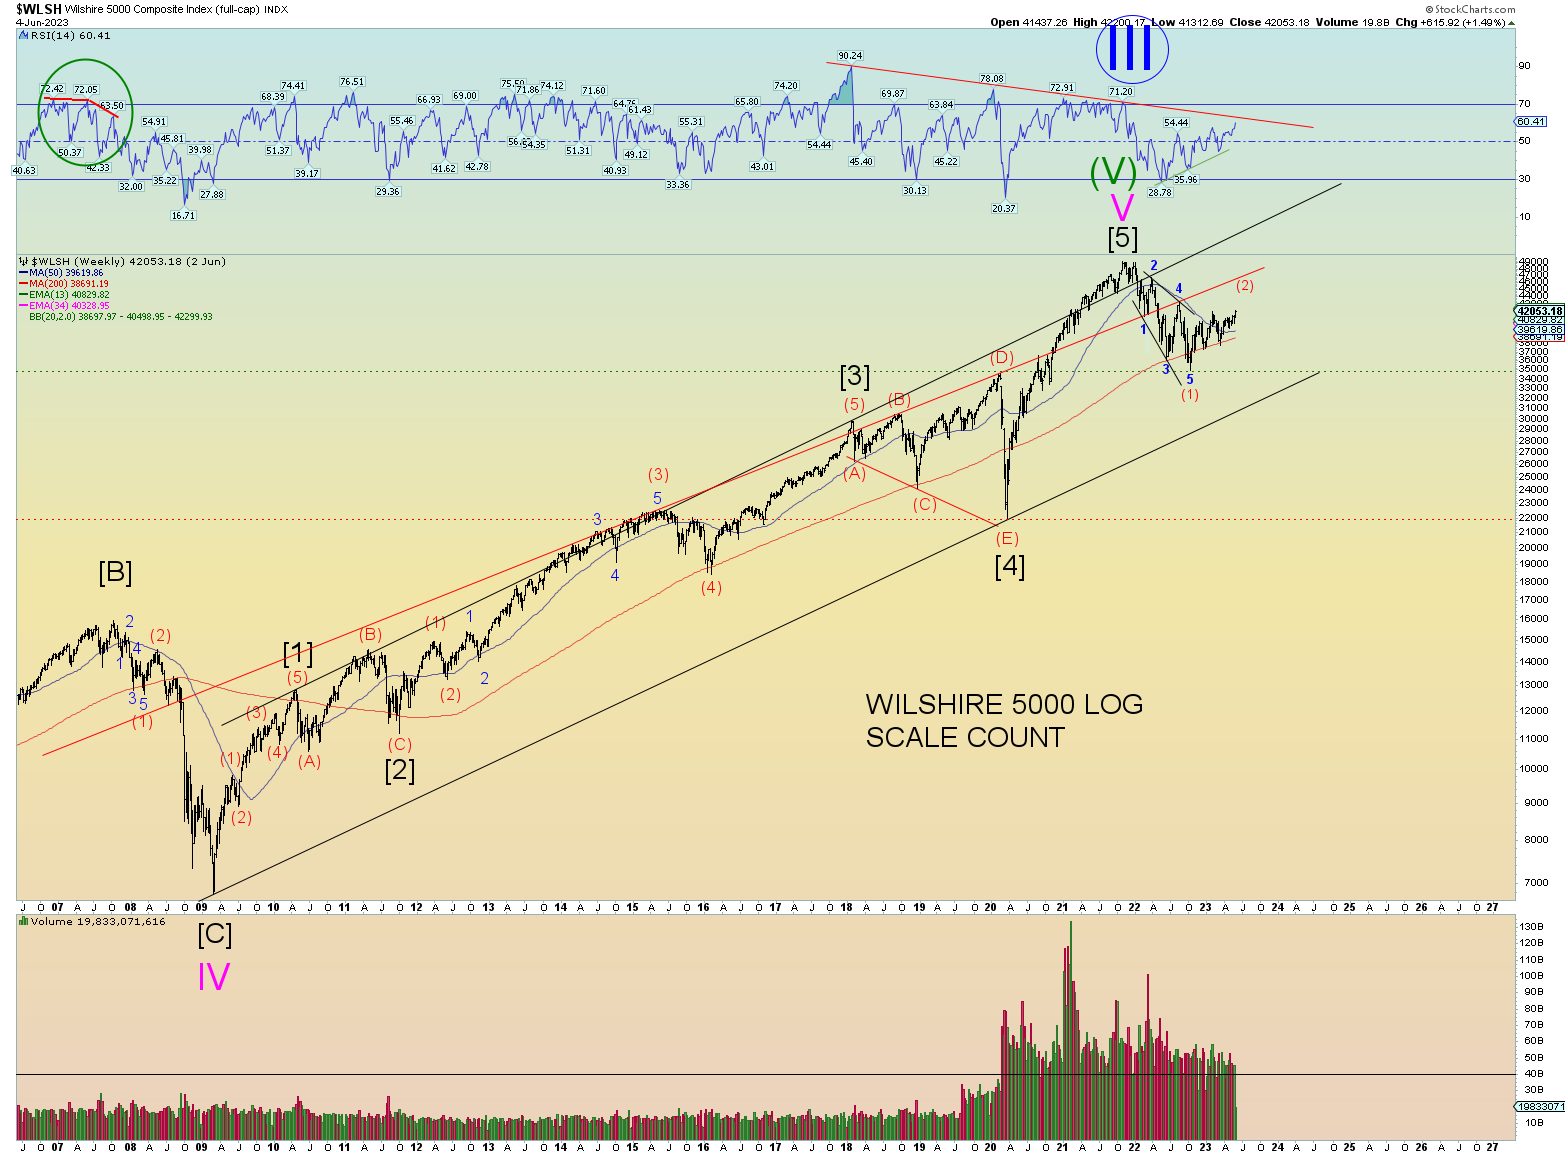
Stockcharts Wilshire 5000 hasn’t printed since its misprint 3 trading days ago. I’m for the most part form here on out going to use only the S&P500 as the primary chart because the Wilshire 5000 in Stockcharts has too many misprints over the last 18 months anyway.
A close under 4200 would be bearish for the wave count.
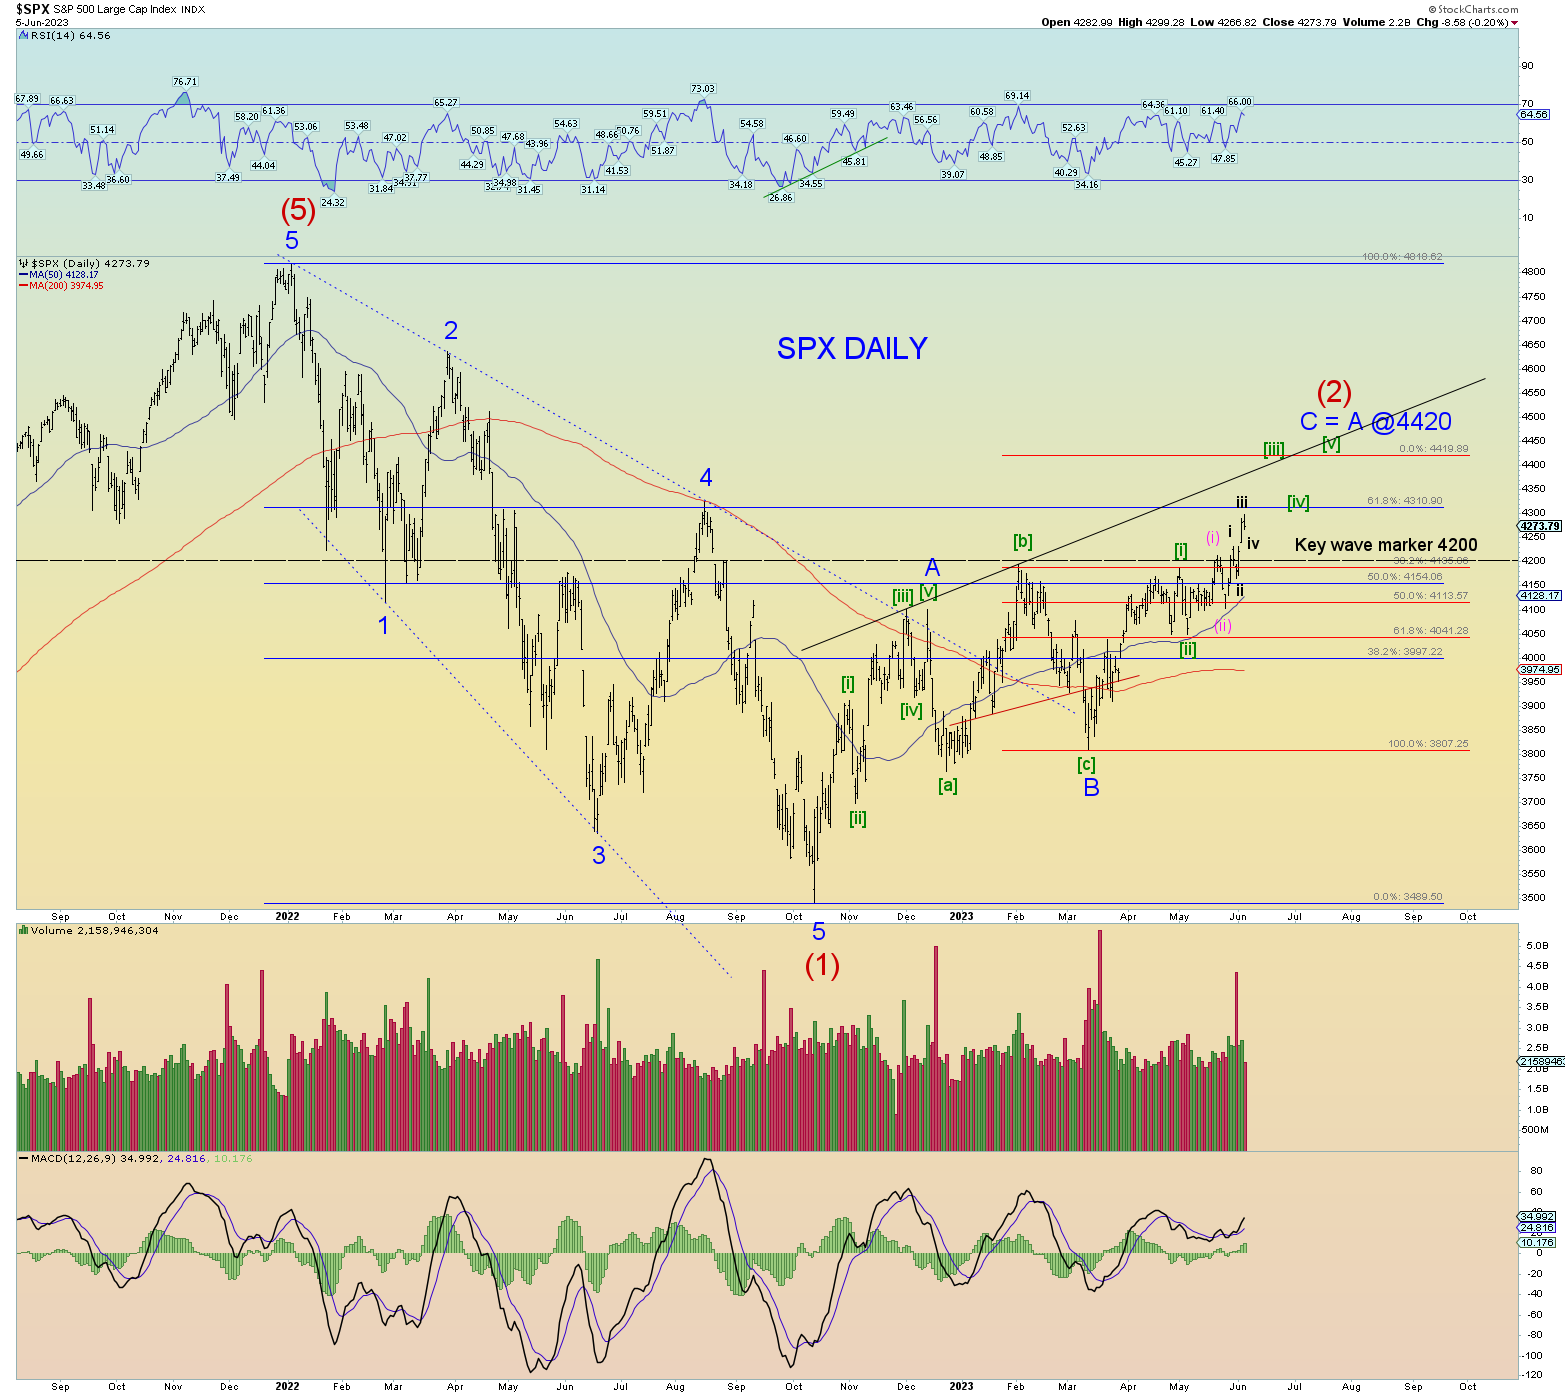
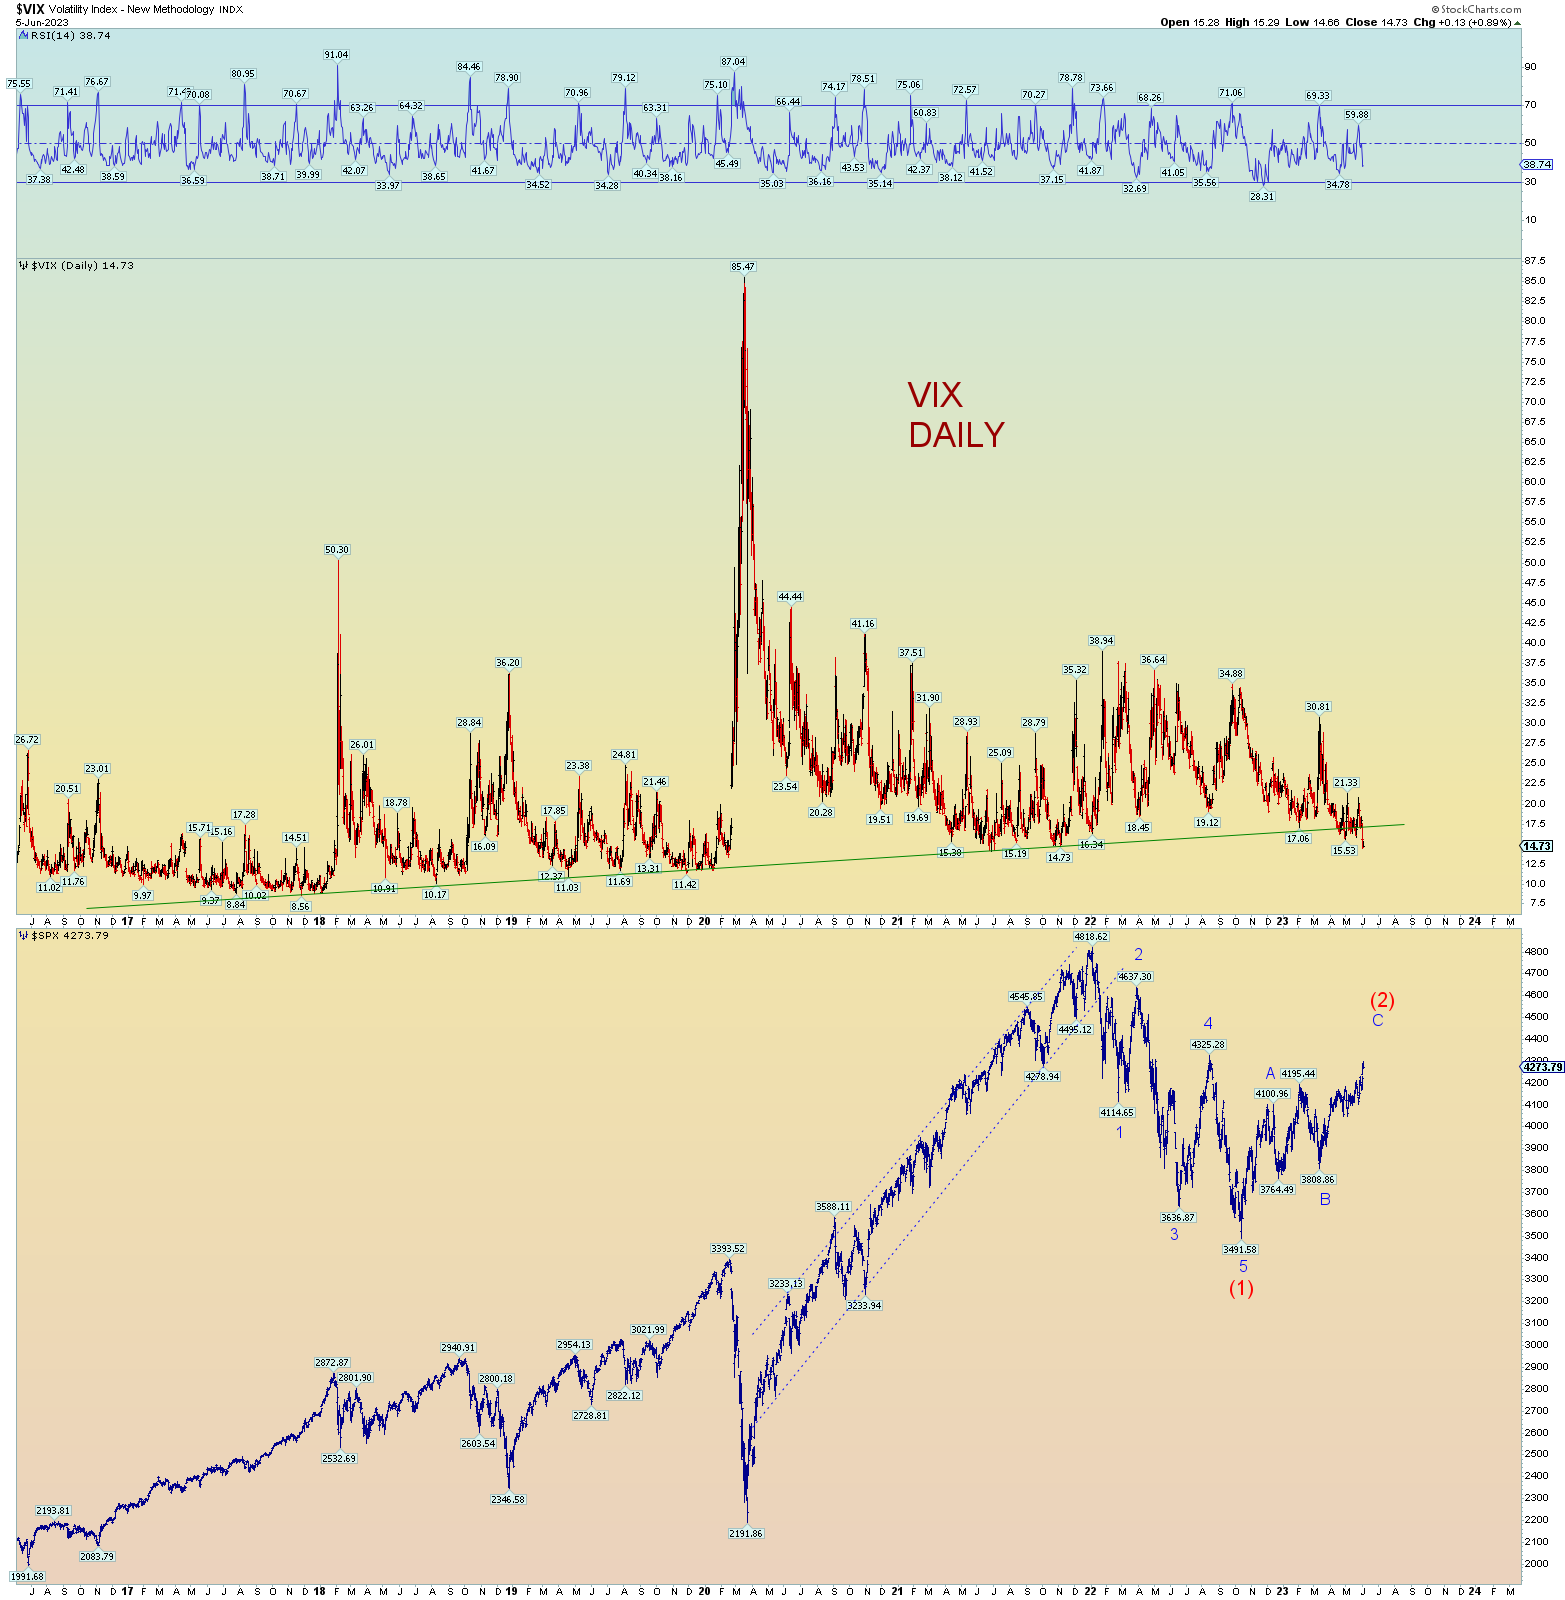
Wave (2). Seems normal. Overhead resistance lies above.