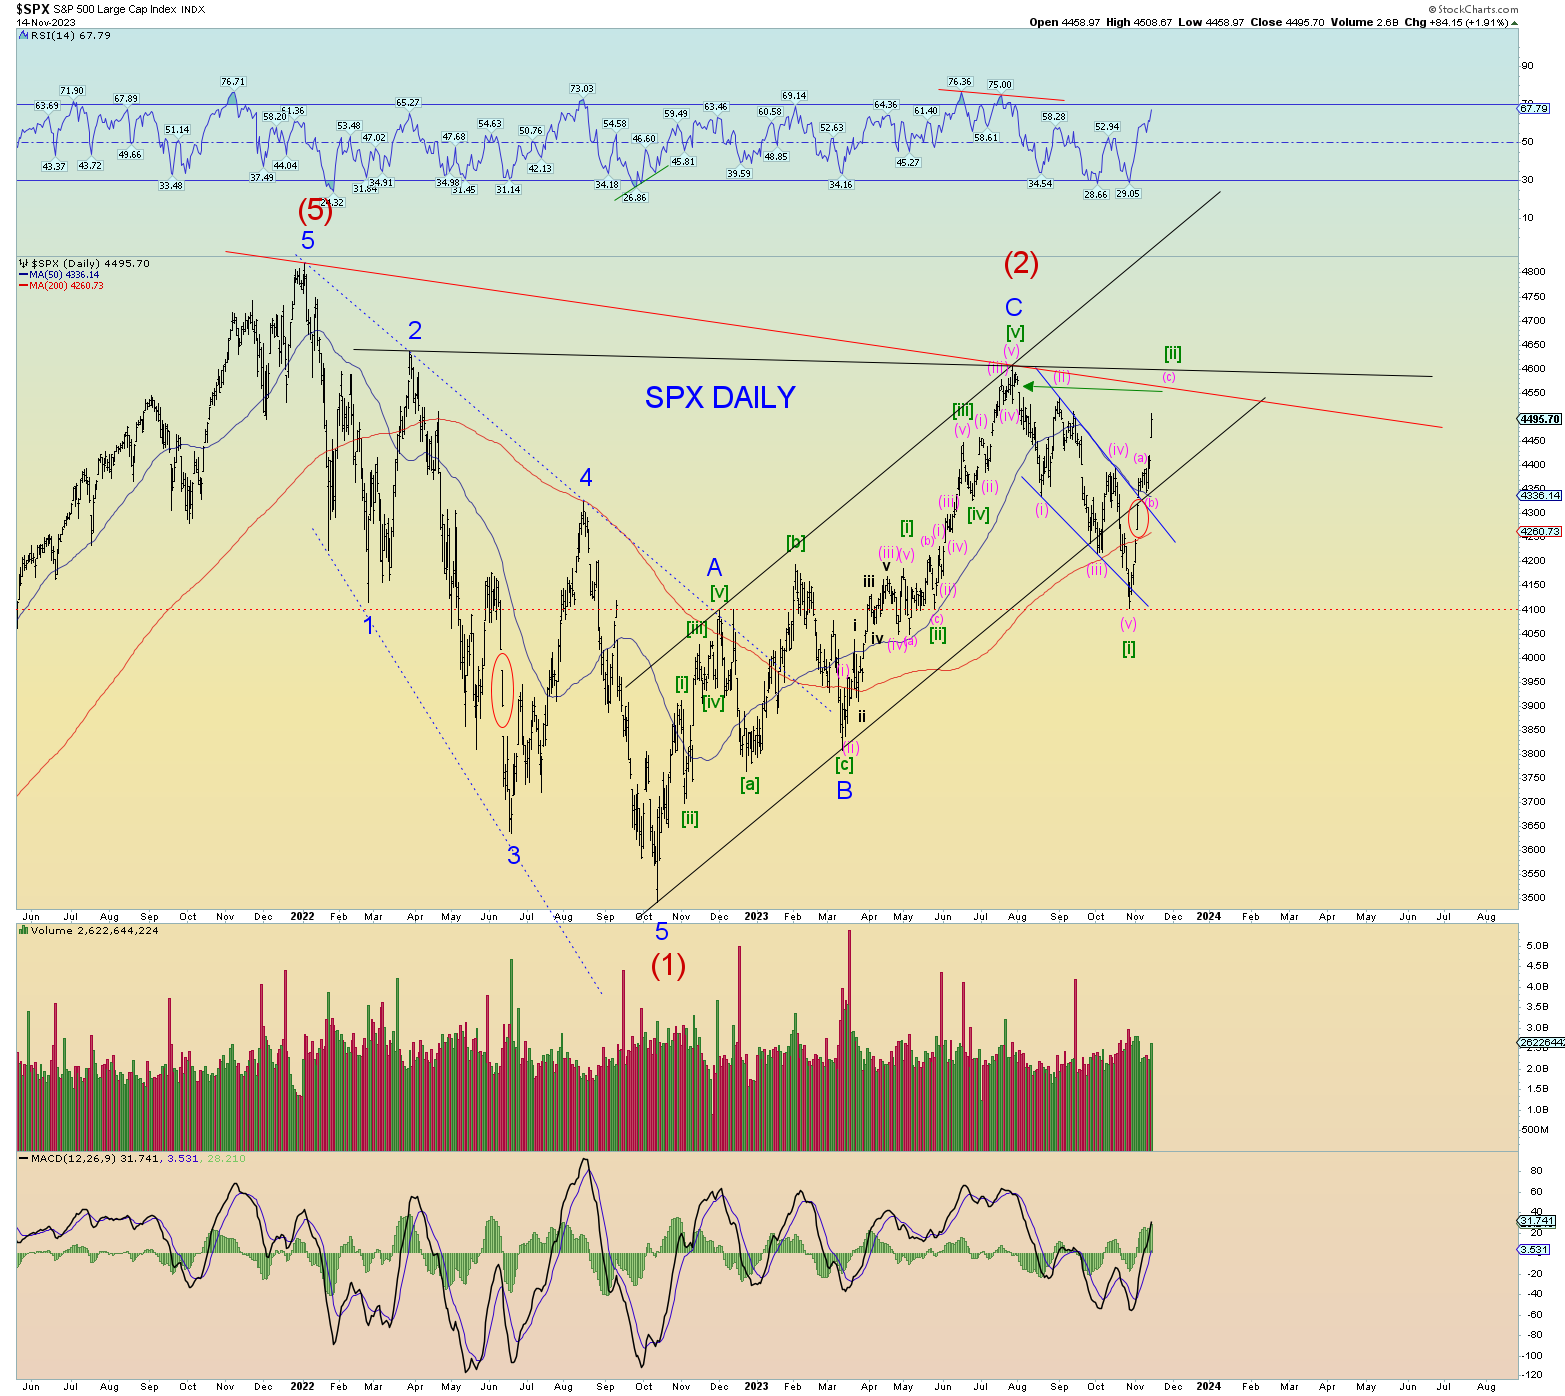
It seems the market is taking a run at the small open chart gap at the top near Intermediate wave (2) peak. The downtrend line is a potential stopping point. If wave (2) is taken out, then arguably a 5 wave move from October 2022 low has occurred and likely the market will make a stab at a new all-time high between now and February 2024.
But first things first. Just a ridiculous massive open chart gap up today.
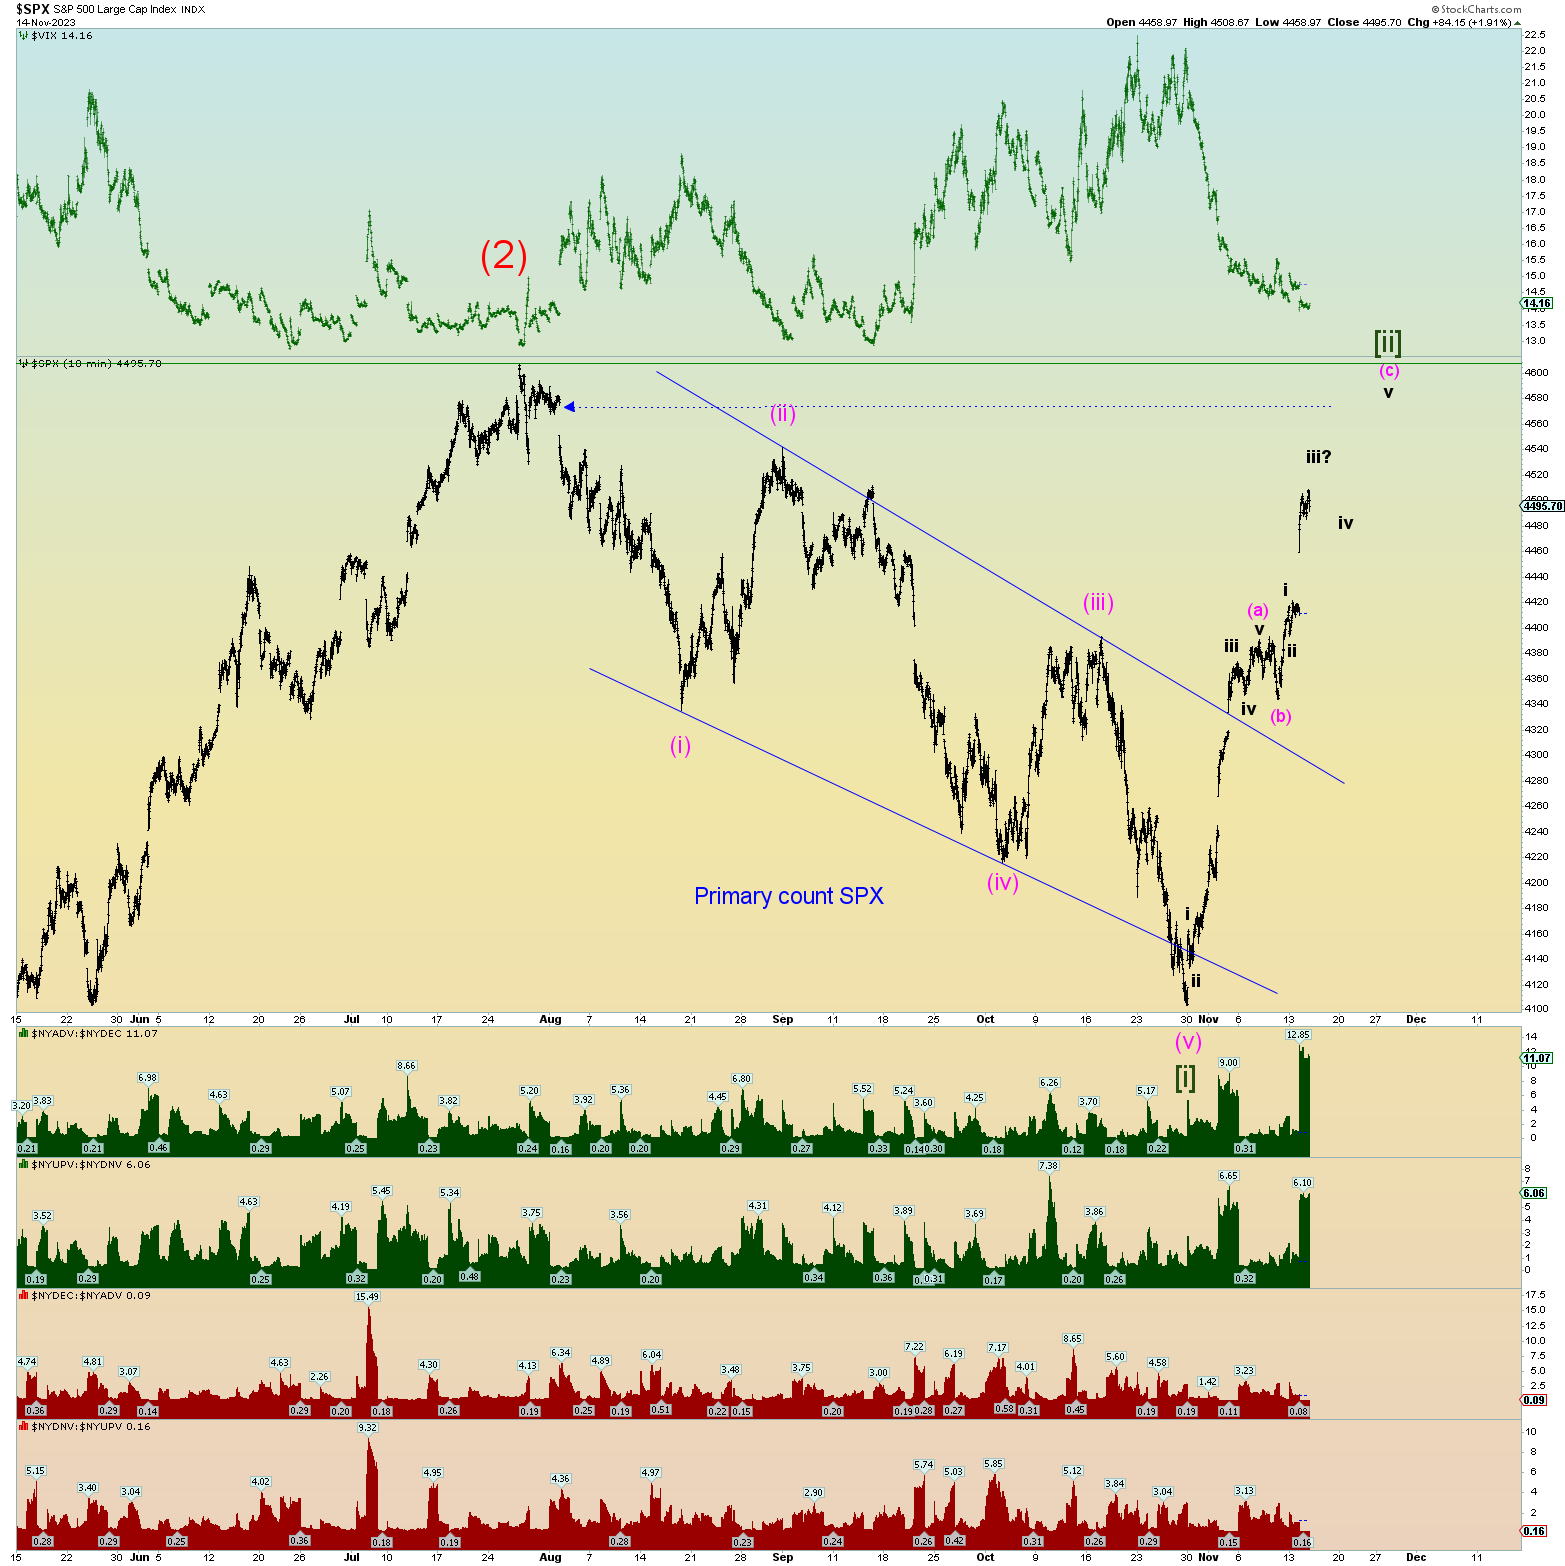
Best squiggle count is that we are looking for the peak of wave iii of (c) of [ii].