The count is very good. This Elliott wave structure has many good things going for it:
- (Red = Intermediate) Waves (1) to (5) and (2) to (4) perfectly connect on a very precise parallel channel trendline(s).
- The subwaves are all there.
- Wave (5) seemingly ends in an ending diagonal triangle (EDT).
- The “proof” of the ending triangle is that prices collapsed to beyond the starting point of the EDT. That occurred today.
- Corrective waves (2) and (4) alternate in form. Flat vs. zigzag. This is a good EW structure trait.
- Peak RSI on the medium and long-term charts is where we expect it to be; at the subwave 3 of 3 or wave 3 in general with declining RSI strength as the wave structure advances to peak.
- Prices bounced perfectly at the long term lower trendline. This could be the wave 1 down low. We shall see if a significant bounce occurs. It would be the logical spot.
- Additionally, prices reached a significant horizontal support line. A logical bounce spot.
All in all, a very nice structure. And we are going with it!
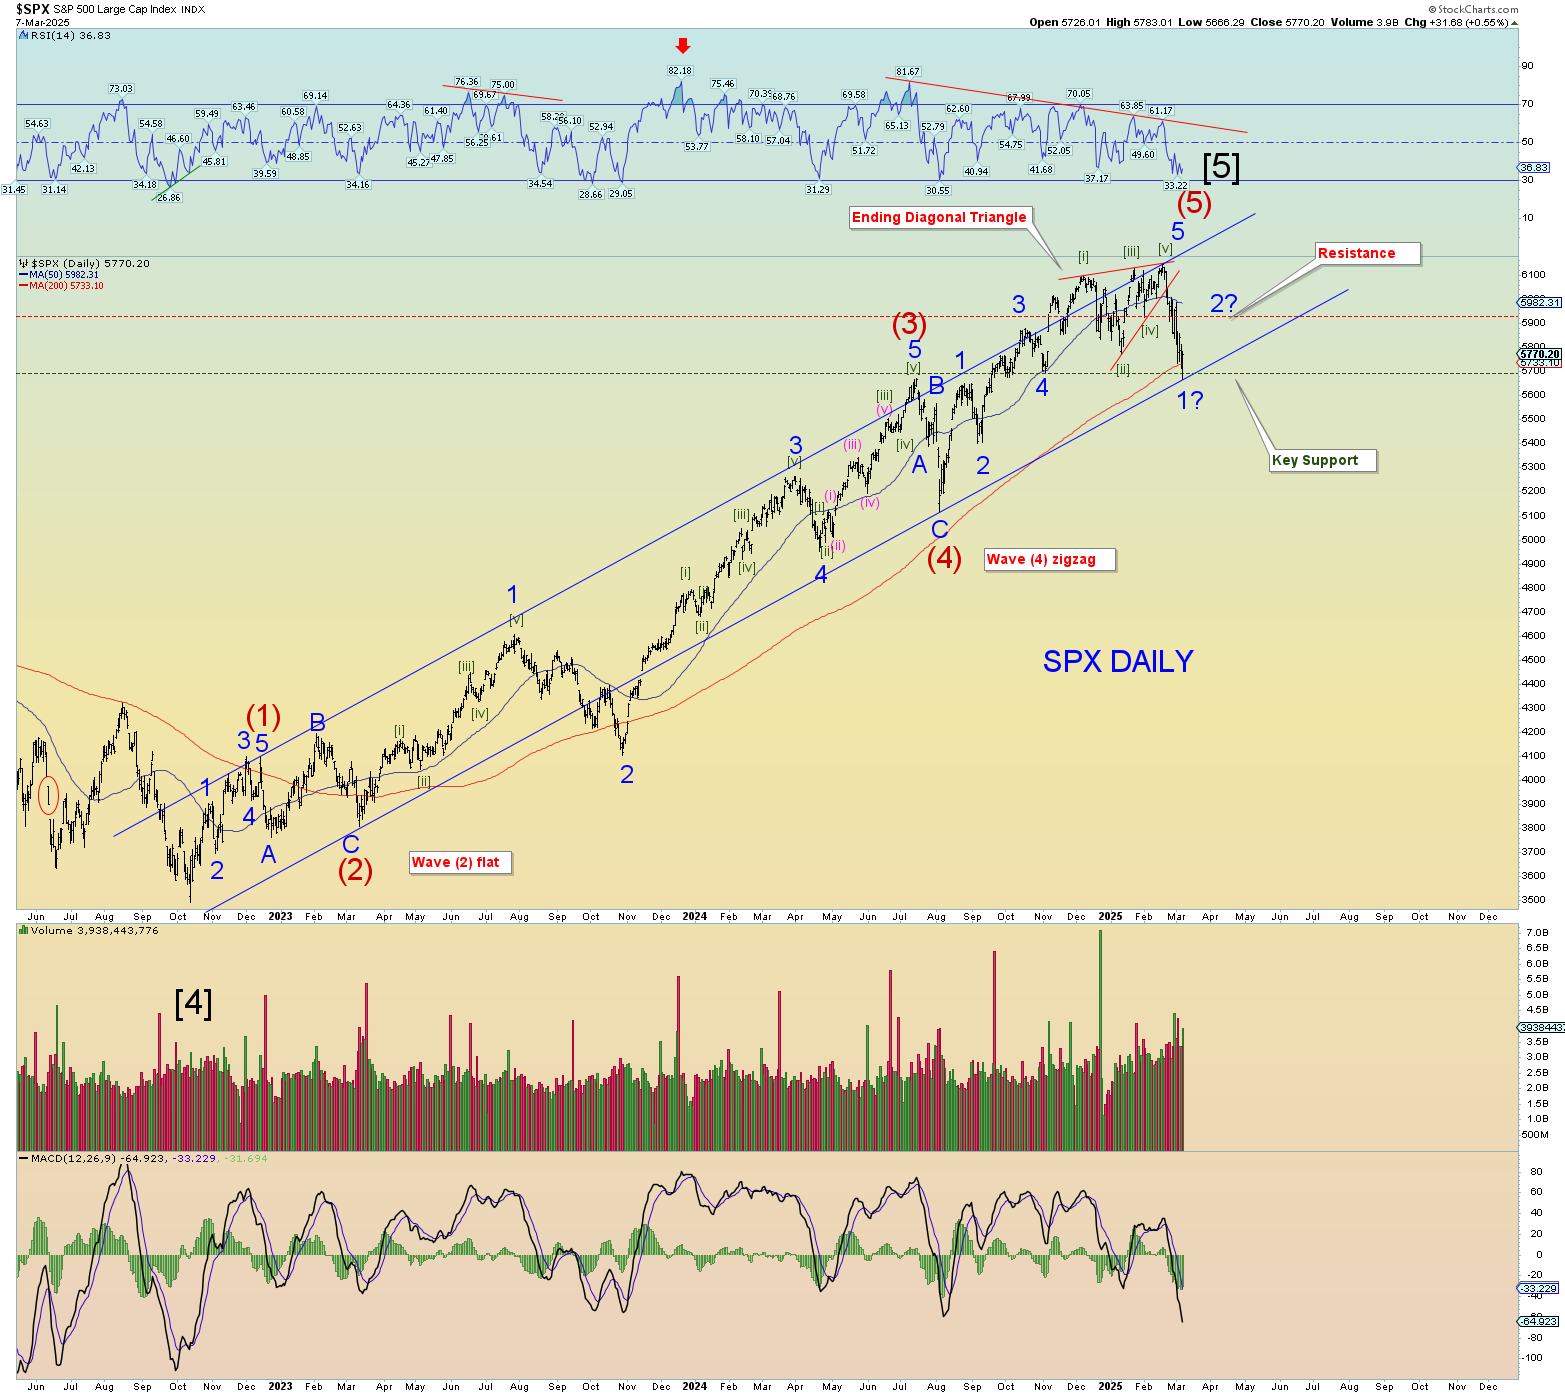
Long term count:

Squiggle count seems OK.
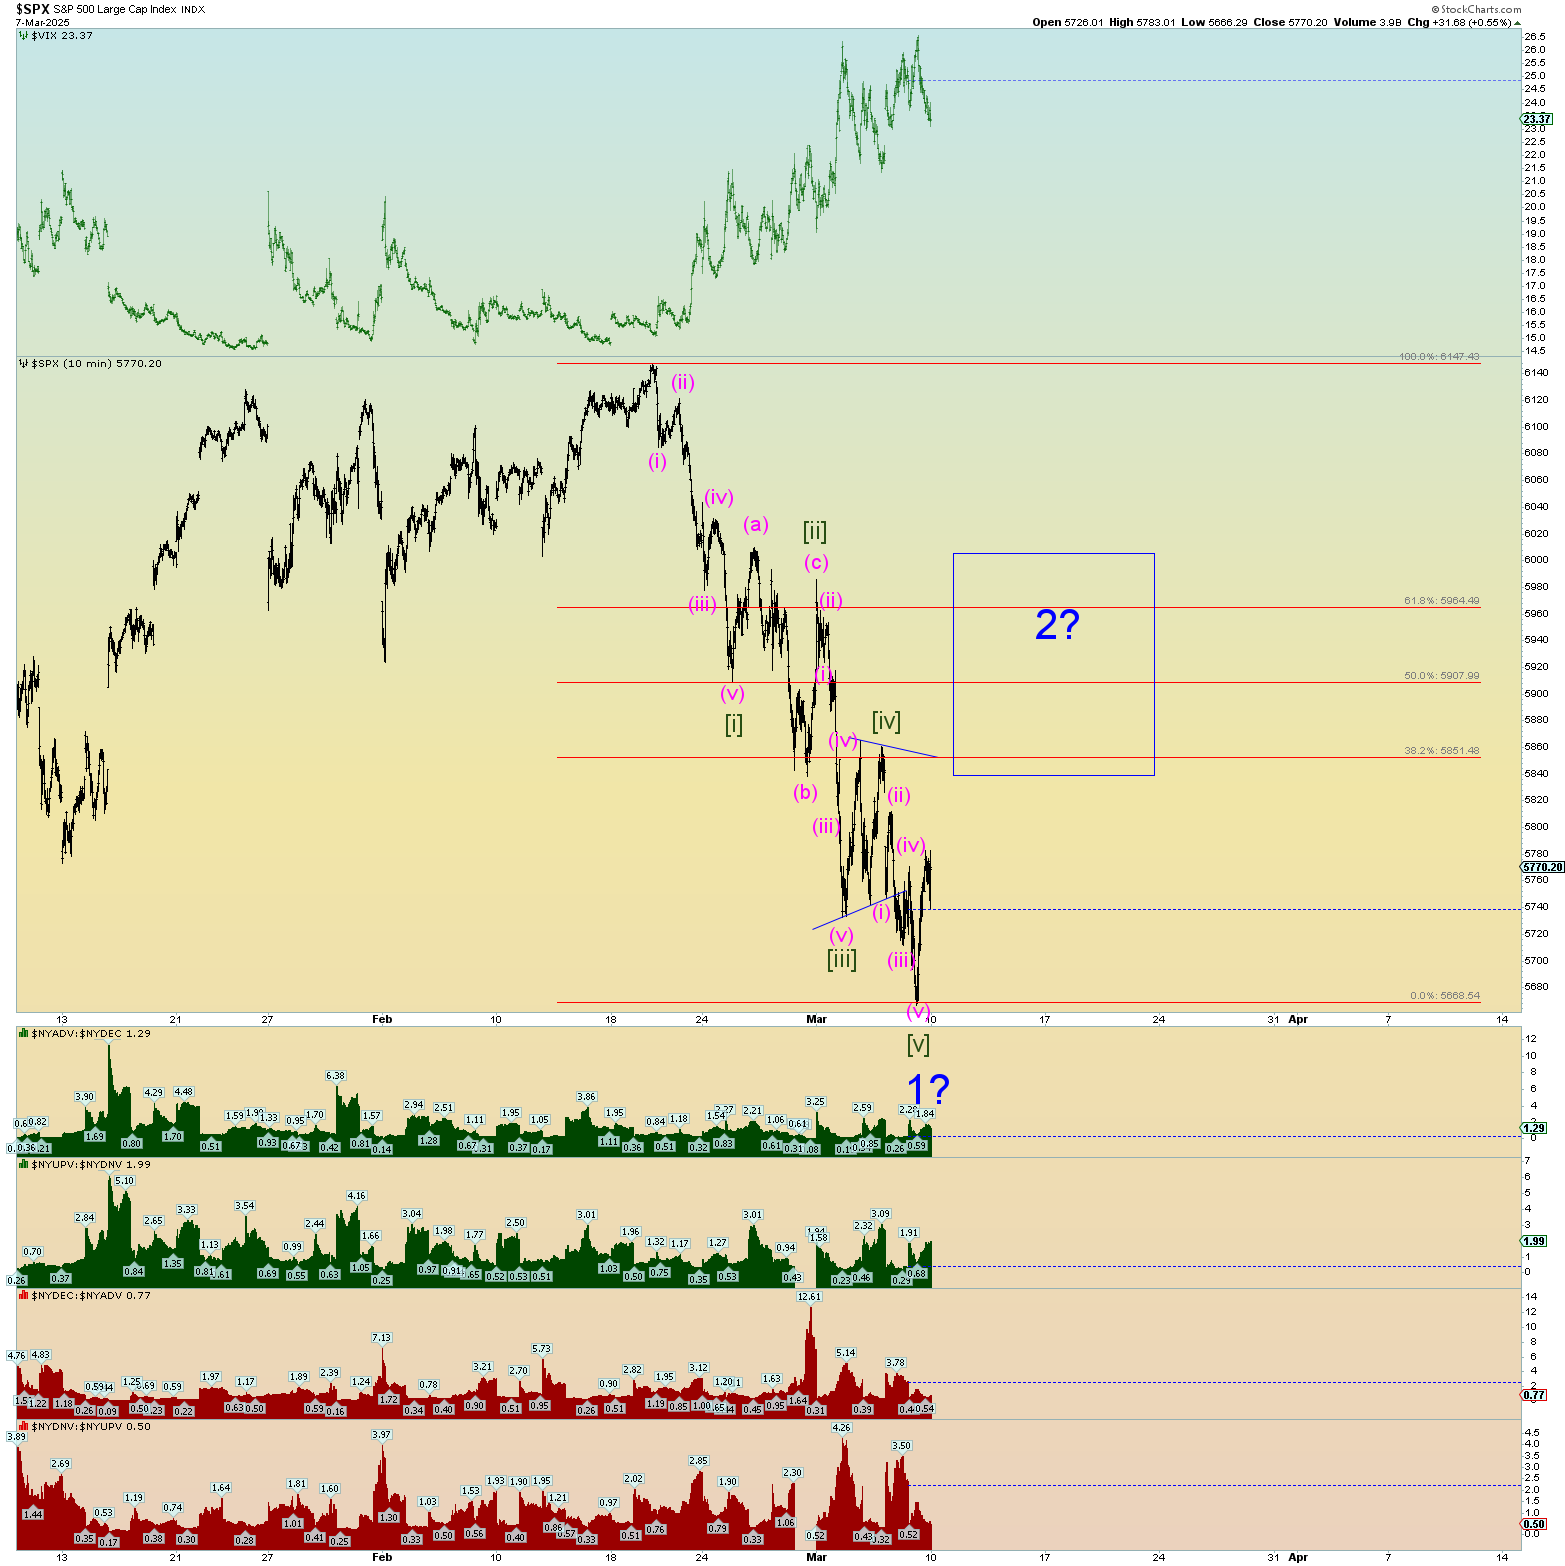
Conclusion: The overall wave structure from a long term, medium term, and short term seems to indicate a long-term trend change. In the short term the structure supports a wave 2 bounce.