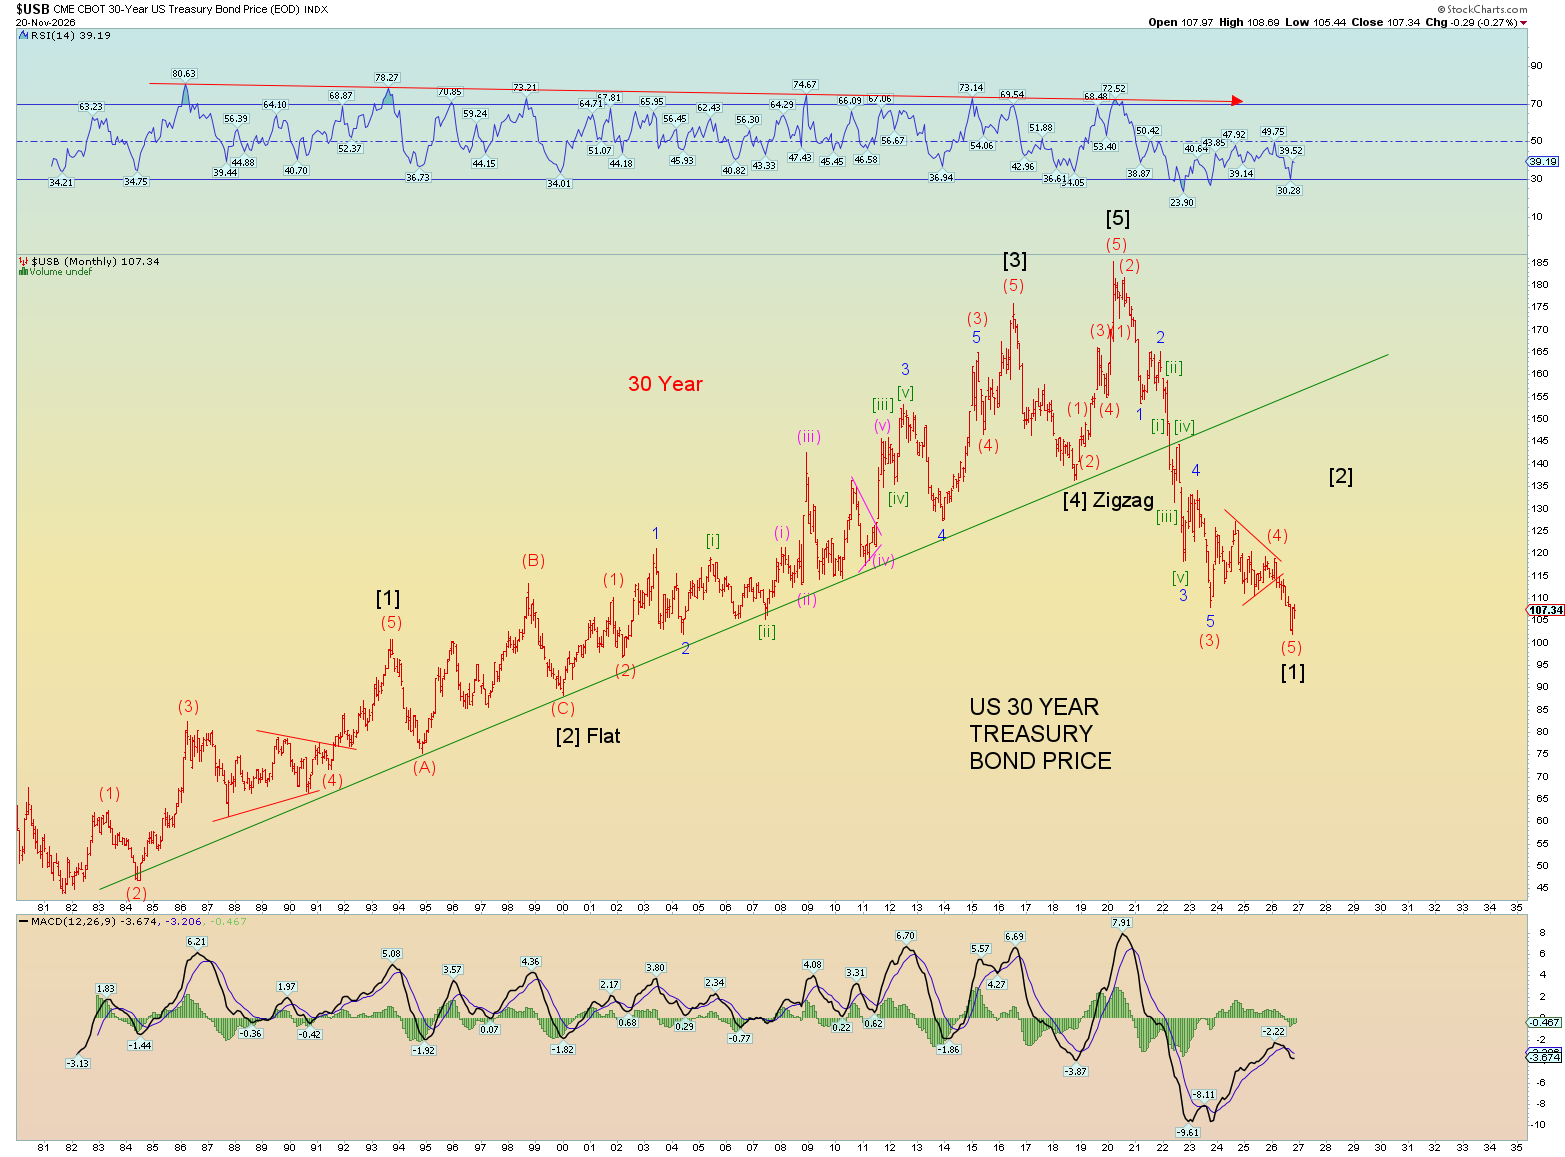
Today’s update will be simple. Any observer of the markets can see everything is getting crushed (except U.S. bonds which we expected which is due a huge bounce since they have been crushed for the last many years).
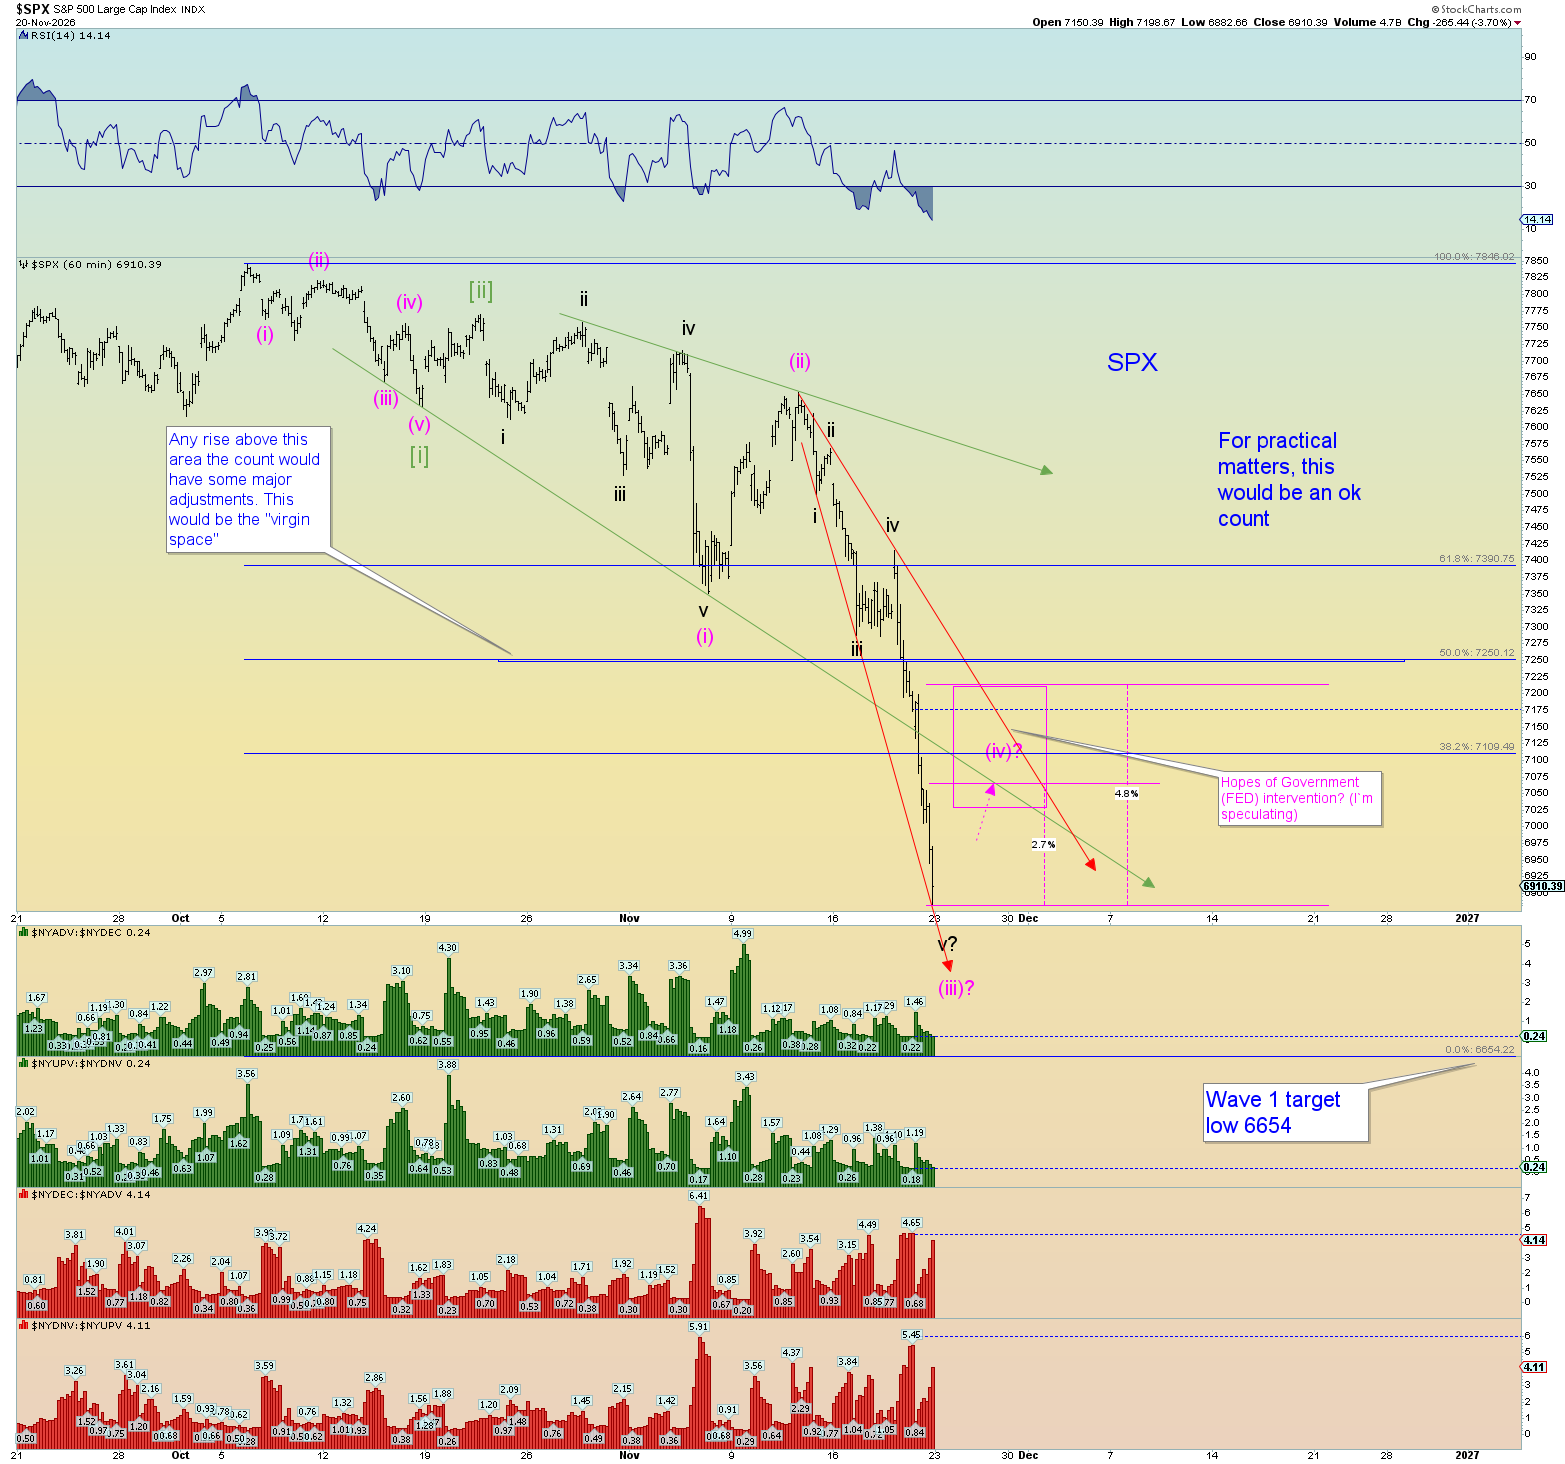
The premise of an Elliott Wave count is this: Identify the potential “virgin area”, (3rd of a 3rd more or less) assume it lies at the 50% mark of the total wave decline and plot the unfolding subwaves from there. I like to use trendlines, boxes etc to present an overall picture.
So here is that picture. Its complex on purpose but it conveys the primary thinking of where we may be in the overall picture.
And this chart is from a best-case short-term “heavy bounce” Elliott Wave pattern. The markets can go straight down to hell on Monday for all I care. But this chart approaches things assuming they will unfold as typical Elliott Wave patterns do. And a “bounce” would have to be accounted for, so this chart predicts options in that regard.
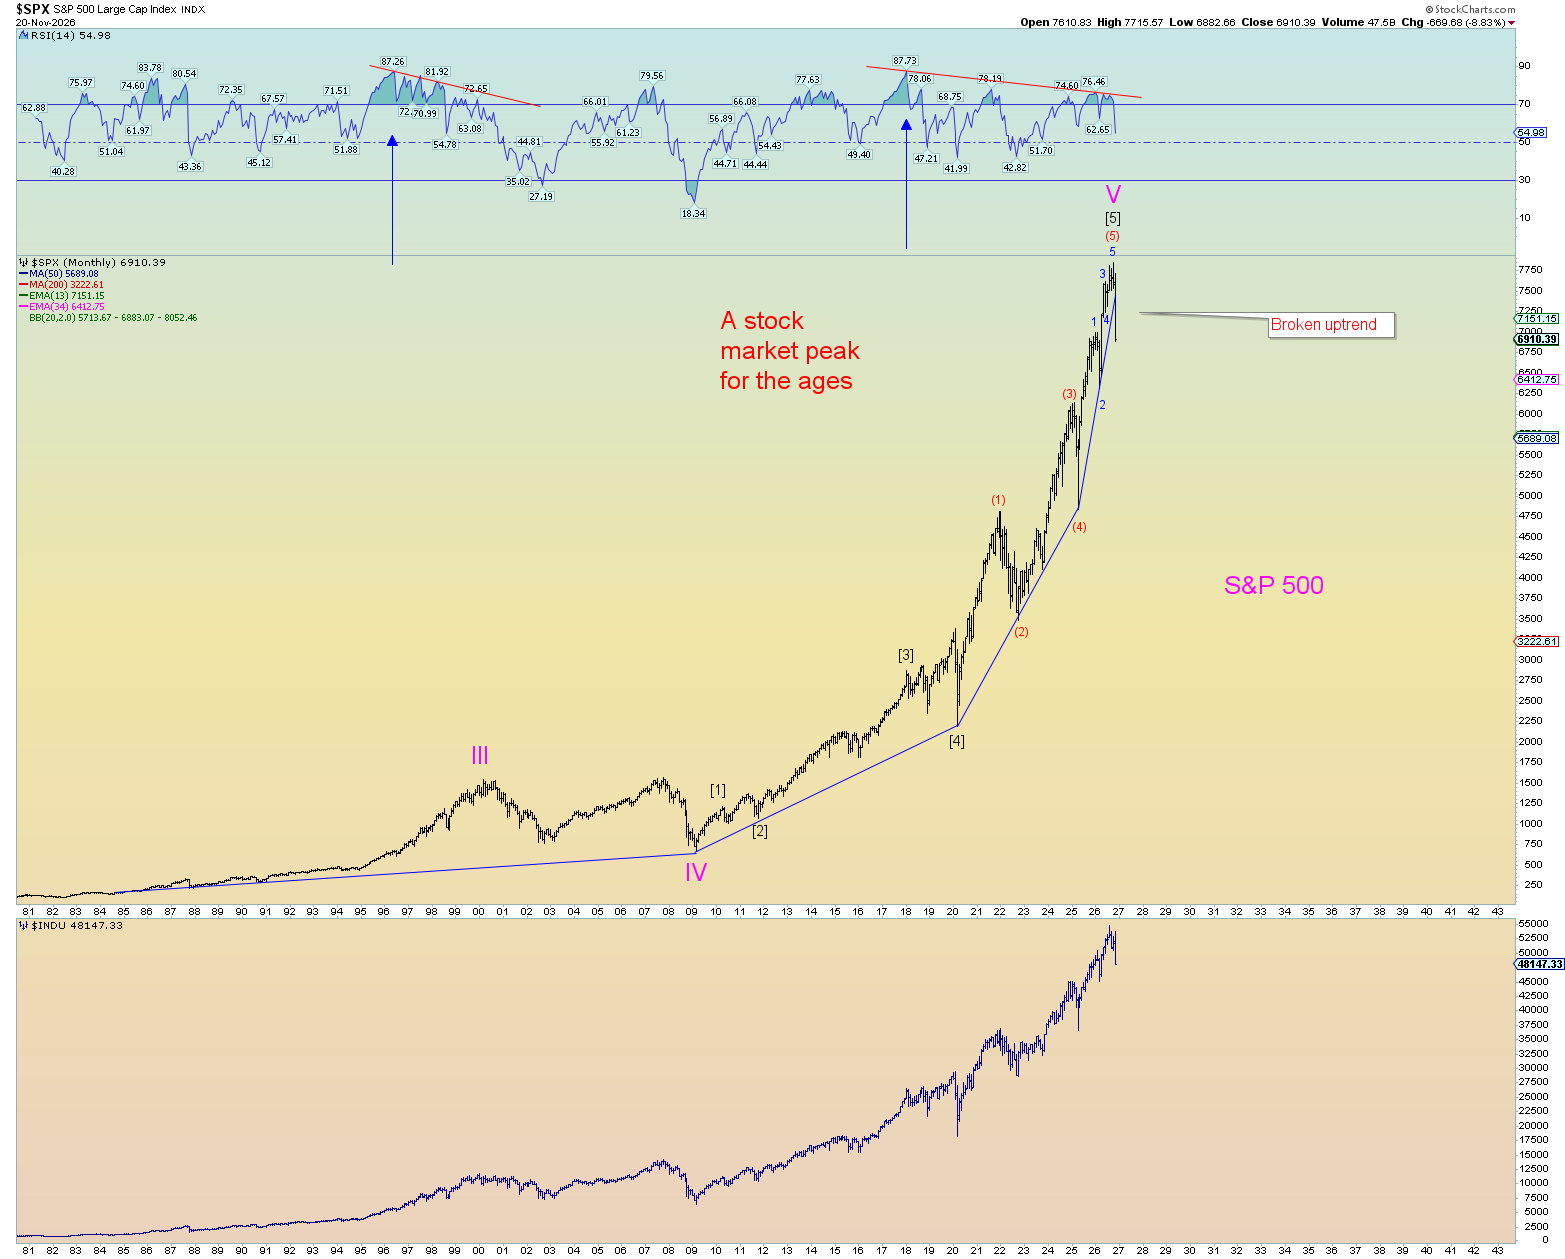
On the flipside we are witnessing perhaps an extraordinary event. The uptrend pattern that has persisted since the early 1980’s has been decisively broken. Note the chart below:
(The above paragraph was re-written through “AI” and sounds gay and robotic. I’m just going to continue to write in my own broken stupid style, so you know it’s me)
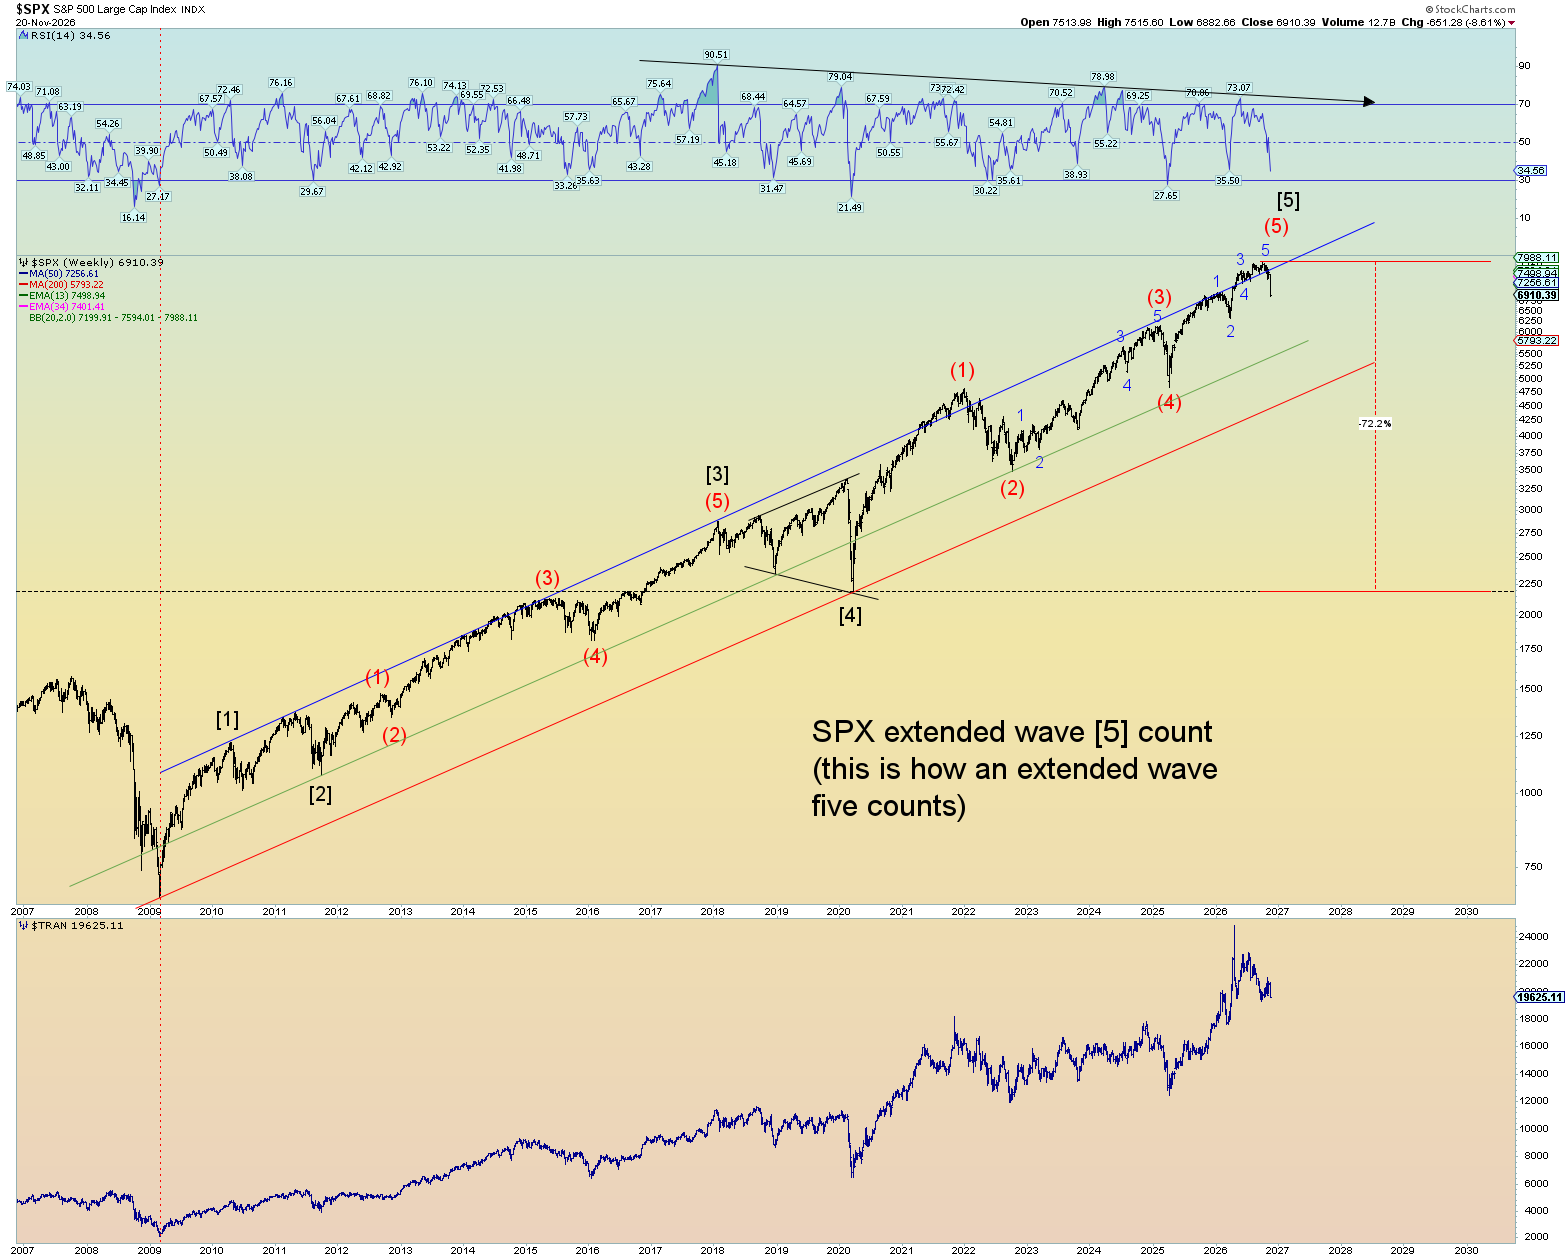
Bonds can go straight down to hell but I’m assuming they are due for a major upswing. Which actually implies the equities markets will be collapsing and chasing money into the bond funds. So, it “makes sense.”