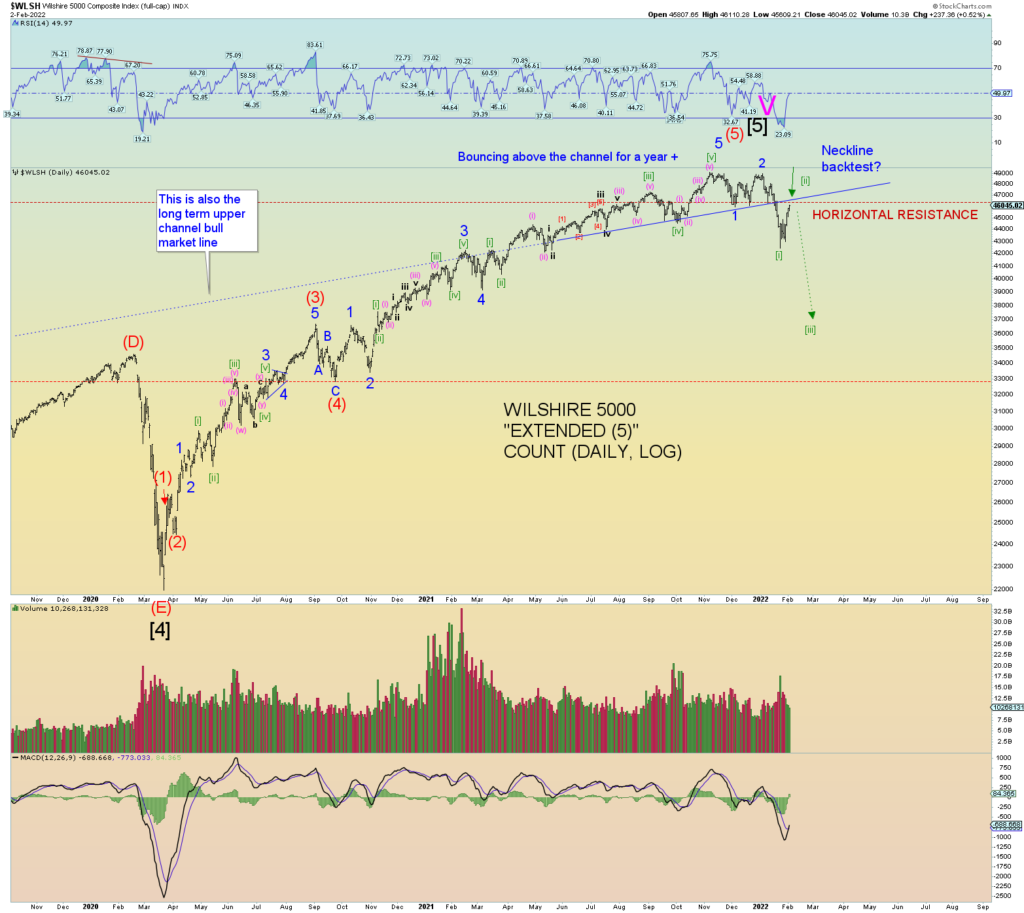
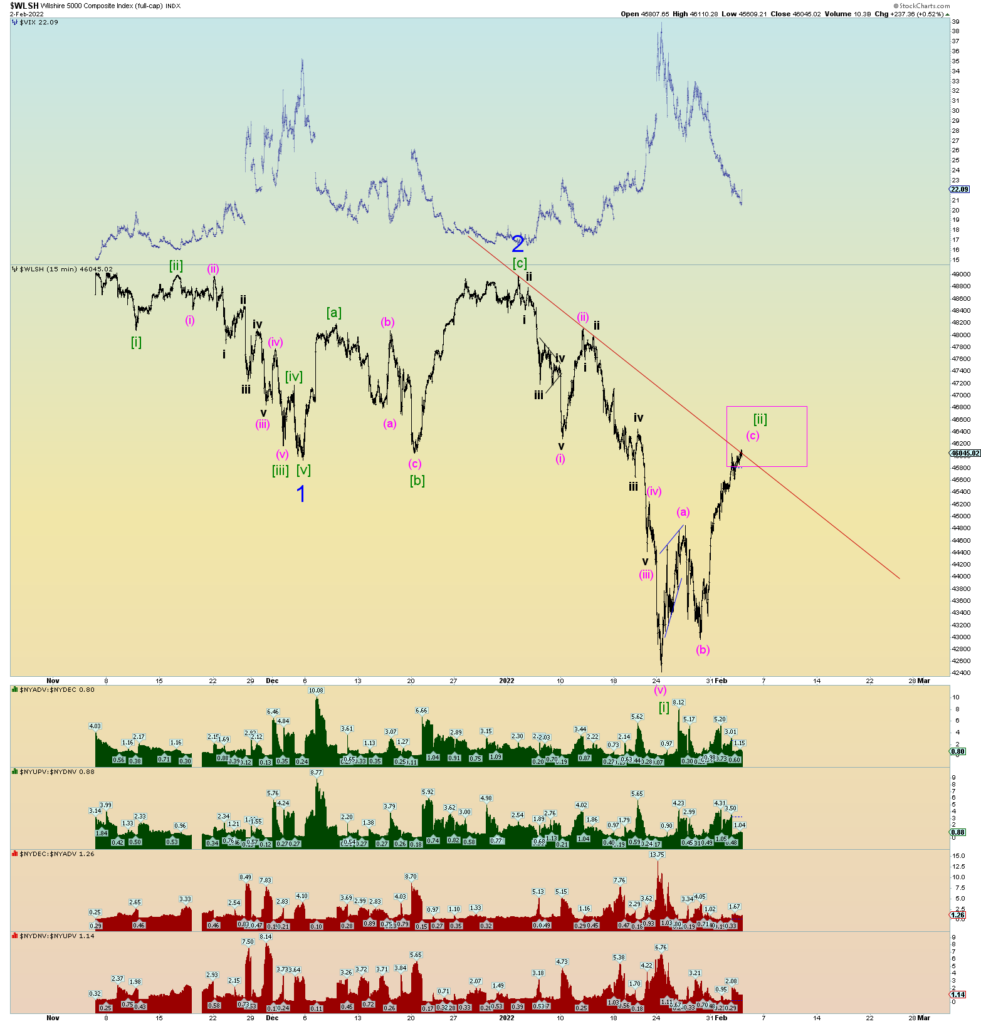
The Wilshire 5000’s primary bearish count has now whittled down to Minor 1 -2, Minute [i] – [ii] wave structure.
From a head and shoulders topping chart pattern – which broke the neckline and met its lower target as shown in previous week’s posts – we now have prices attempting a backtest of the broken neckline.

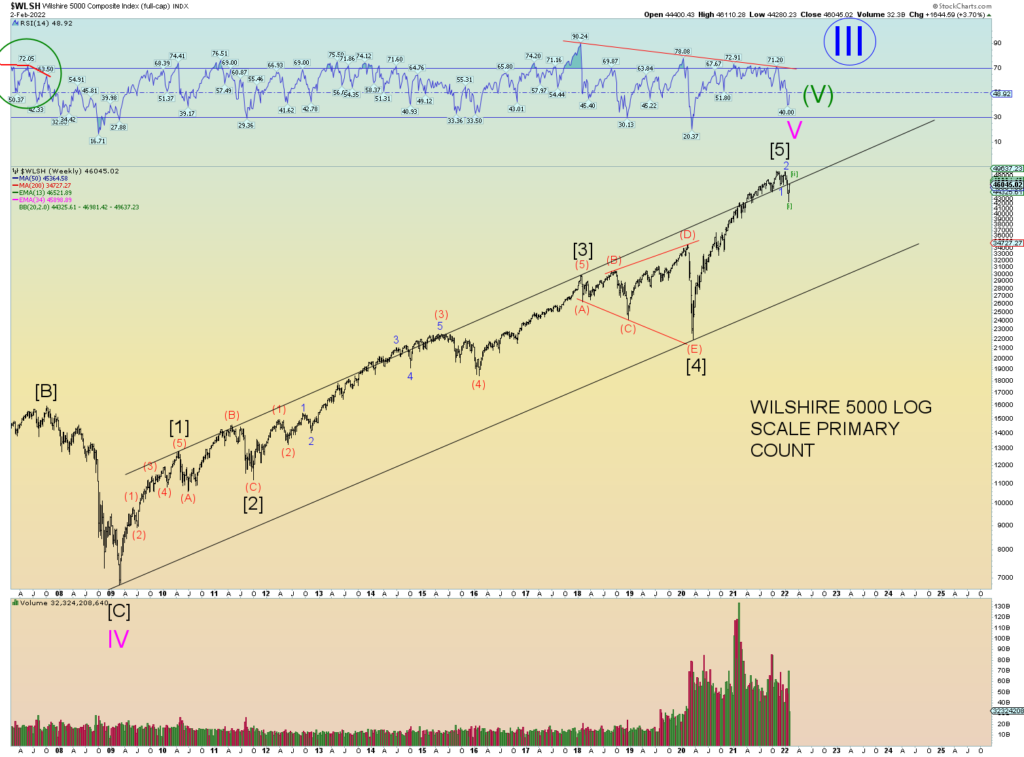
The short-term neckline pattern happens to align with the long-term upper channel line as shown on the weekly.
Therefore, the neckline “backtest” is not only of the head and shoulders topping chart pattern, but one could say the entire bull market upper channel line.

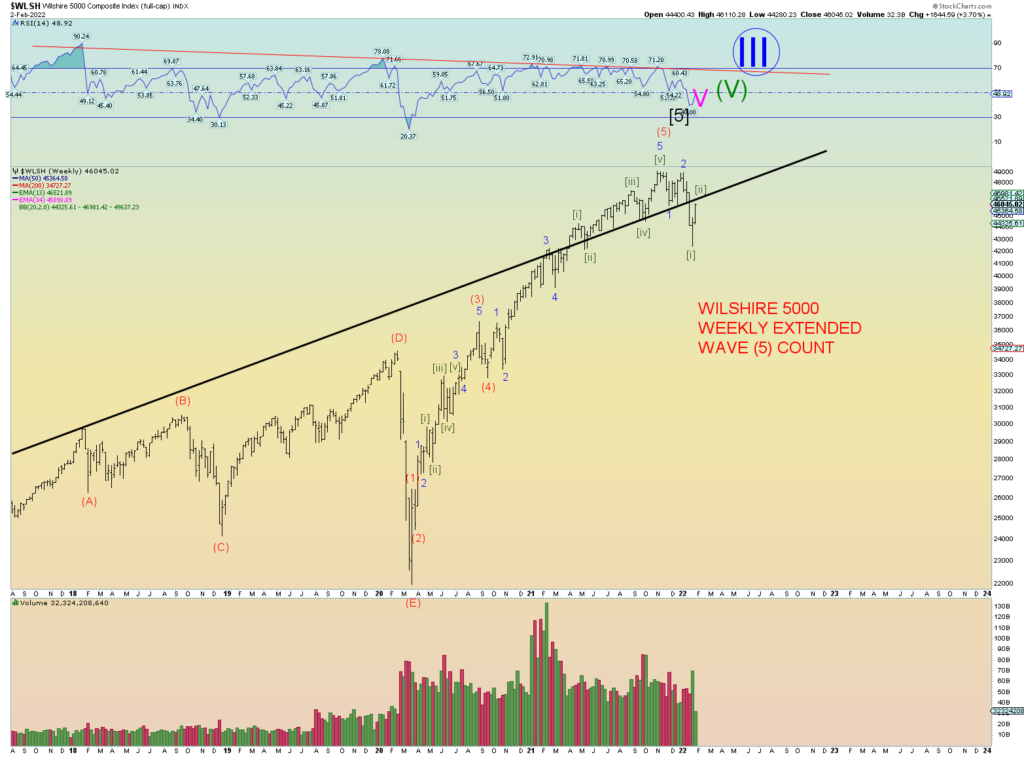
Zooming in on the weekly, prices are more or less at that upper channel. The upper channel line had provided support for the overextended wave (5) for well over a year. Prices fell violently through, and they need to regain this key trendline in order for the bull market to continue. It’s that simple.
If the neckline/channel line is rejected – which the primary count is that prices will be rejected – then an even more violent bear wave down in Minute [iii] of Minor 3 should occur. Basically, it would be a loss of support in search of the next support. And that is the key question. Where is next support other than the recent pivot price low of Minute [i] of 3 down (which should not prove to be very solid)?

15-minute squiggle count.

CONCLUSION
The chart wave patterns are simple. Prices need to regain the broken head and shoulders neckline – which is also the long-term upper bull channel line – in order for the bull market to continue. The primary count is that prices will not regain this key support line (now acting as key resistance). And thus, the next wave down – Minute [iii] of Minor 3 of Intermediate (1) – will commence. Within the next wave, downside internal market metrics should surpass “90% down days”. This would be the first key internal market metric that would help confirm the count.
The next few days/week should be very interesting.