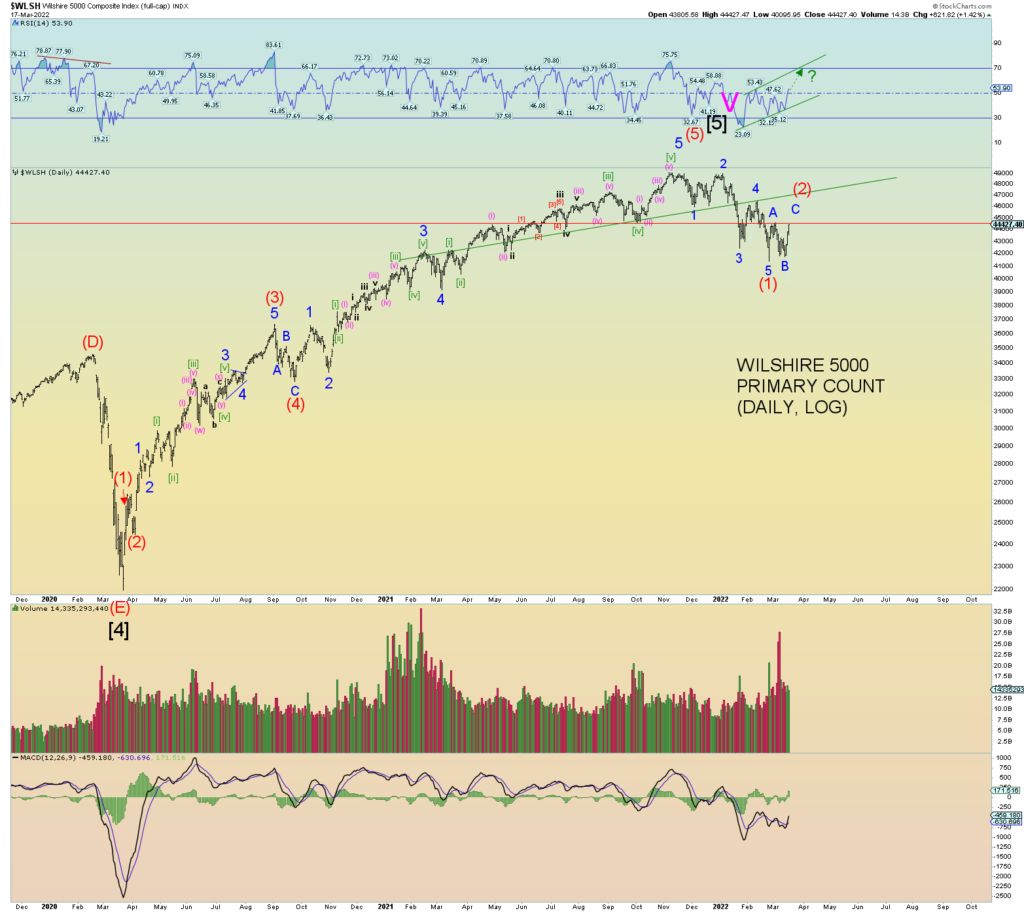
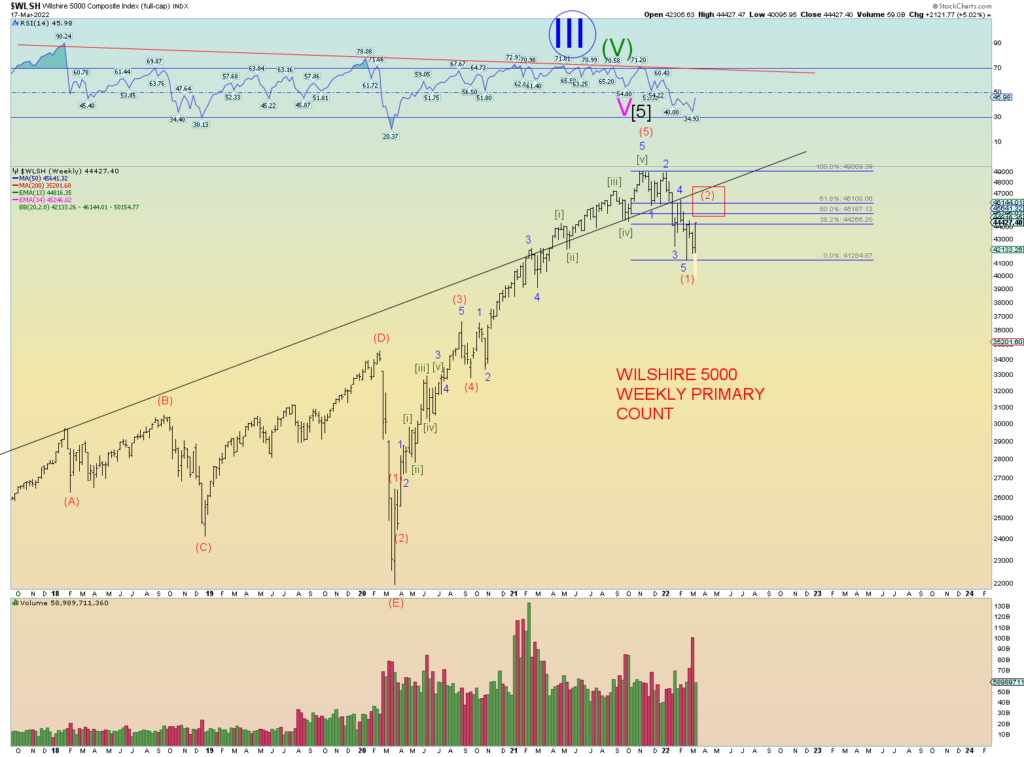
The Wilshire 5000 still has not violated the “lower highs” view of things although it is close. Regardless, it’s probably best that one views the current price action since Feb 24th low as an Intermediate wave (2) corrective up. The positive diverging RSI has now finished higher, and the price closing high of the Wilshire is the best since February 16th. This all points to probably wave (2) and we should keep things simple. The retrace has cleared the 38.2 % Fib and closed at about 40% retrace in total so far.
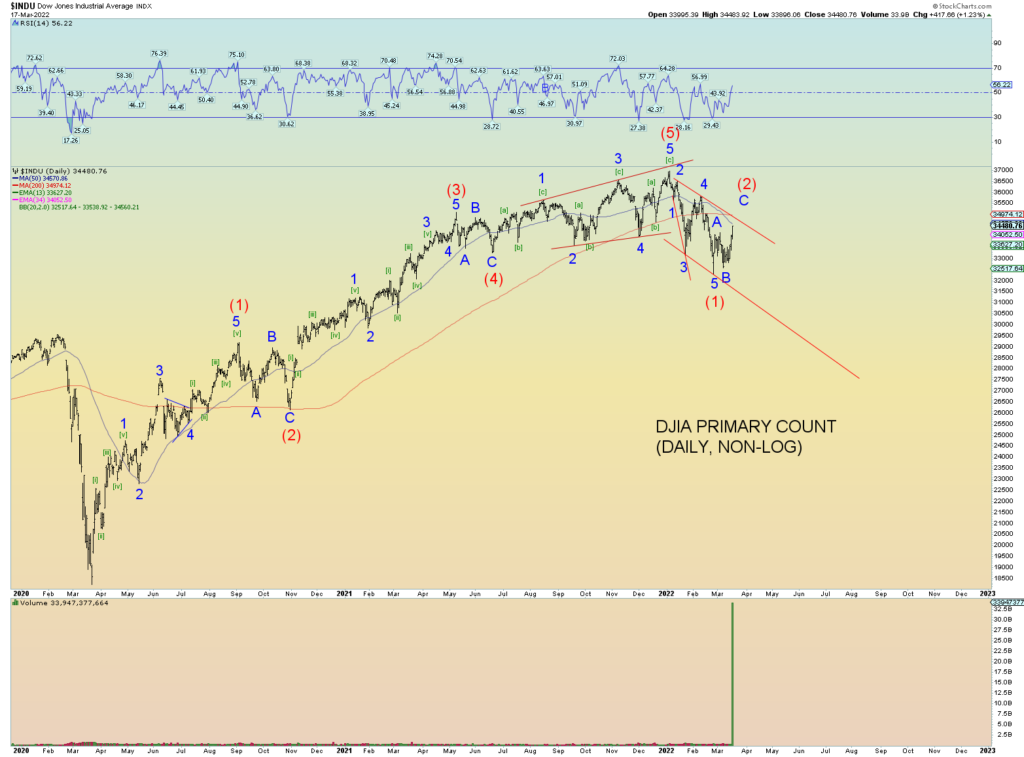
Wave (1) took 75 trading days; one could expect wave (2) to take between 30 – 40 trading days to resolve itself. Today was trading day 17 since the 24th of Feb low. However, it is not the case on the DJIA or SPX because their highs occurred in early January. Therefore, ideally wave (2) would be resolved at about 30 day’s trading which would be about April 6th. And wave (2) peak would ideally occur on “good news”. Bad news marked the low, good news should mark the high of (2).
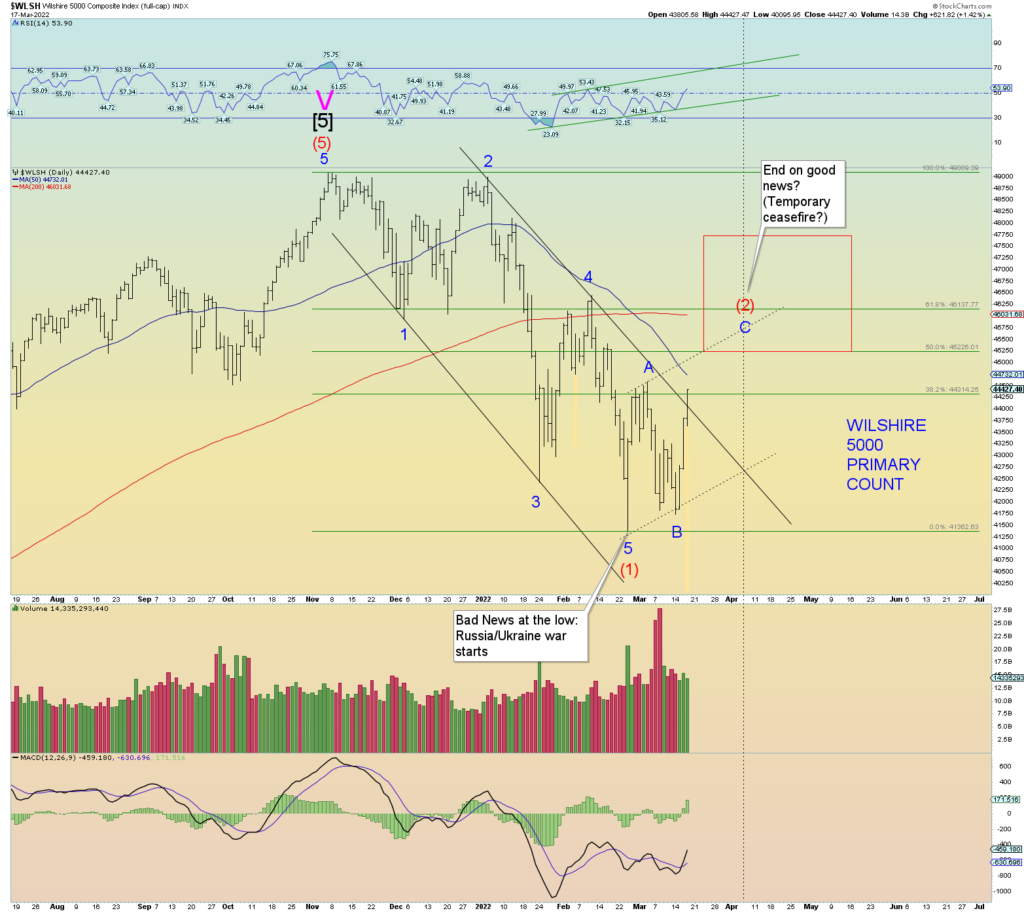
Prices are back at major horizontal resistance. If this resistance can be cleared, prices can retrace perhaps to the upper multi-year channel line (also the head and shoulders neckline) which would be quite deep. In other words, at about or just above Minor 4 of (1).
46,368 is Fibonacci sequence #24 would be ideal for a stopping point for (2) if prices can clear near term resistance.
