UPDATE
Significant price action today on expanding NYSE internals. Lots to unpack and talk about so let’s dive right in. I’ll comment on each chart as we go along.
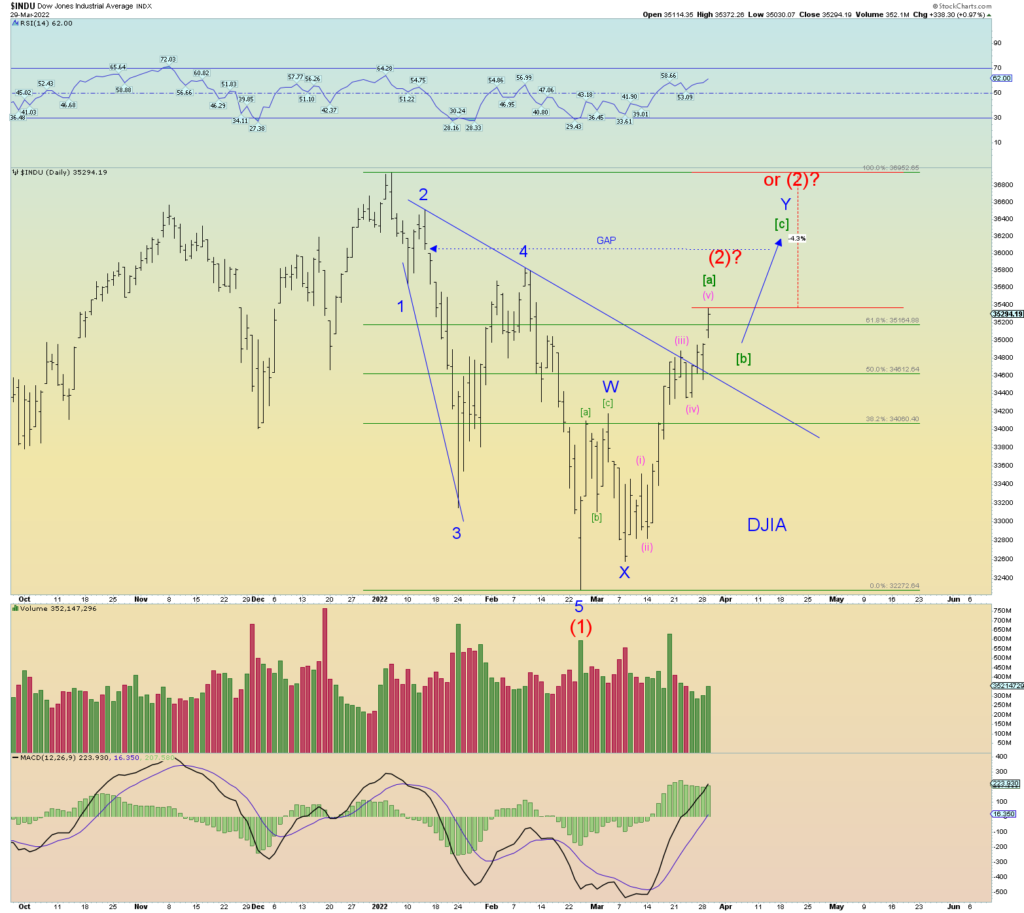
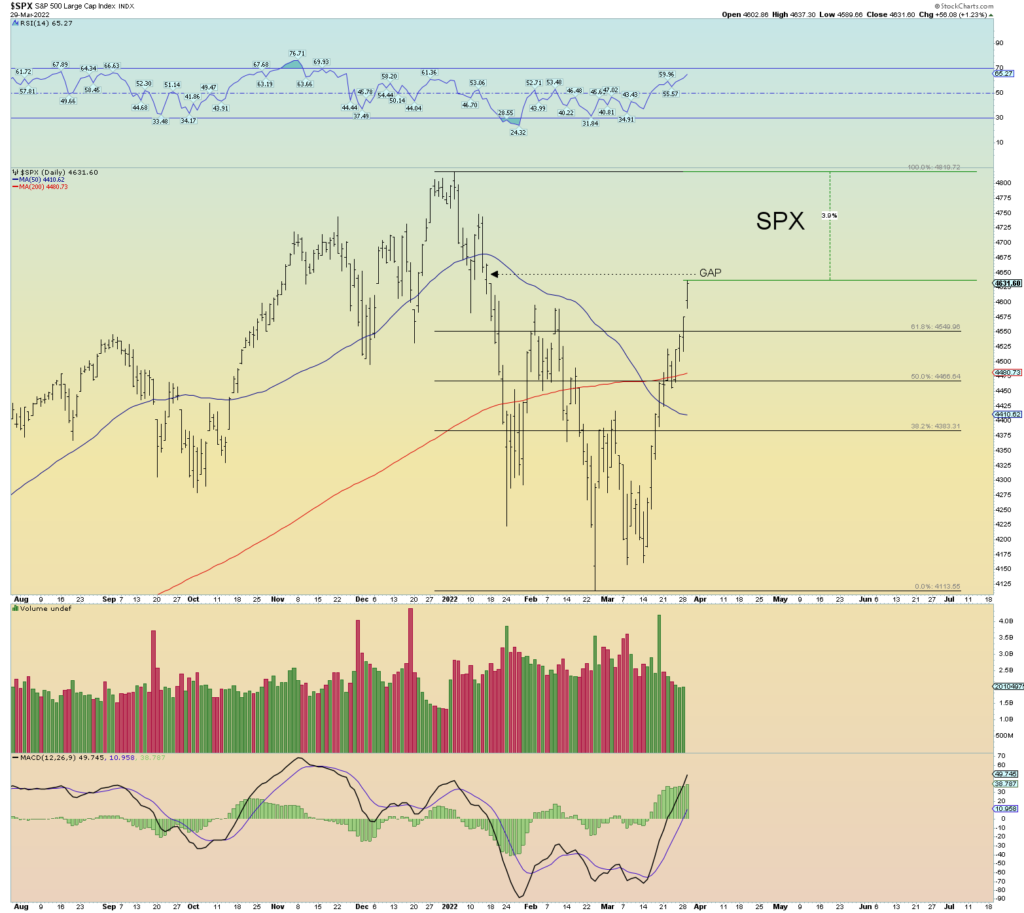
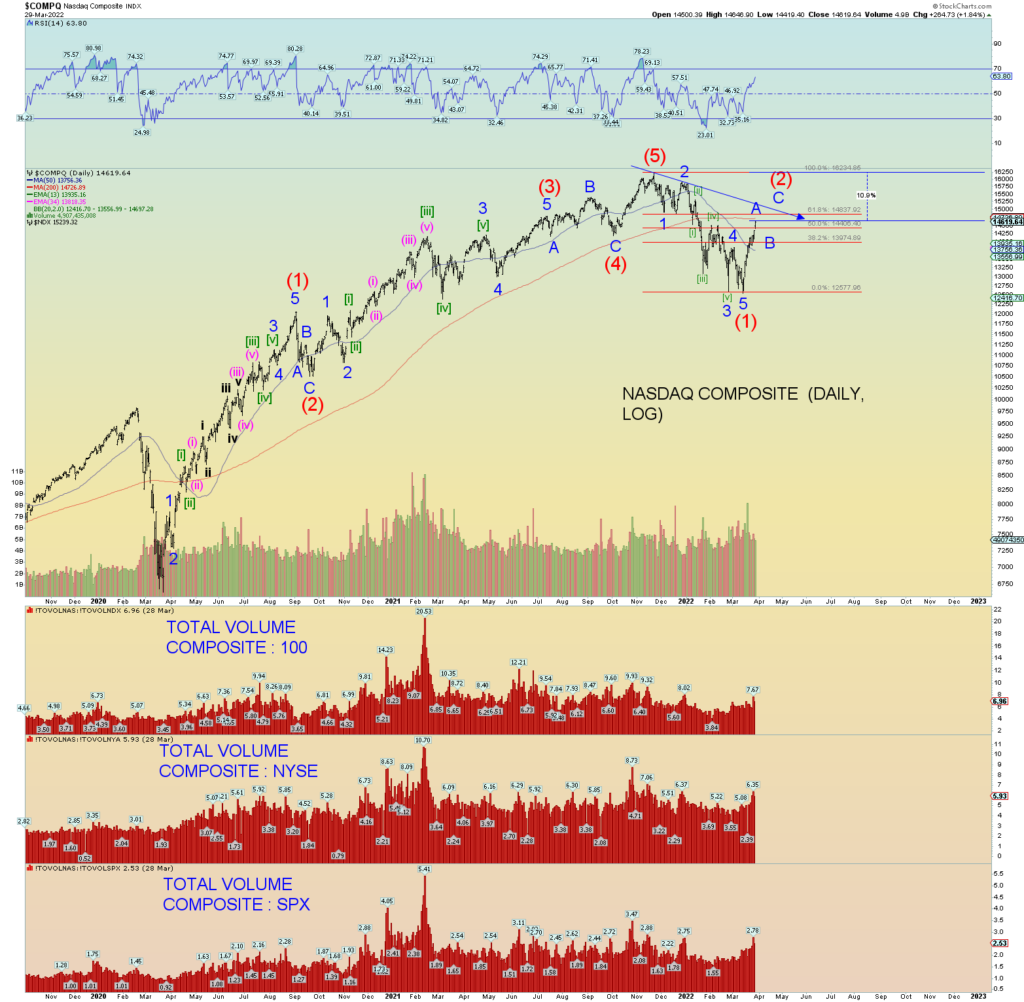
The NASDAQ Composite is some 11% still from peak. Yet the NYSE is a mere 2.6% from its peak. The Wilshire sits at about 4.7% from its November peak. The SPX is 3.9% and the DJIA is 4.3%.
Therefore, the market is perhaps setting itself up for another round of potential market divergences/deviations. The NYSE, DJIA, and SPX may make new tops, or some may come close and some not. The NYSE, SPX, DJIA all do not have solid impulse 5 wave moves lower from their early January peaks which suggests “corrective”. The Wilshire 5000 and Composite (and Russell 2000 for that matter) are satisfactory impulse 5 wave moves lower. So, we have to consider them all together perhaps. the best count for those indexes is that wave (2), although perhaps getting deep on the Wilshire is playing out and that the November peak will hold.
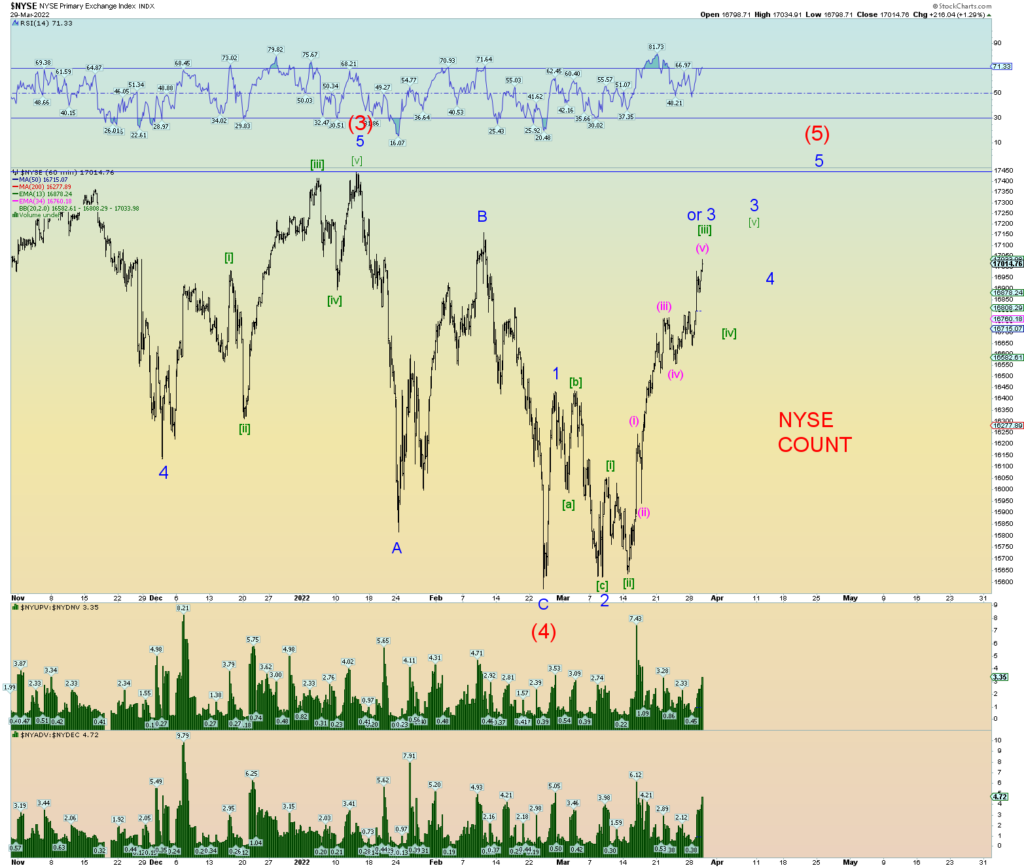
Let’s start with the NYSE since it is the closest to a new peak. The best count is below. This suggests we are nearing the top of a Minor 3 of (5), then pullback for 4 and then push to 5 of (5). All that is required is a new all-time high price.
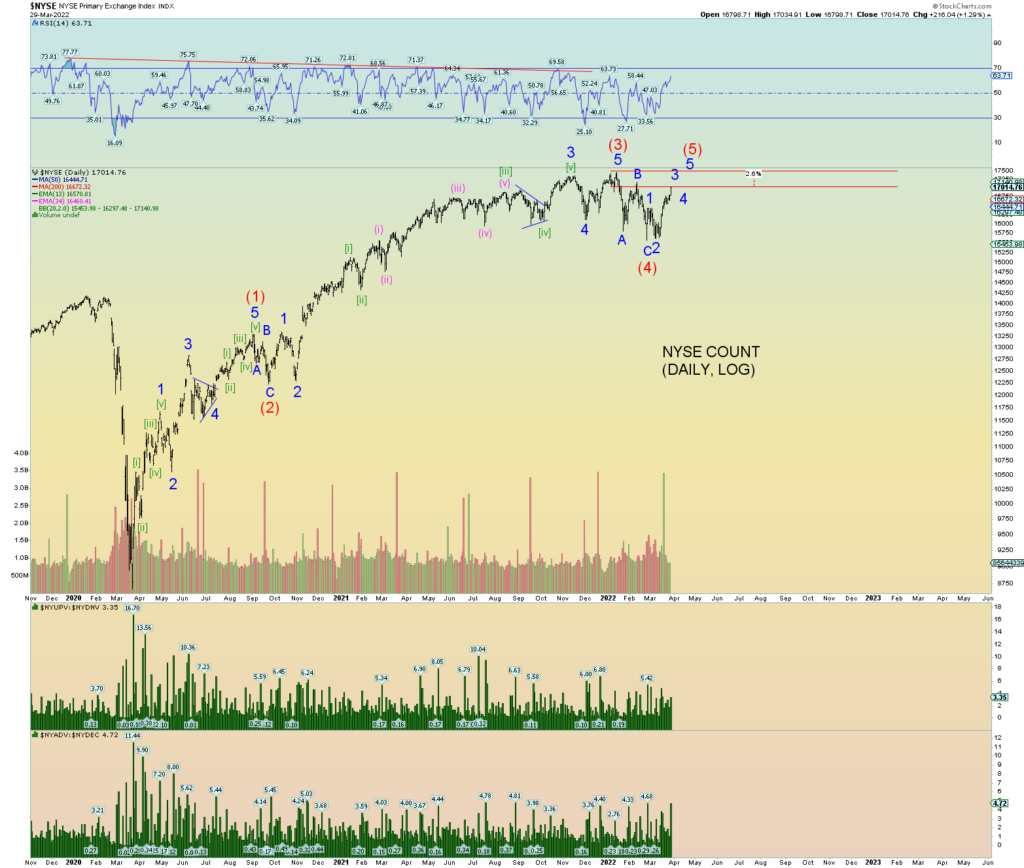
Squiggle count :
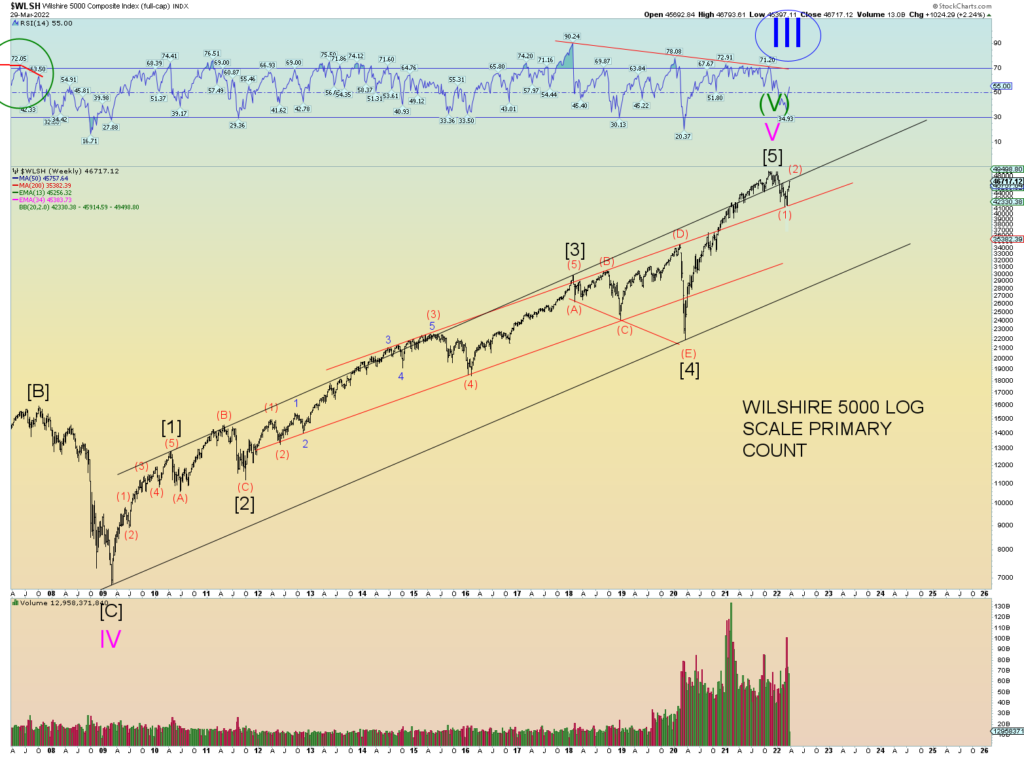
And now the Wilshire 5000. Here is perhaps a simple way of looking at things. Testing the upper channel line:
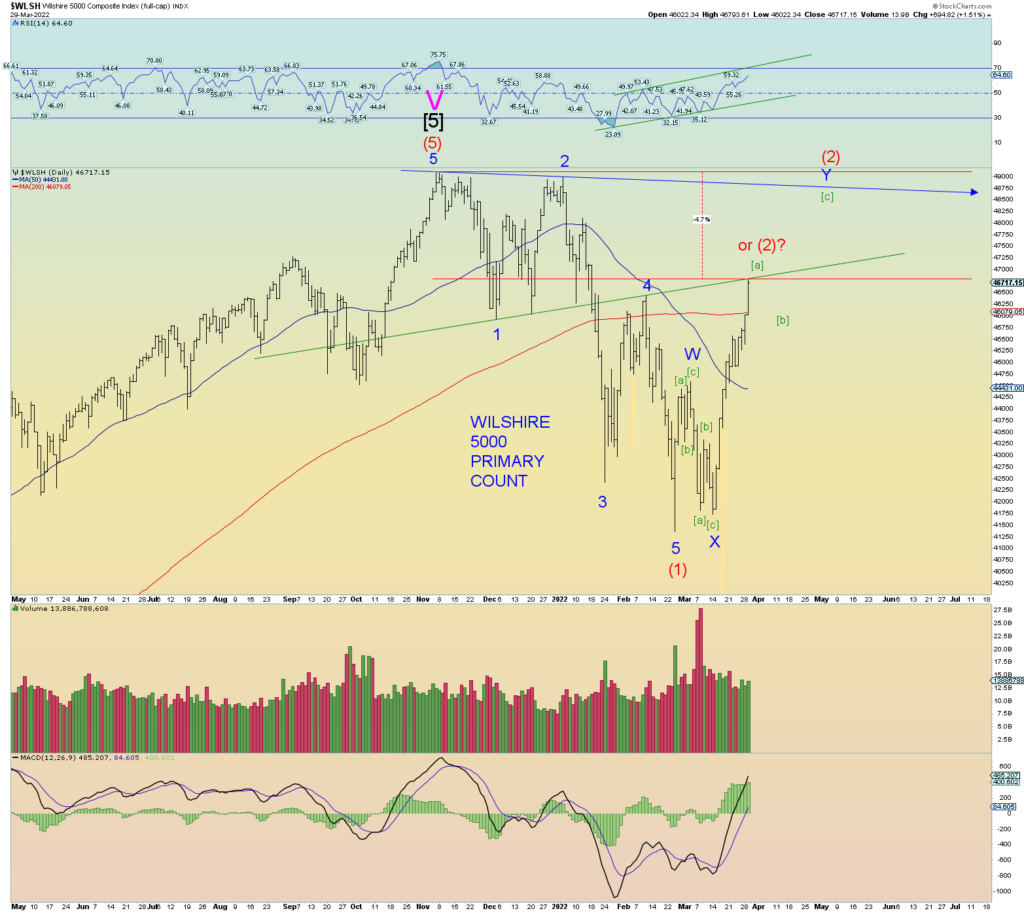
A closer look:
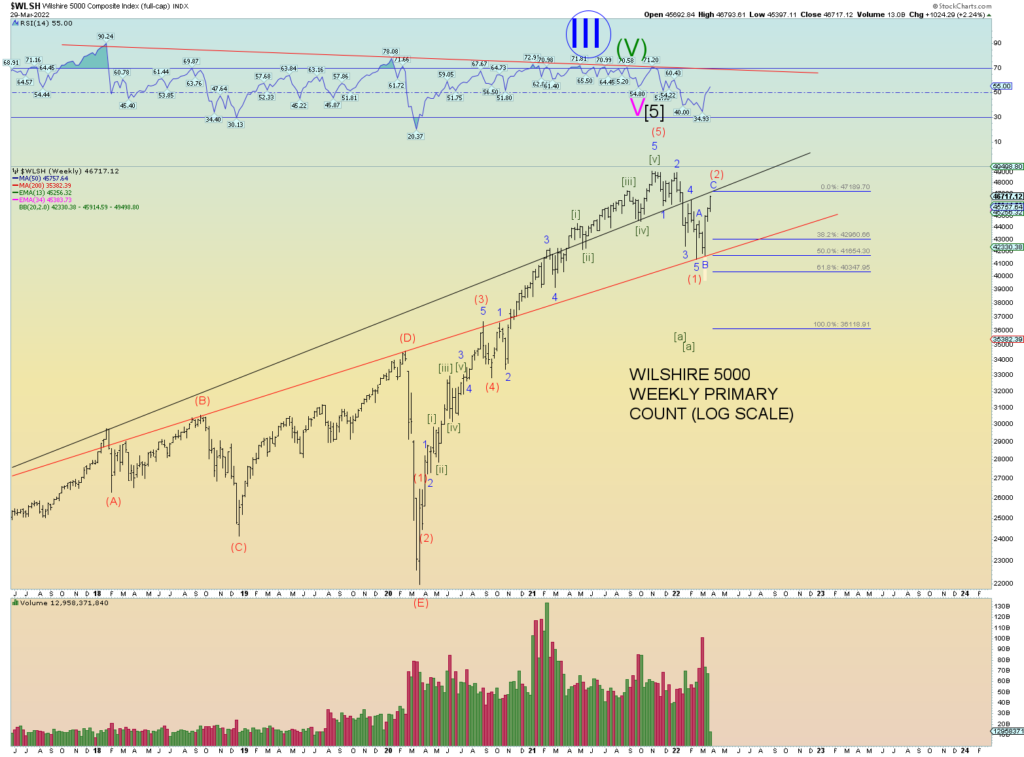
At the moment we have a “back test” of the broken head and shoulders neckline. This is not quite the same as the long-term upper channel line as shown on the weekly but they are similar its just that the angle of this neckline is more flat and properly placed for a H&S pattern.
Note how the Wilshire could gain 4.2% more in prices to be back at the blue downtrend line formed by the all-time peak and wave 2 of (1) peak. This area would be a struggle because prices would be rotating about the long-term upper channel line again.
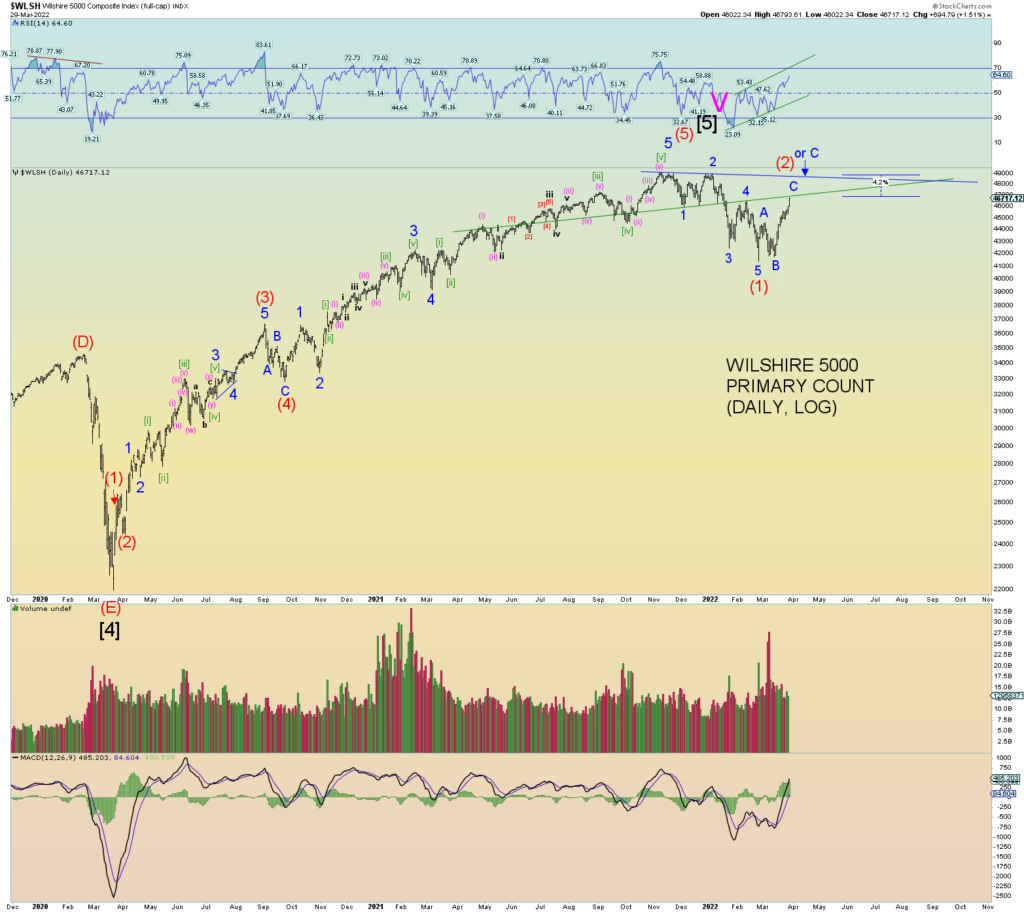
Ultimately, if we do get the extreme retrace – much like the wave 2 of (1) of early January, then the blue down sloping trendline may be the stopping point sometime in April. Since we had overlap of wave 1 and 4 of (1) down, this actually predicts a deep retrace for (2) since it was not a pure “clean” impulse move lower much like wave 1 of (1) down was not “clean” (although it was 9 waves down which is a “cousin” of the 5 wave move) and thus 2 of (1) retraced very deep.
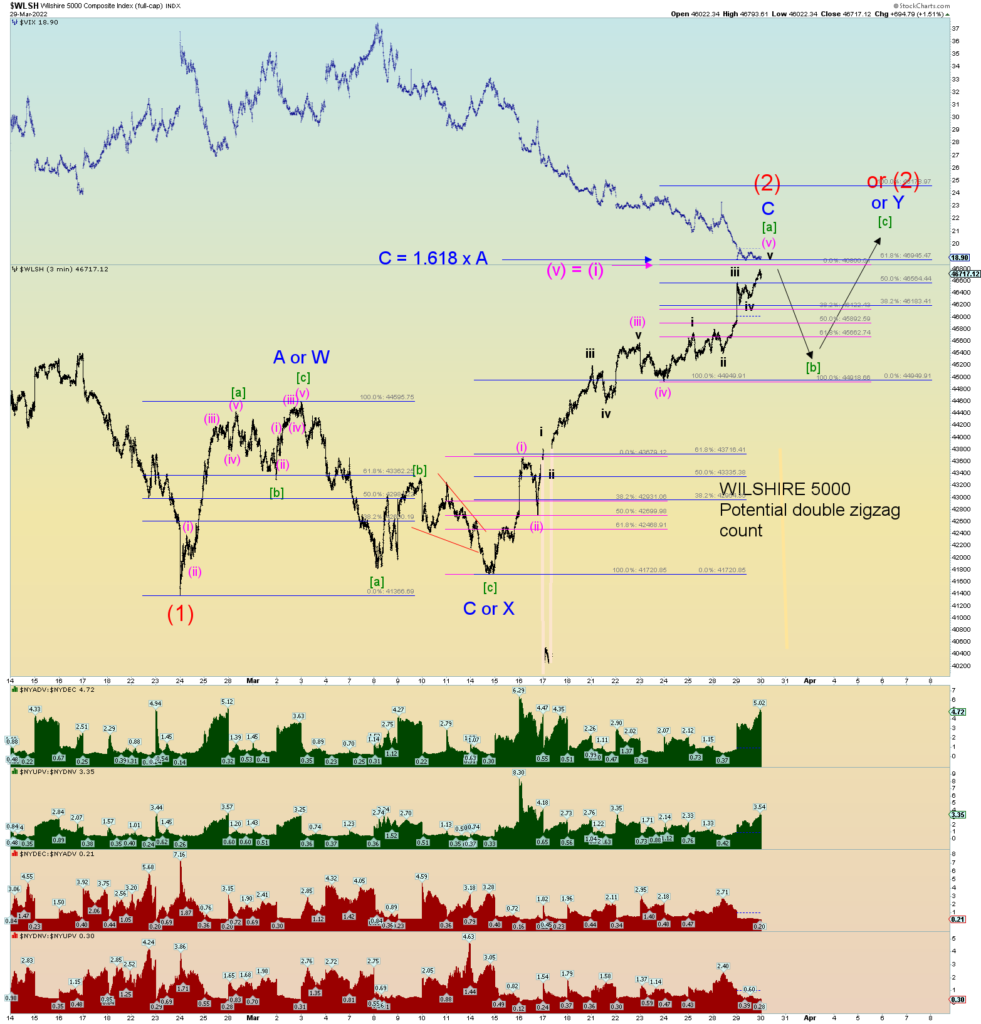
A potential squiggle count. Waves [b] and [c] of Y is just shown for form only. Prices could pull back more in [b] and go higher in [c] and/or take more time. We may be nearing a short term top as some significant wave relationships are shown on the chart.
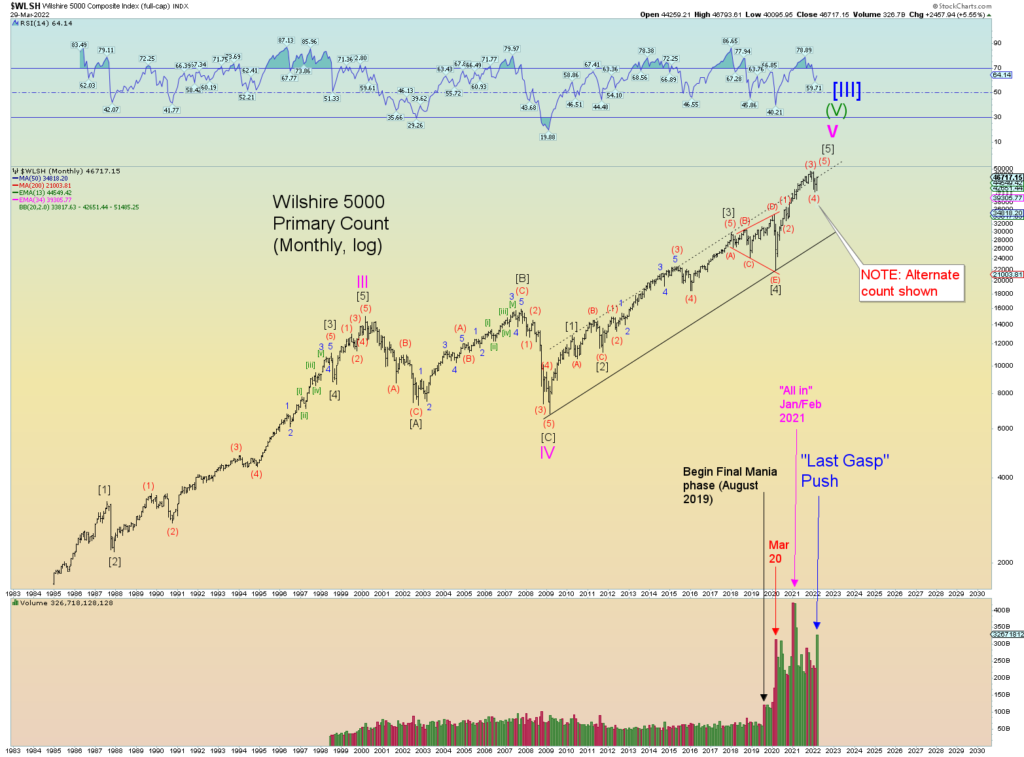
And finally, the longest-term count shown on the monthly. Note how I have put the top long term alternate count on this chart which makes the recent February 24th low wave (4) of [5]. The fact that you can “see” the waves on the monthly gives this count credence.
Note this month’s total volume bar on the Wilshire. There is likely a LOT of churn going on underneath as the uber-elite rich is using this opportunity to sell into it. Their are still 2 trading days of volume to go including end of quarter Thursday. Volume spikes such as these are worth paying attention to. In this case it appears to be a final push to either a new short term all-time high or very close.
The DJIA. Same pattern as the SPX but not quite as close to its January high. I show the bear count, but if the DOW makes a new all-time high, wave (1) down would be labeled wave (4) of course just like on the NYSE and the alt count shown on the Wilshire monthly above.
The S&P500. Same pattern as the DOW. Note that the DJIA and SPX differ in patterns from the NYSE. It has moved prices into the open gap as was suggested the last few days.
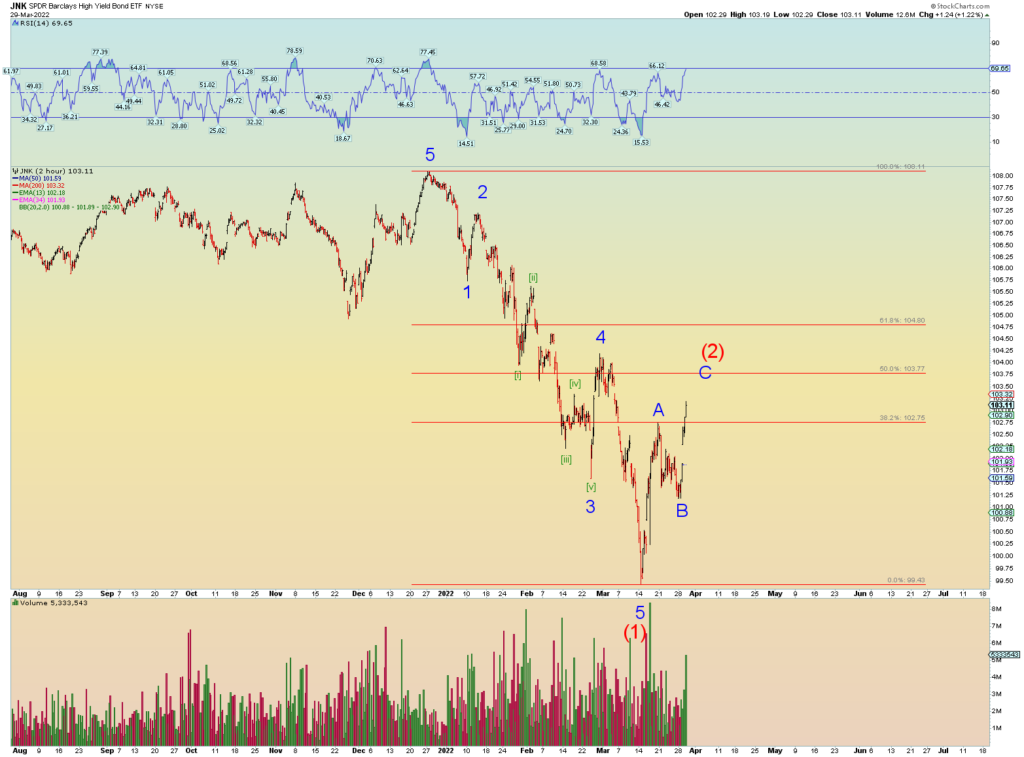
JUNK made its move higher to form what is now a solid A-B-C pattern. We’ll keep an eye on this as if it starts to diverge again from stocks and bleeding lower that could be a clue stocks are ready to top.
NASDAQ Composite. Just like the Wilshire 5000, if it keeps tracing higher the blue downtrend line is an interesting spot. Like JUNK, we should look to this index to see if it eventually diverges from the SPX and starts to peel lower as it has been leading the way down since November.
And finally, I will repeat what I said last week: The market “bottomed” on February 24th on the opening of the Ukraine war. There is an excellent chance the next “peak” will bring a peace deal – whether that be a new all-time high on some indexes and not others – is something I am very much looking for. That’s how social mood works after all. Wars begin at the lows and eventually peace (in this case I think it would be temporary) returns as social mood moves higher. Signing a peace deal at the peak would be a great opportunity to sell the farm. My bet is that the elite certainly will be.
The Great Reset cannot wait any longer in their eyes. Biden is still trying to provoke Putin every day with his comments, and we are doing nothing but trying to stoke a wider war. Satan is working his evil-doings behind the scenes you can be sure.
Based on my view of the bible, seal 2 (Antichrist being released from Heavan onto this earth) will be opened about June 15th. The result of seal 2 is total global war.
As a side note, also look for the Jewish daily sacrifice to begin again on a mobile platform they wheel up to the western wall on or about June 5th. I just thought I’d throw that in there because it is something I am looking for. Maybe it is done in secret so who knows. I am less sure about this.
Again, I am not dogmatic on the world having started Daniel’s 70th week last September. If we do not have total global war at the very latest by September 2022, then I am likely wrong. September 2022 would be late for seal 2 so I expect it earlier June 15th, 2022, to be precise.