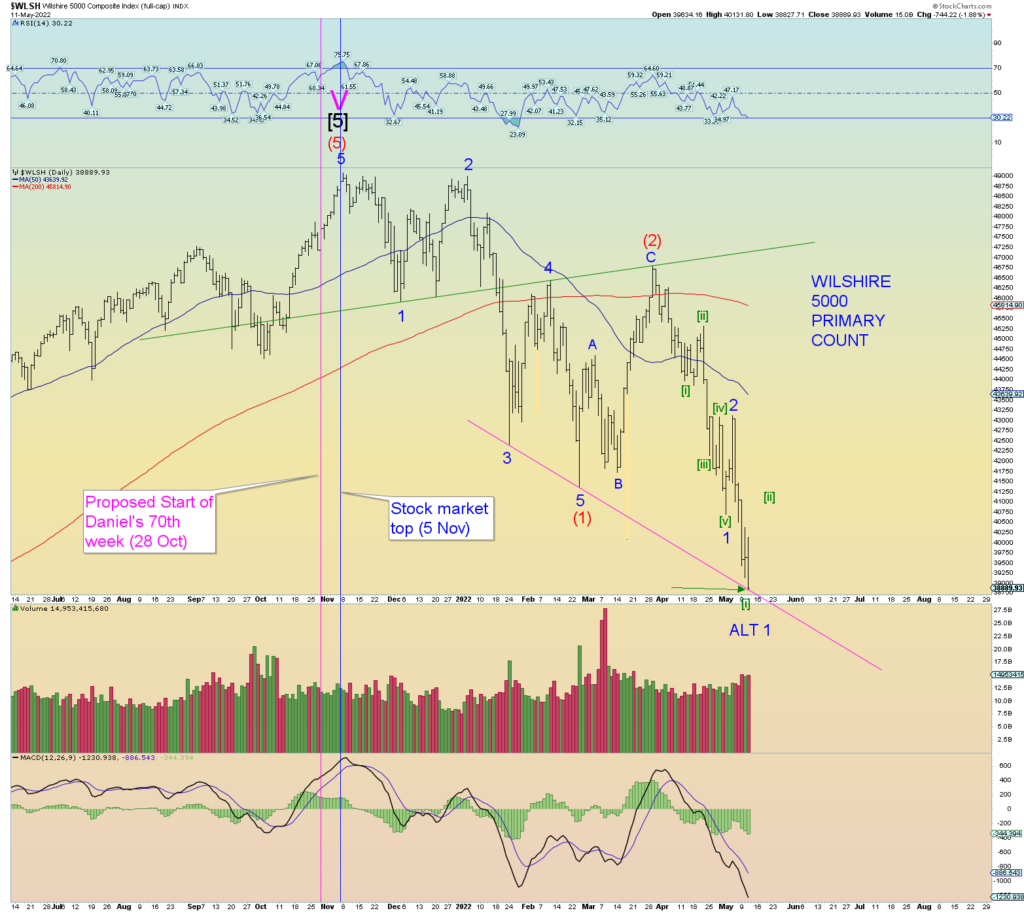
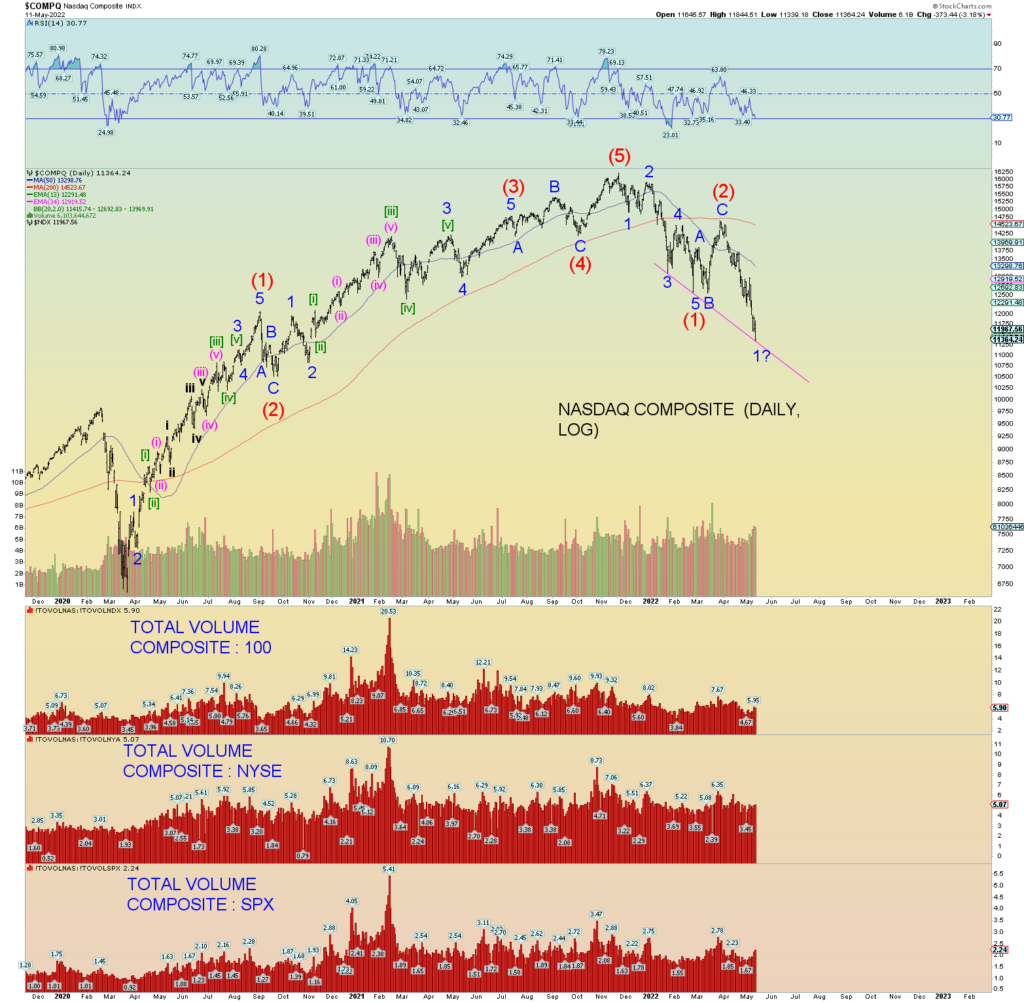
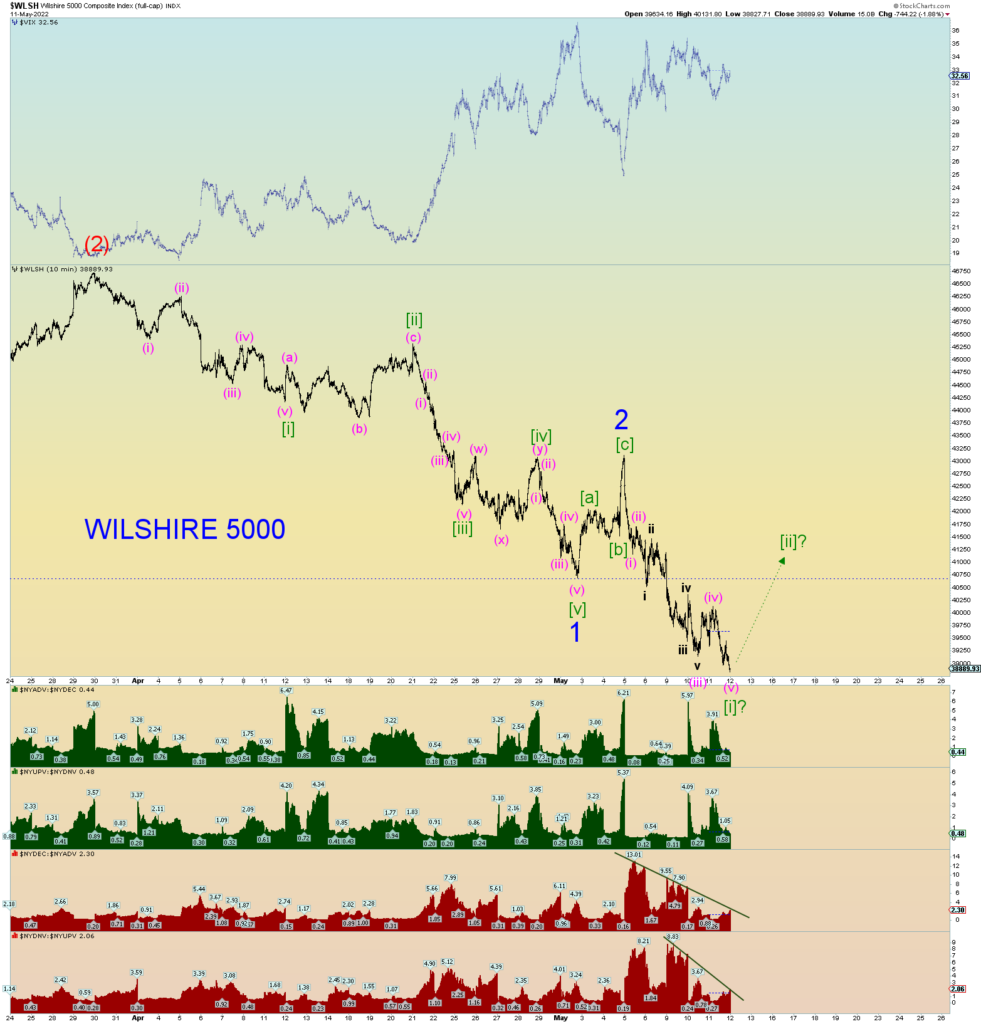
An important trendline was met today in both the Wilshire 5000 and Nasdaq Composite. Selling pressure has receded as measured by the NYSE internals despite the price drop to meet that trendline. Therefore, there is still room for a very healthy price bounce.
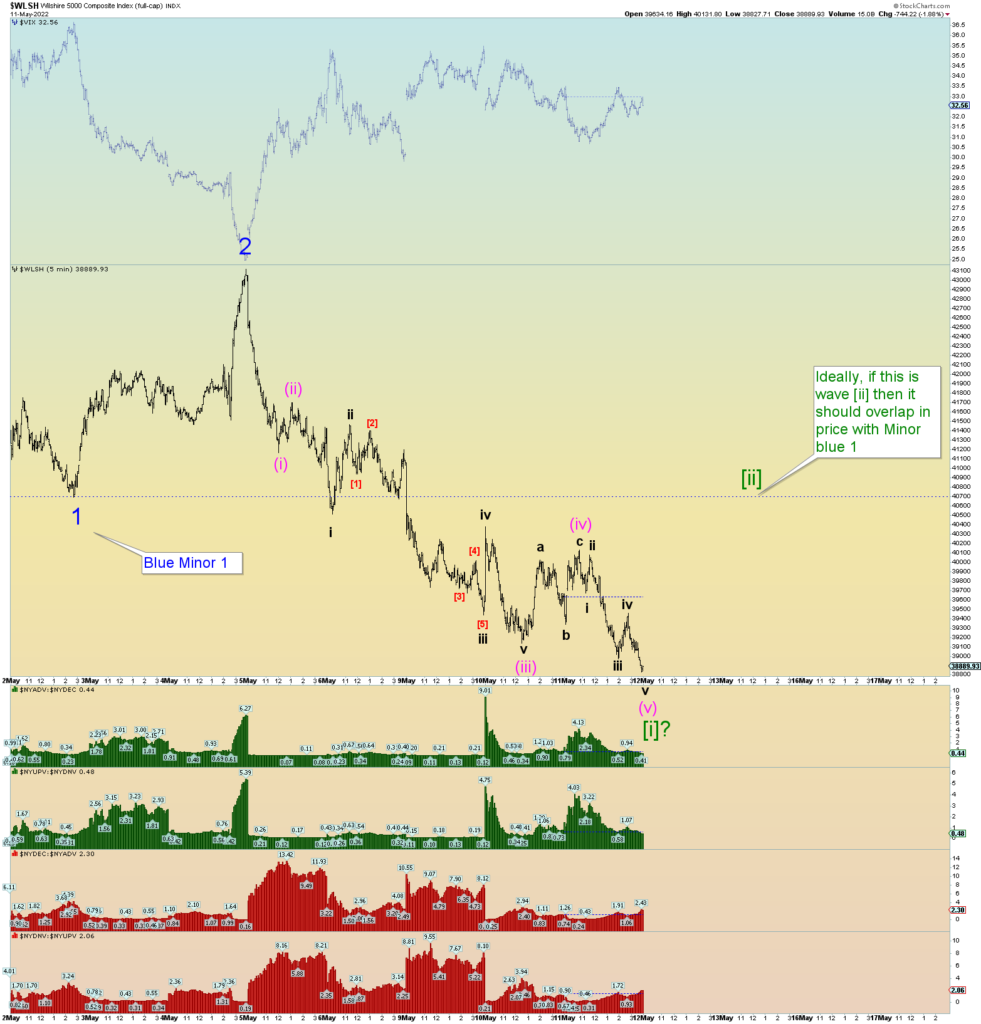
Perhaps I am overcomplicating the squiggles and today was merely the end of Minor blue 1. It is a possibility. But for now, we’ll still call it Minute [i] instead, the next wave degree lower.
The Wilshire 5000 is now officially in a “bear” market as prices have finished today more than 20% from peak. Trying to guess where and how hard the countertrend short-covering “rips” is a bit of a fool’s game I suppose. But the wave structure supports it.
The 10-minute chart is useful for the histrographs showing the NYSE selling pressure. Despite the new price low, the selling was not that bad as far as intensity.
This 5-minute chart shows the proposed wave structure since wave 2. It is a very satisfying 5 wave impulse structure.
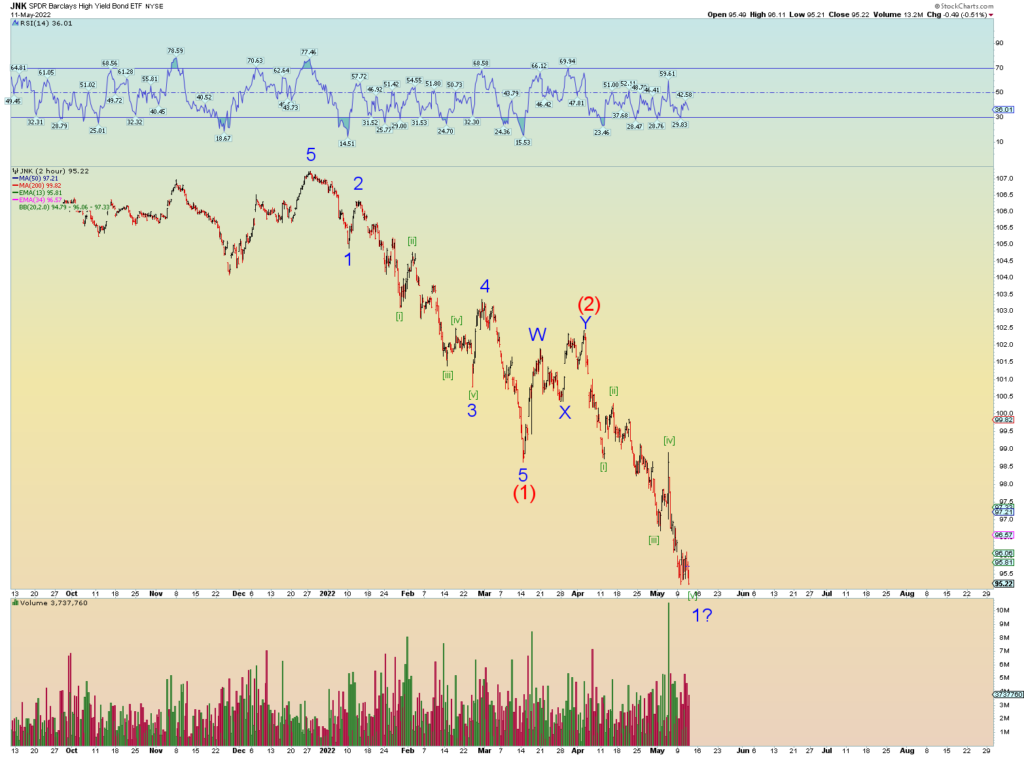
Junk possible count
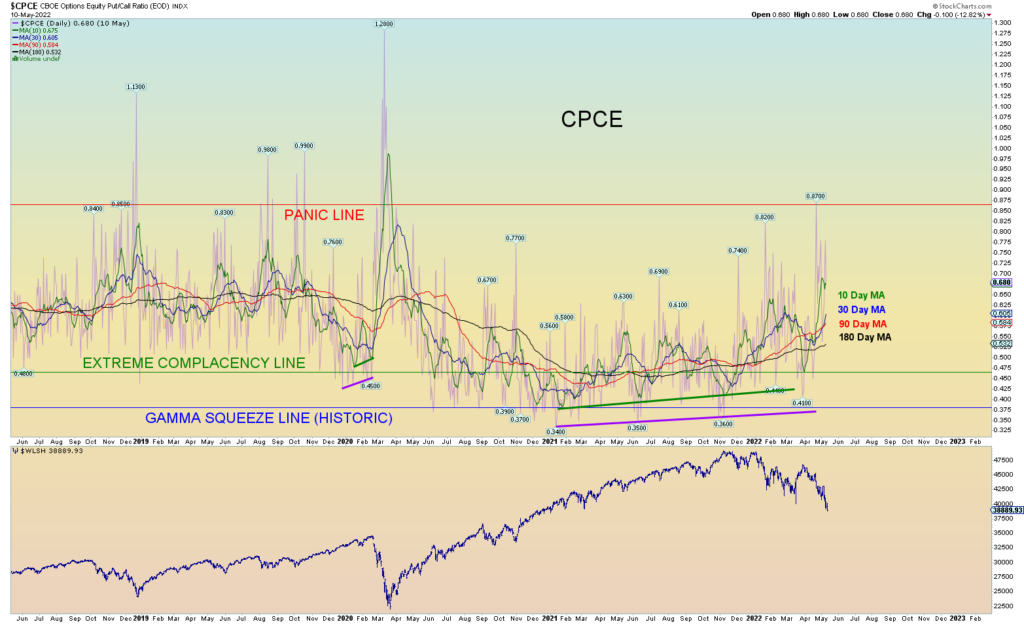
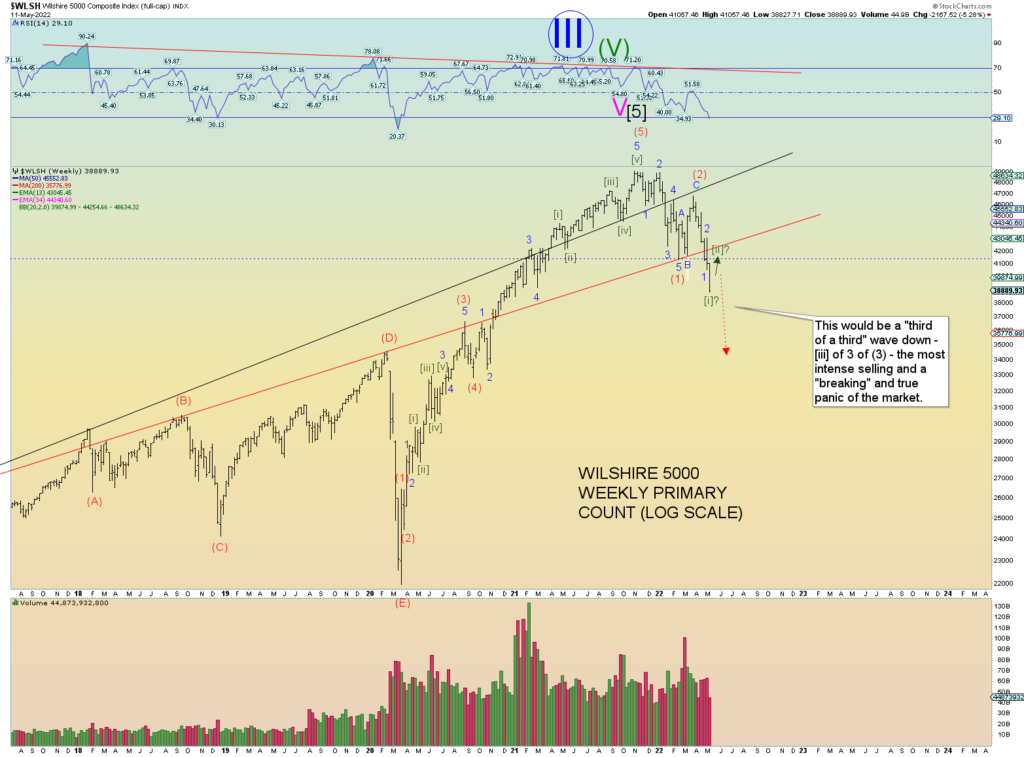
The CPCE is still very tame considering the Wilshire 5000 is now down 20% from peak. There has been no true panic. And the wave structure supports this as the true panic does not come until a “third of a third” wave and below. That would be wave (iii) of [iii] of 3 of (3). We are not quite there yet.
