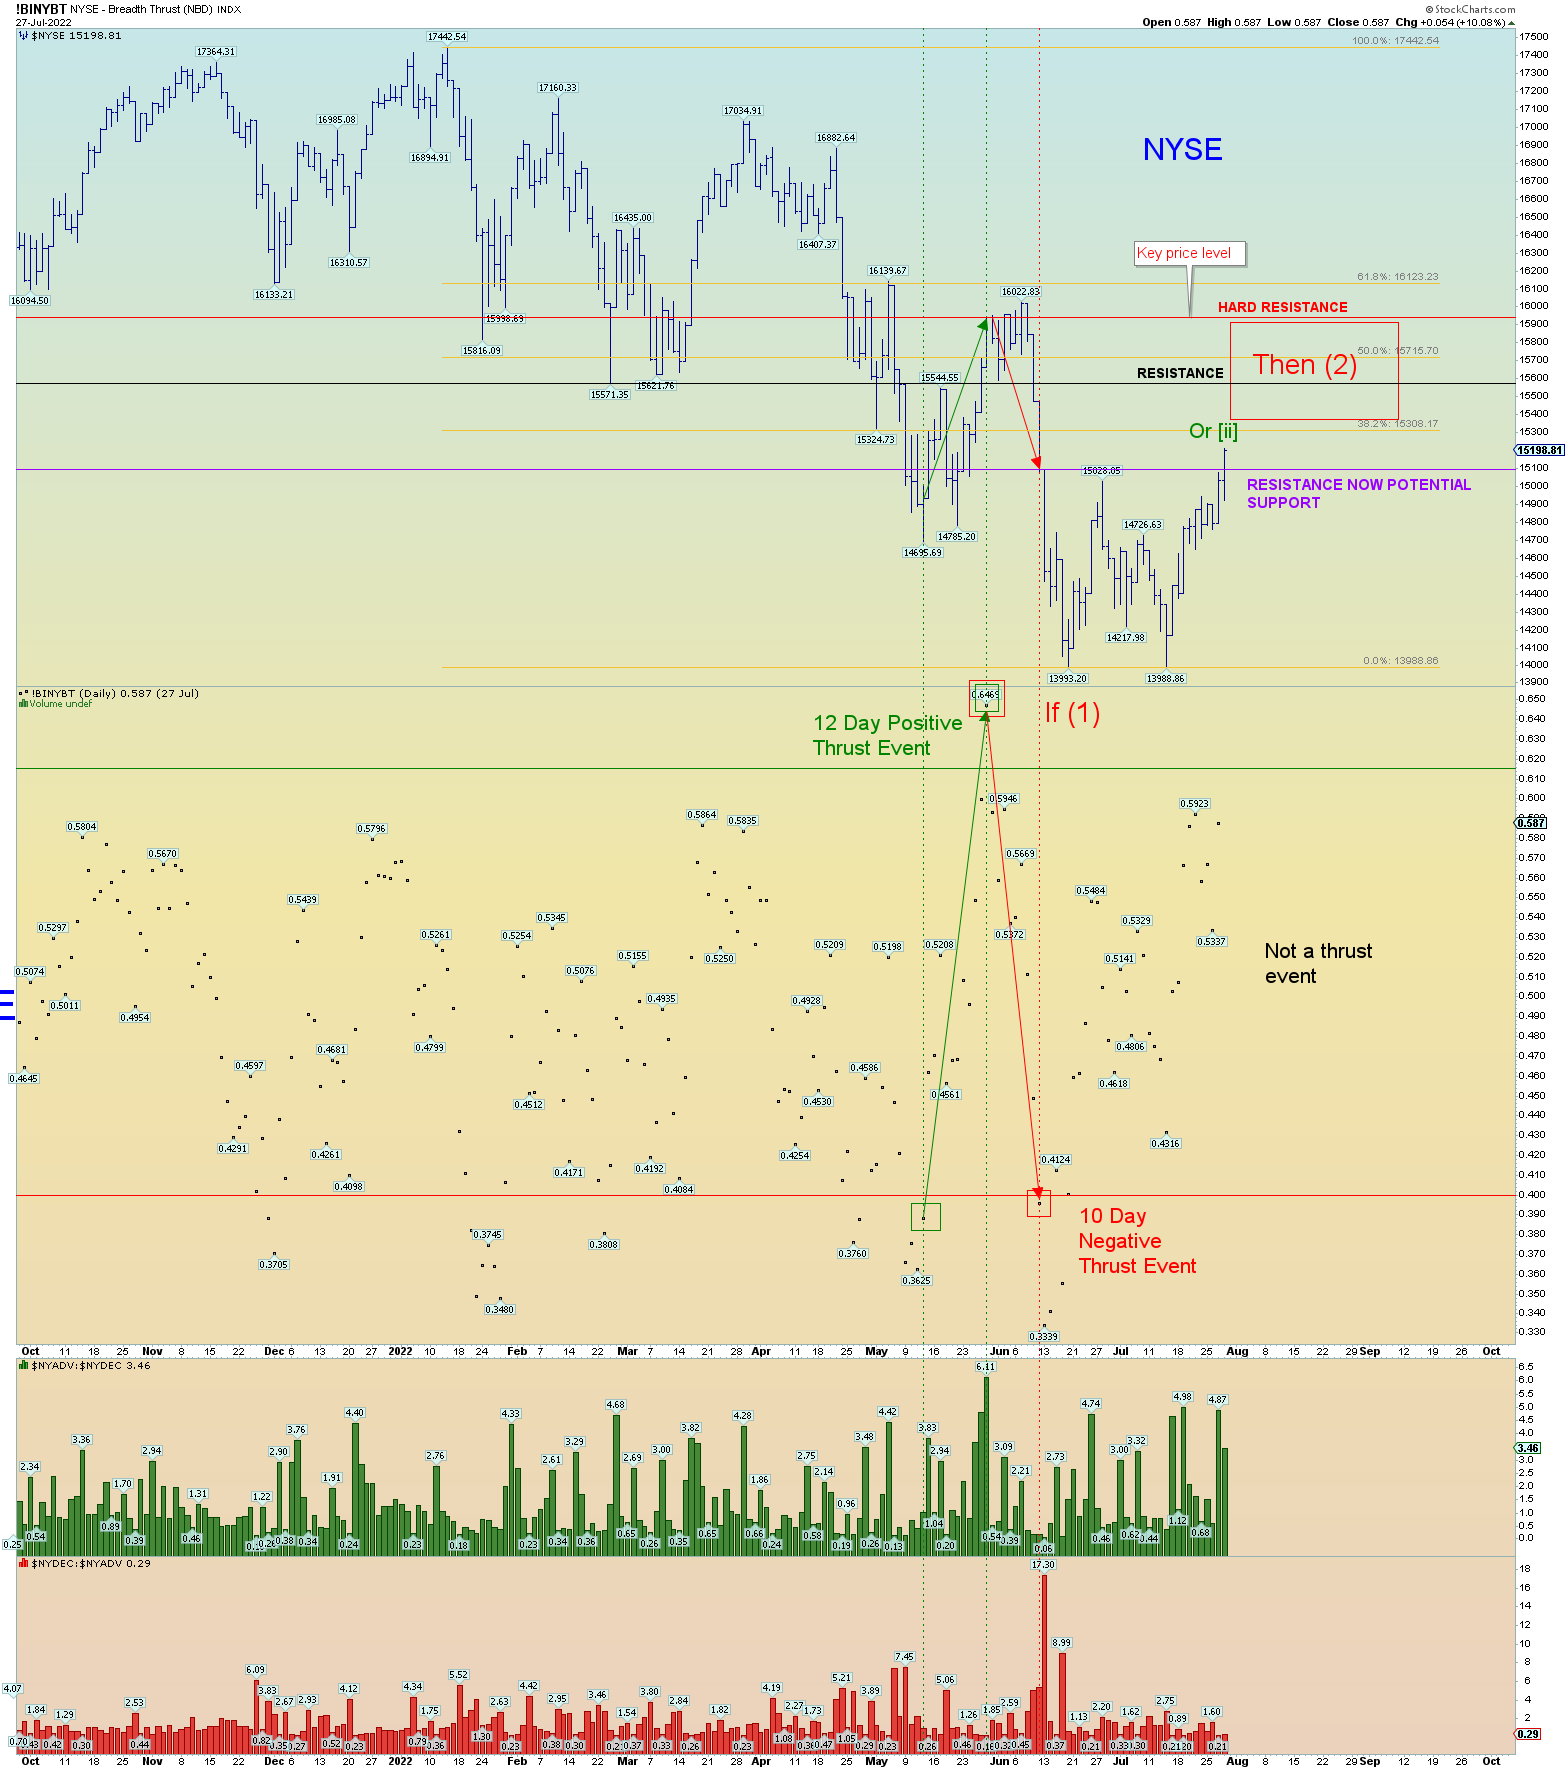
Let’s look at the overall market through the lens of the NYSE which provides key internal market data points worth paying attention to. Specifically, “breadth thrust” events. This is where the market moves from below .40 to above .615 within a significant (least) amount of trading days indicating a major market change of direction. This indicator is built upon a comparison between advancing and declining shares. A move of 10 days or less (to include the start and end points) indicates a “Zweig Breadth Thrust” event (as some guy named “Zweig” invented the concept. It was a keen observation).
Now of course there will be a numerous people who email me saying I am wrong on key details, and they all know better, but they are missing the overall point of this analysis. And besides I am literally using Stockcharts built in indicator called “NYSE Breadth Thrust” so there ya go. Regardless, the analysis of what is happening overall is what is important in this context.
The market experienced a very significant upward breadth thrust “event” of only 12 days during what I called wave 2 of (3) which I had warned at the time was concerningly bullish and indicated the market wanted to perhaps change direction and go higher. I said it would take a “negative” event of more significance to “negate” the positive event. I was confident it would happen because the overall wave count at the time of (1) – (2), 1 – 2, suggested it was due for wave [i] of 3 of (3) down. And that event actually did immediately occur and was in fact historic in that it was only 10 days…a sort of “negative” Zweig Breadth thrust to the reverse.
And the market has paused and regrouped. On the NYSE prices even “tested” its mid-June low. And now over the last 2 days we have a pop over resistance finally and it’s off to the races to the next resistance. Yet the market has not had a significant breadth thrust positive “event” to accompany. On the contrary it has been in neutral territory for quite a while. Sentiment-wise sellers were exhausted and so were buyers. Now we have a flip toward buyers, but is it a strong flip? I say no.
In other words, the market has not had a positive thrust event to “wipe” out the significant 10-day negative event – it did not have mid-June “V” bottom bounce. Based on this fact, I propose the NYSE will NOT regain the 16,022-pivot high, no matter if we count this rally as Intermediate (2) or whatever.
(And the most obvious targets if all indexes would be all the down sloping 200 DMA’s. But this analysis is deeper than that!)
Therefore, with all that in mind, we have our overall count based on if the market keeps rallying or not. If it does, we can confidently call it Intermediate wave (2) instead of a series of (1) – (2), 1 – 2, [i] – [ii].
But my proposed overall analysis is that the market will severely flush down again based on the negative Zweig Breadth event still being “intact” and therefore “in effect”. A hidden sore spot to traders. In other words, the big players are waiting to unload billions upon further price moves (or even starting right here) up based on the pre-existing sentiment is THAT THEY WANT OUT at these price levels.
Prices have entered into the candles where the negative Zweig event occurred. If the previous “I want out at this price” still exists (as proof of the negative event occurring at these levels), that sentiment, since it has not been “negated” by a positive event, still exists at these price levels.
Now all this to say, perhaps I’m just blustering on about simple price support and resistance. But in this case, this resistance is accompanied by “evidence” of an overwhelming sentiment to get out of the market based on a historic “negative thrust event” price change still in effect. Ok I am probably beating a dead horse by now, but that is how I am viewing this market.
It is one thing to say that there is resistance here and could bring out sellers, it is another to say there is historic resistance and evidence that the big money is about to unload on retail once again.
Again, I am only using the NYSE for this analysis because that is what the indicator data relates to. So, we could still in fact be in wave [ii] of 3 of (3) if prices unload immediately. Otherwise, wave (2) makes more sense even if the previous pivot @16,022 is never regained which is my prediction.
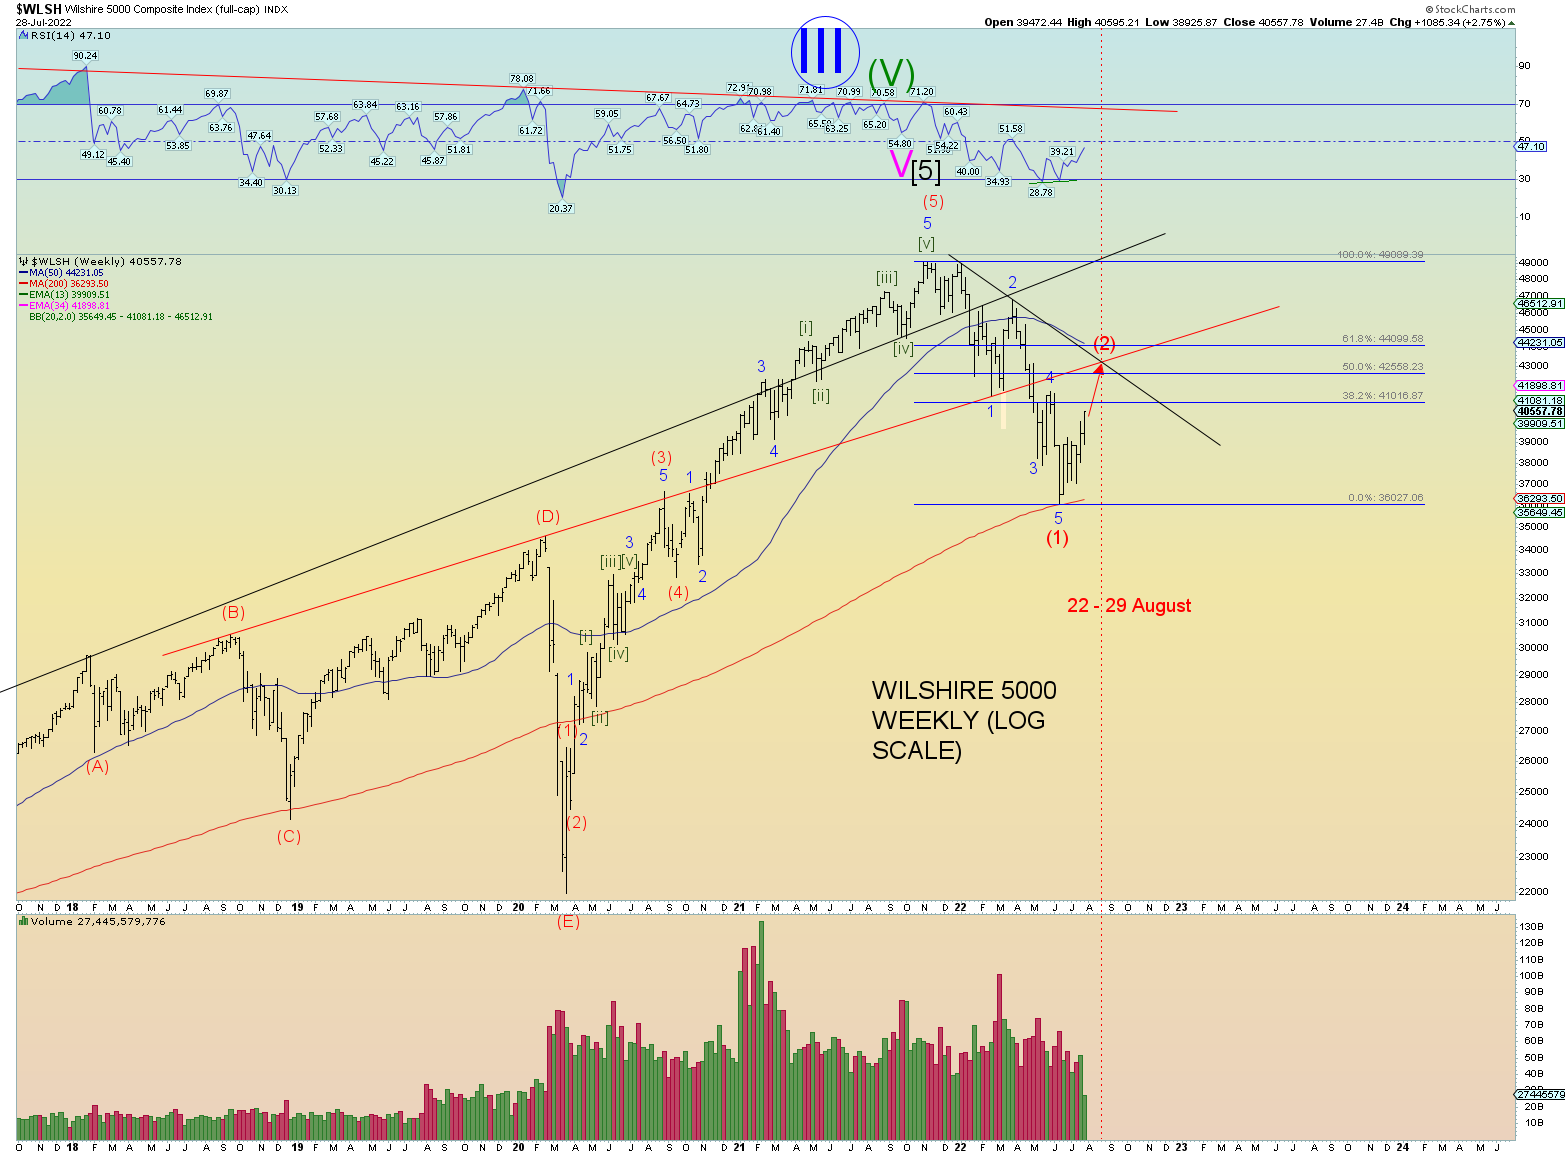
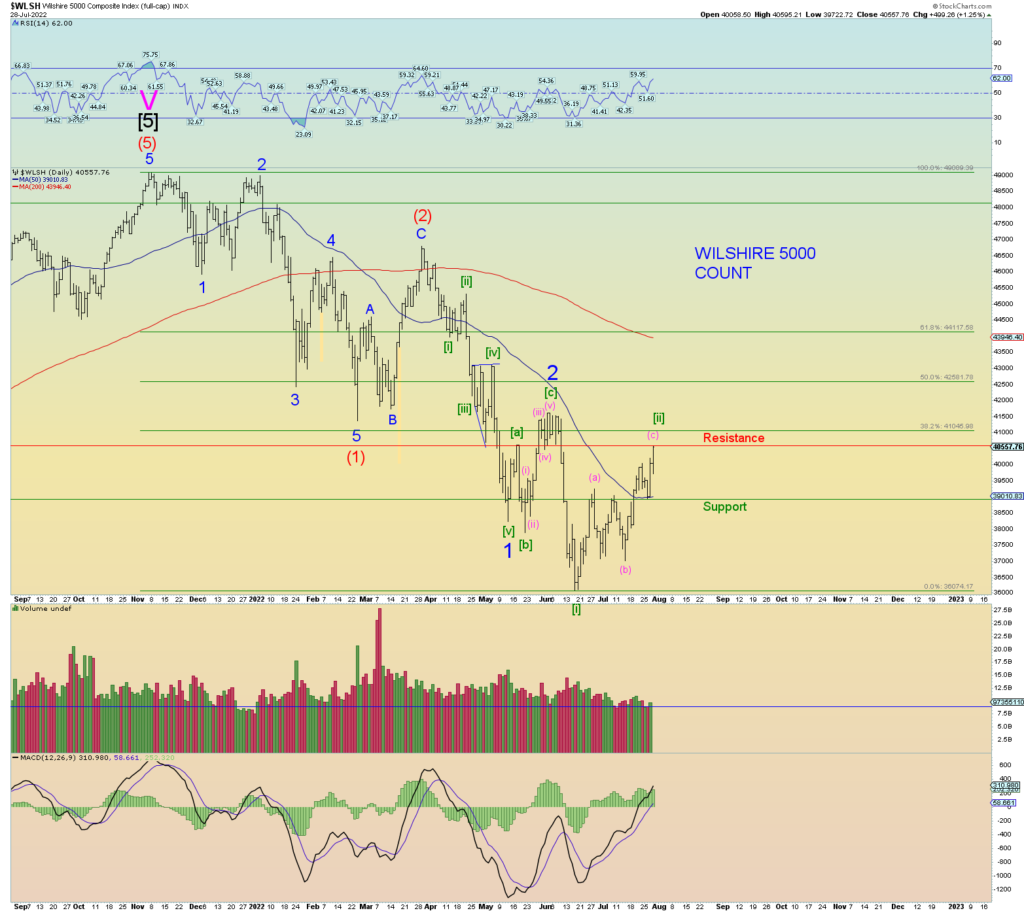
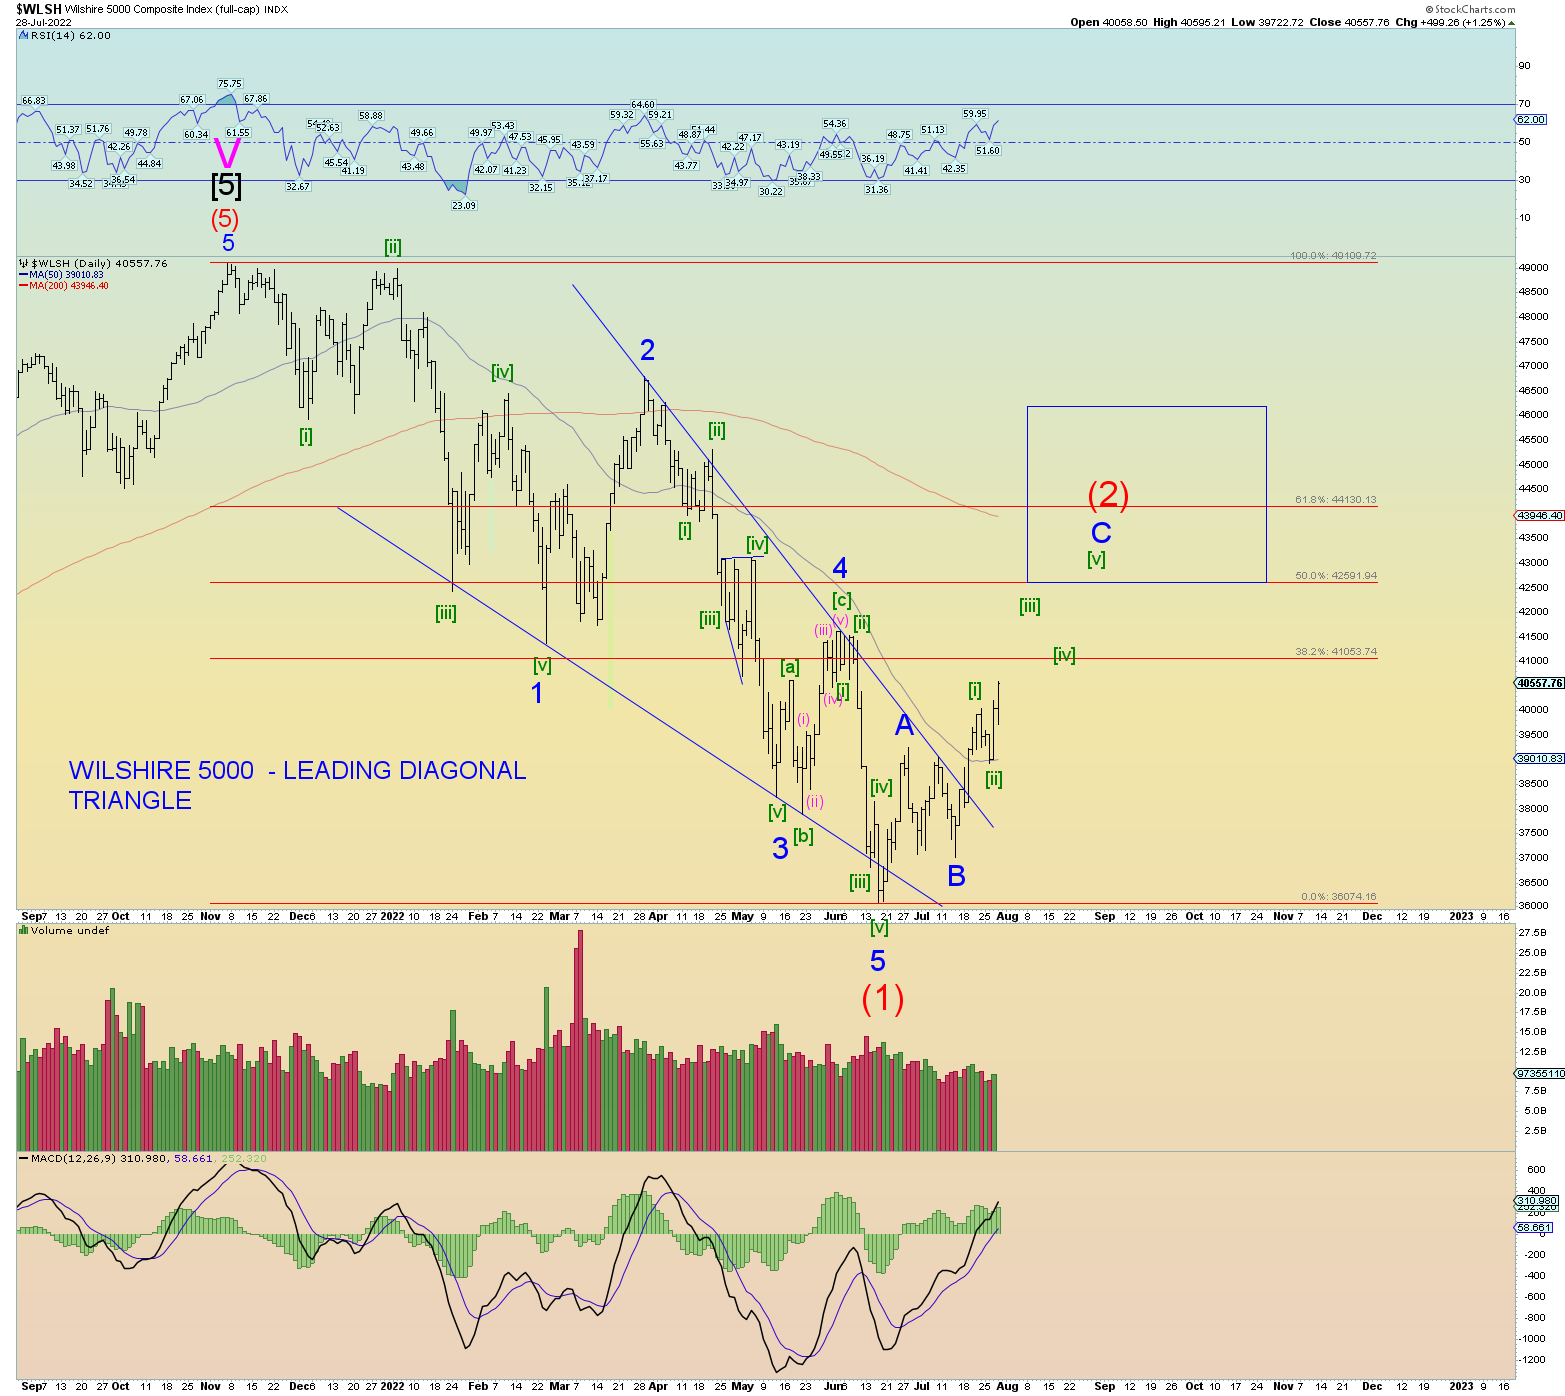
Wilshire 5000 can still be called a Minute [ii] but it is best labeled as a double zigzag. Additionally, prices should be turning now. It is at its own resistance.
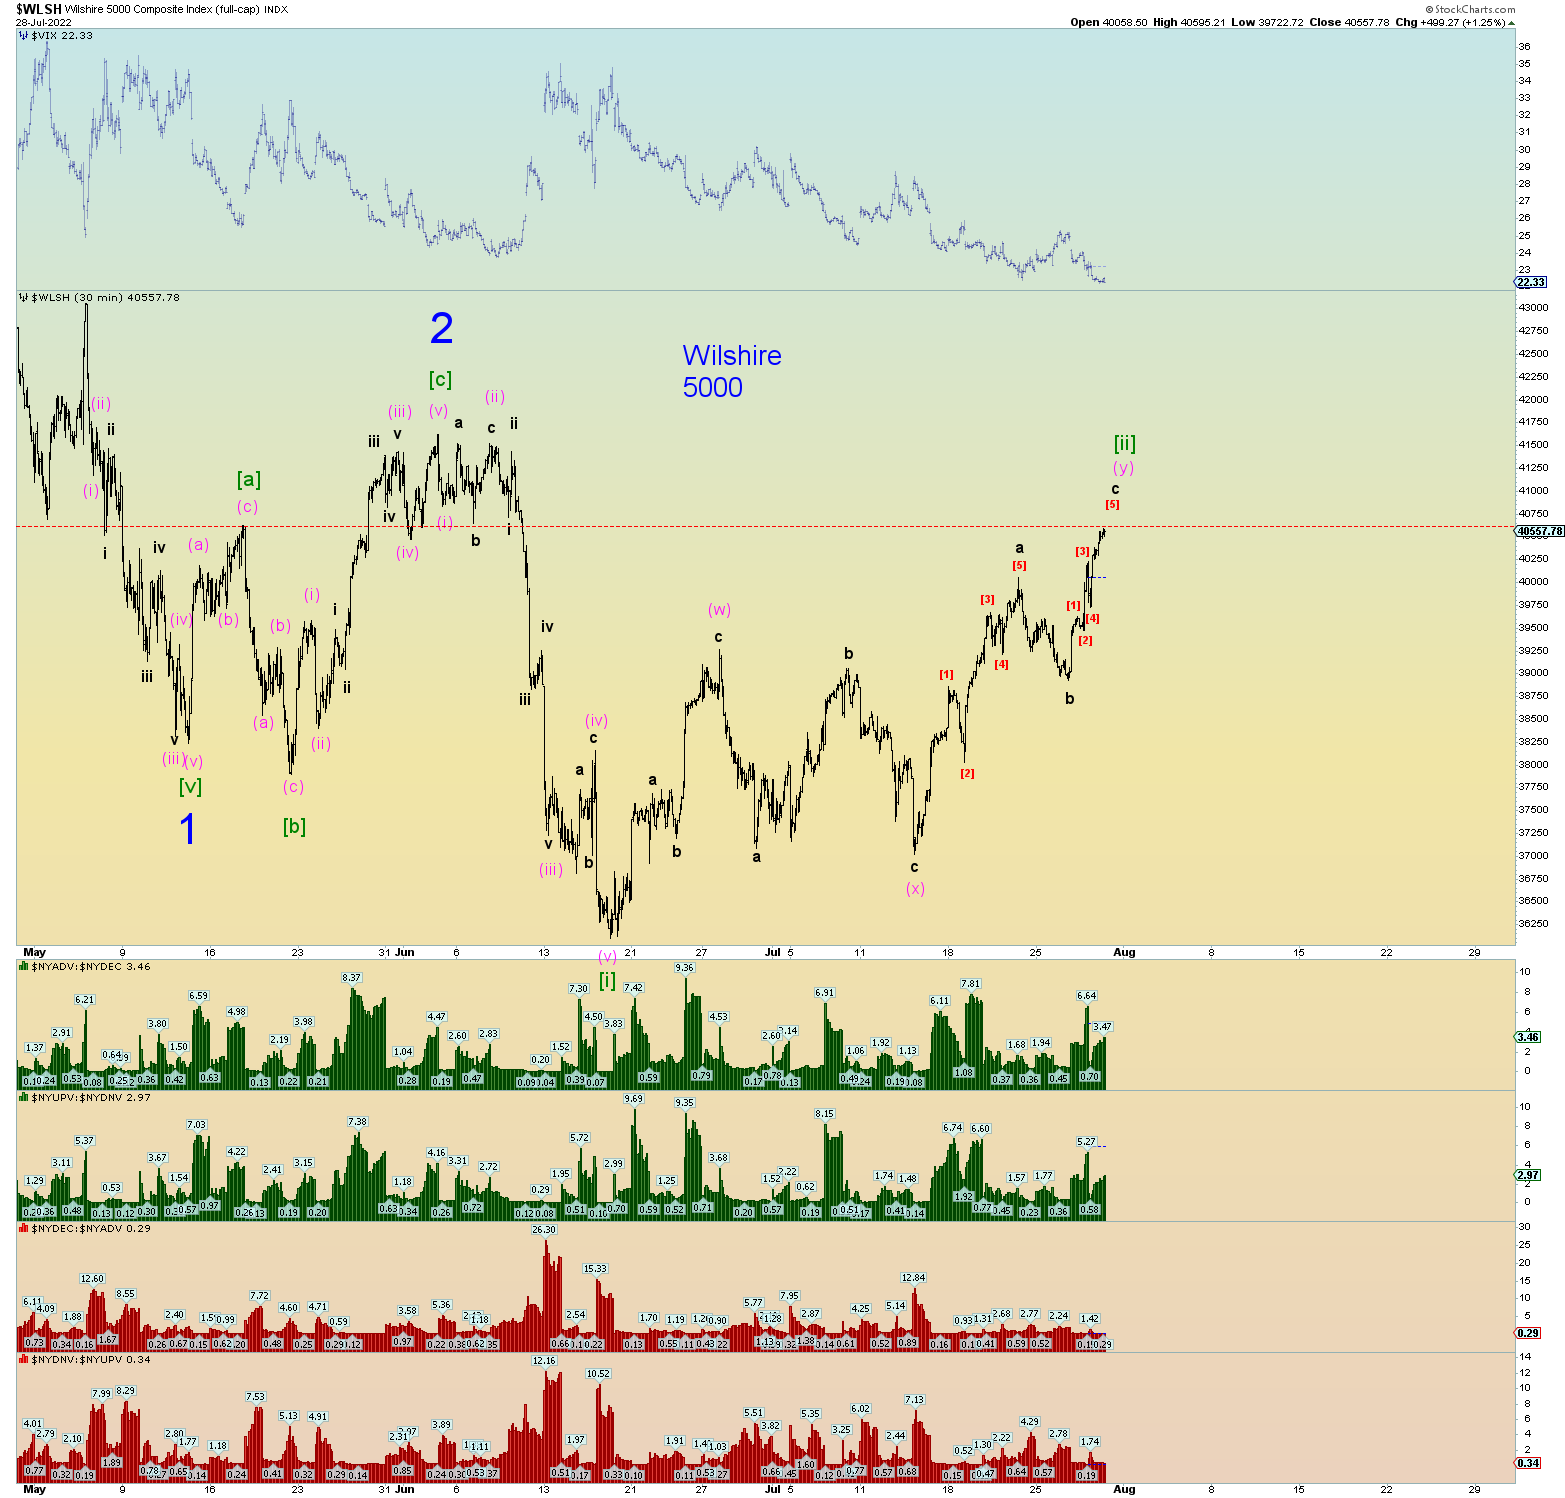
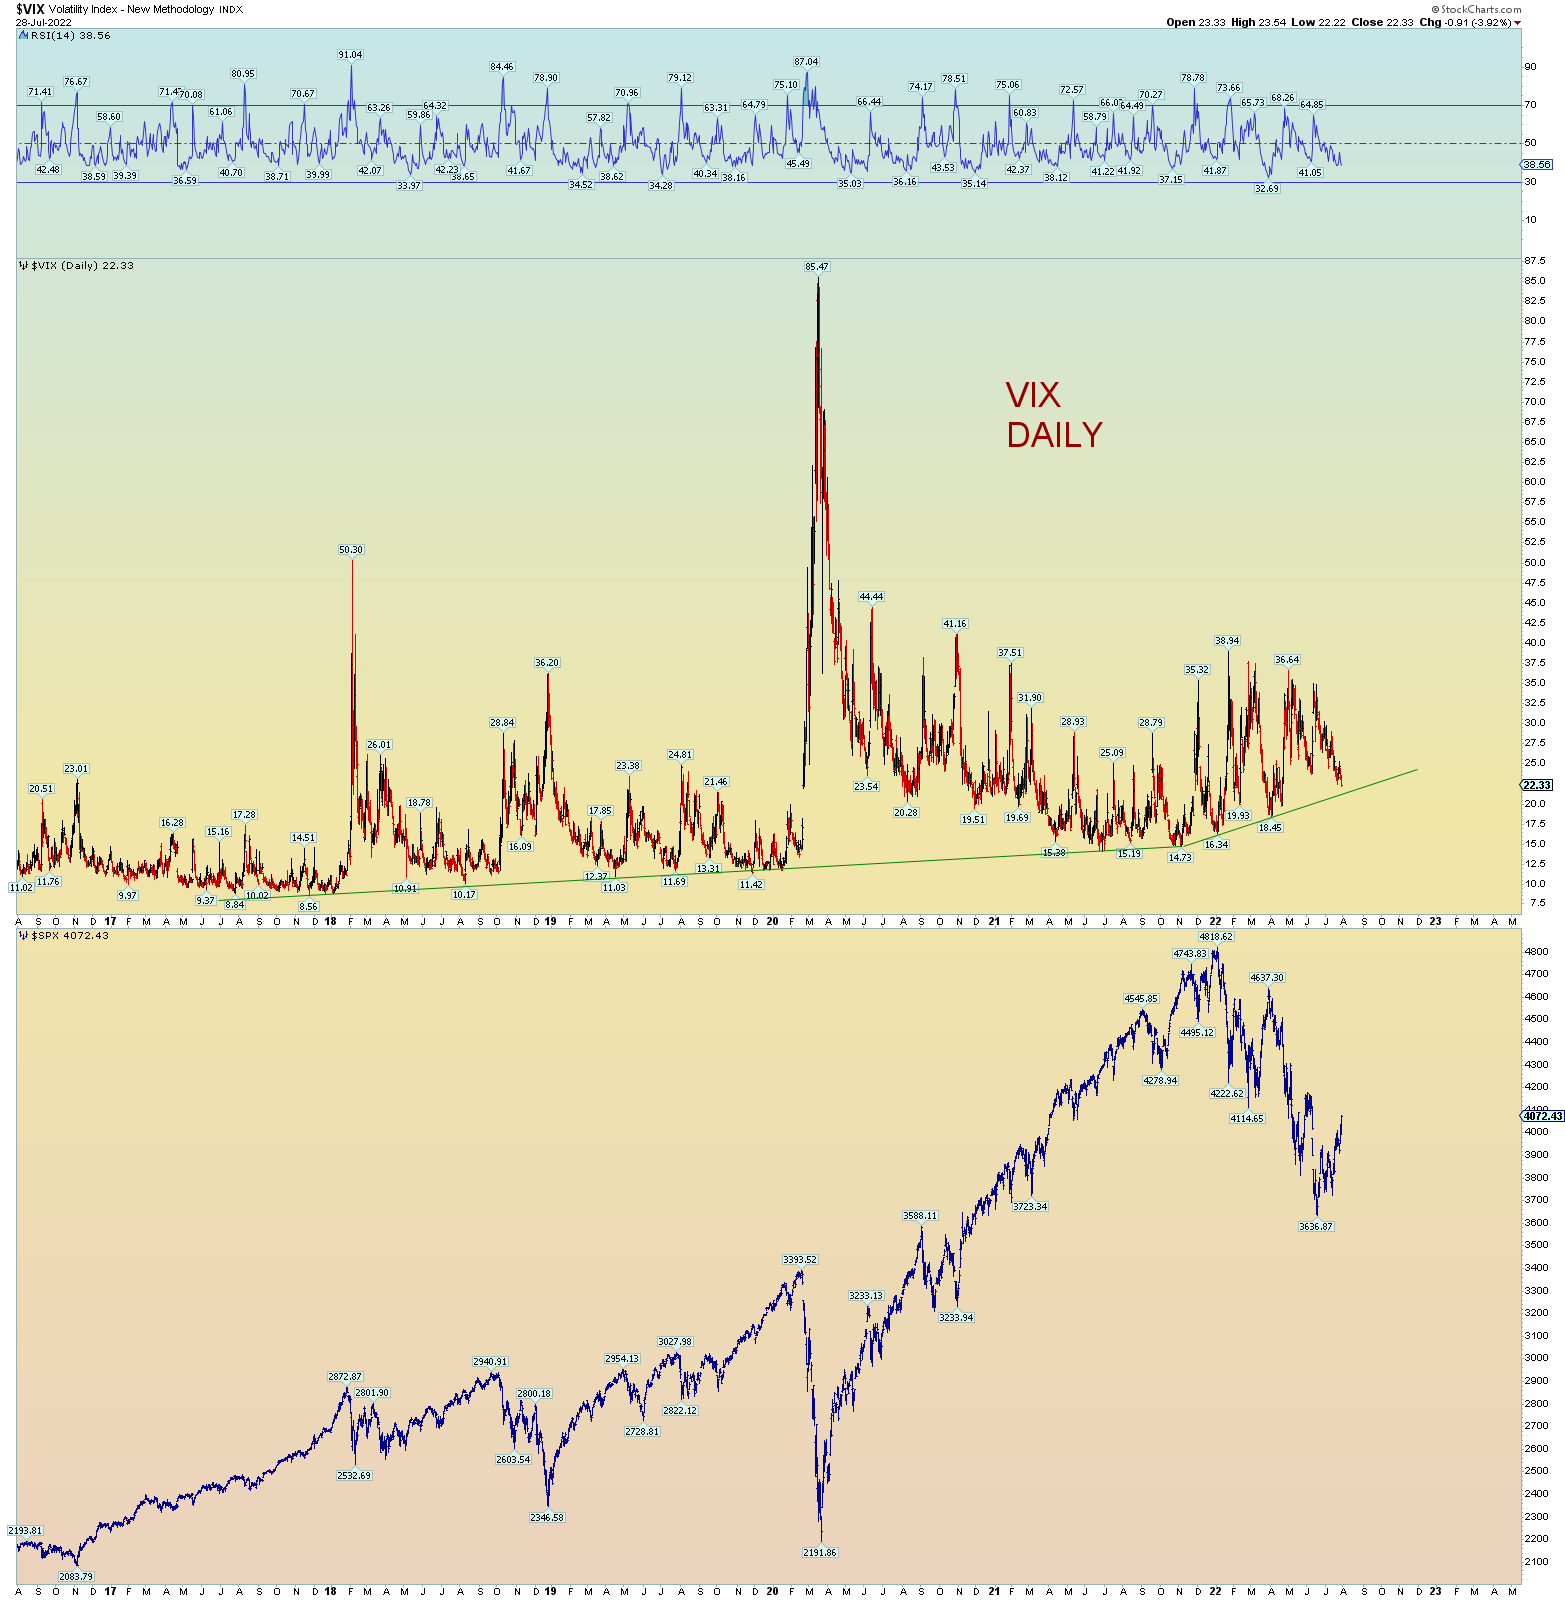
The VIX was hesitant today and still holds the upsloping line.
The Wilshire 5000 has not reached its 38.2% retrace Fib yet. And has ran into underside resistance. I am not giving up on the count Minute [ii] just yet. Because it means the market is about to flush itself with greater force in wave [iii] of 3 of (3) down. And we have reason – as outline in my analysis above – that it could very well be a Black Friday or a Black Monday. Otherwise nm, lol.
Ok even if the NYSE never regains 16,022, yet prices rally upwards a bit during most of lazy August, we have our counts worked out.
And the Wilshire weekly. A backtest of both lines could be in the works. And even if the Wilshire prices reach here, the NYSE will not regain 16,022 is my proposal.