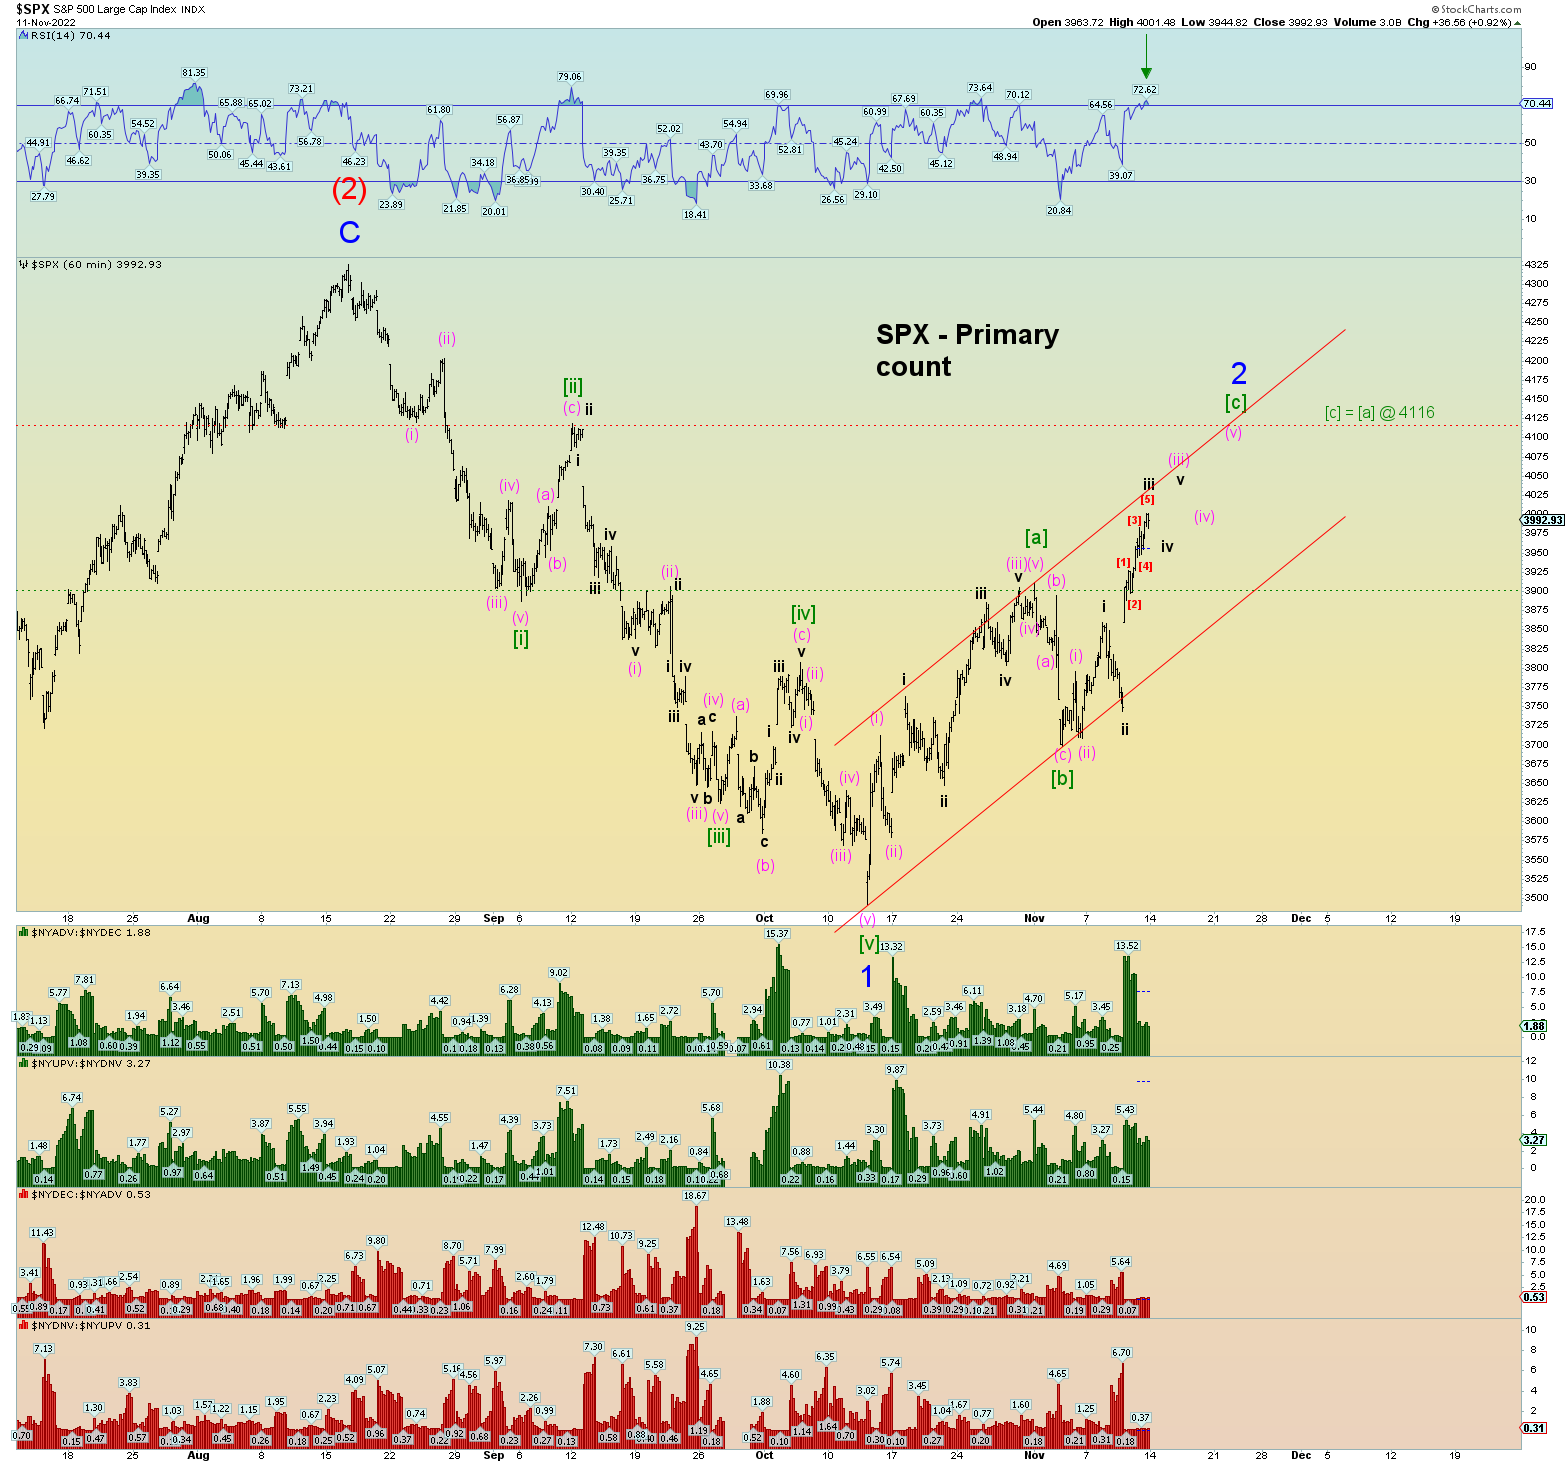
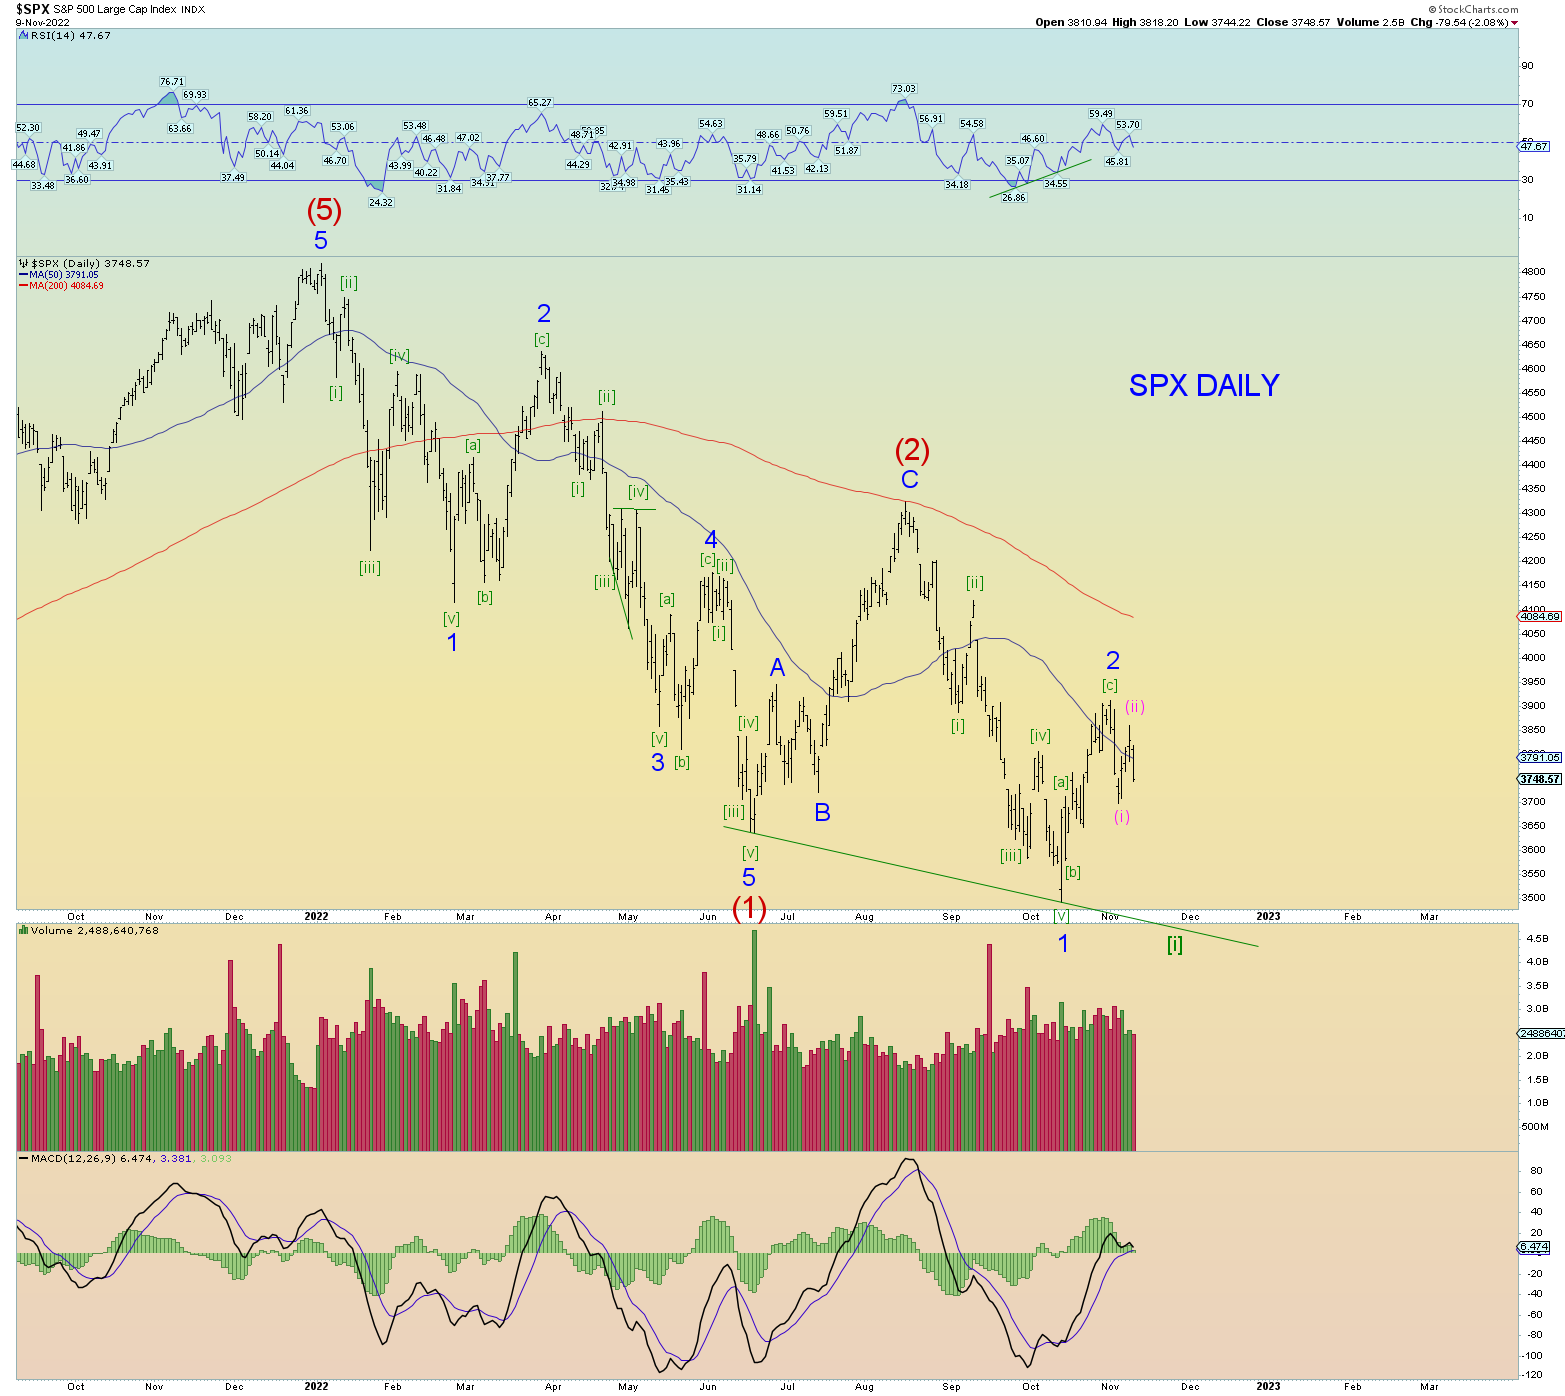
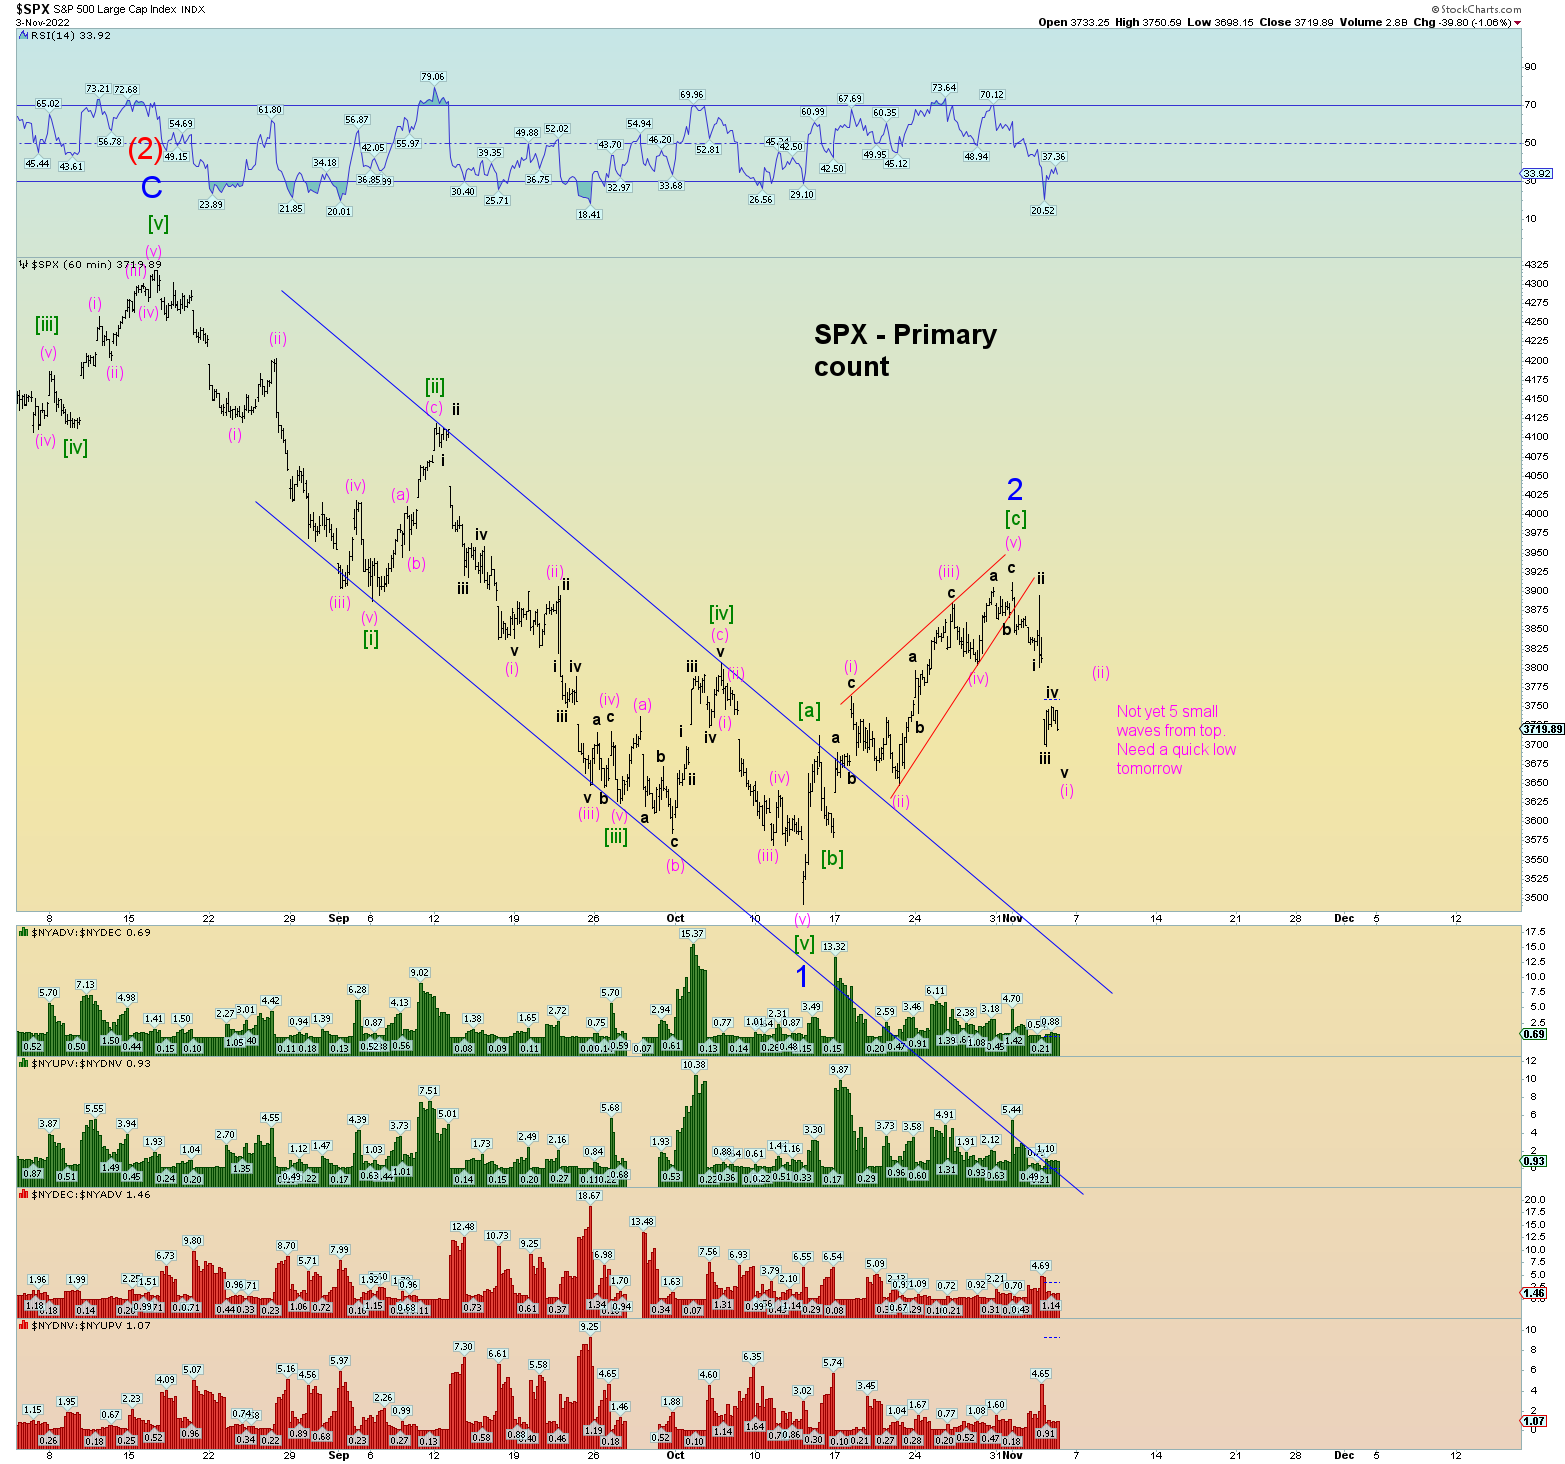
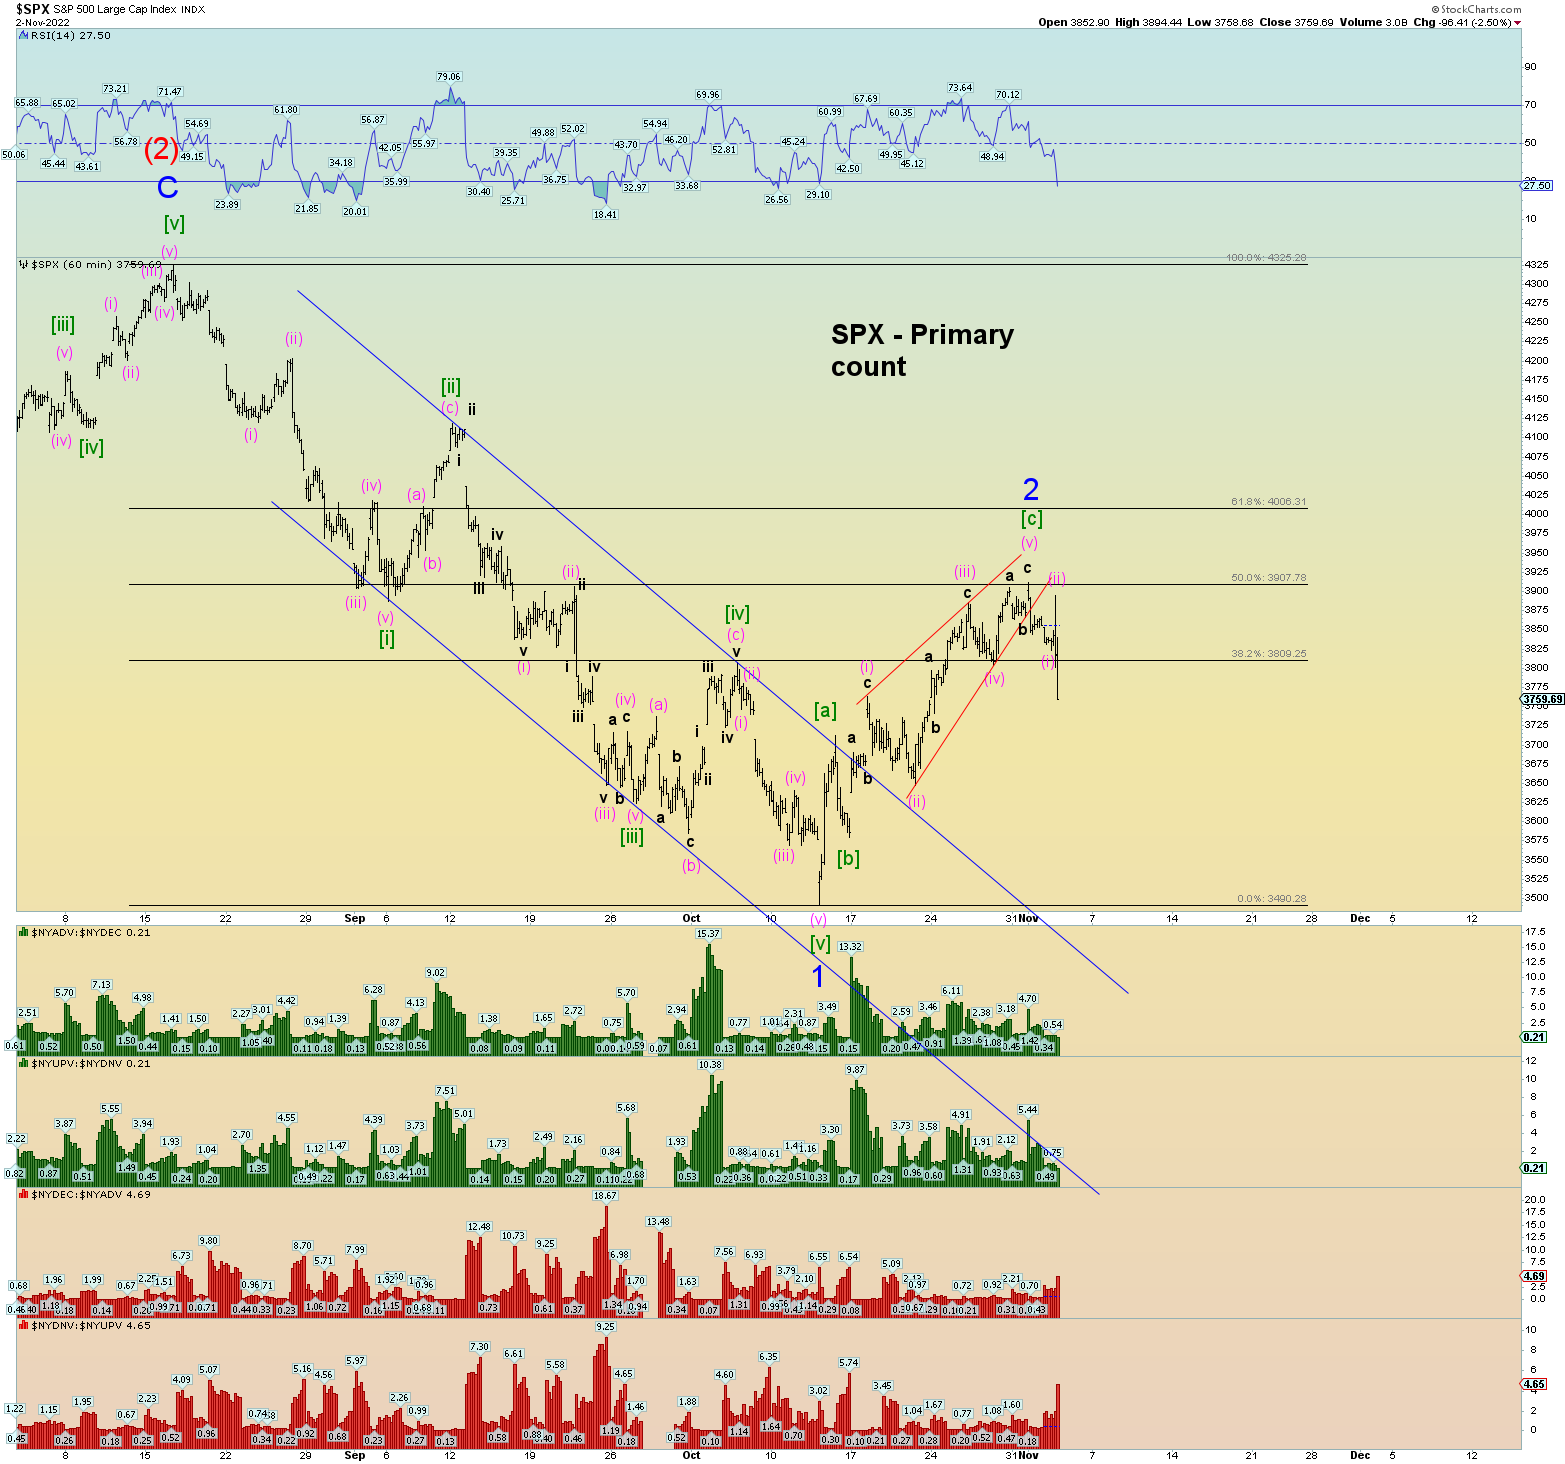
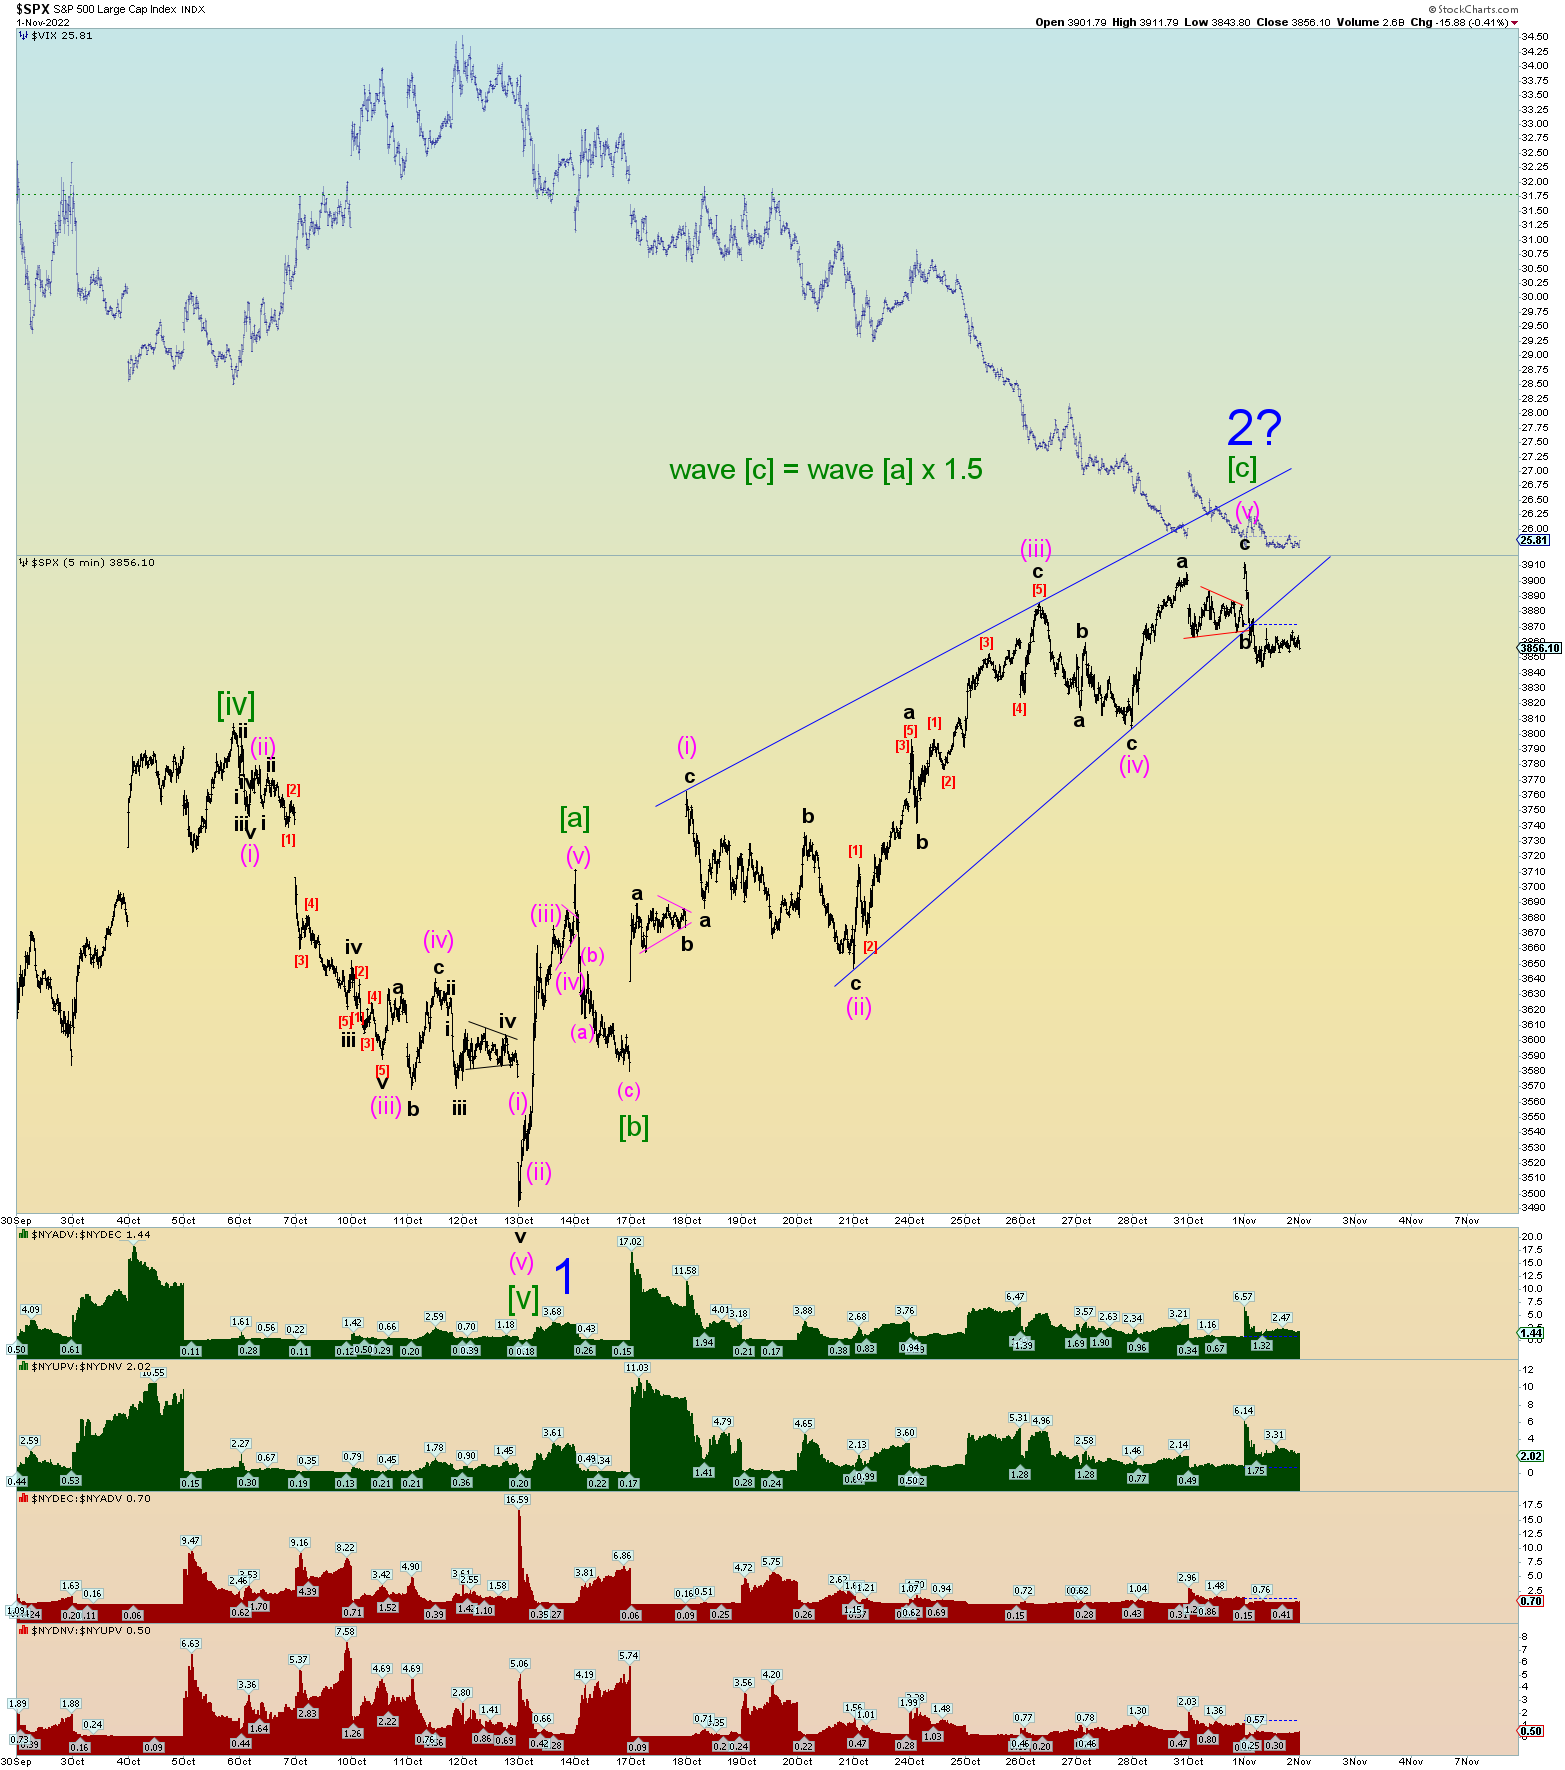
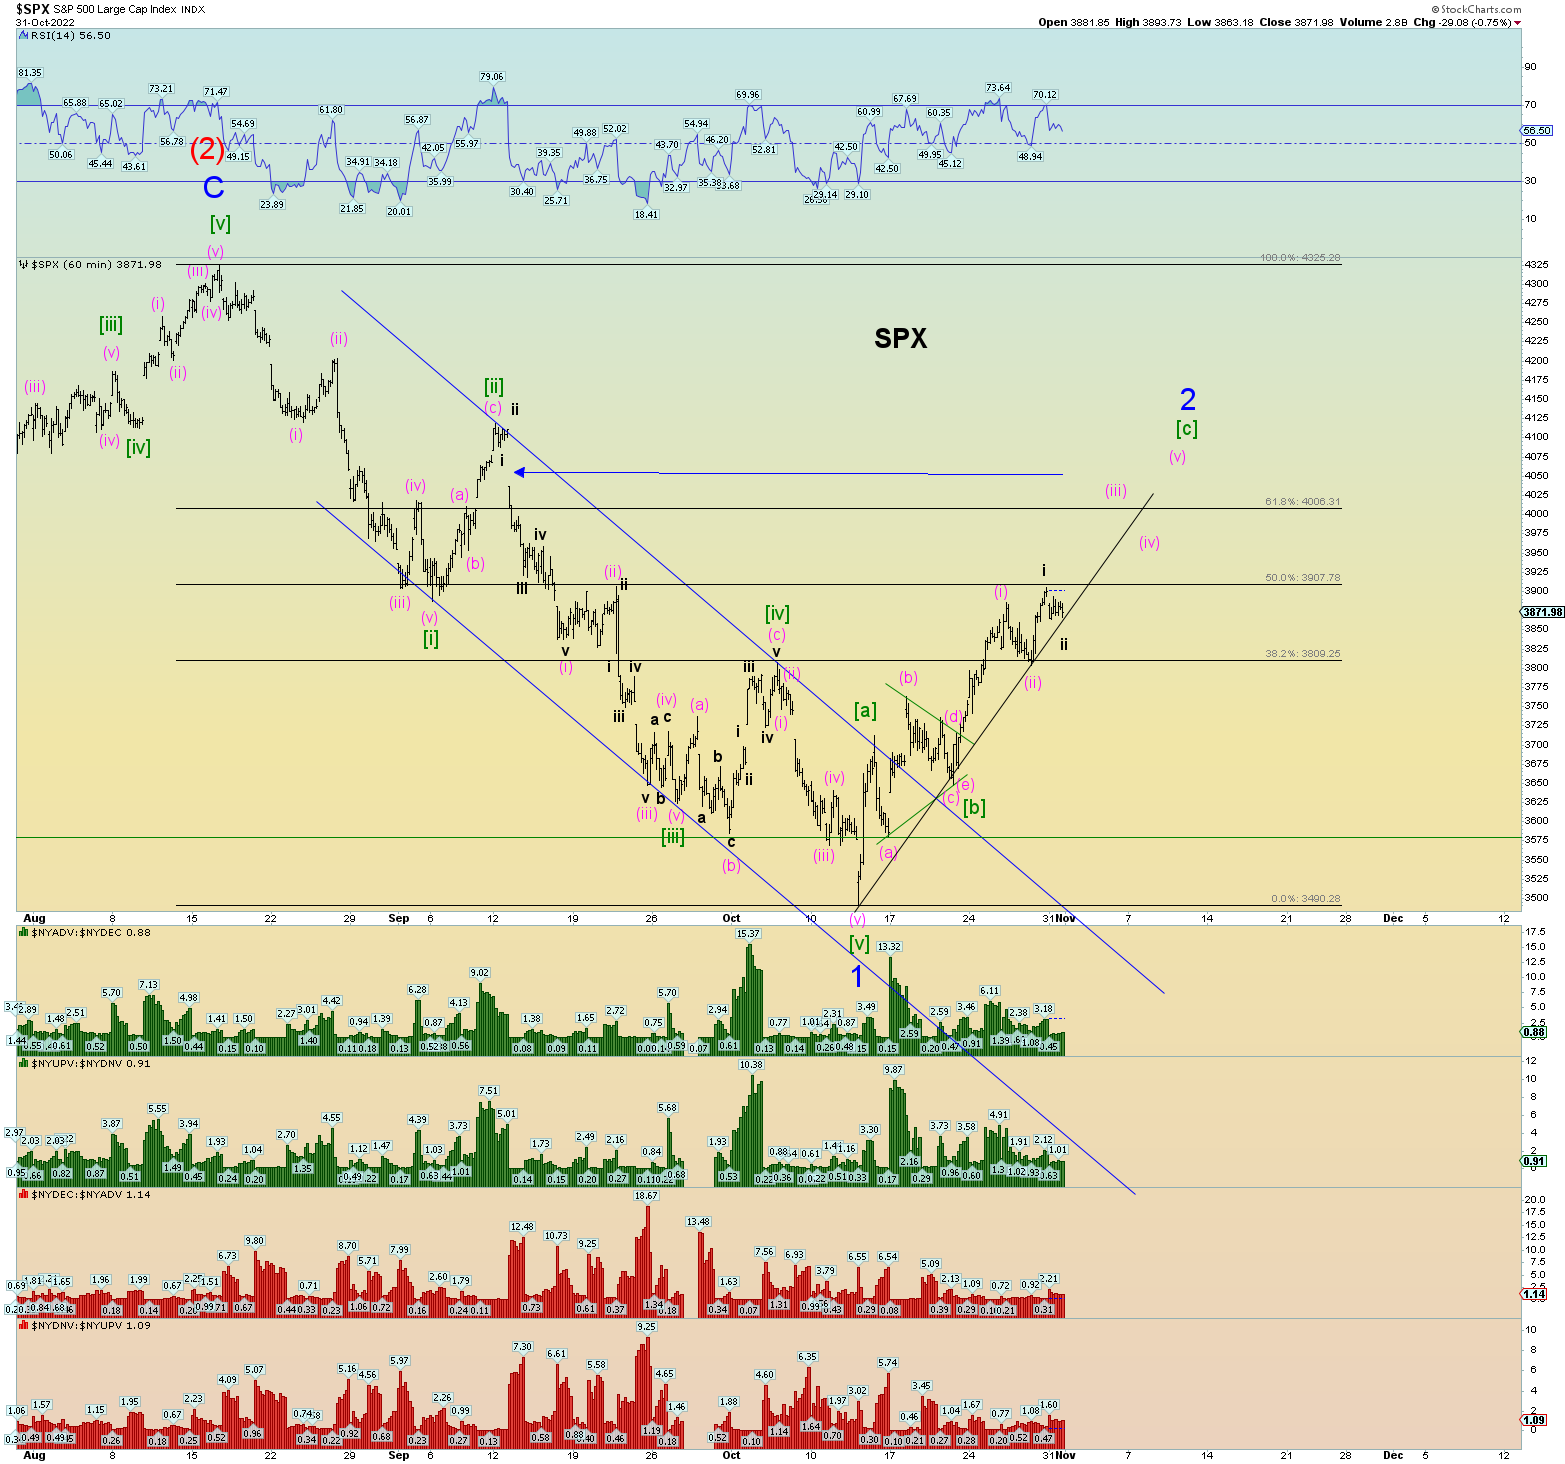
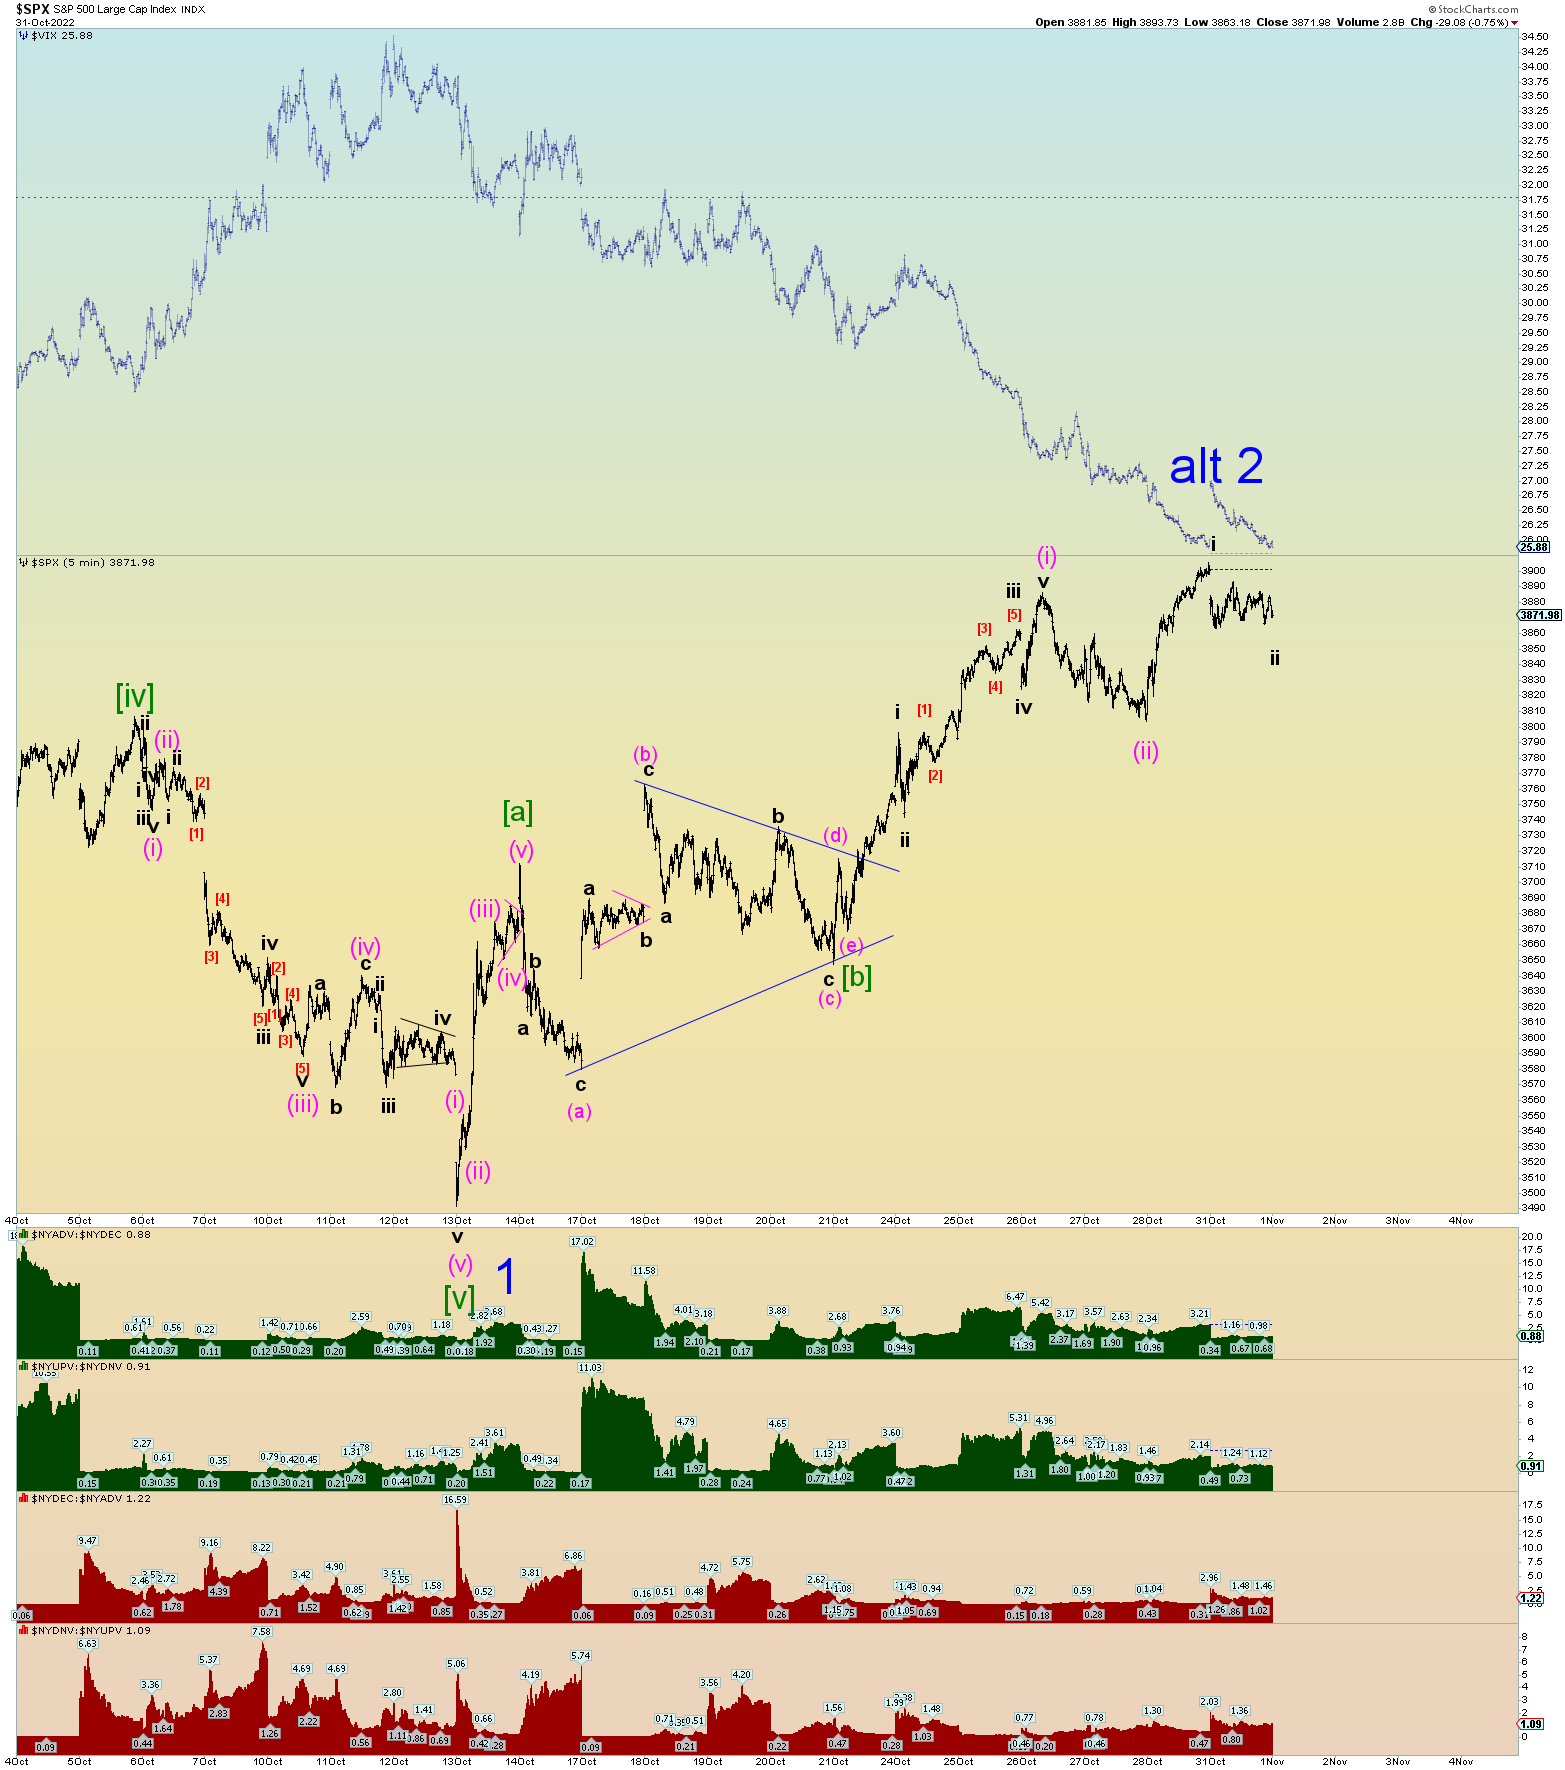
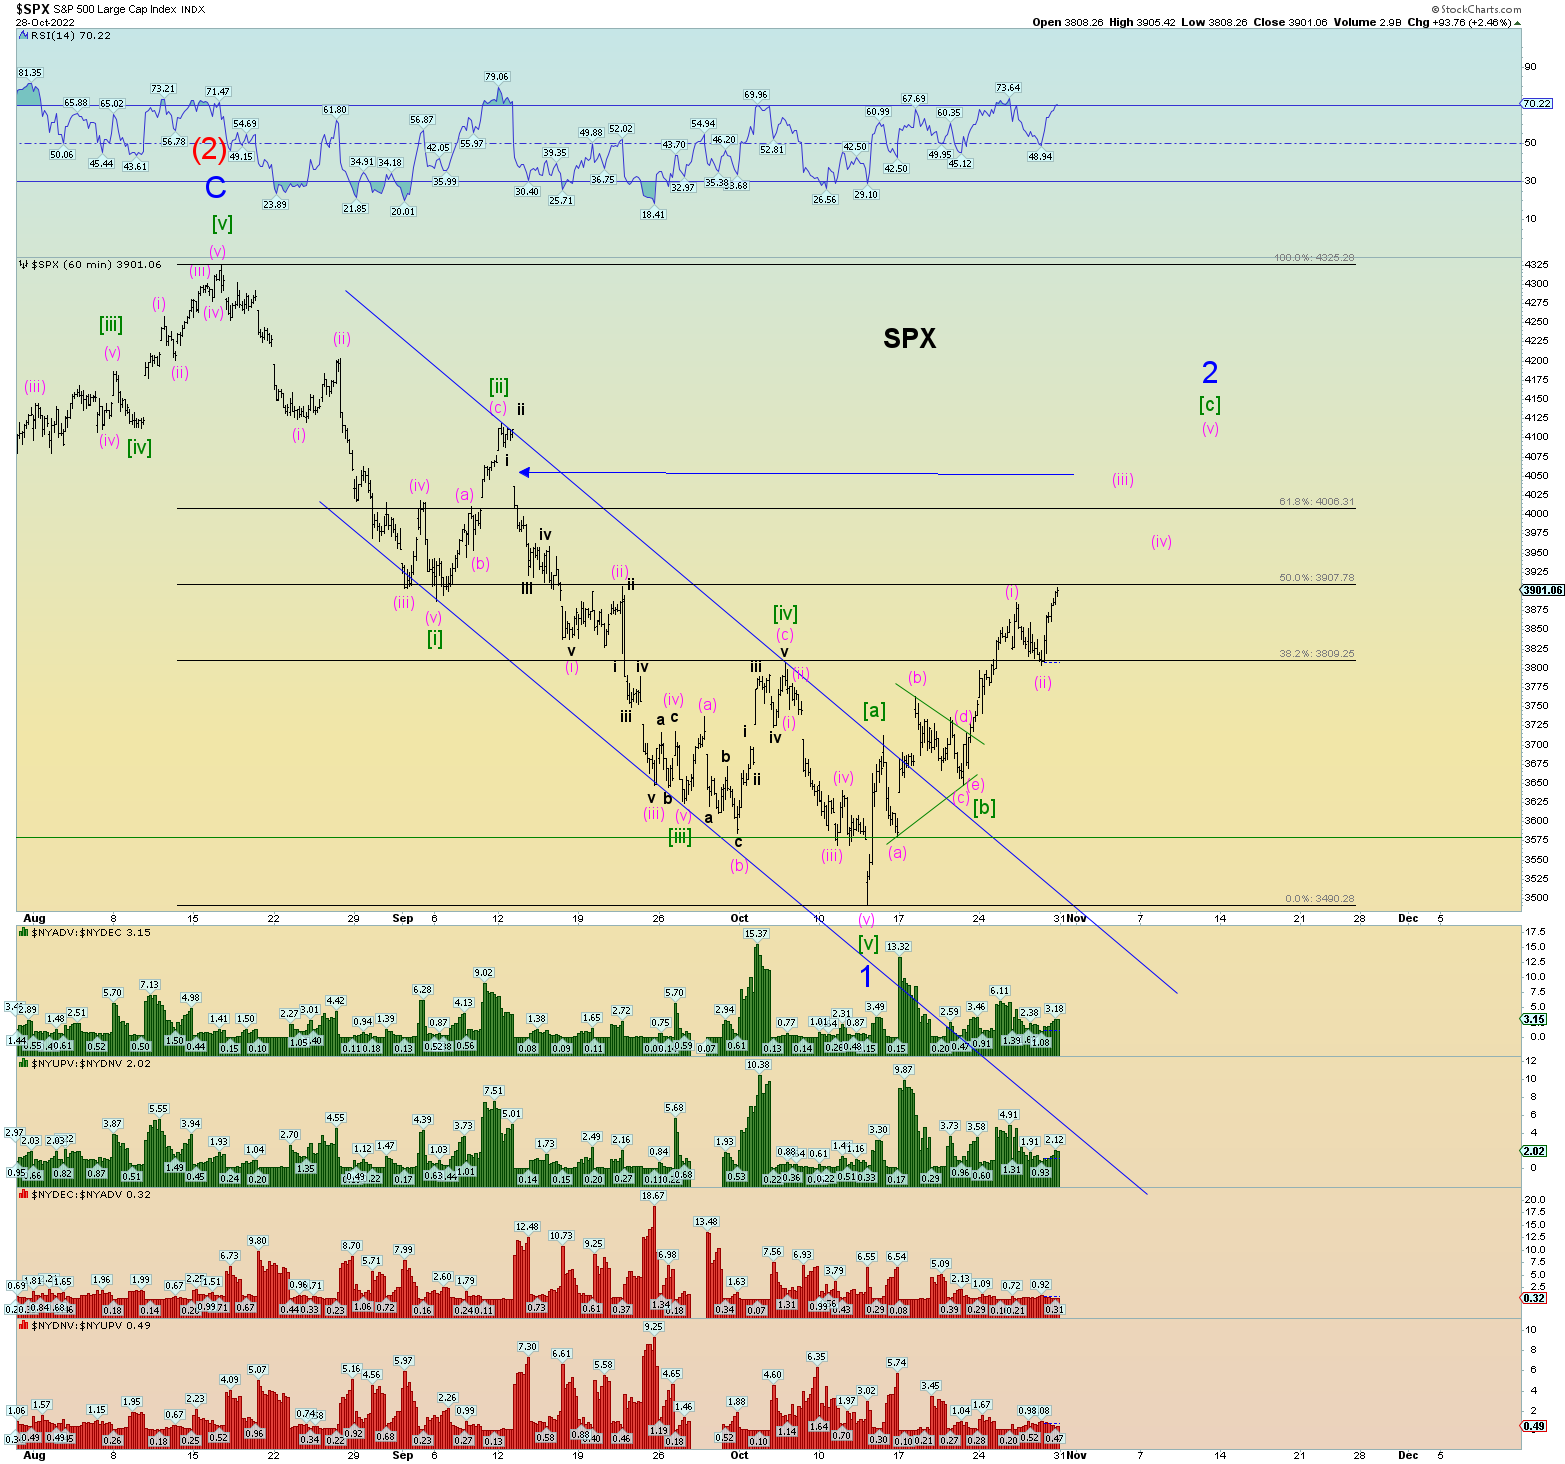
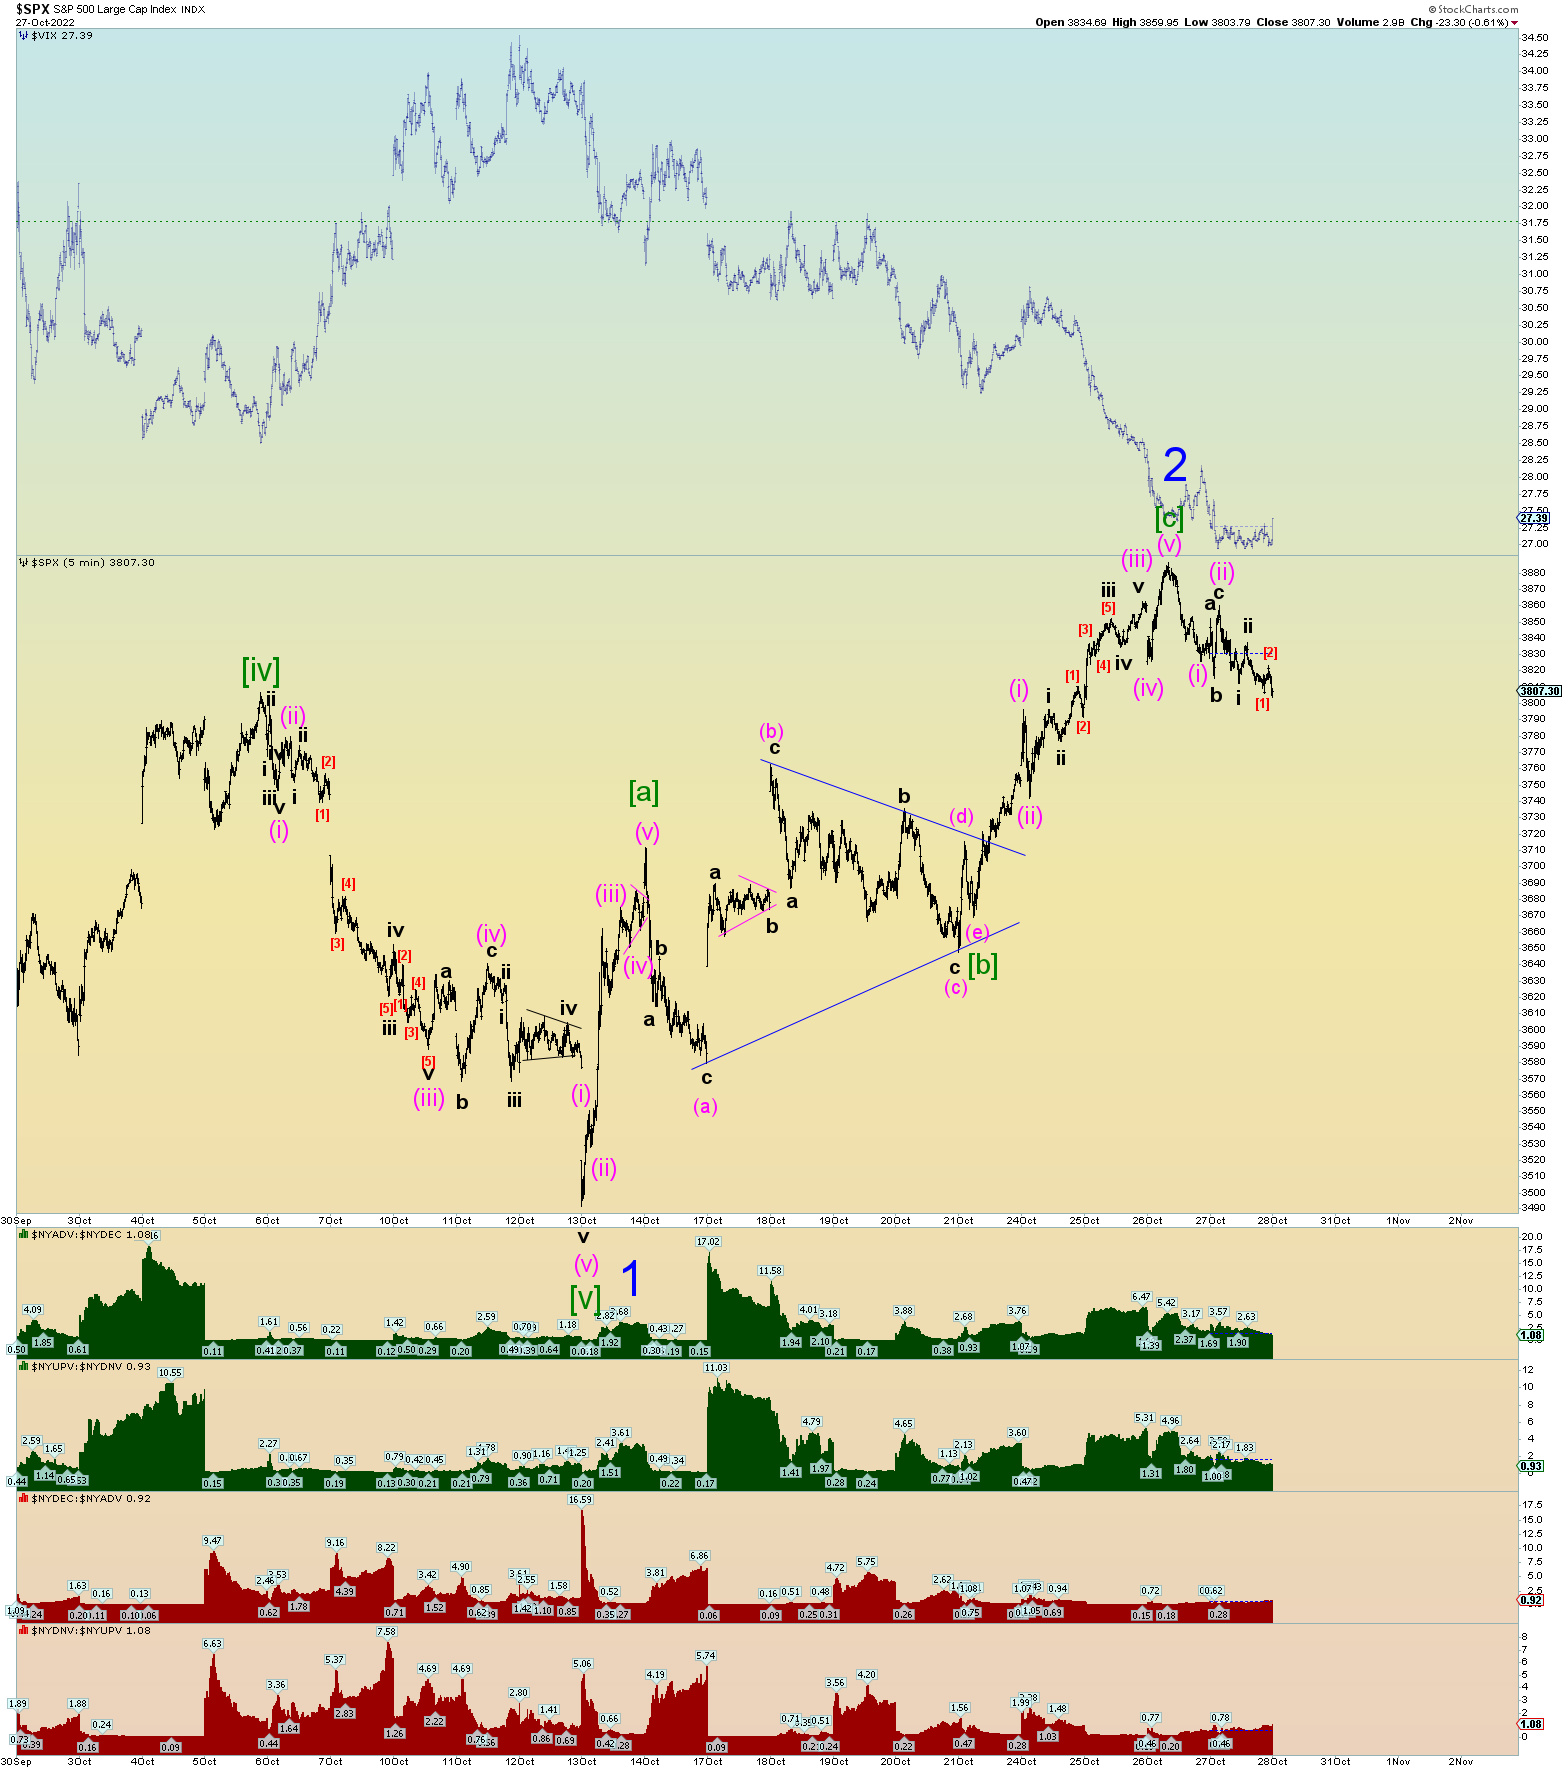
Looking for peak hourly RSI which would suggest the peak of wave iii of (iii) of [c] of 2. Then after peak RSI, the unfolding of the subsequent waves to proper Minor 2 peak. The big open gap seems an obvious target and the 200 DMA.
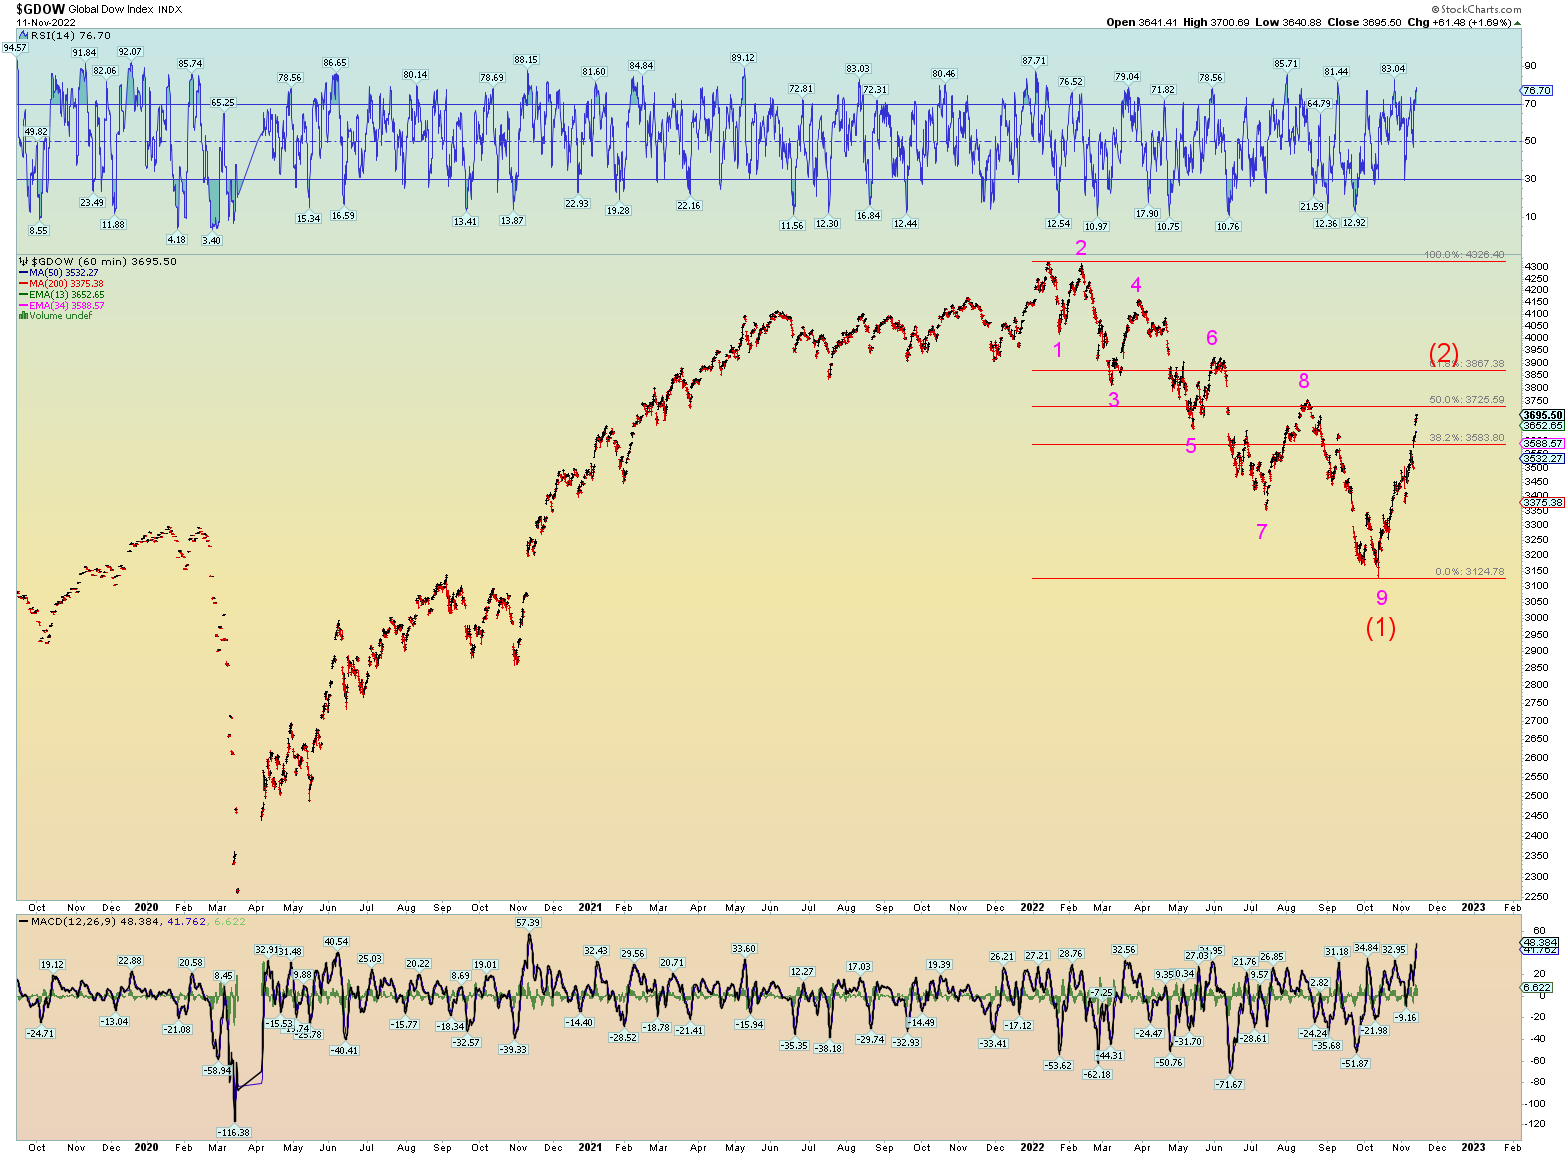
As EWI likes to say, nine waves down constitute an impulse move.
These are HUGE waves since the peak and the market has been rocked. It’s as if the market is fighting itself in a futile effort.
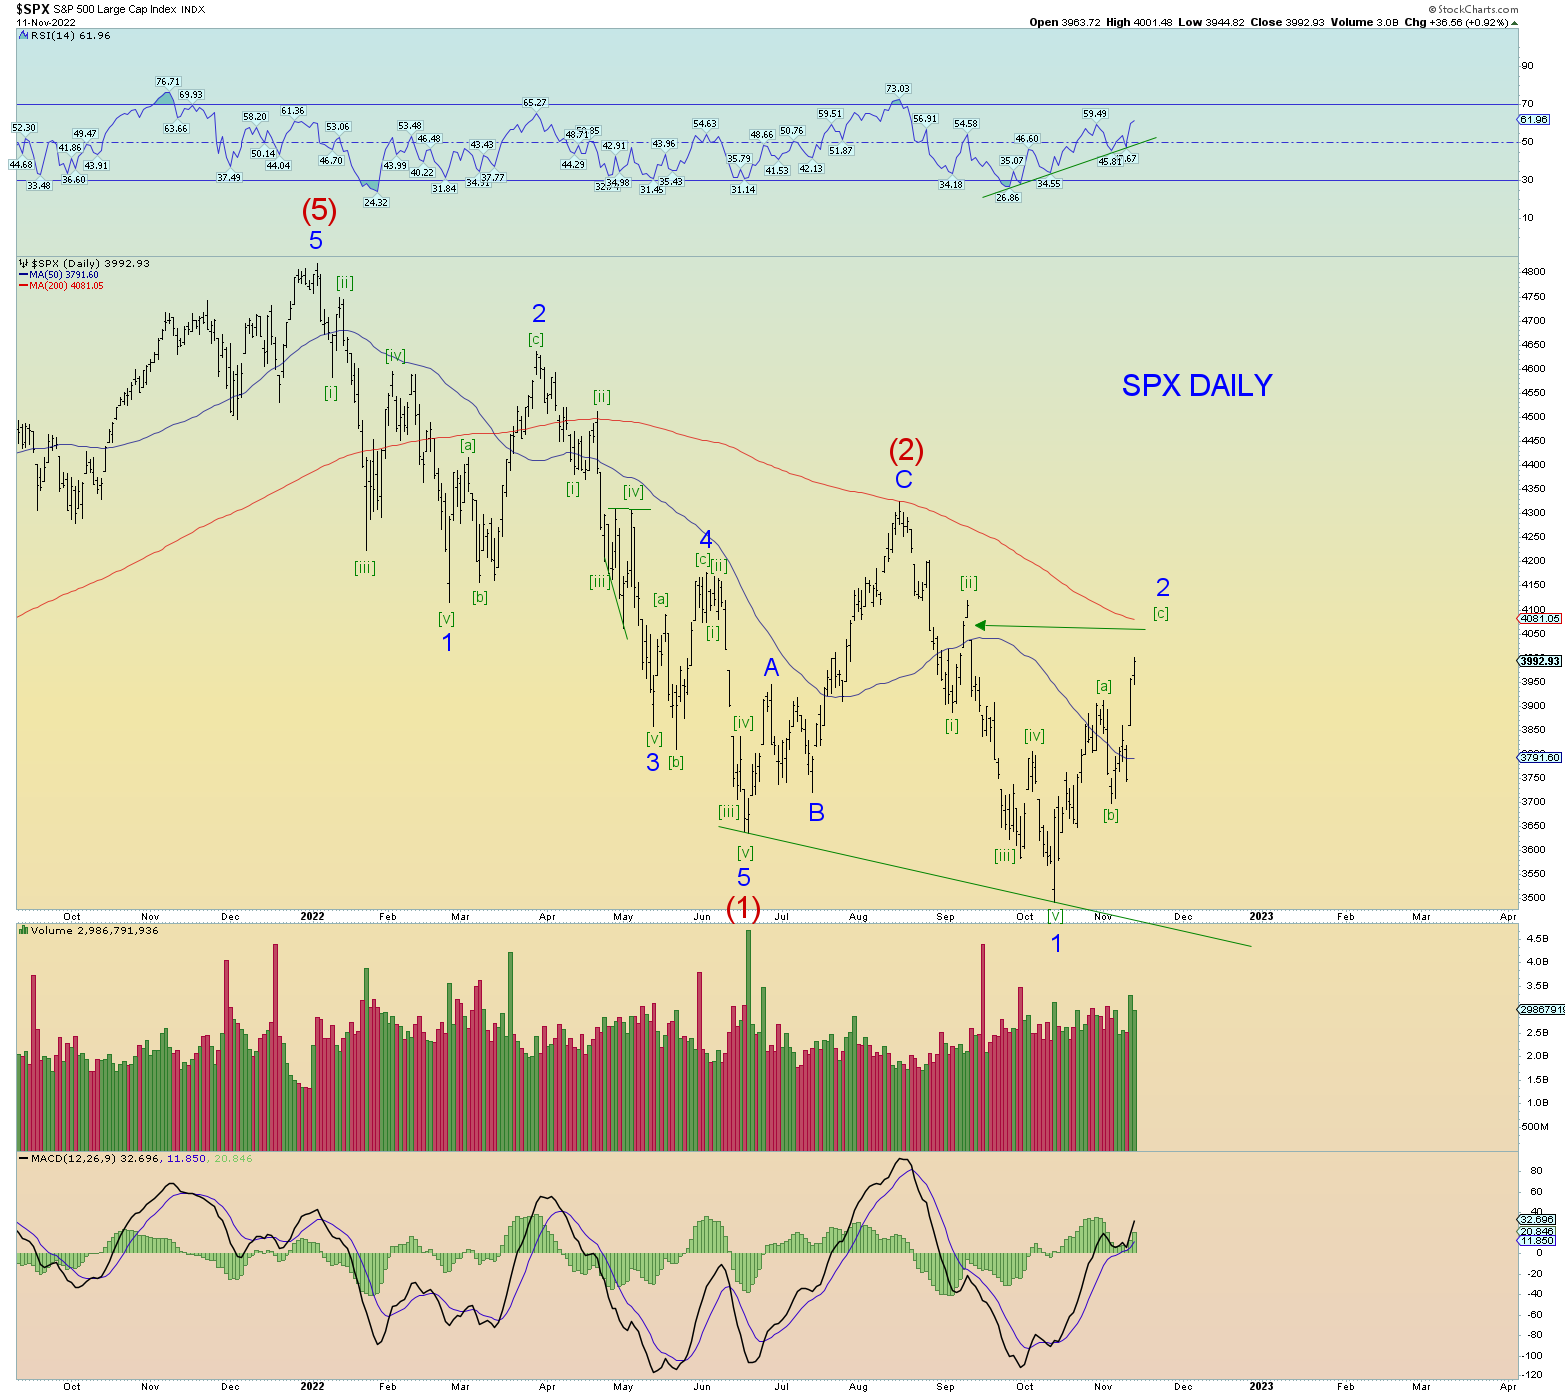
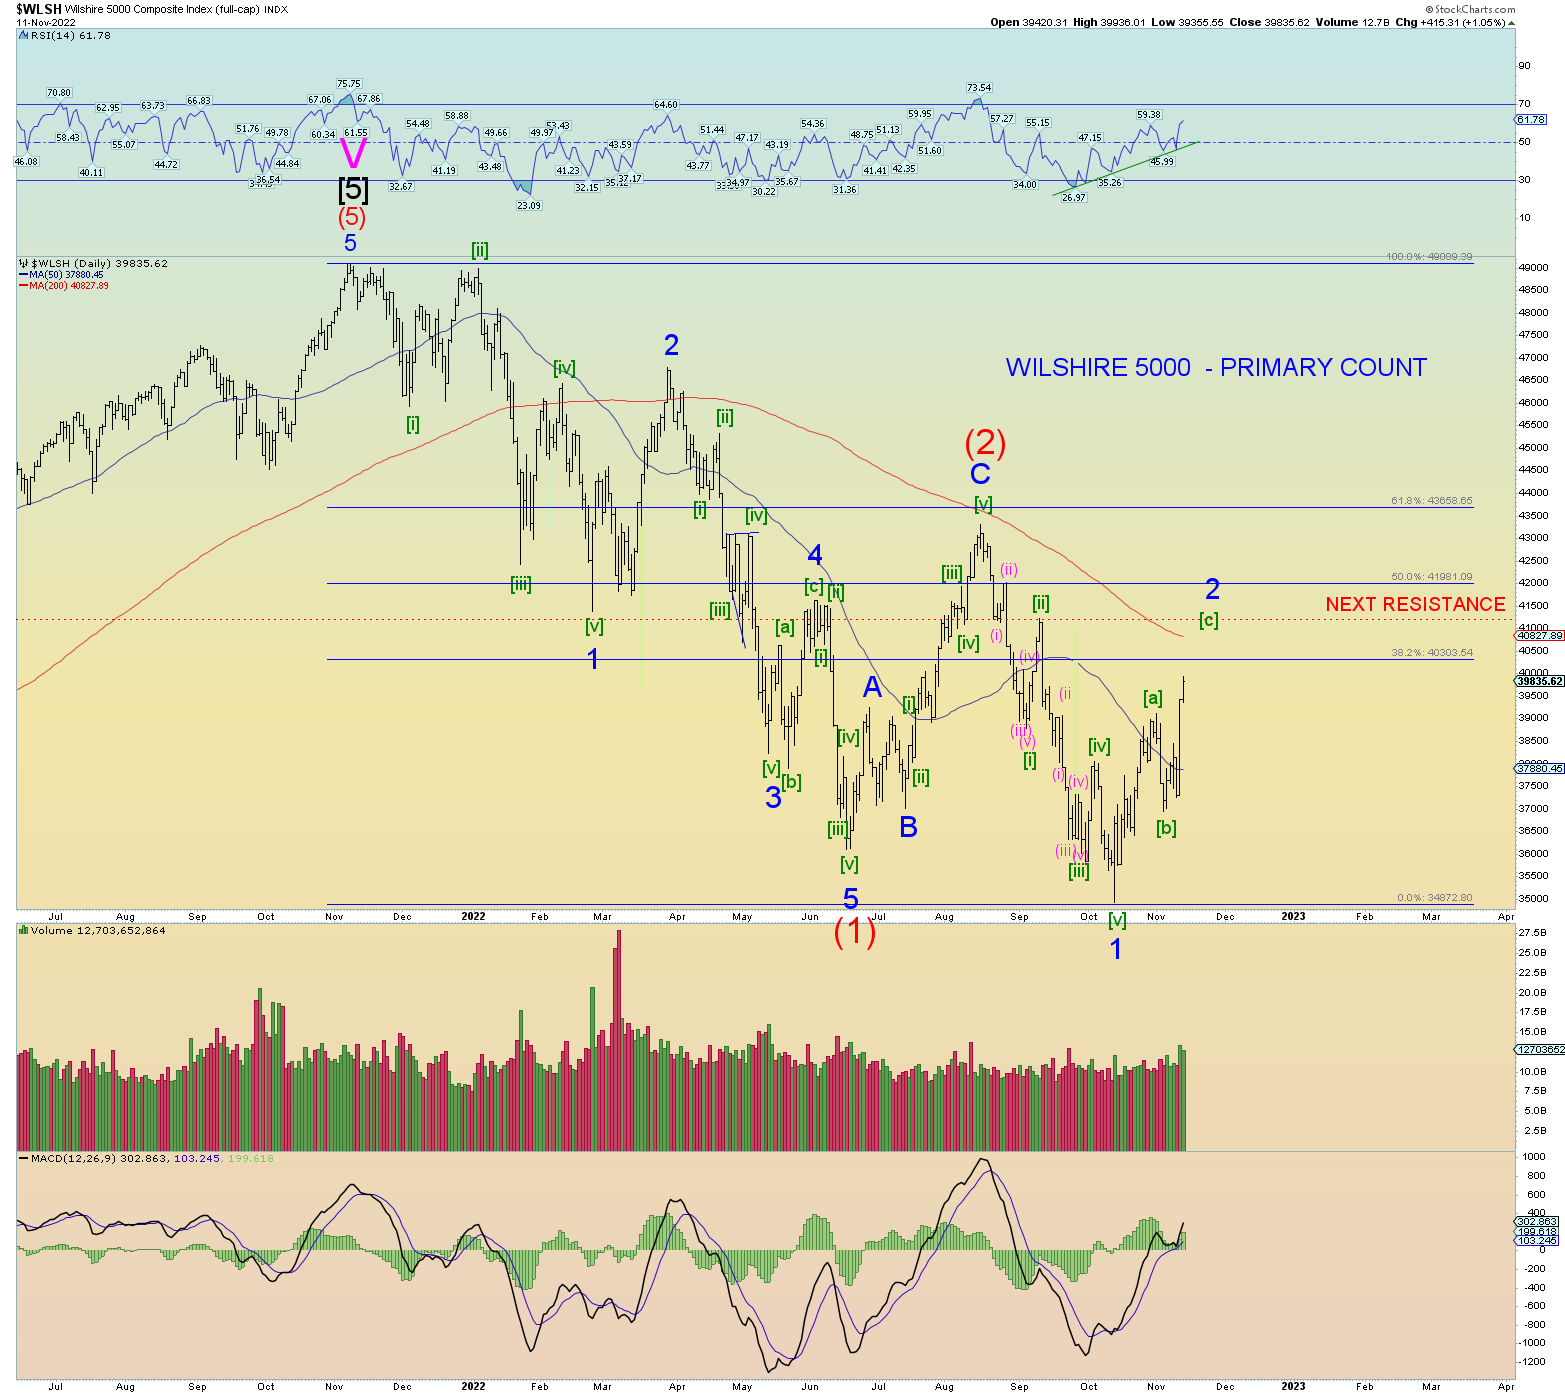
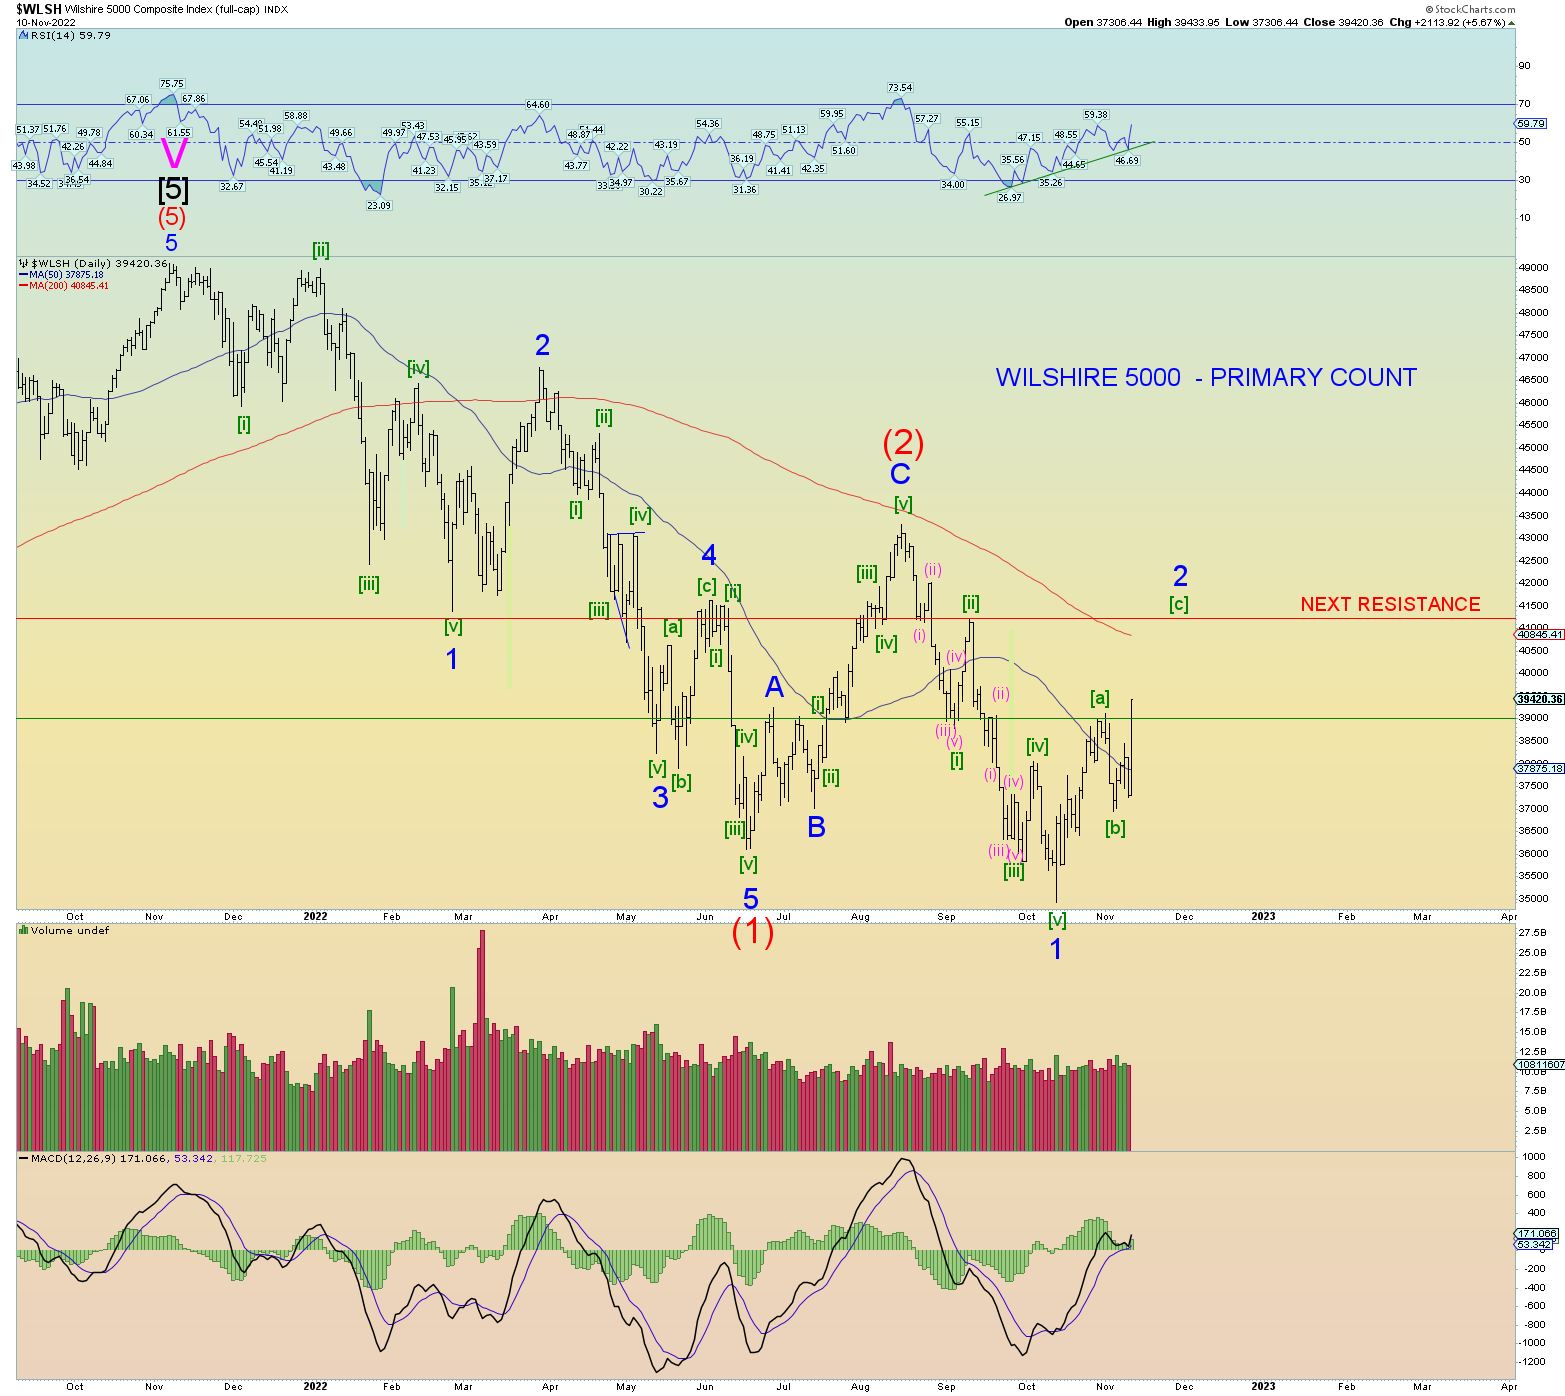
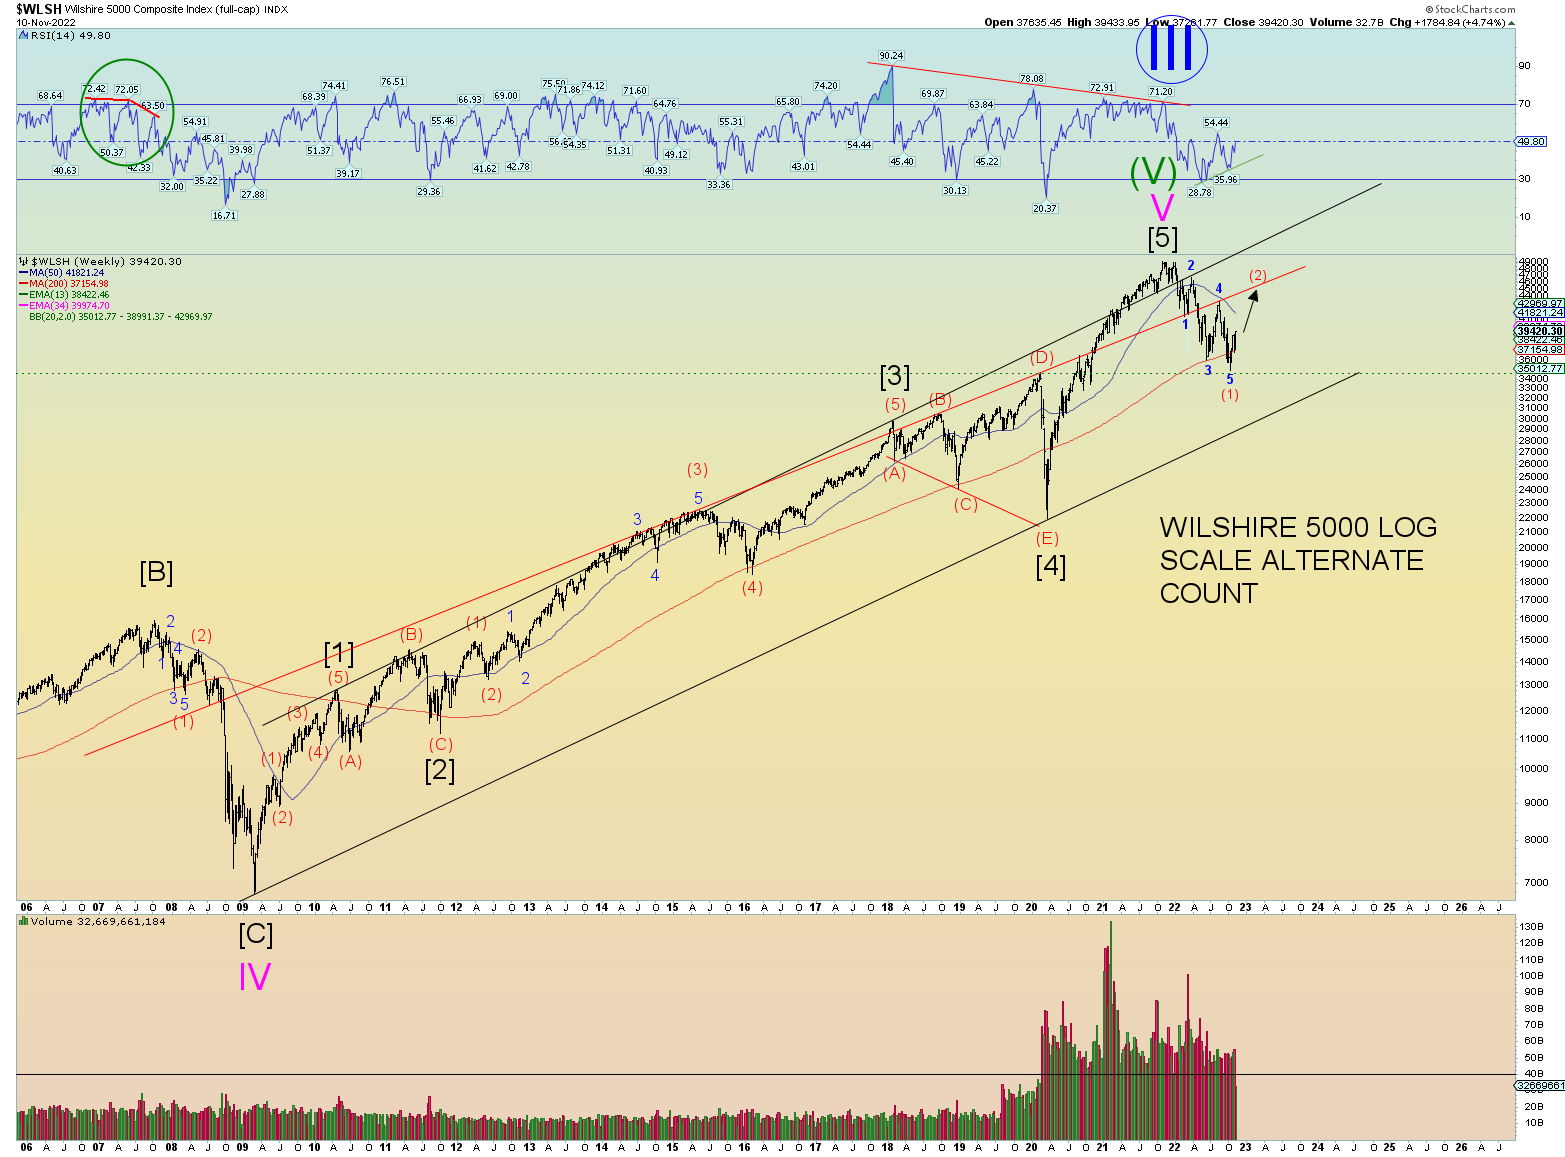
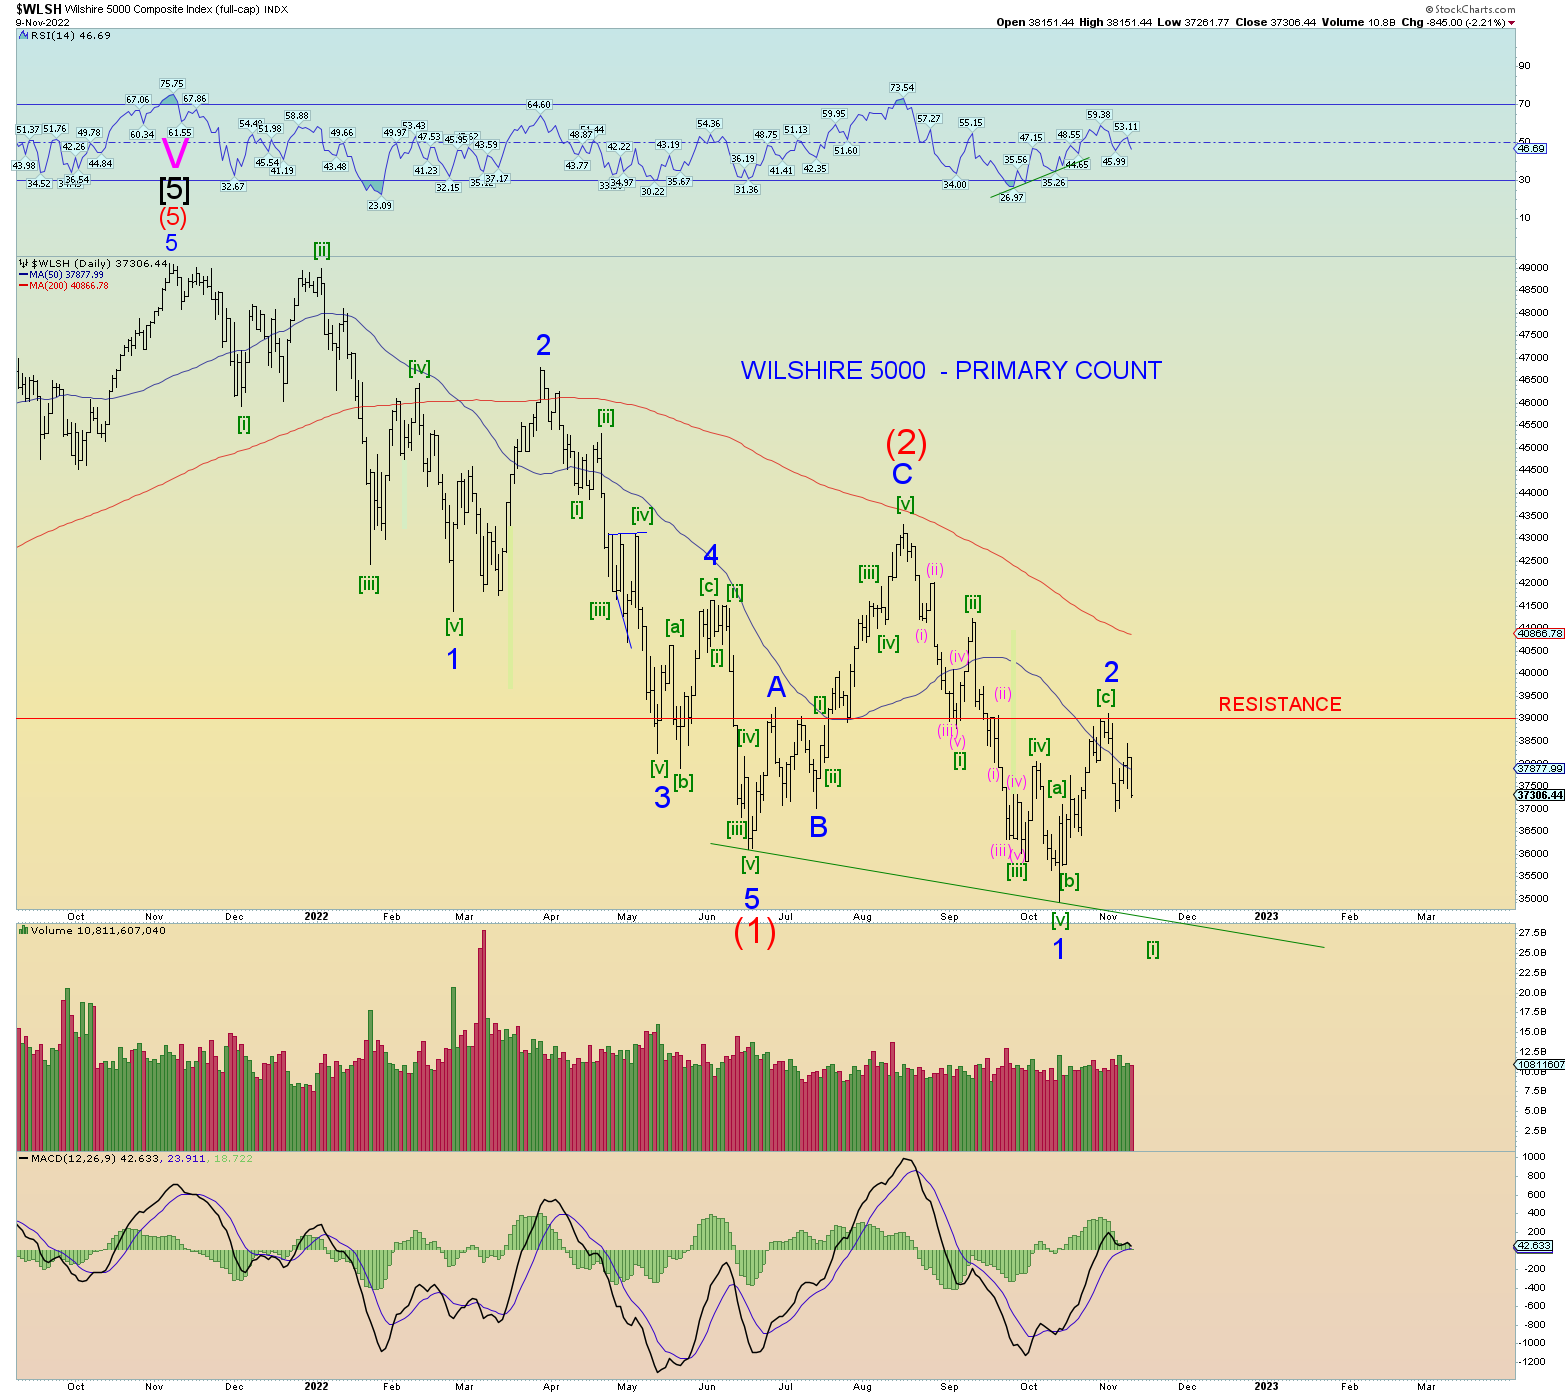
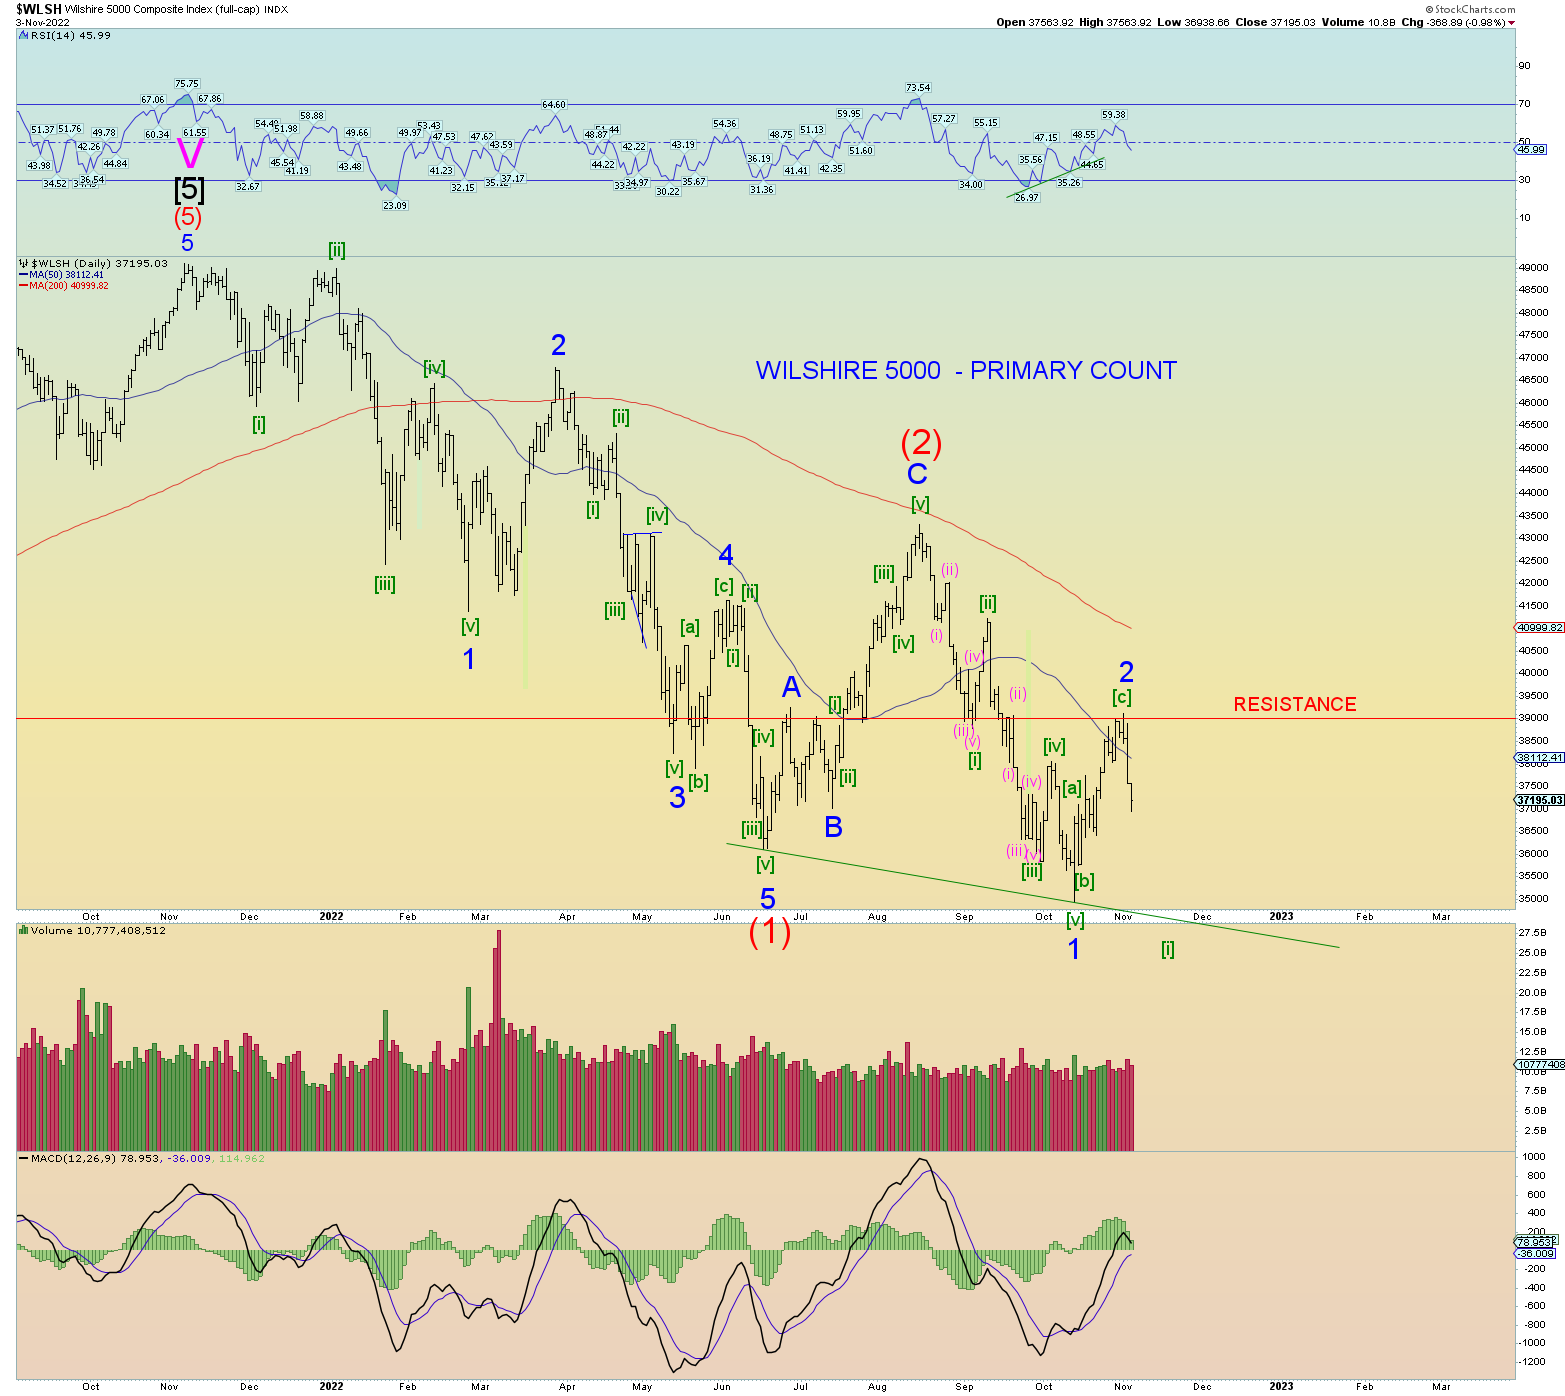
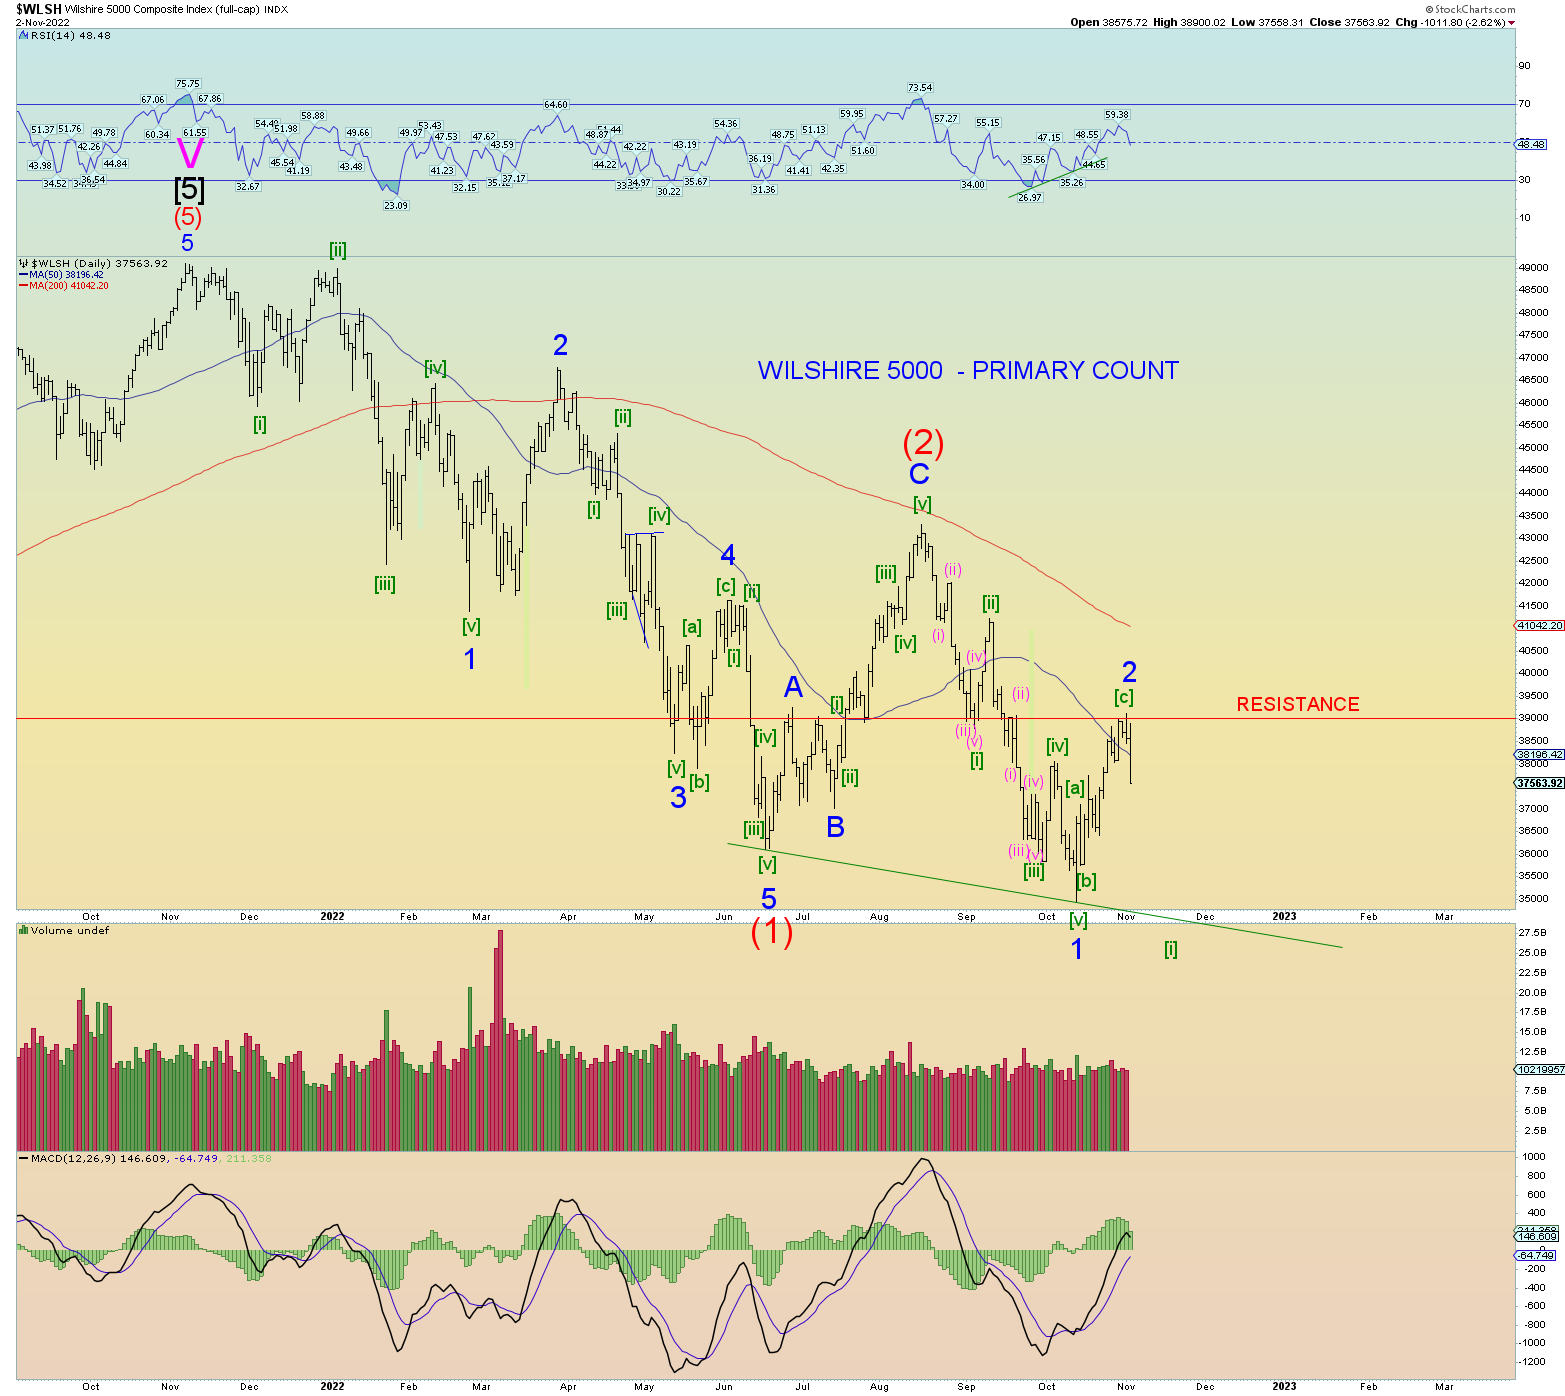
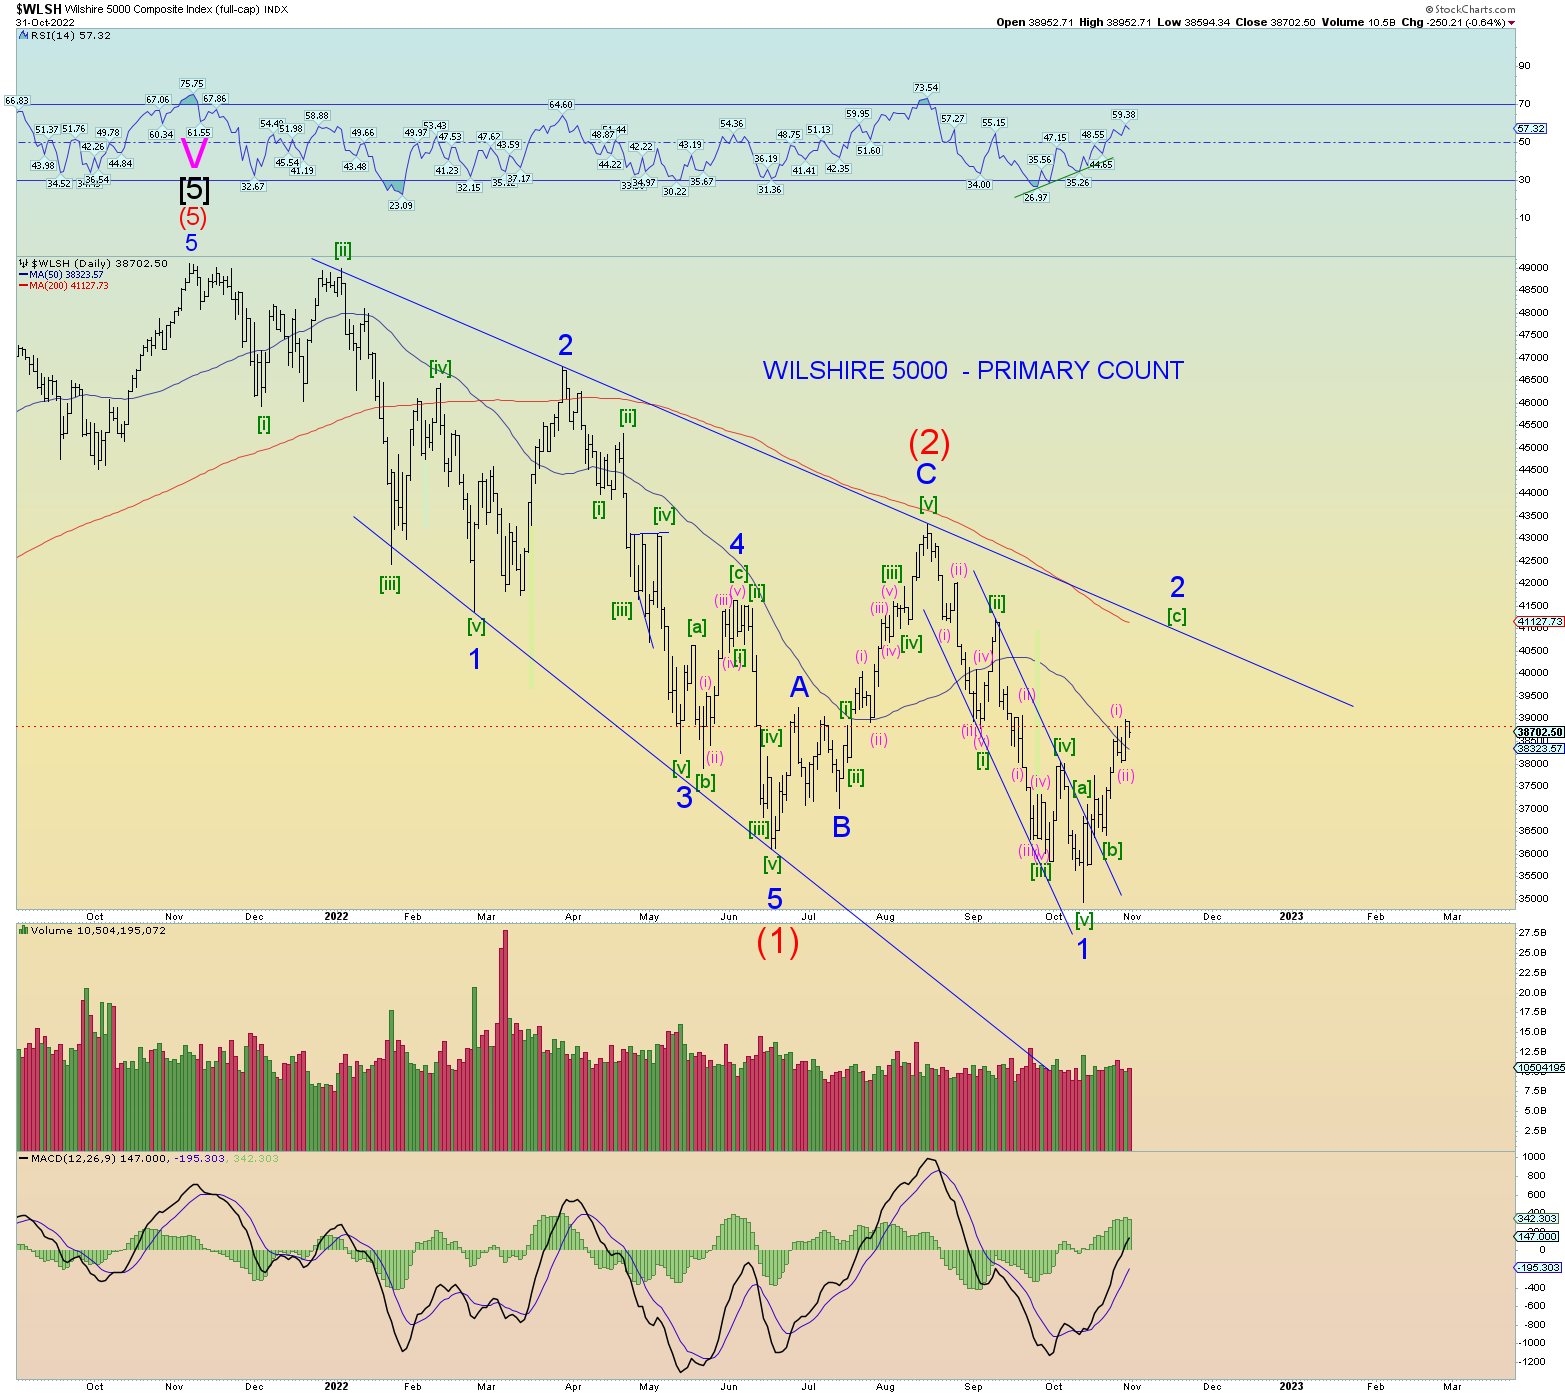
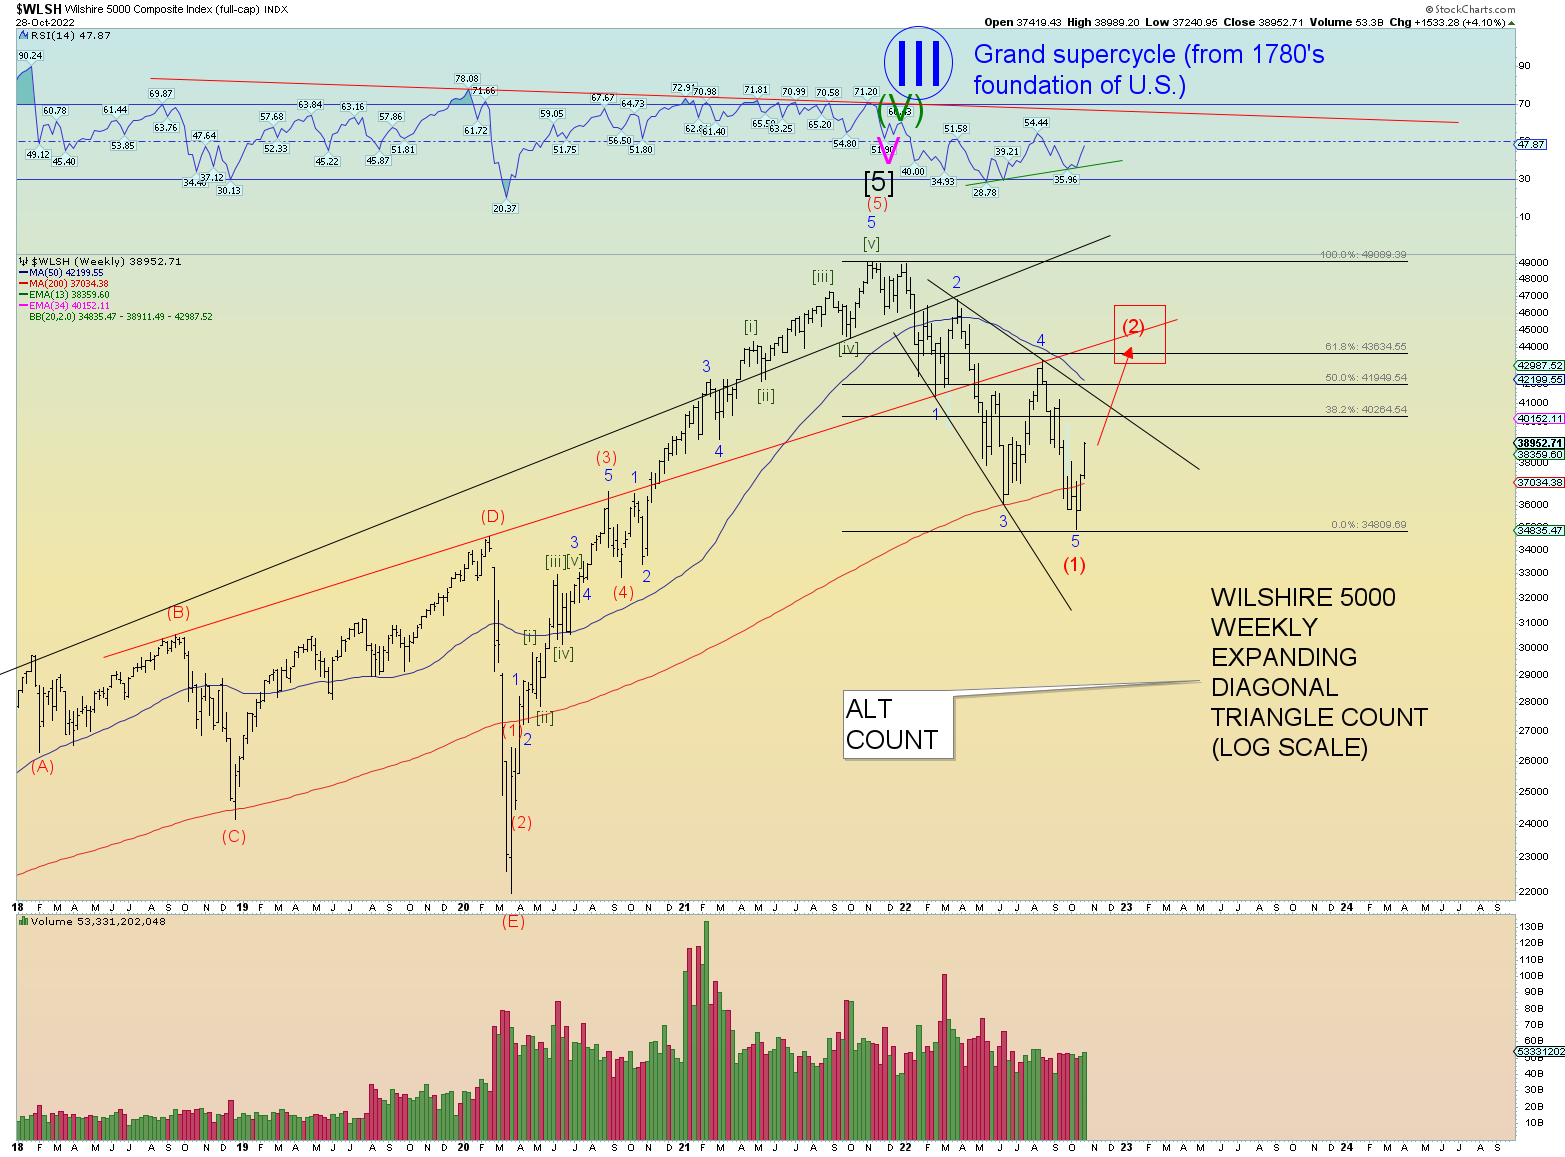
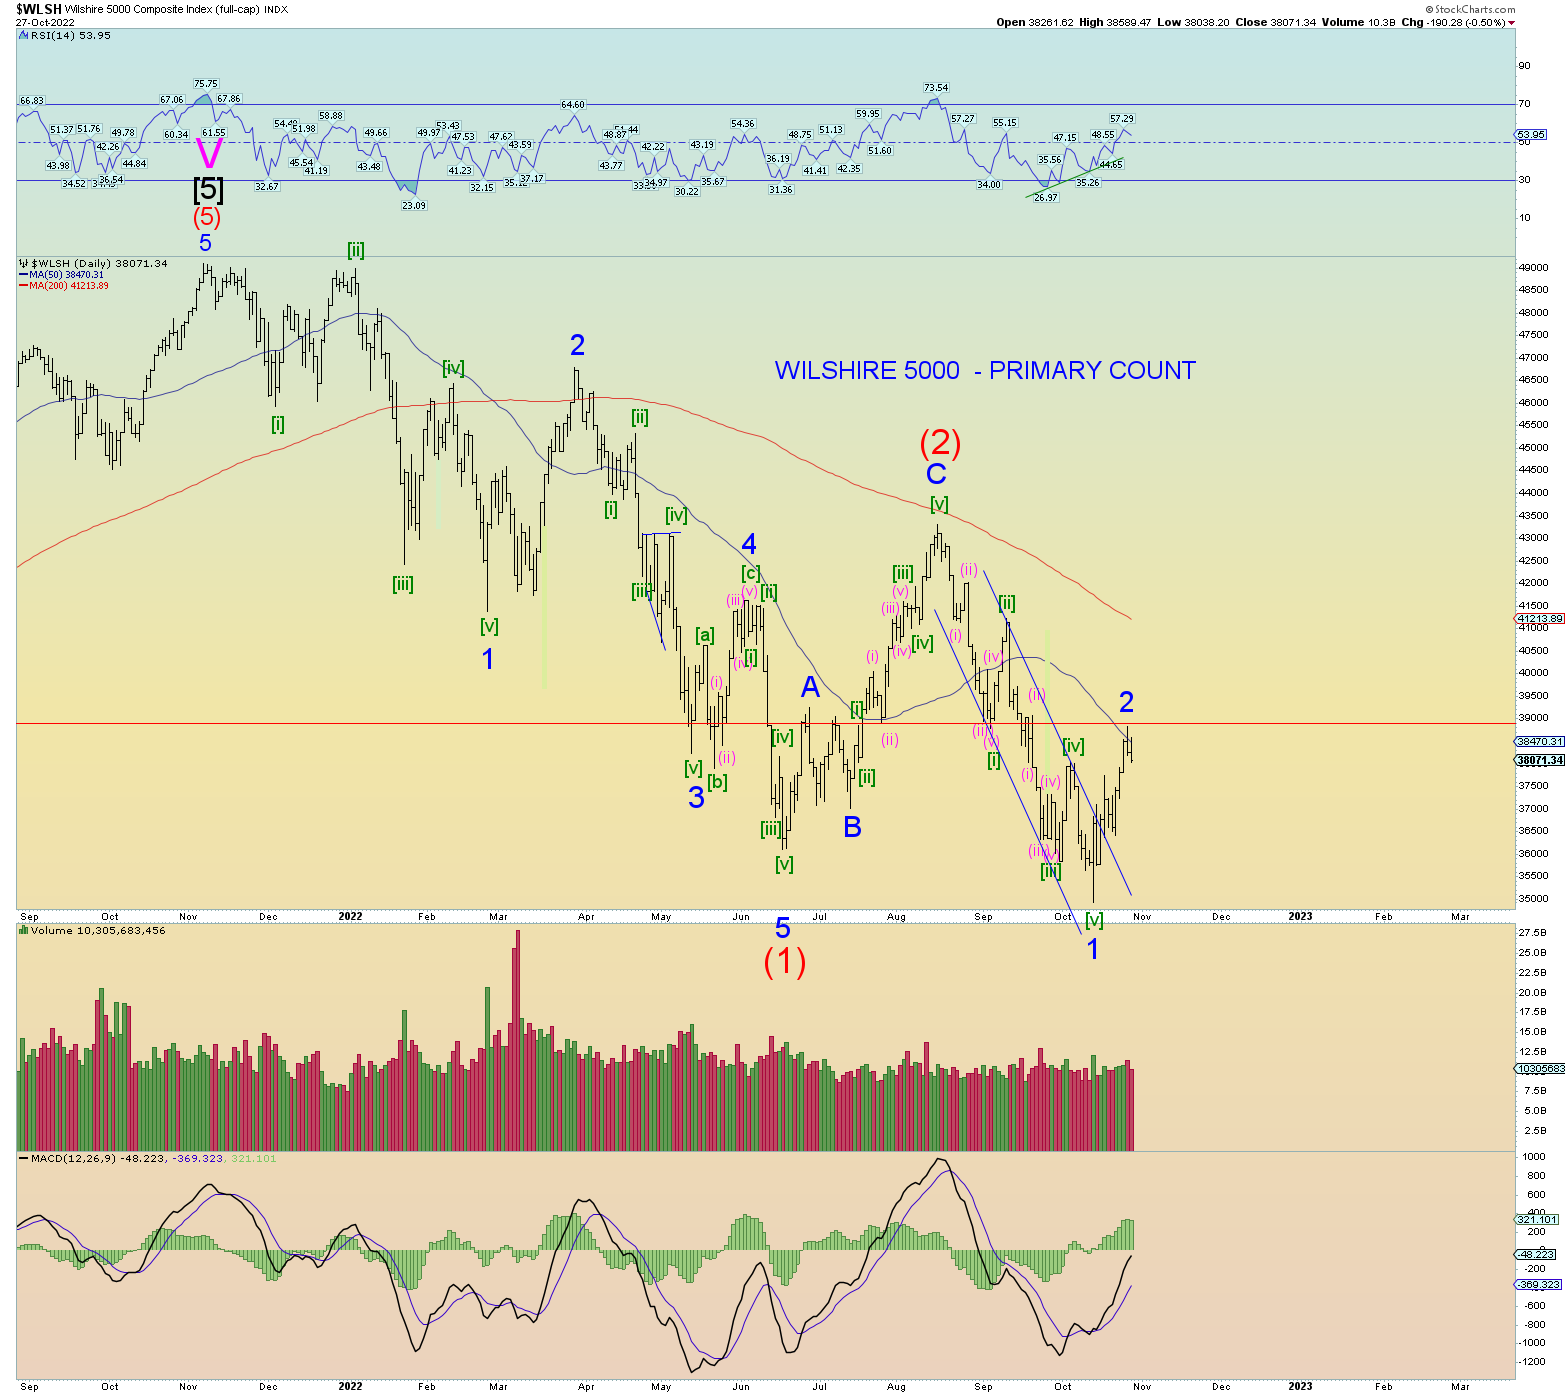
Wilshire not even at the 38.2% Fib retrace yet.
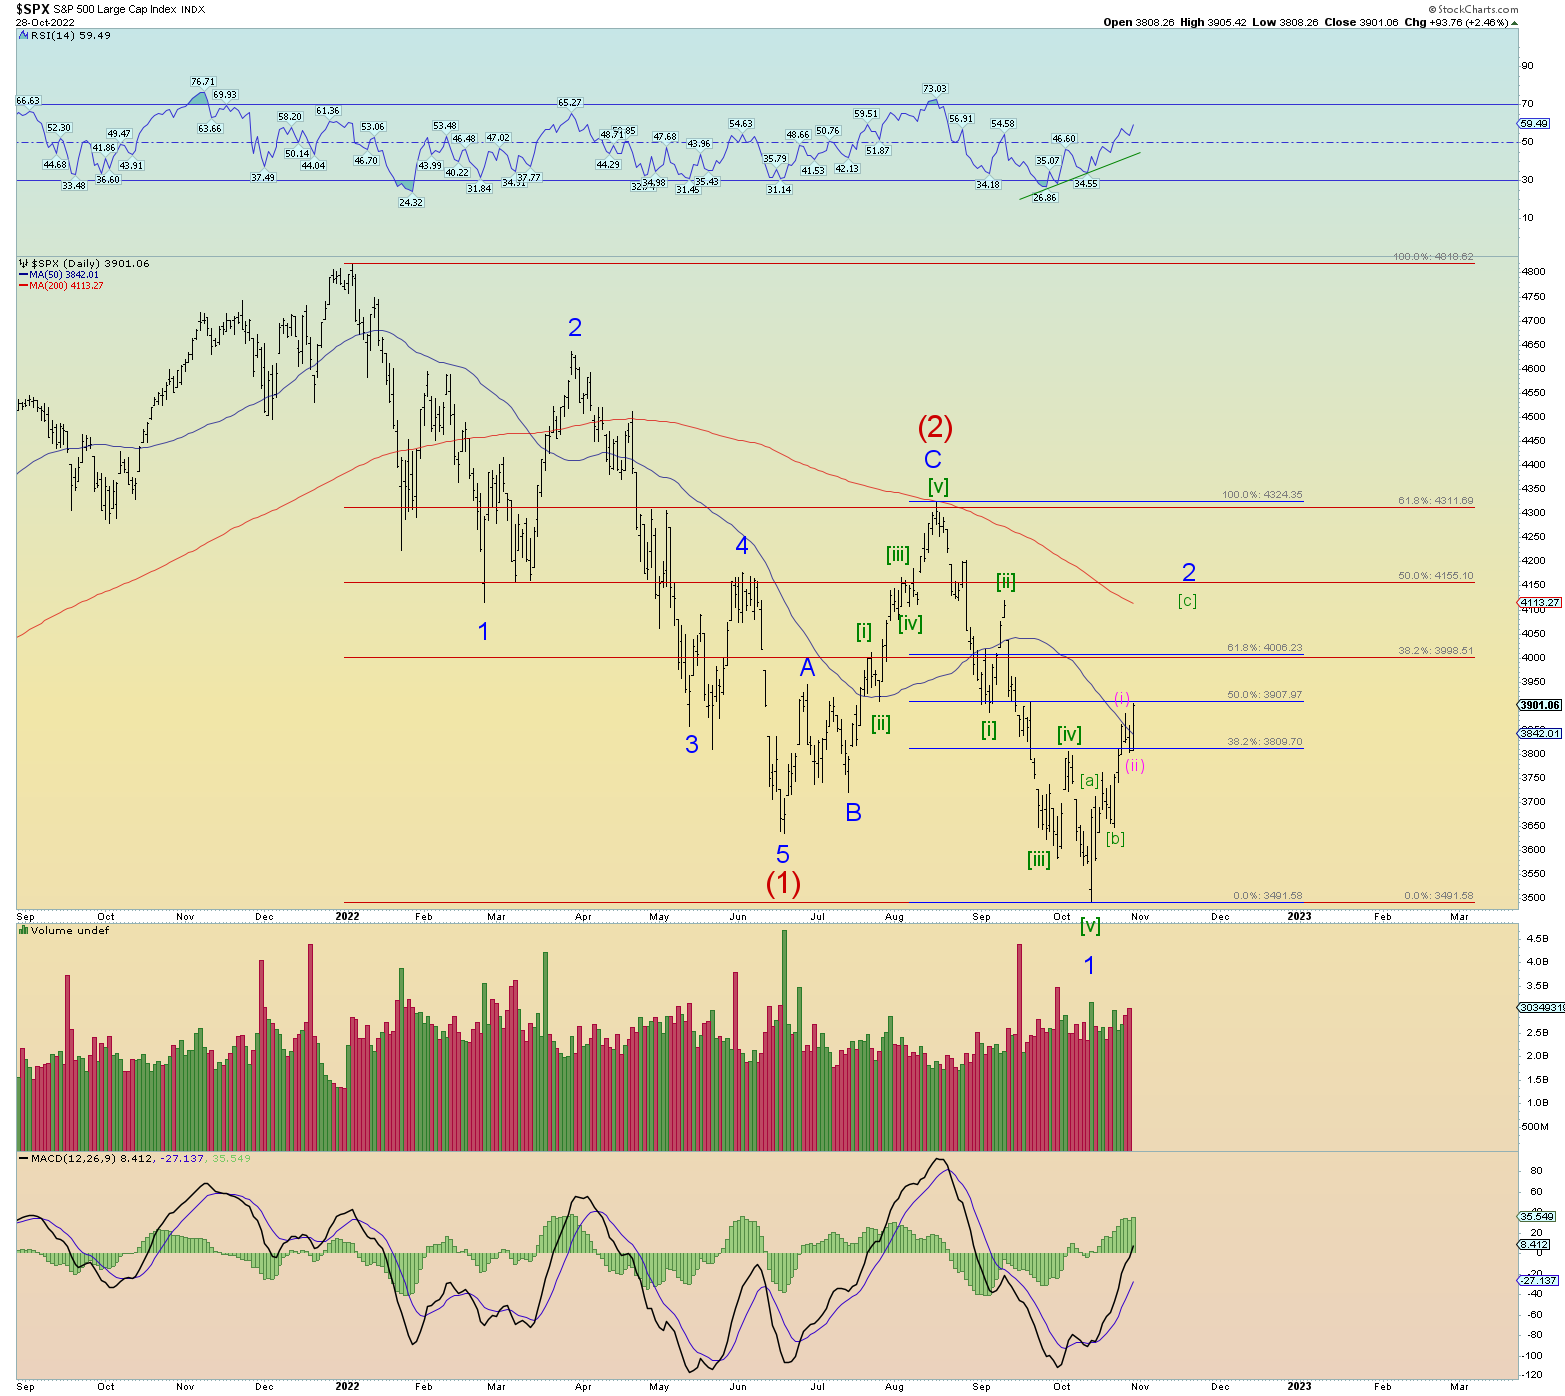
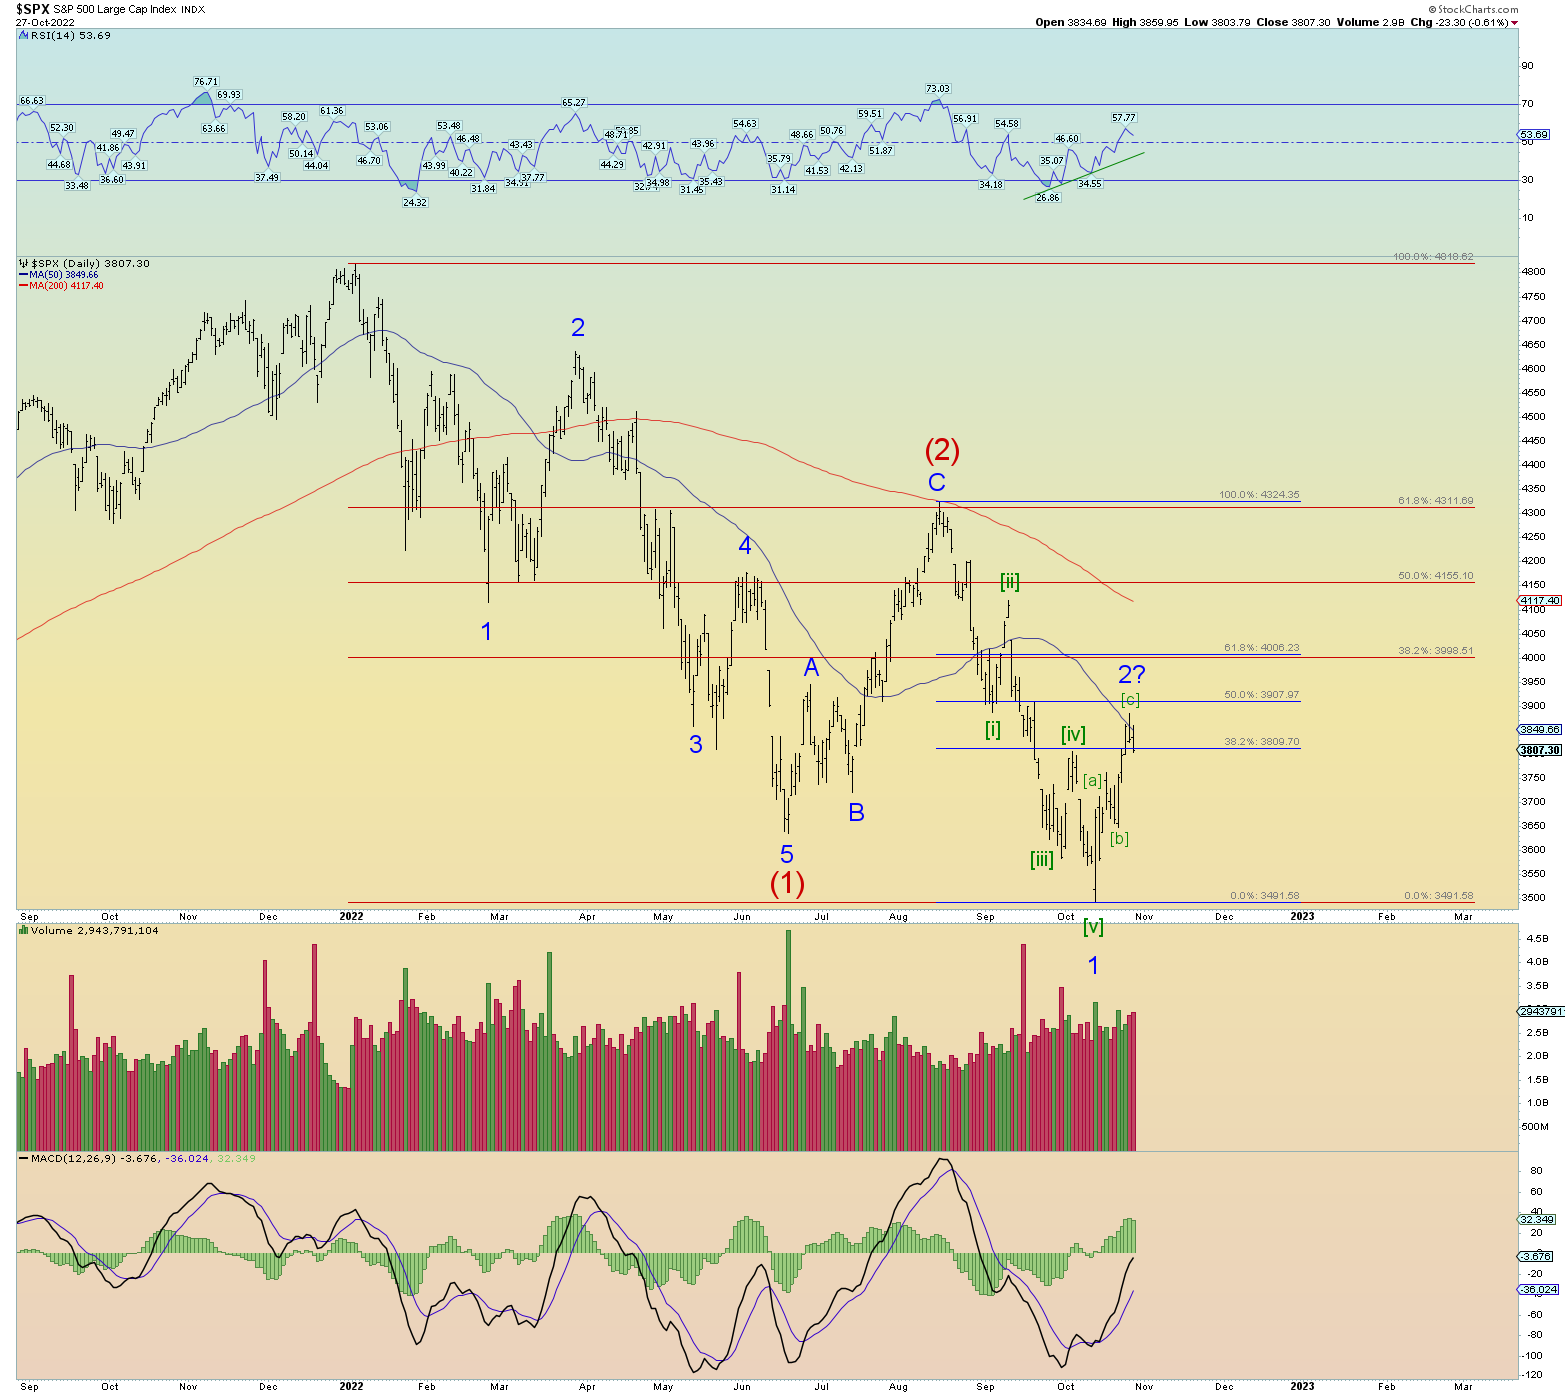
Calling a Primary wave [1] low. Backtest of the up-channel line?
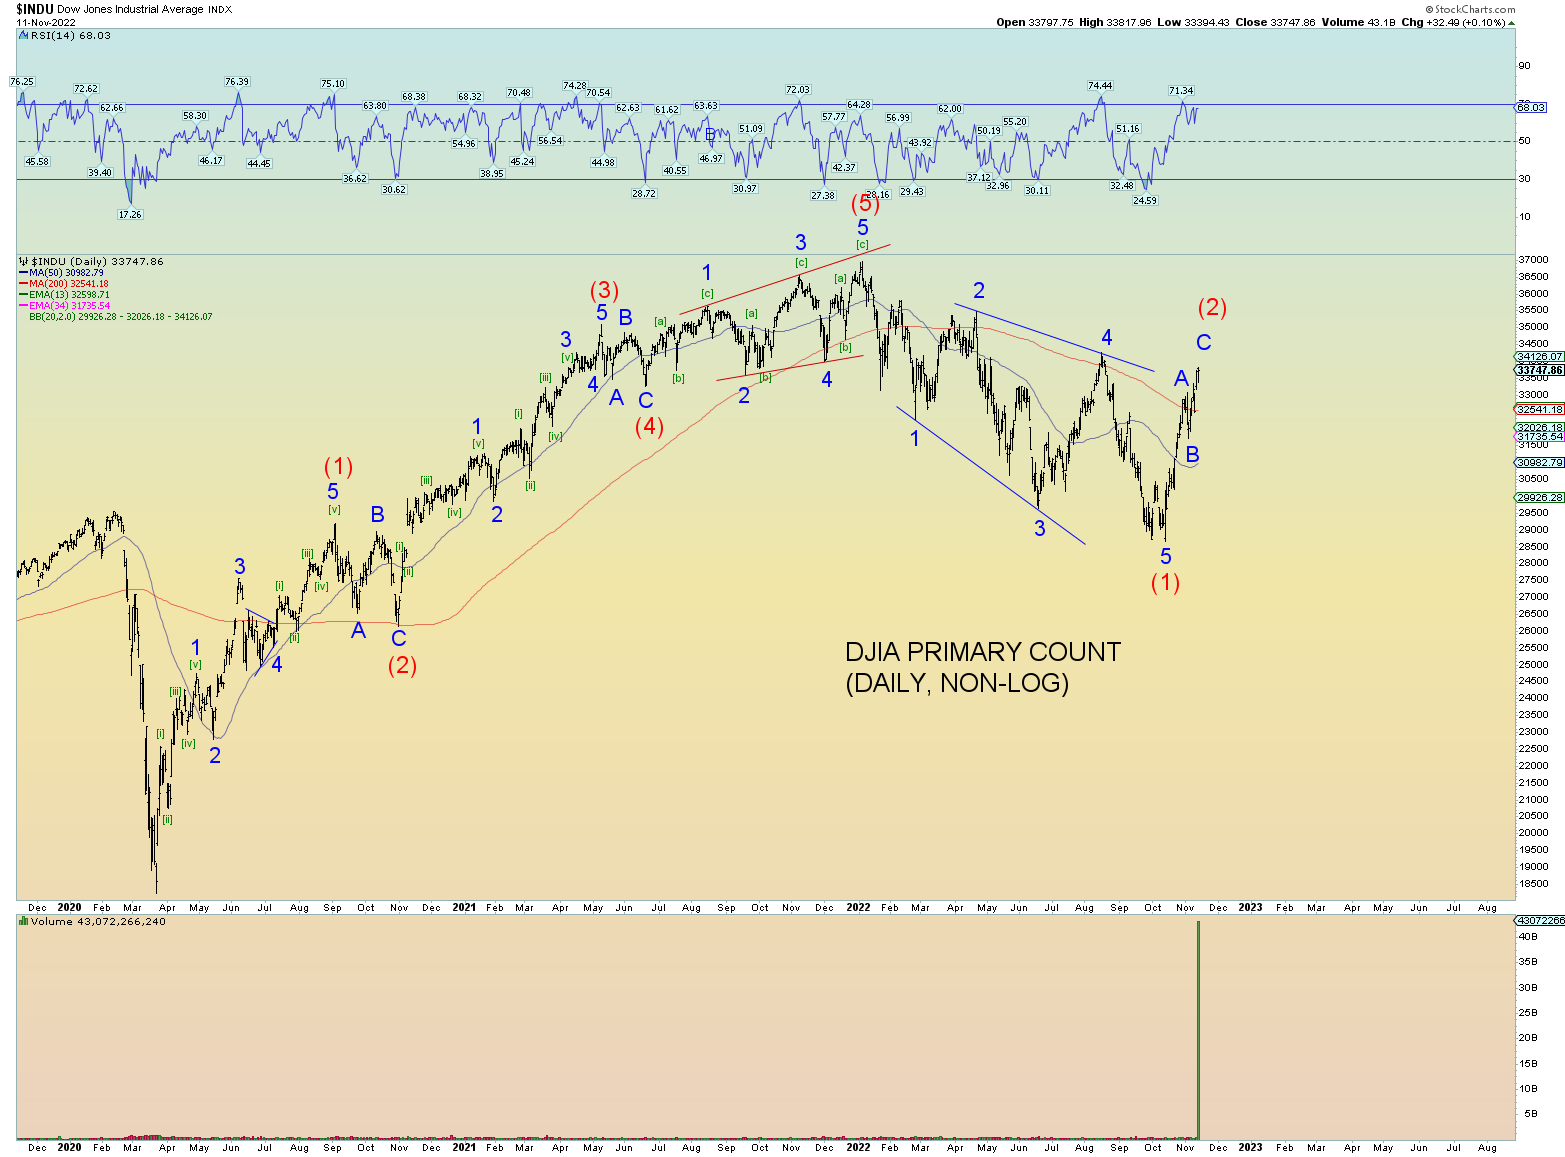
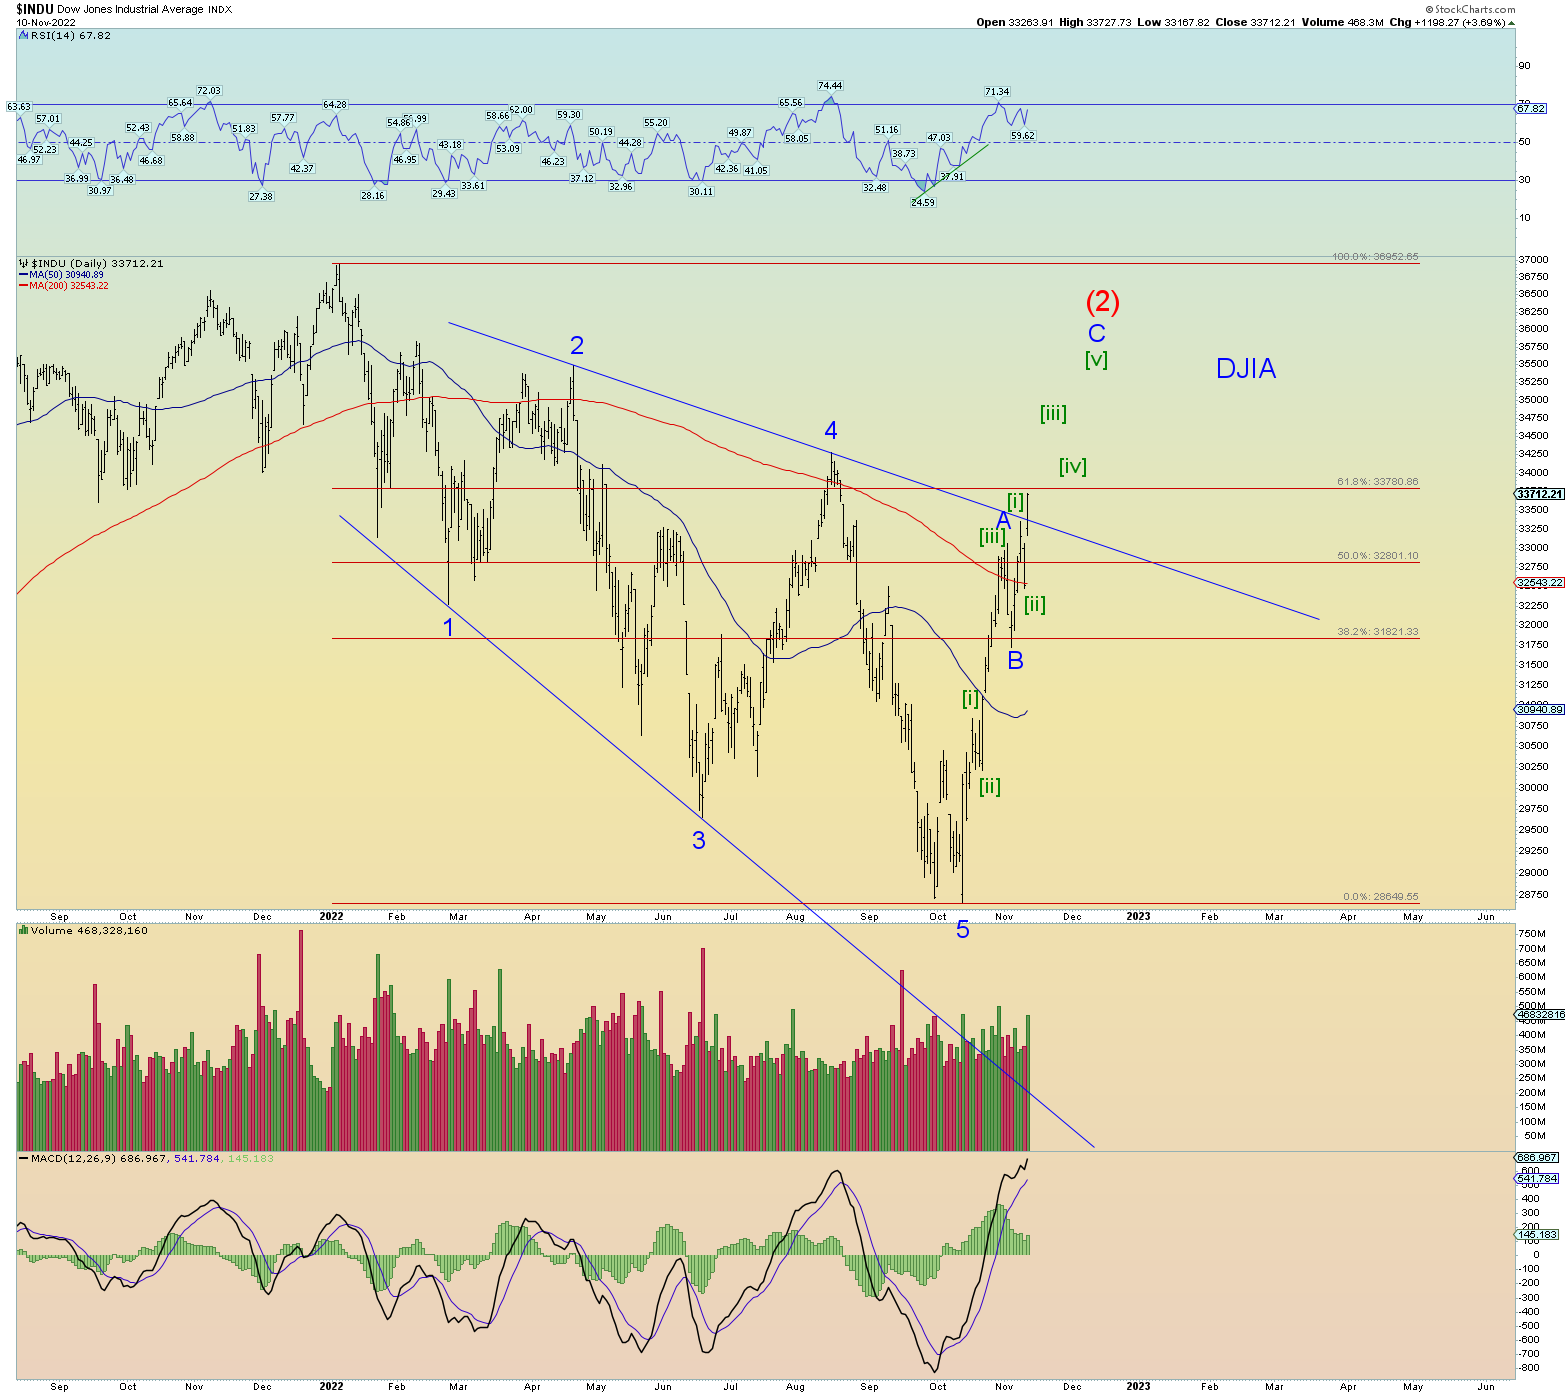
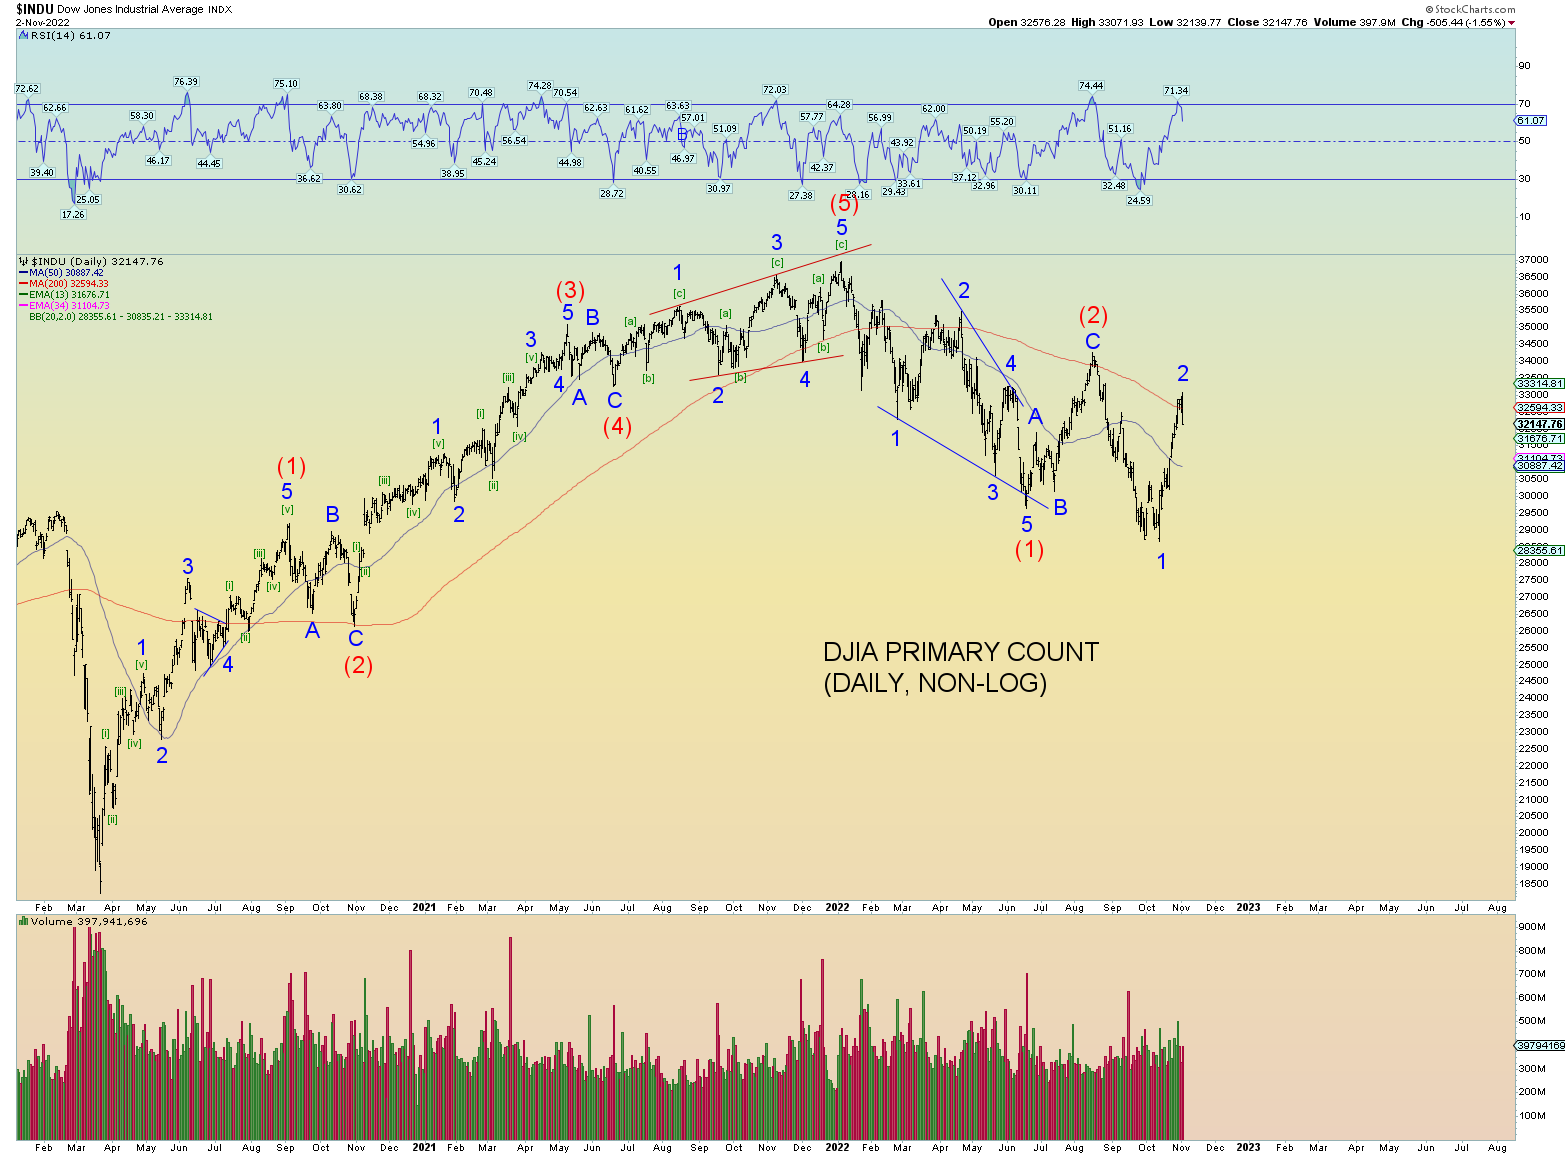
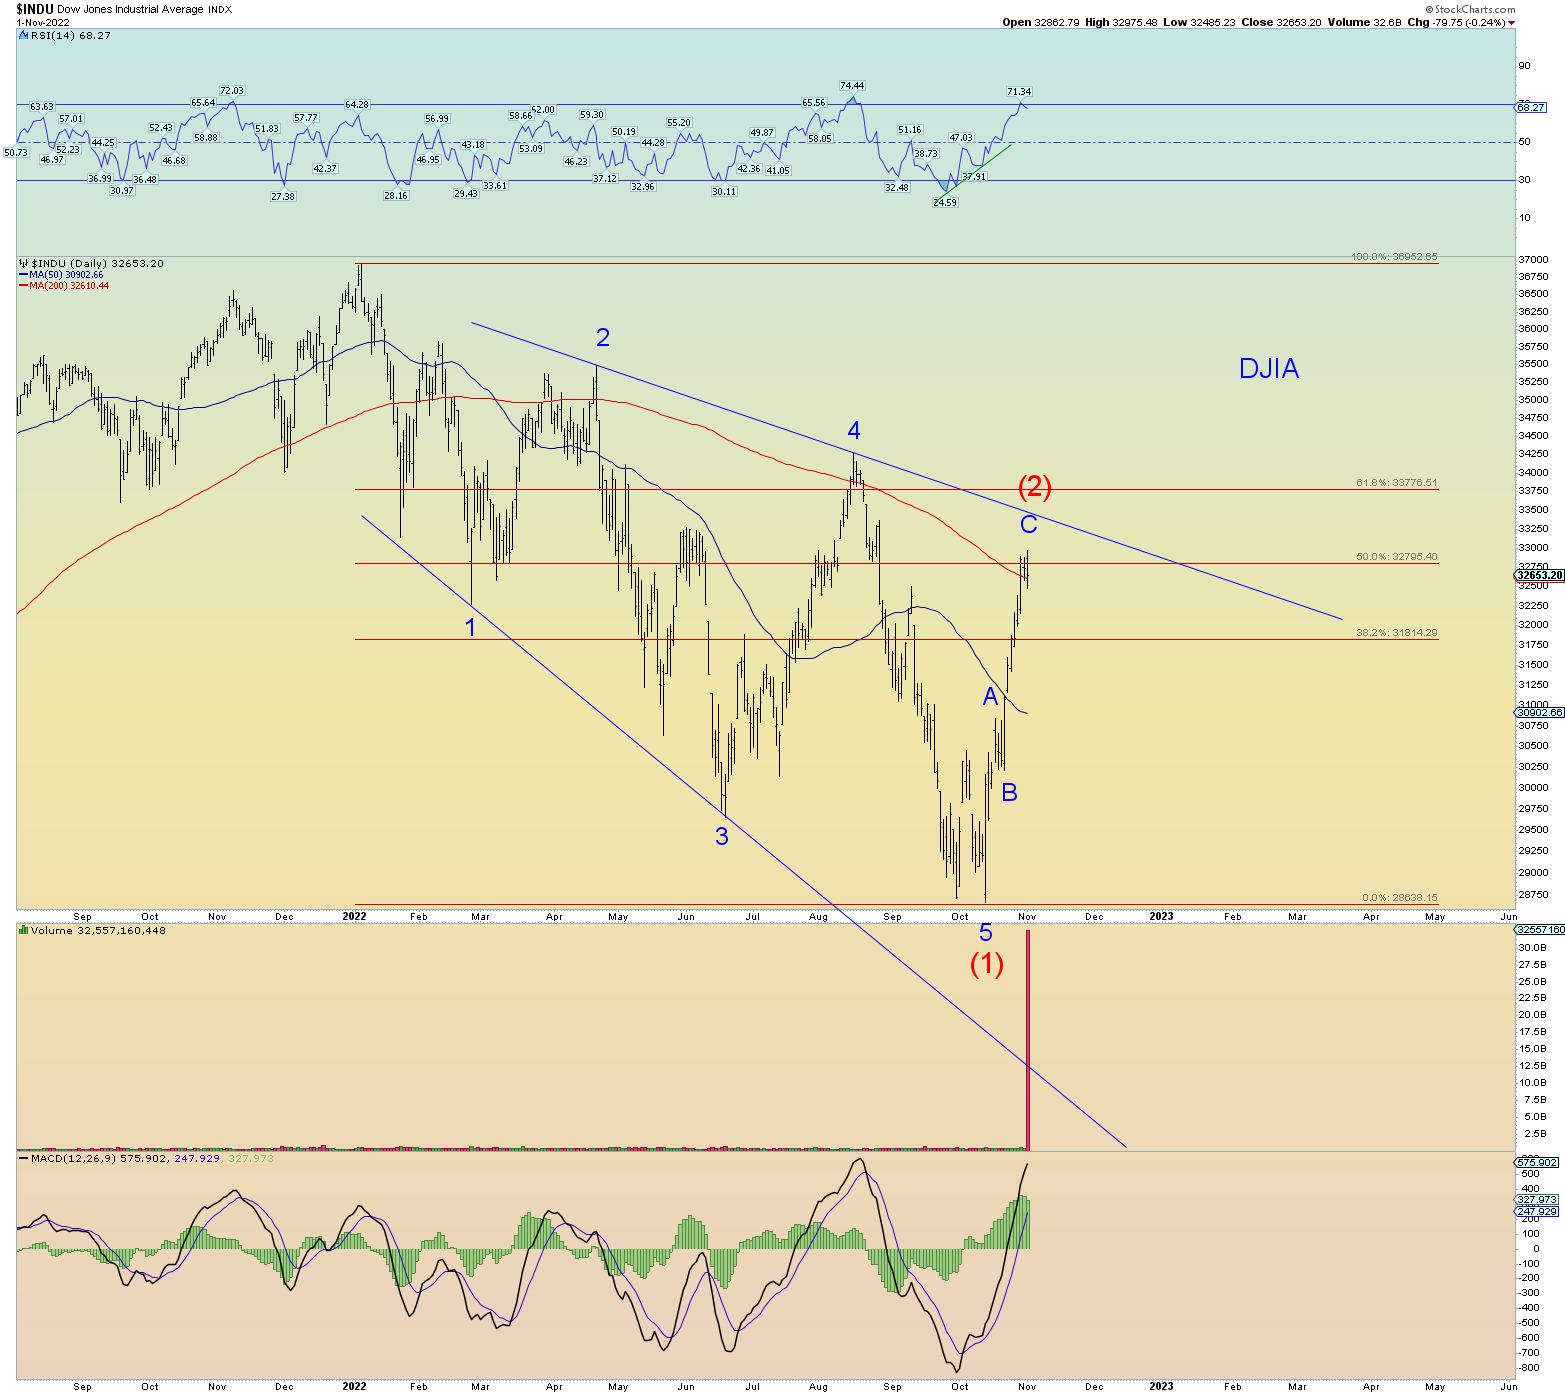
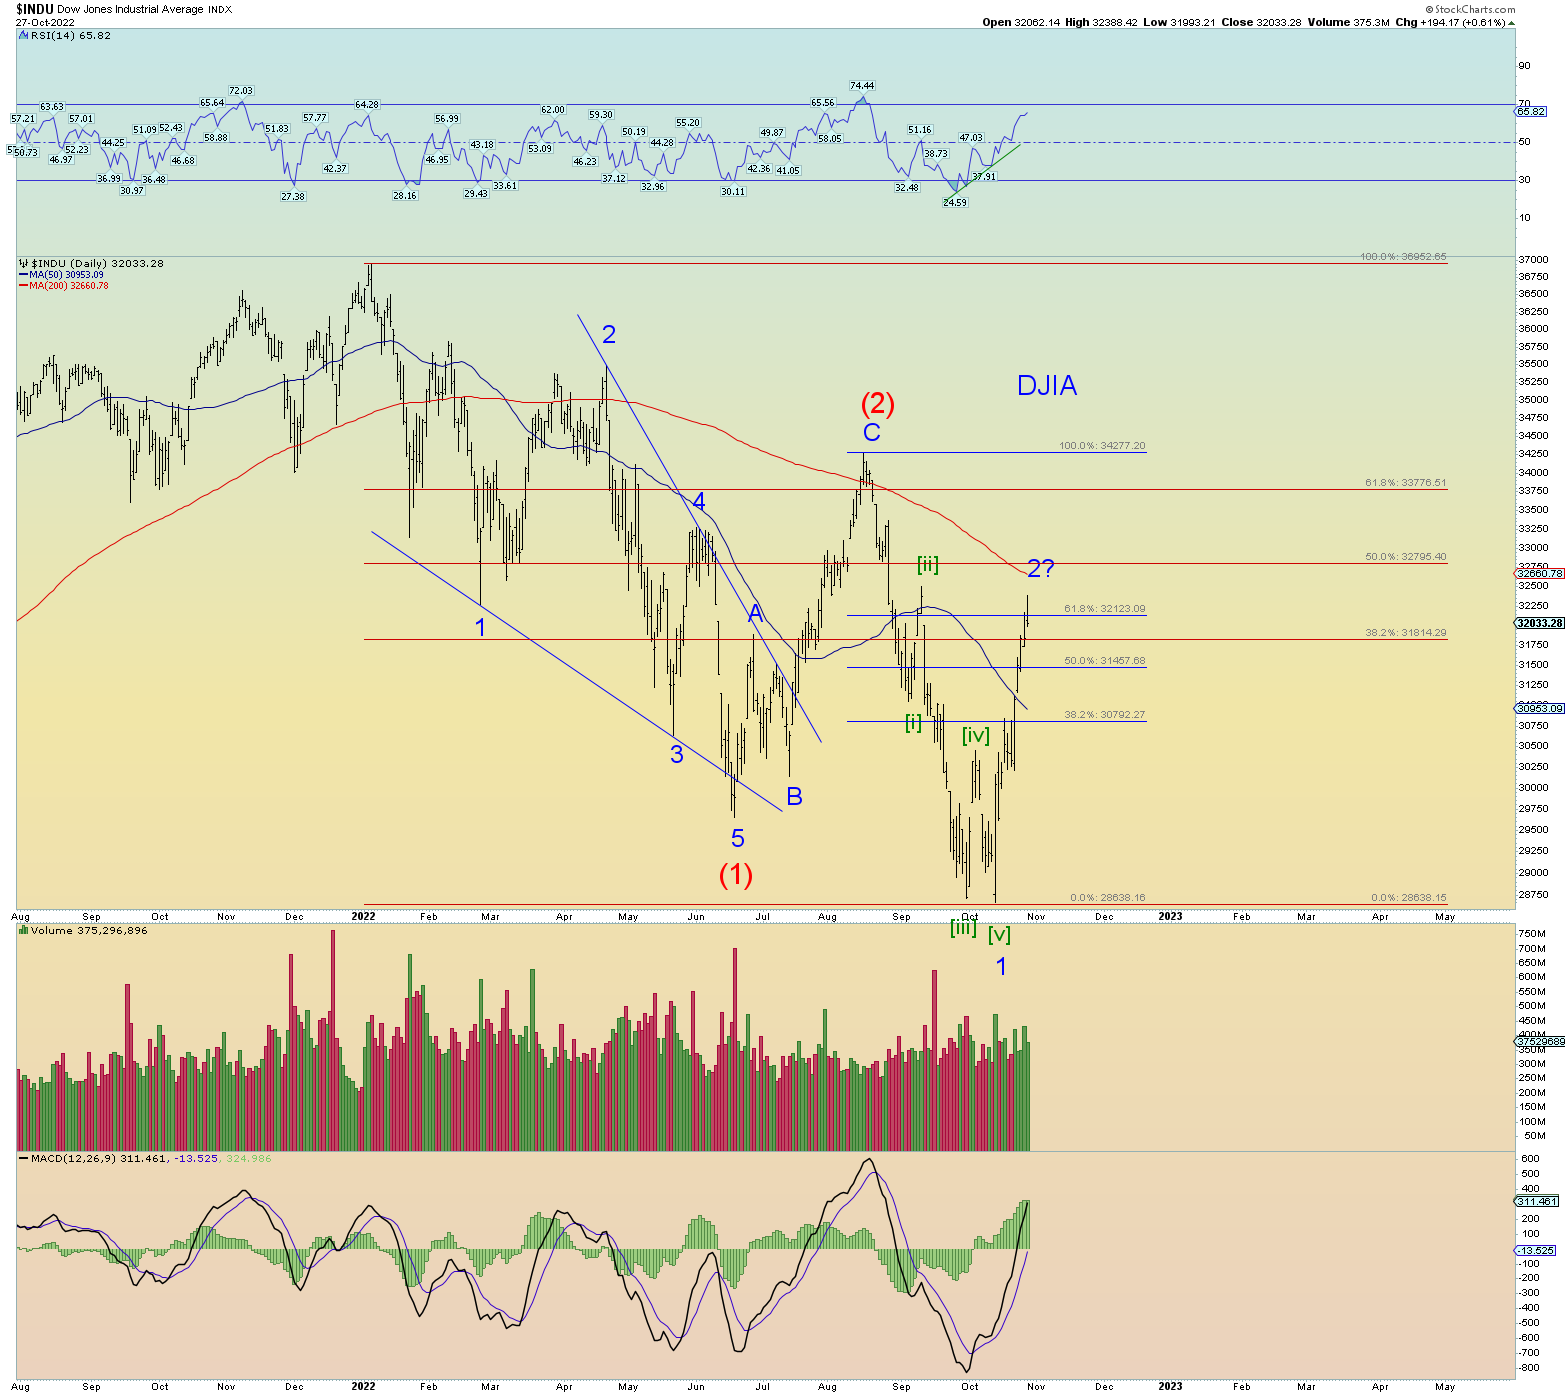
The DJIA is on a differing wave count perhaps than the rest of the market. The entire structure since the early January peak has taken the form of an expanding diagonal triangle. The expected retrace of just such a formation should be very quick and powerful and deep. And that has appeared to be the case as the DJIA has retraced a Fibonacci 61.8% of the drop from January to mid-October in less than a month.
Yet today, despite a 3.7% rise of the DOW, a 5.54% rise of the SPX and a 7.35% rise of the NASDAQ, the NYSE up volume ratio was a somewhat unimpressive 5.4 to 1. Yes, a solid 80%+ up volume day but for a 1200-point DJIA rise, it seems a LOT of selling is going on underneath.
The disparity (so far) between the DJIA and the S&P500 (and Wilshire 5000) and particularly the Nasdaq Composite is stunning.
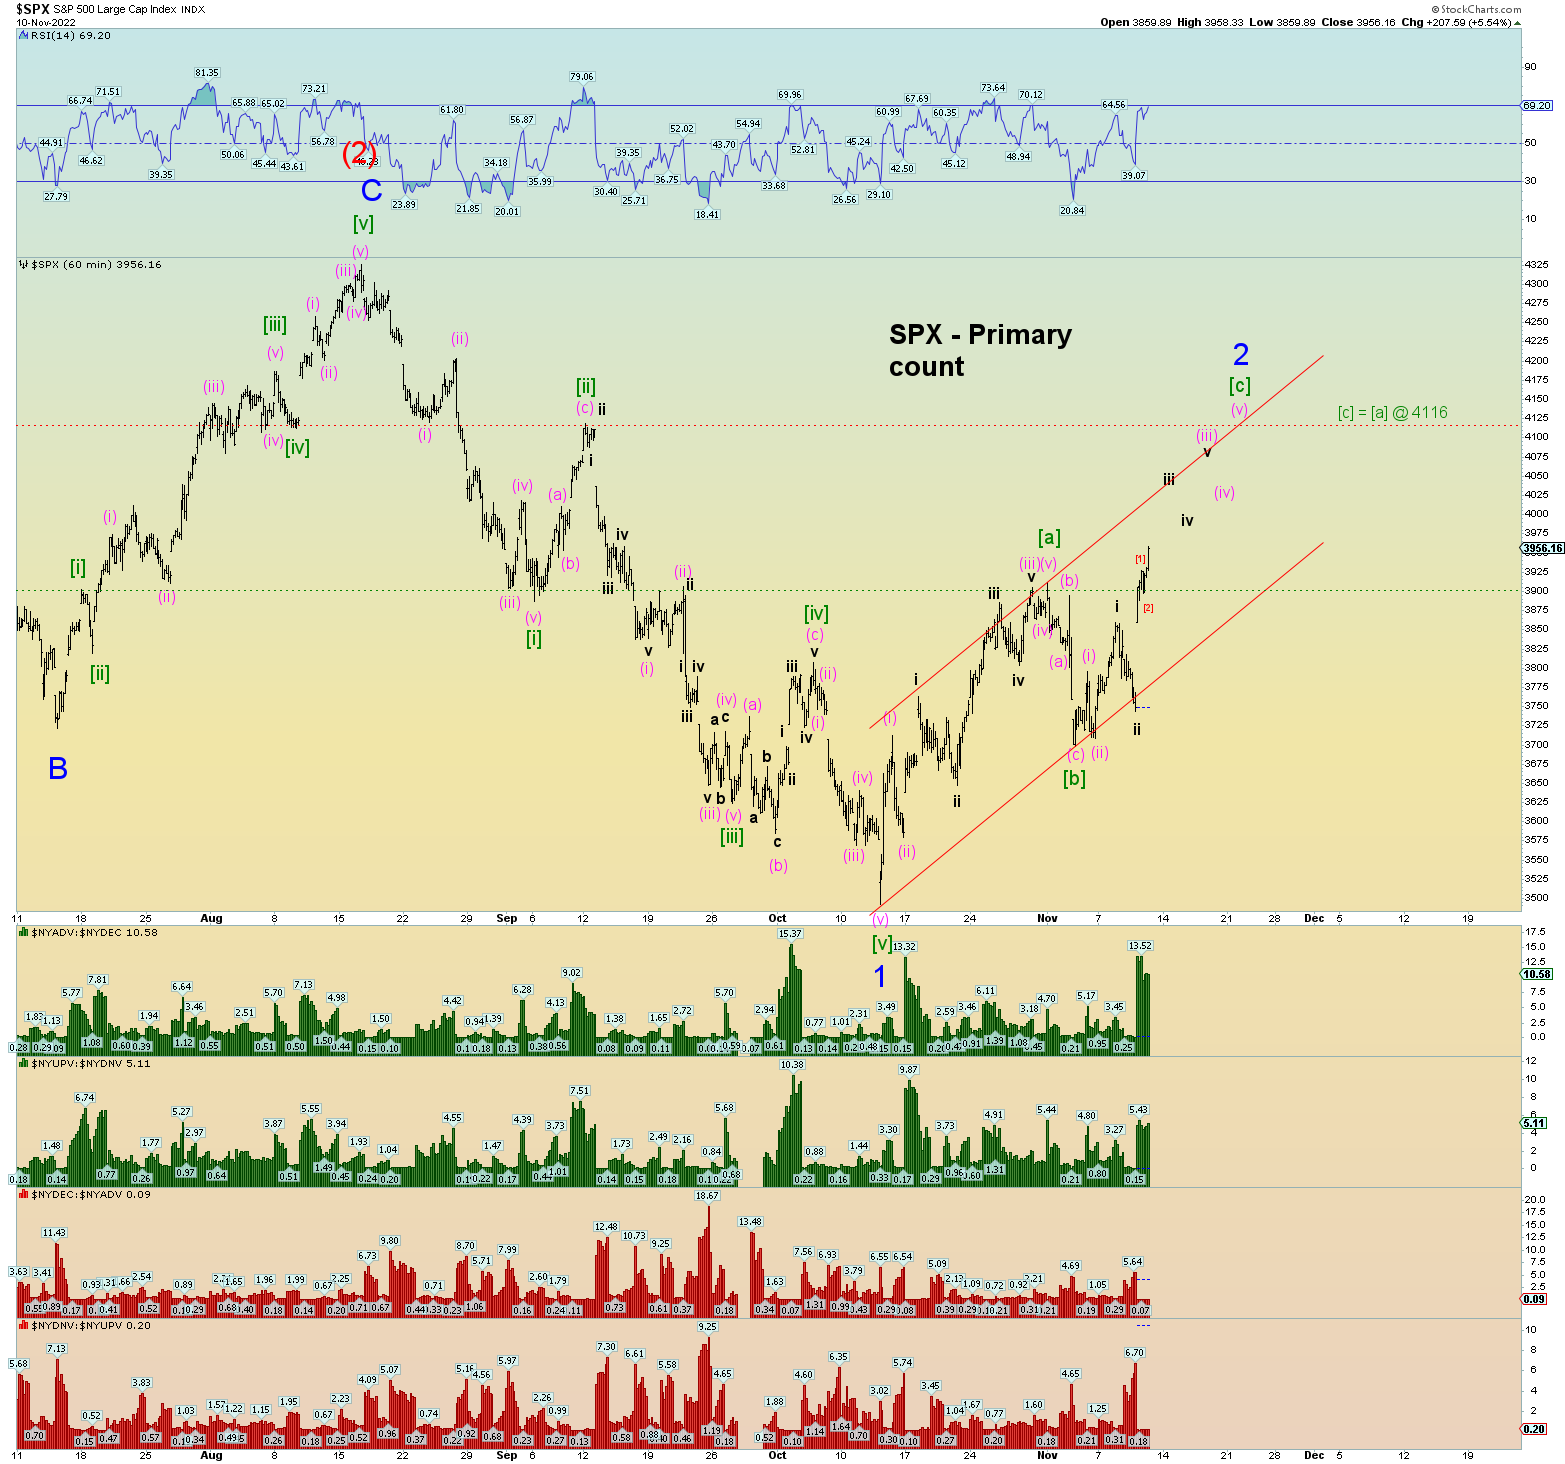
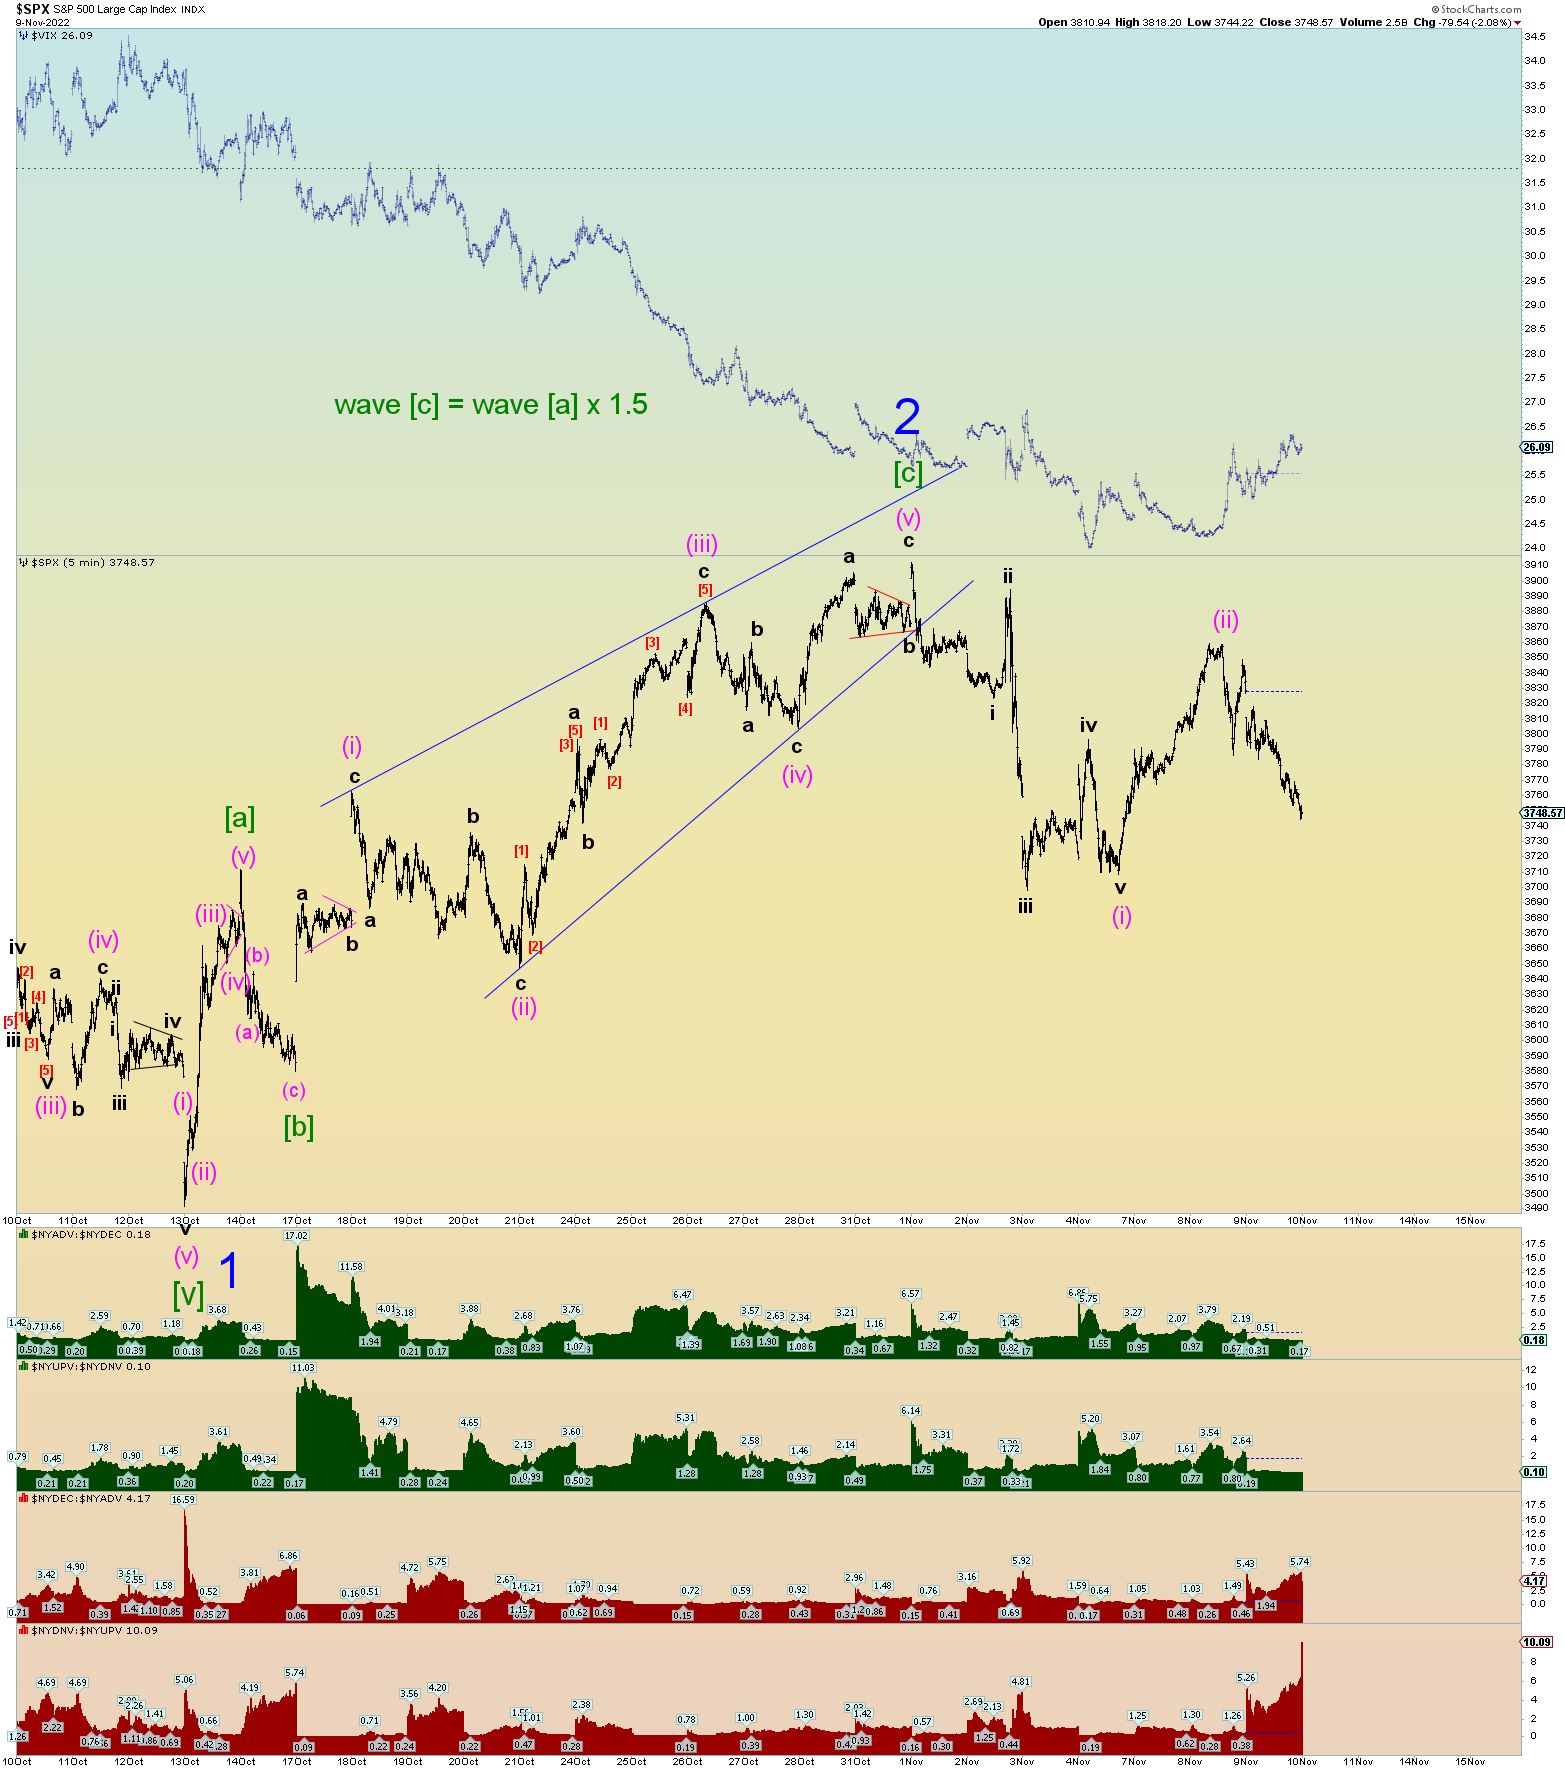
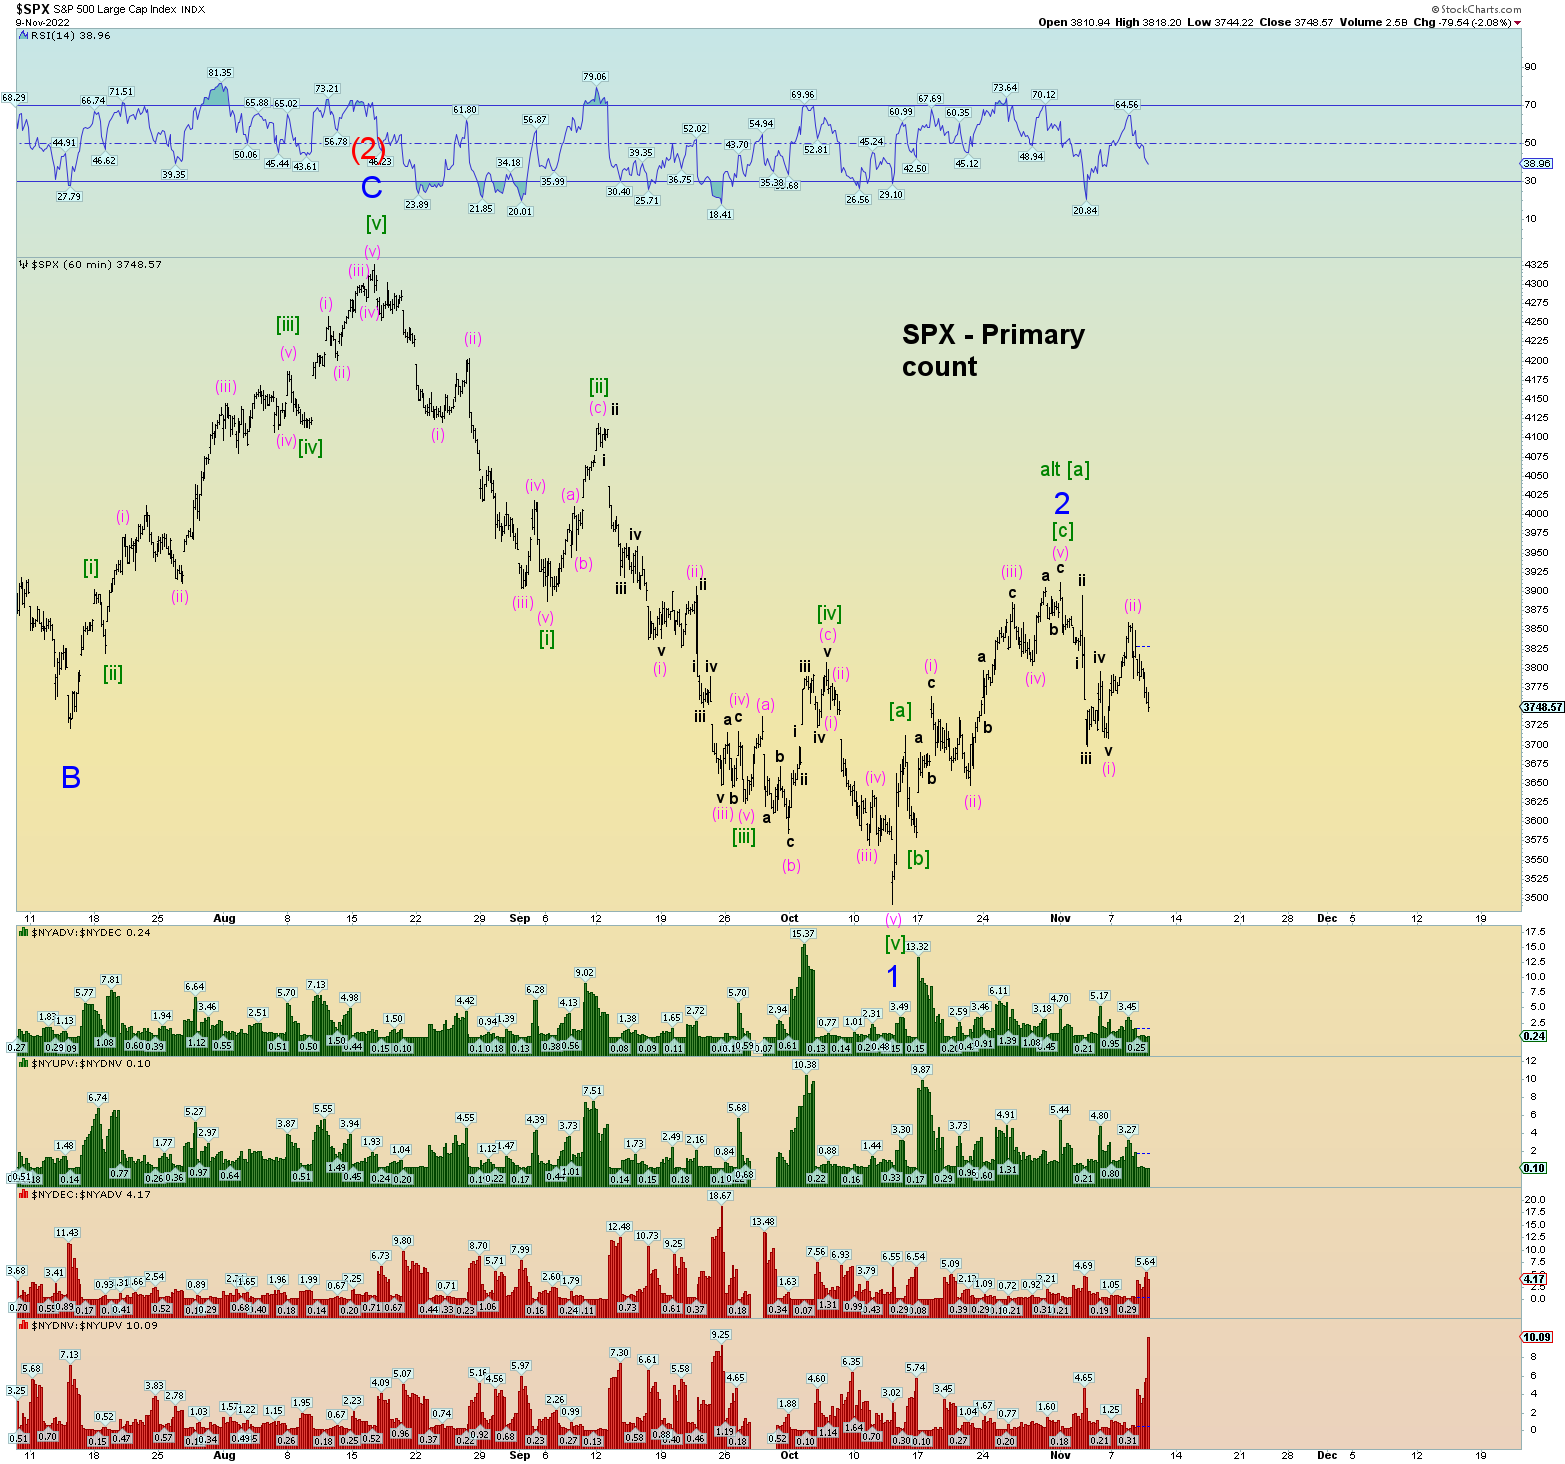
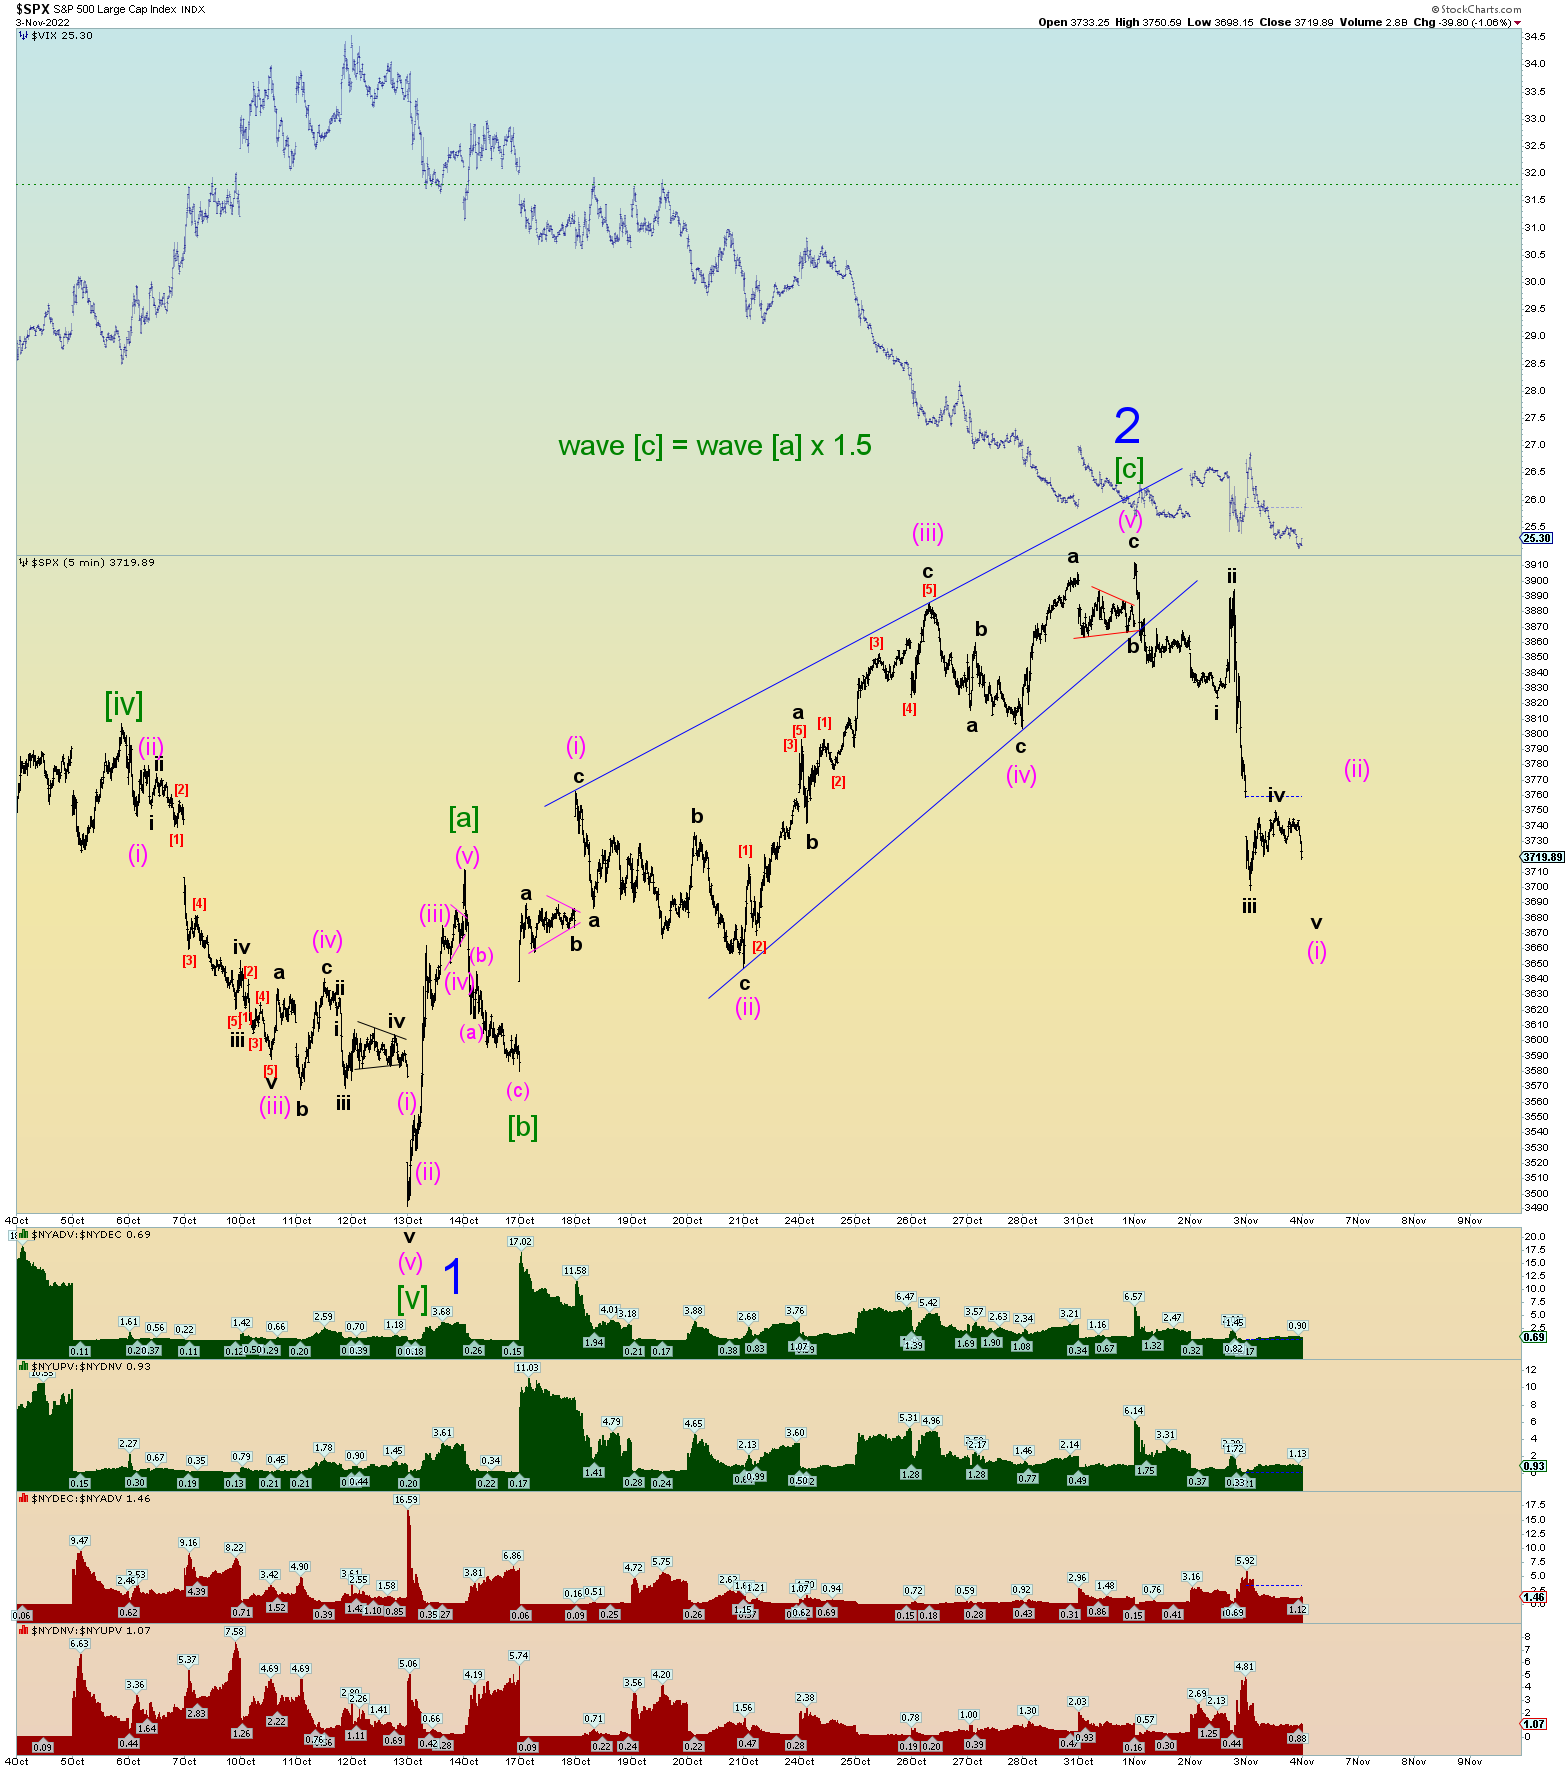
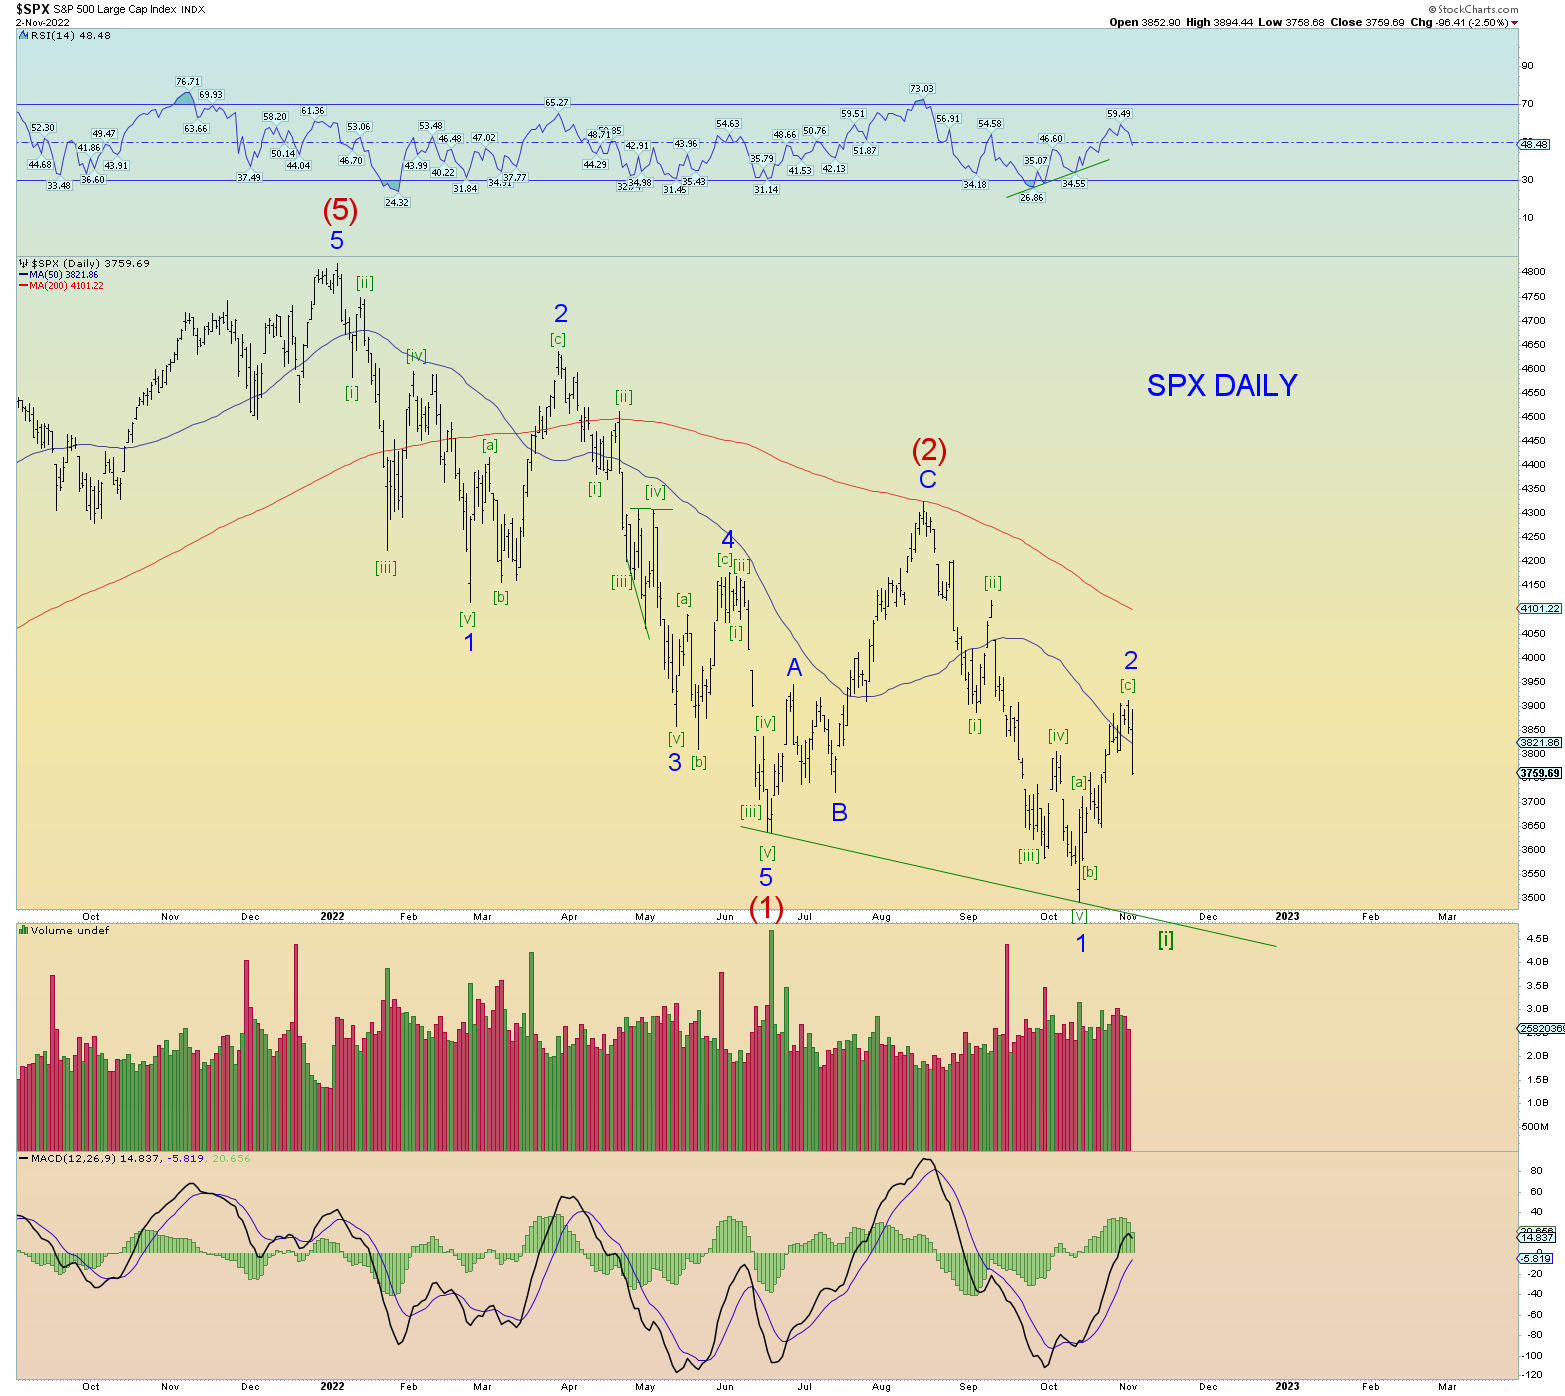
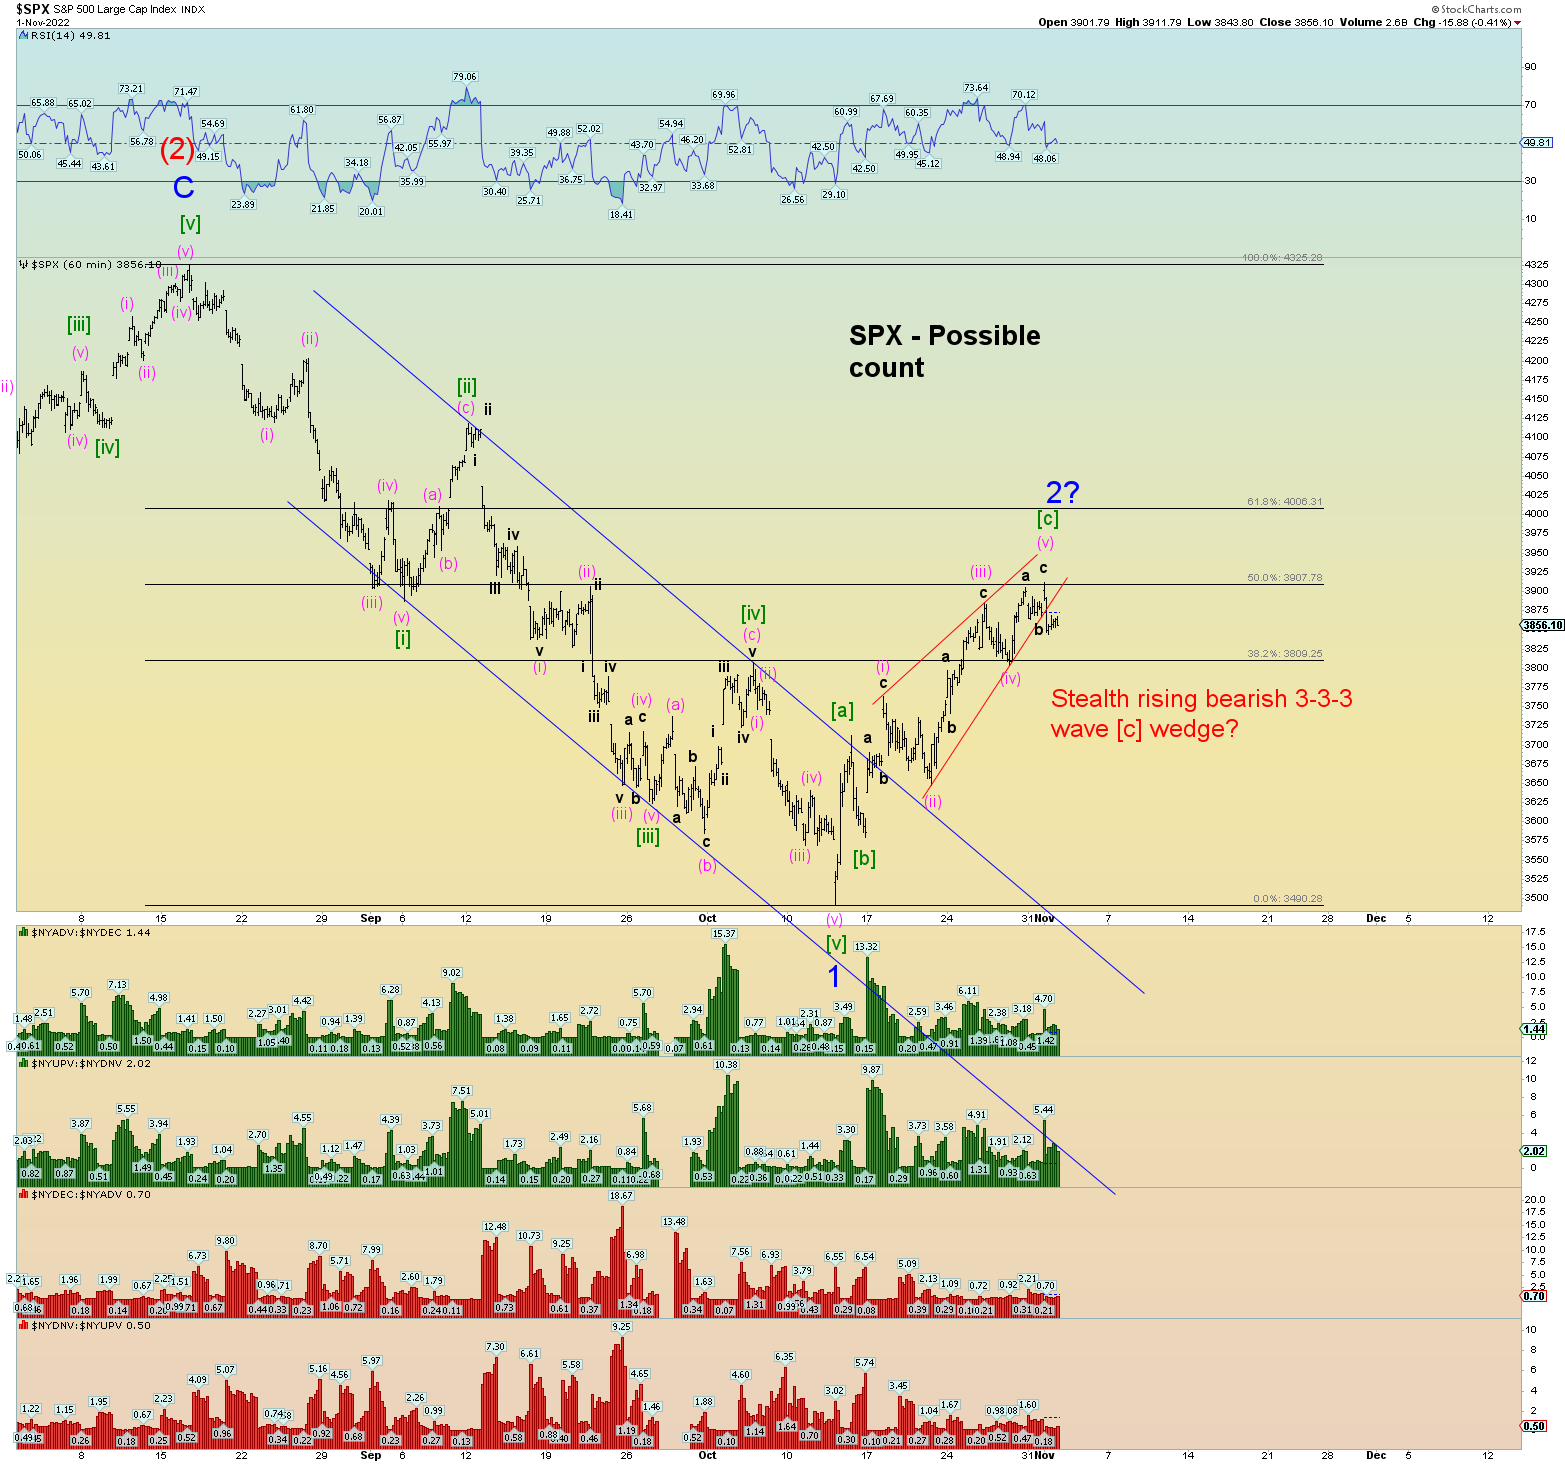
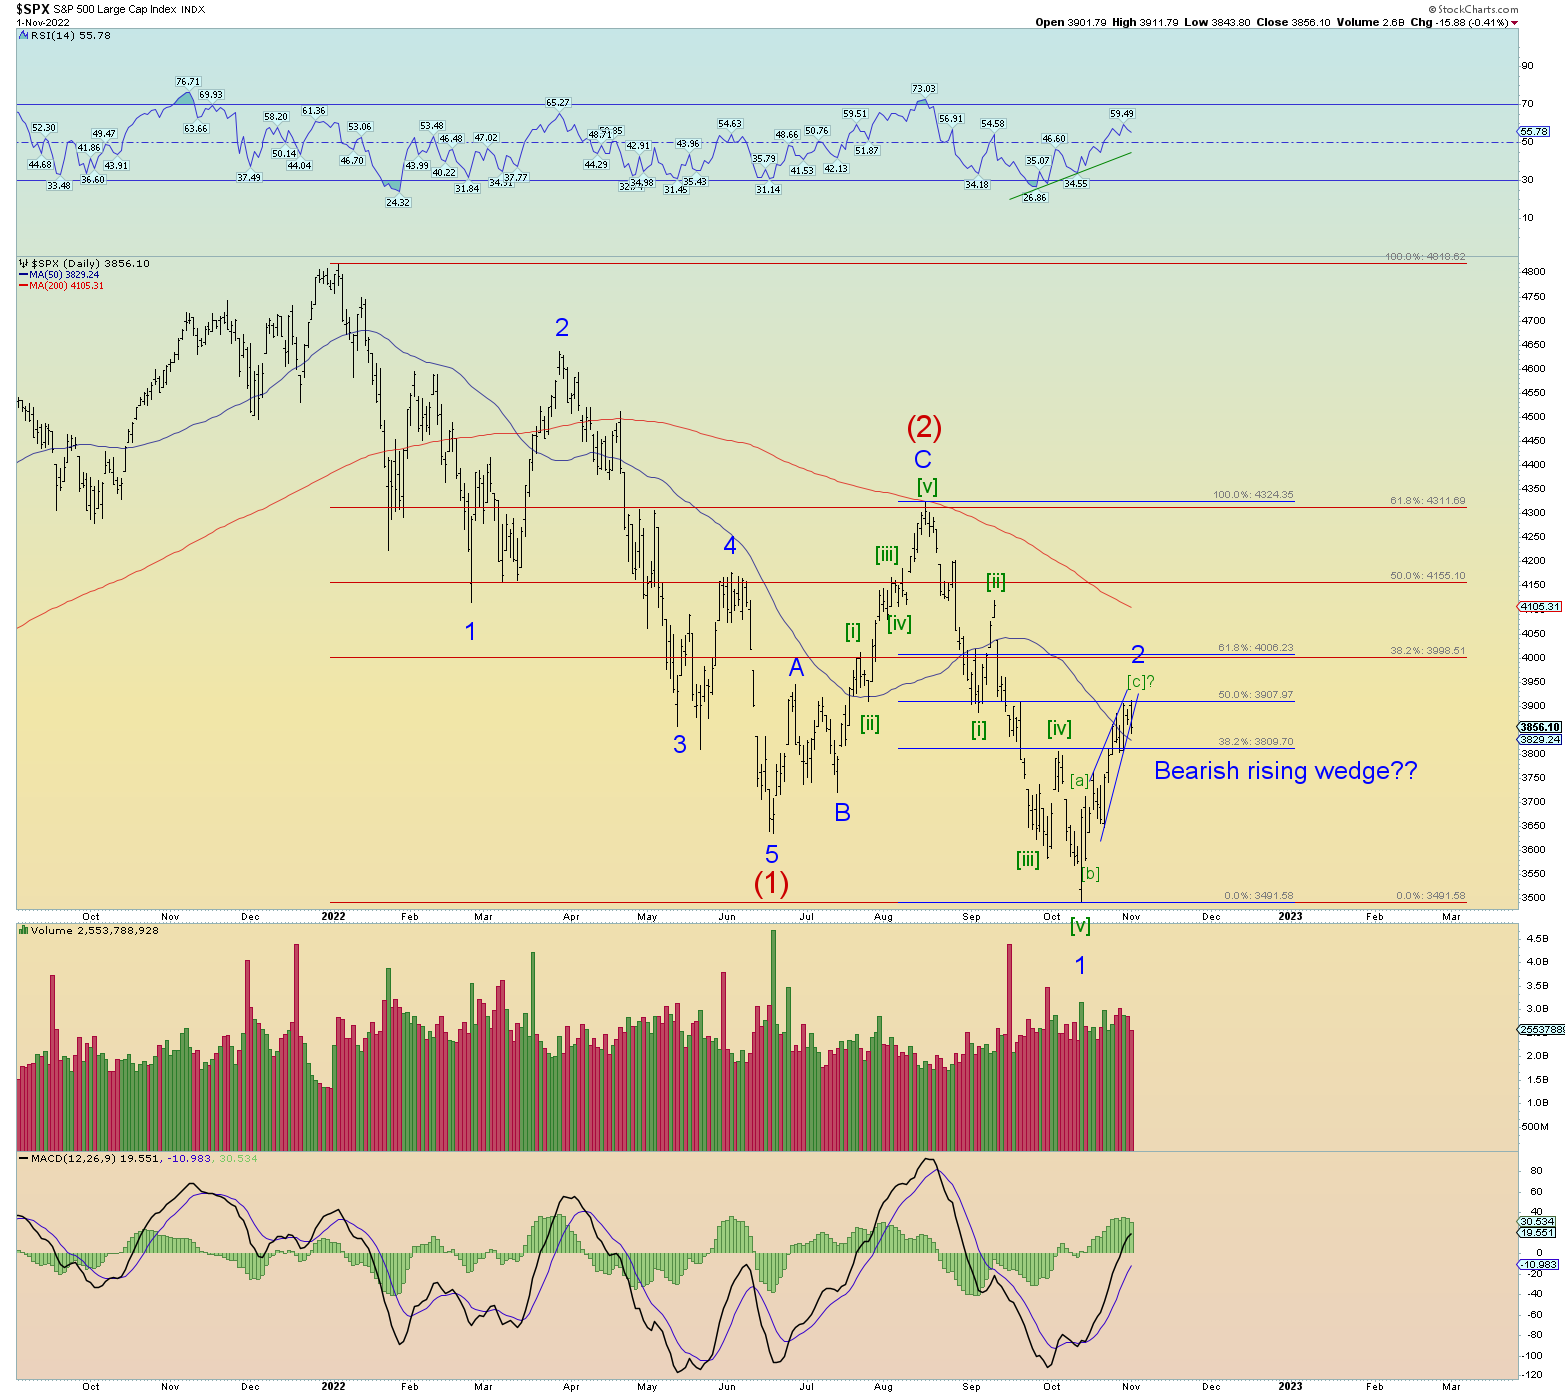
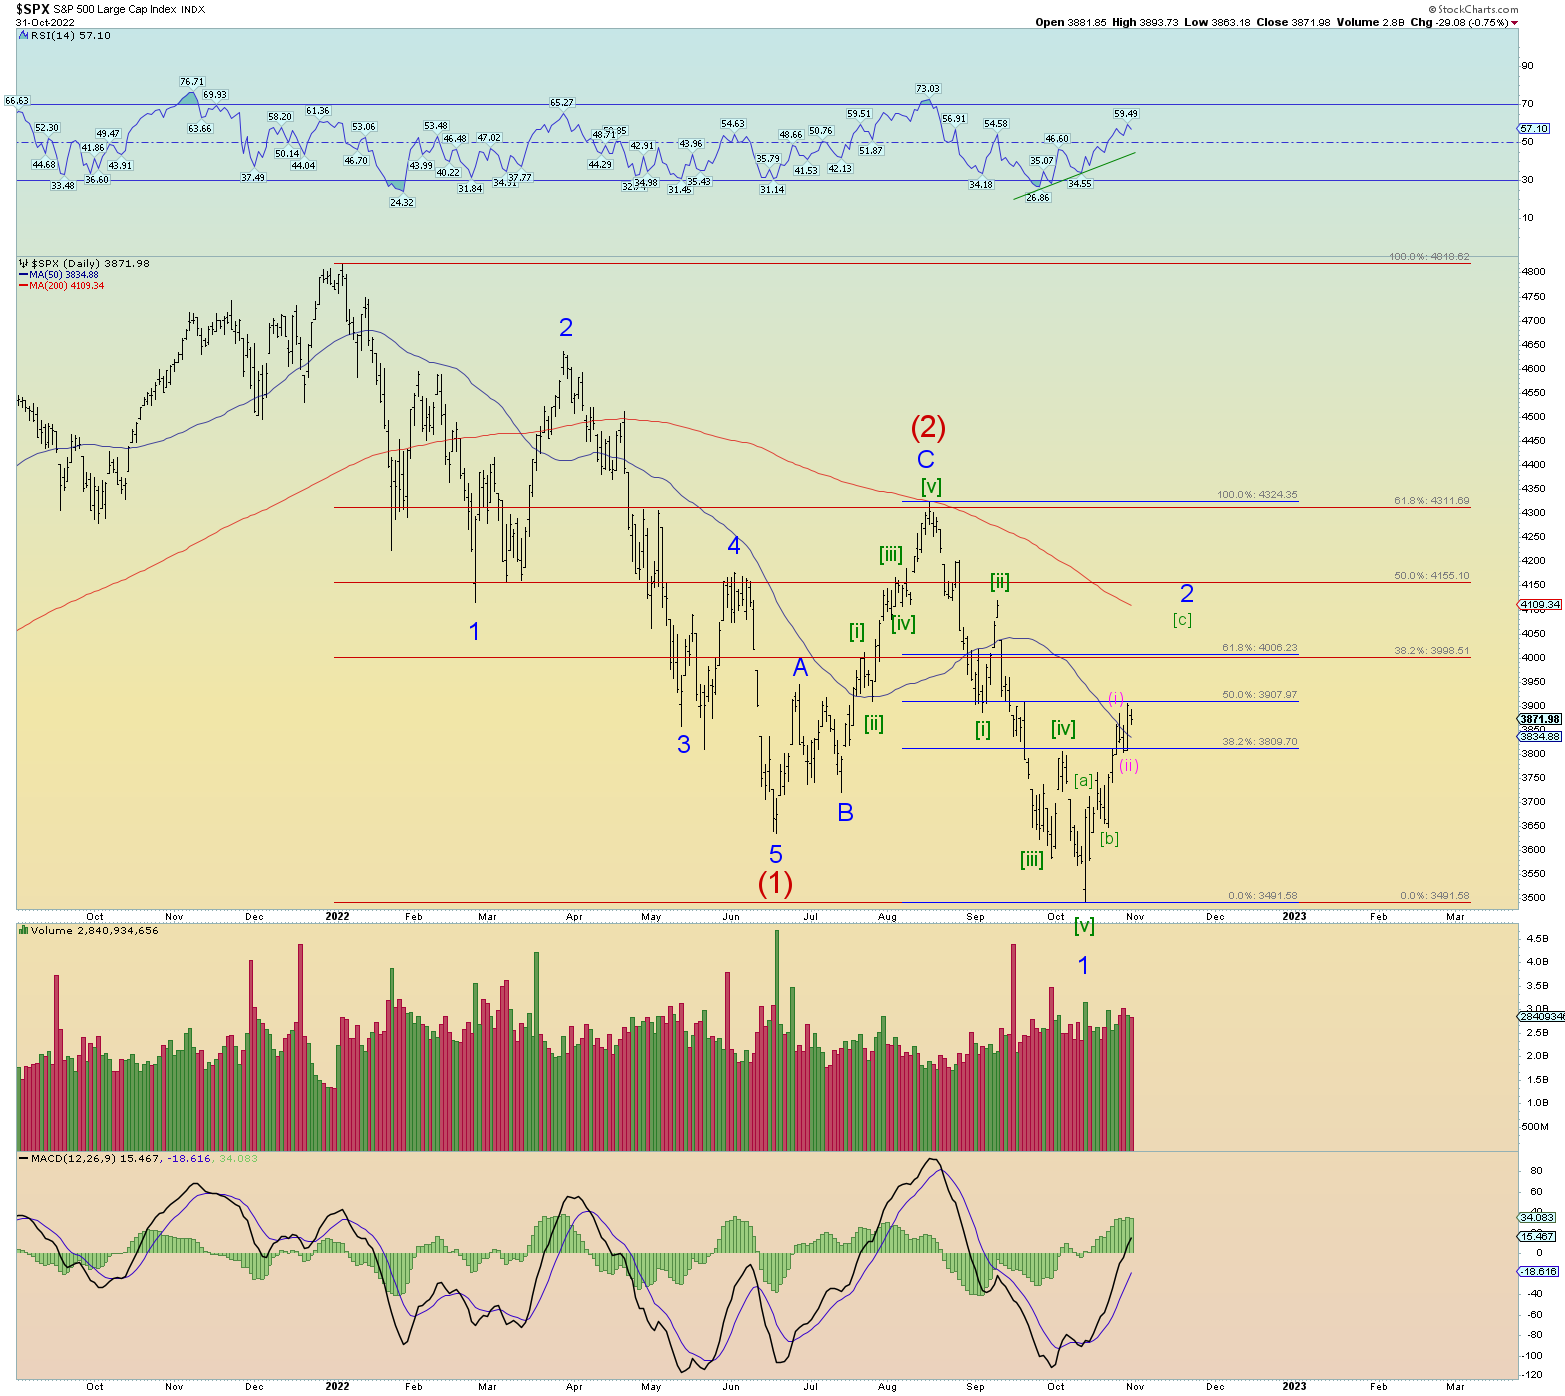
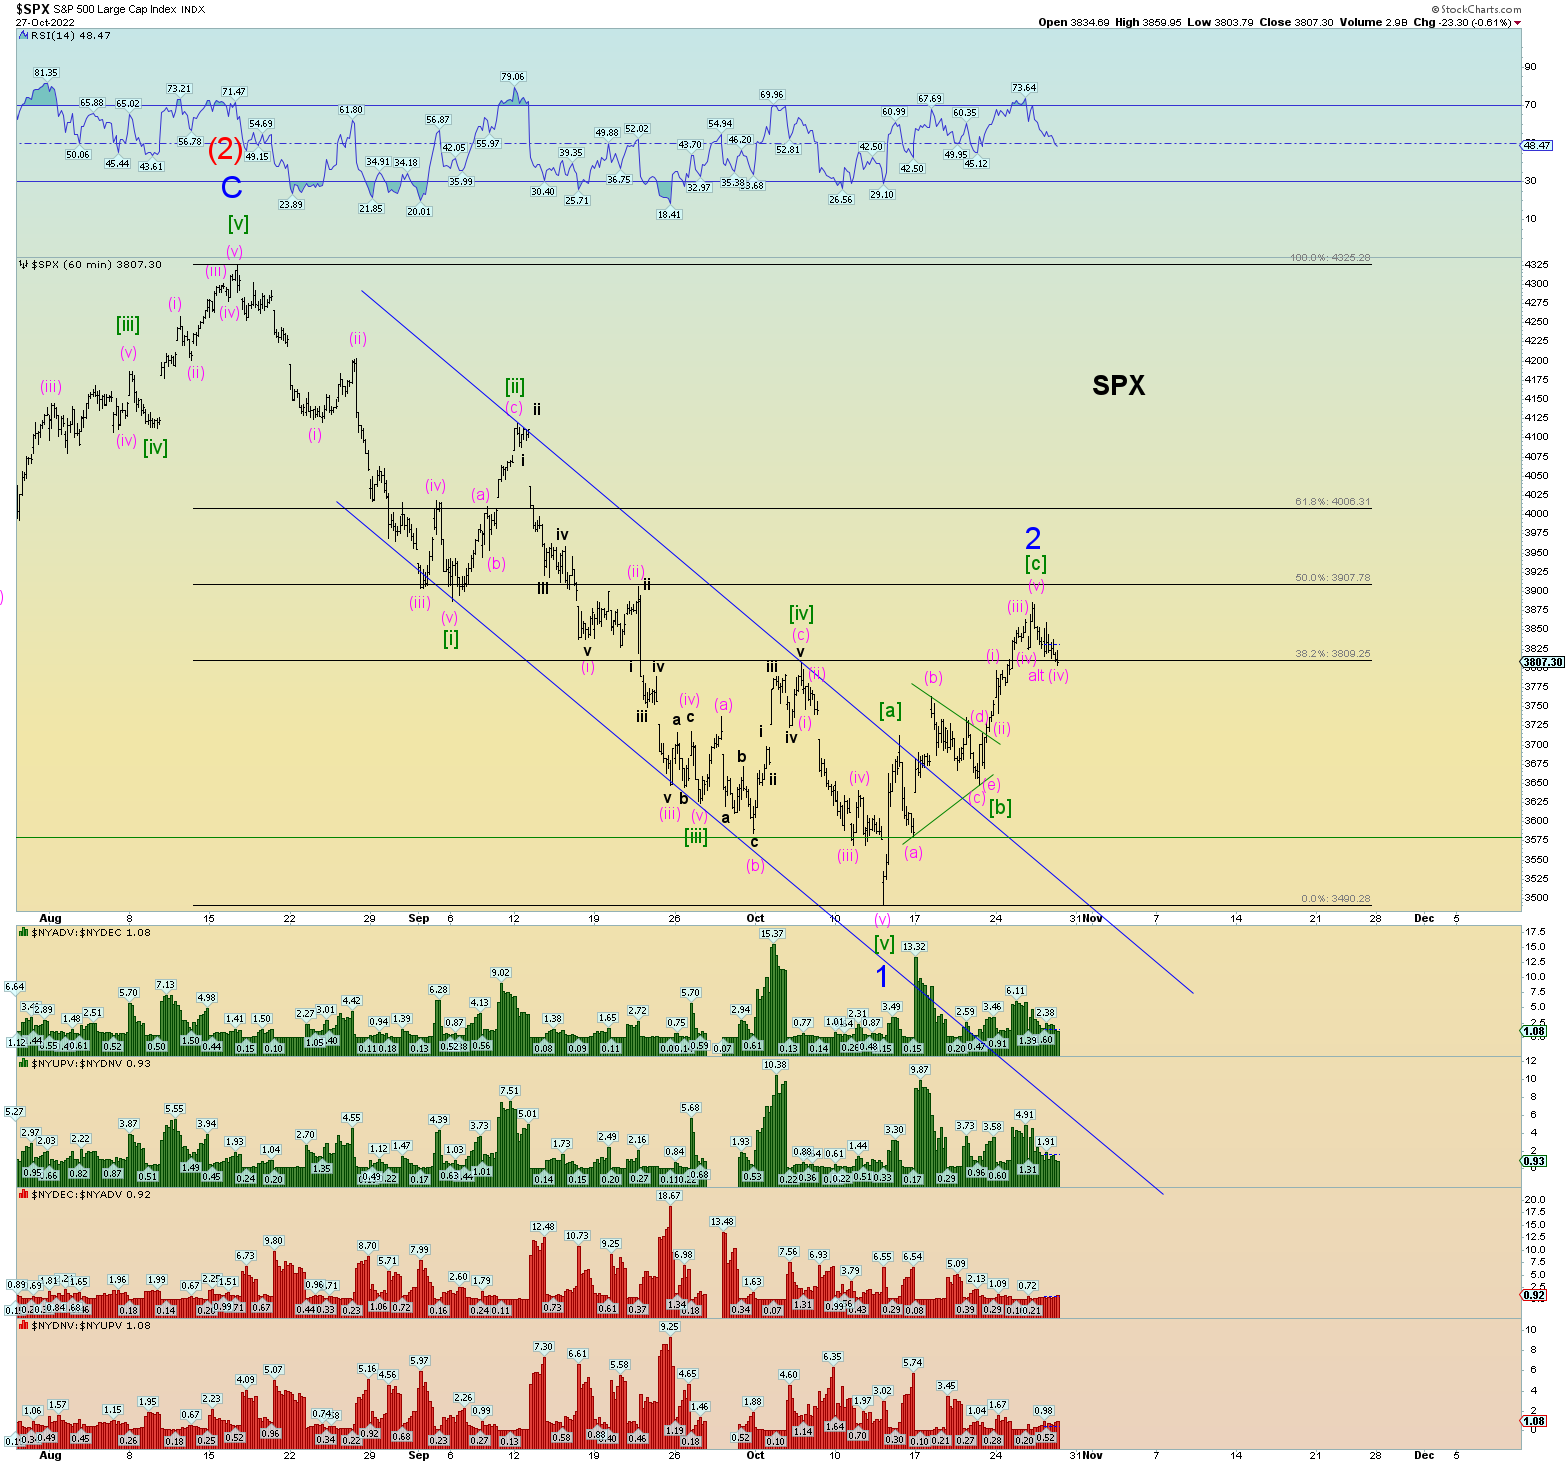
The count has been adjusted and simplified. Minor 2 of (3) down is counted as a 5-3-5 zigzag. Wave [c] of 2 would equal wave [a] of 2 at about 4116 SPX. That is next resistance. The open SPX gap down and the 200 DMA seems to be a target.
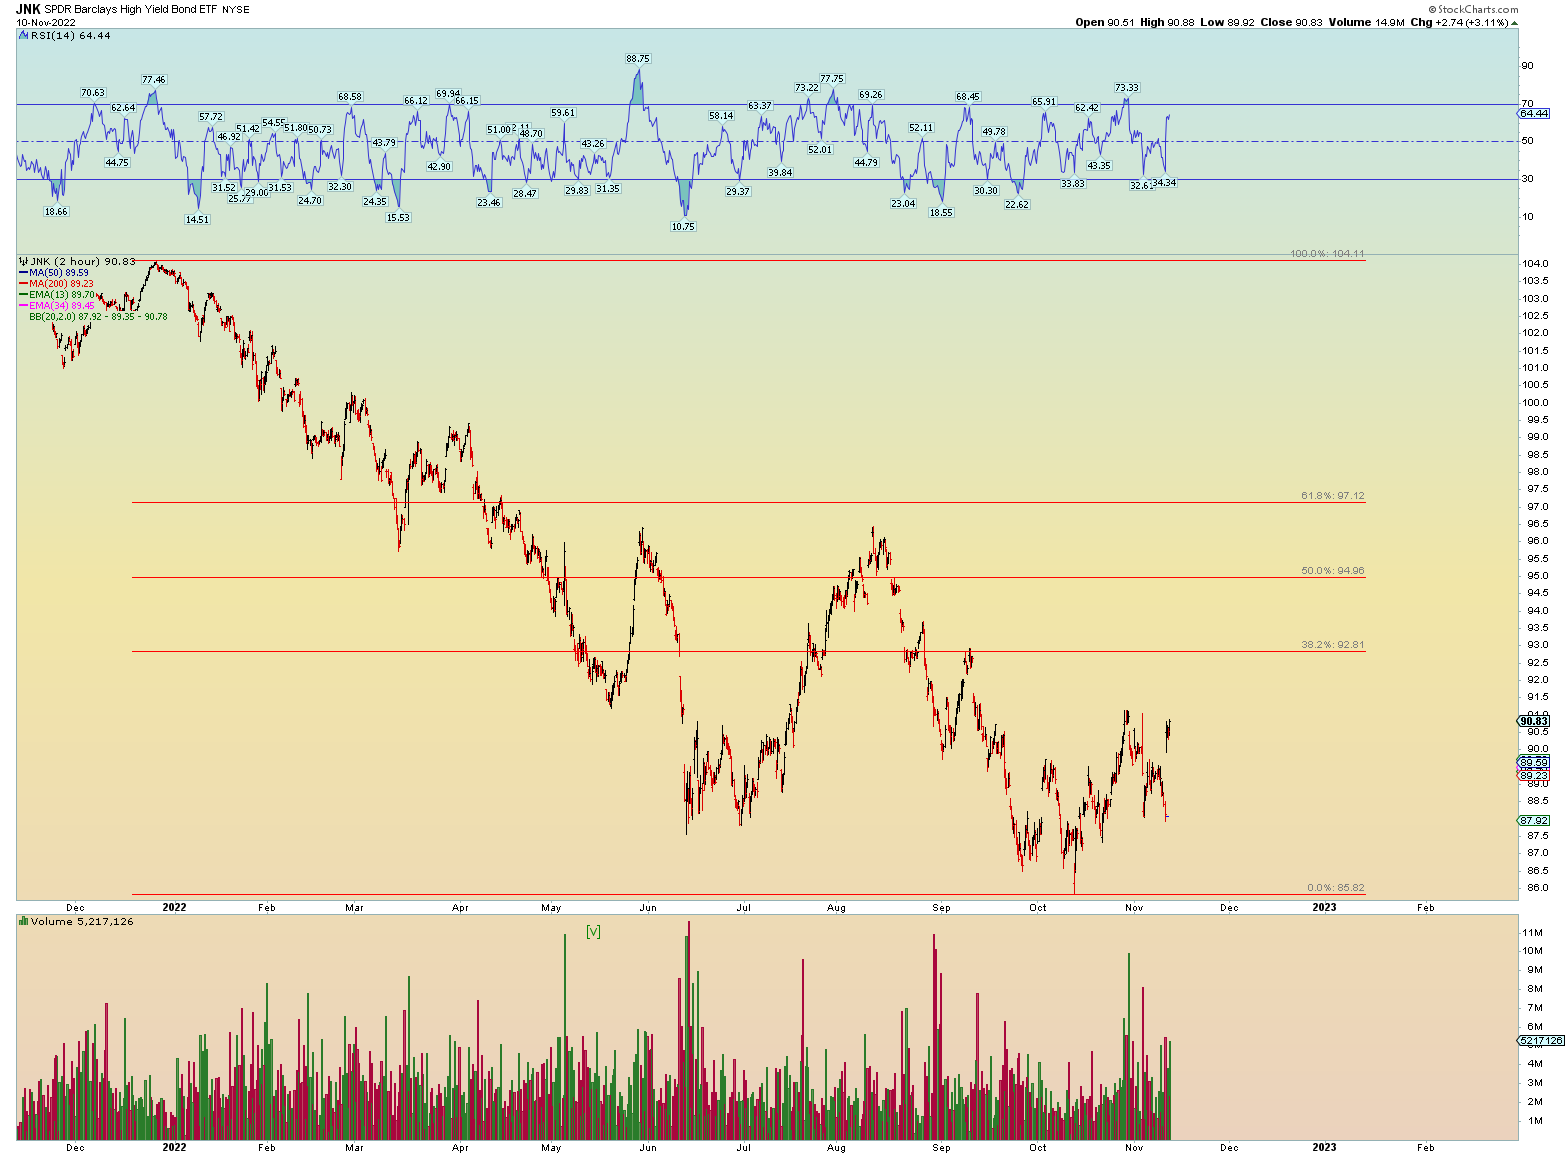
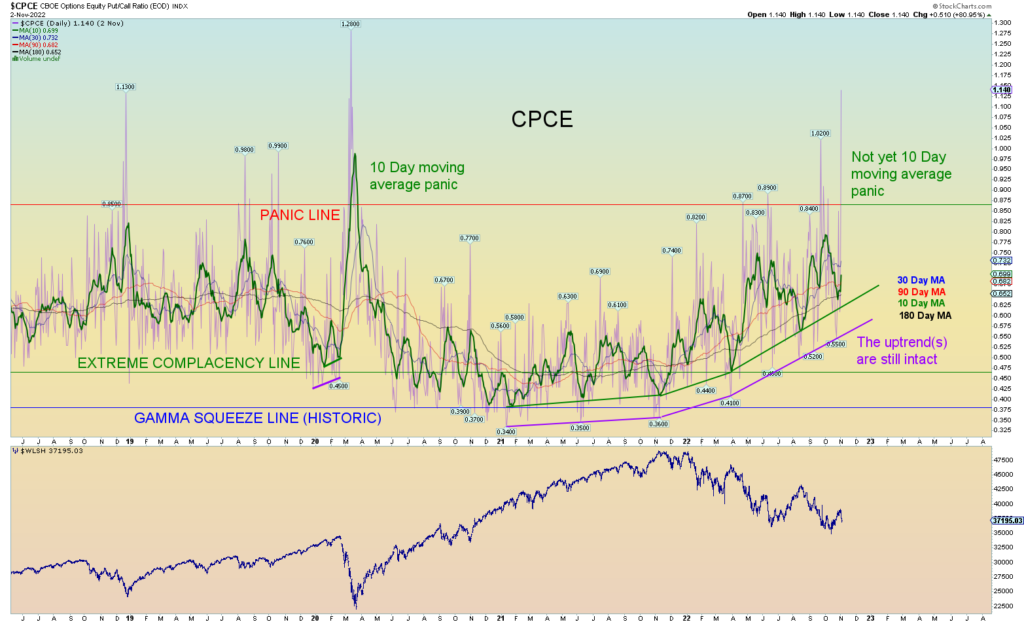
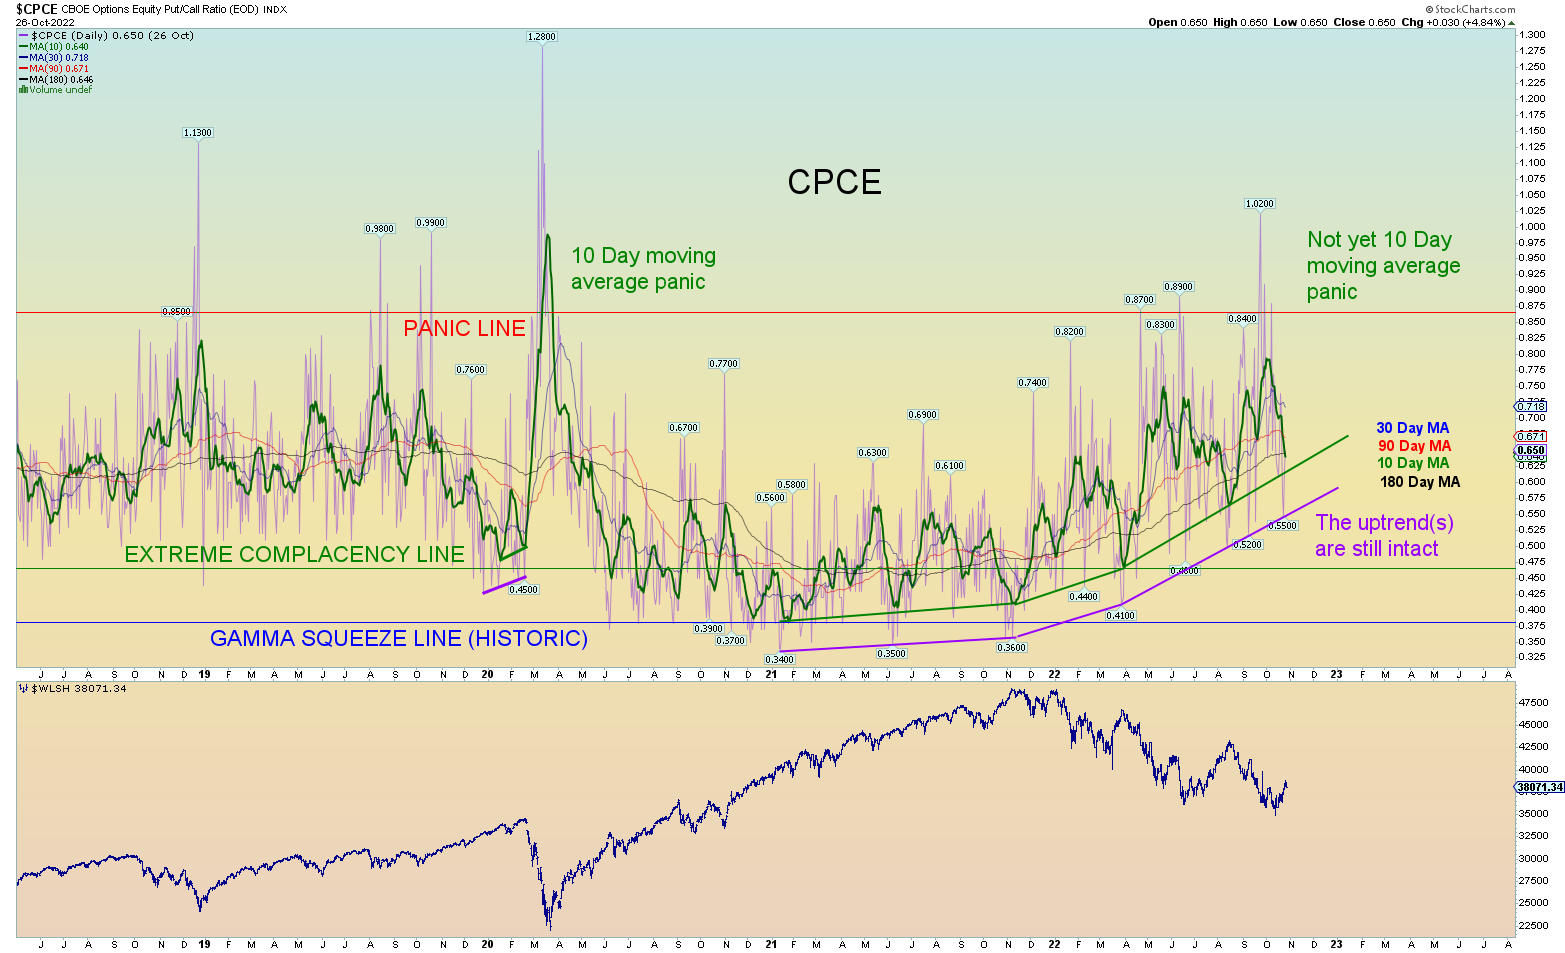
Real risk taking is lagging. This is JUNK bonds.
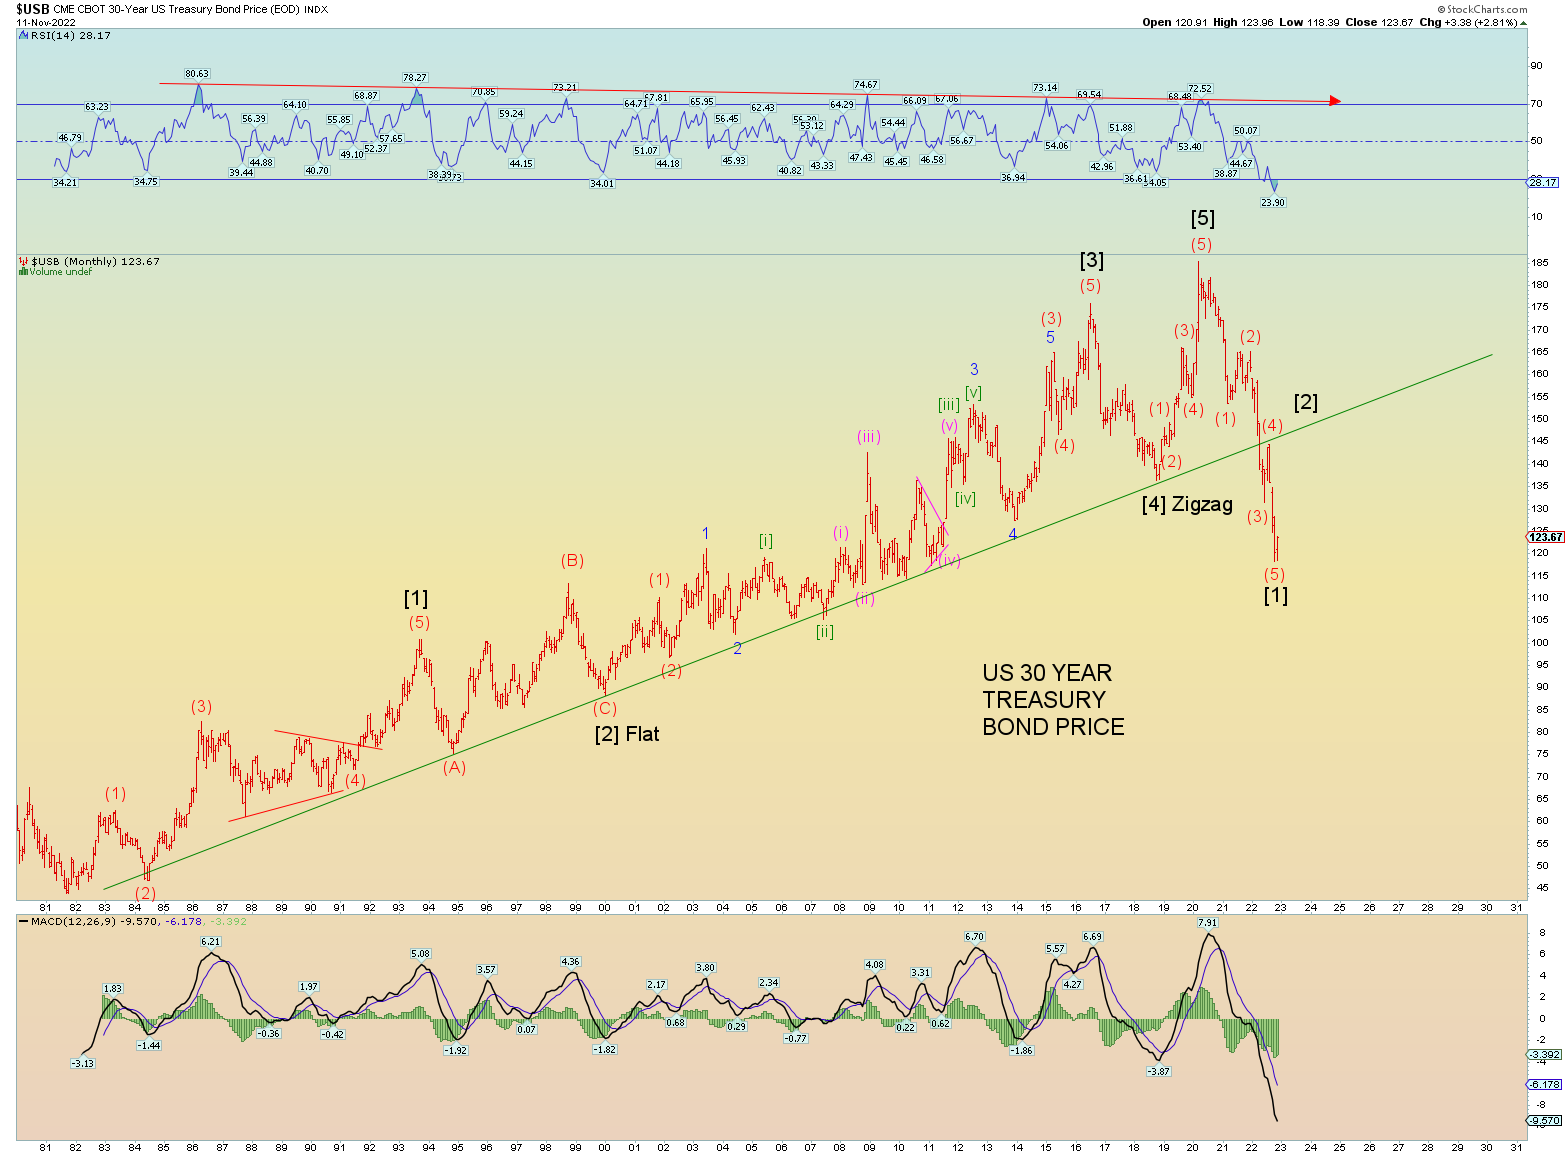
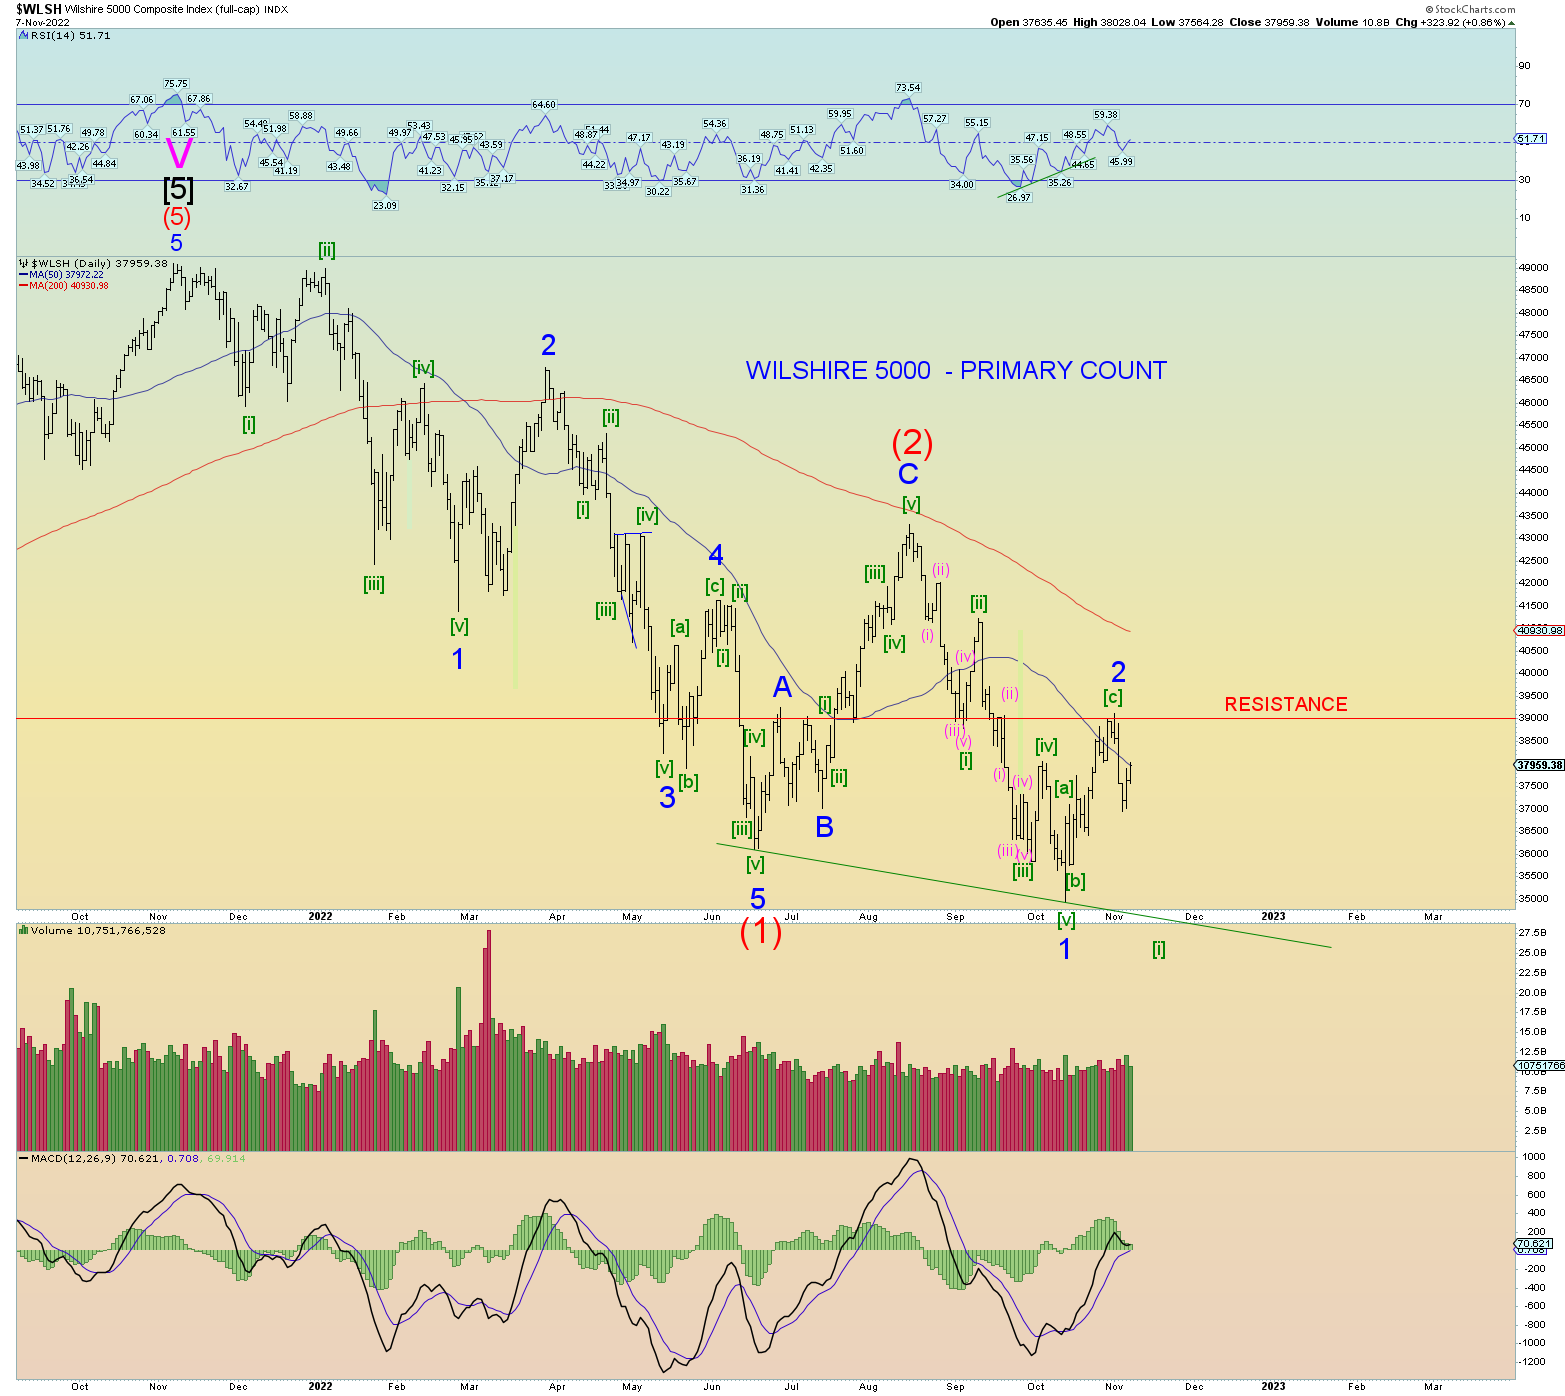
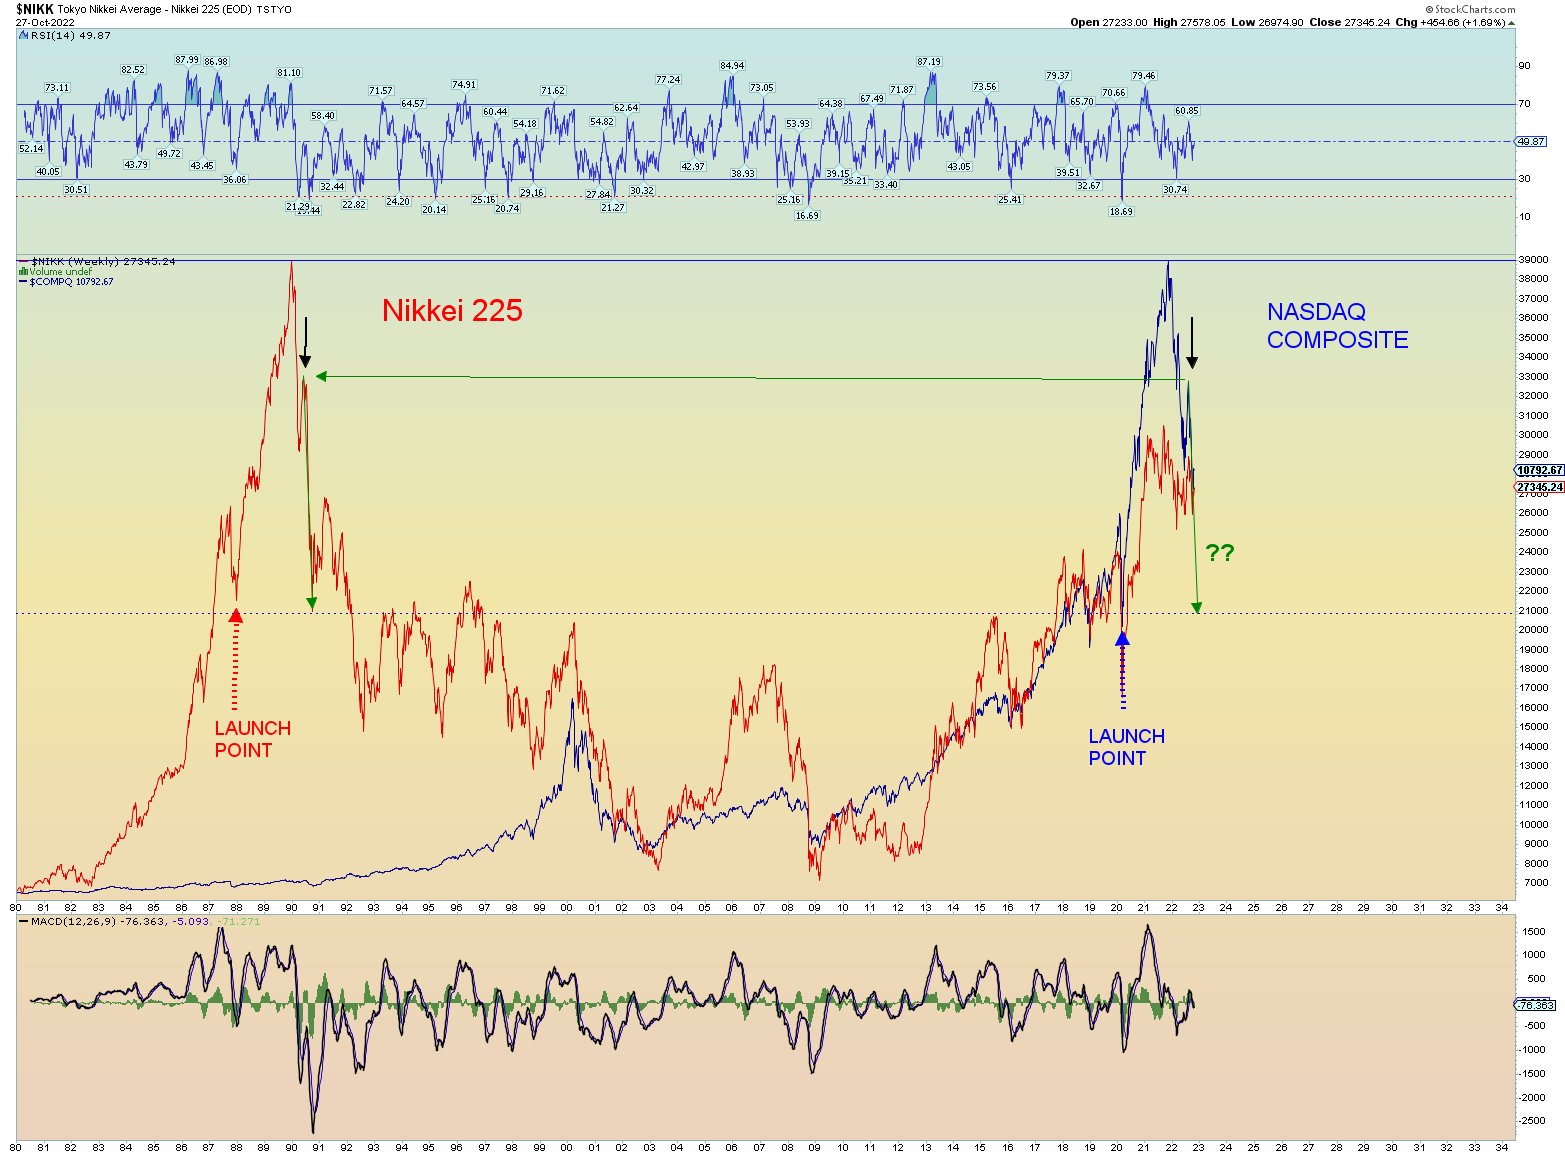
The top medium term alternate count is shown on the weekly. This is another test of the trendline as shown and a “fulfillment” of positive divergence of the weekly RSI. An amount of retrace of this much on the Wilshire and SPX almost suggests the DJIA may come close to achieving new all-time highs.
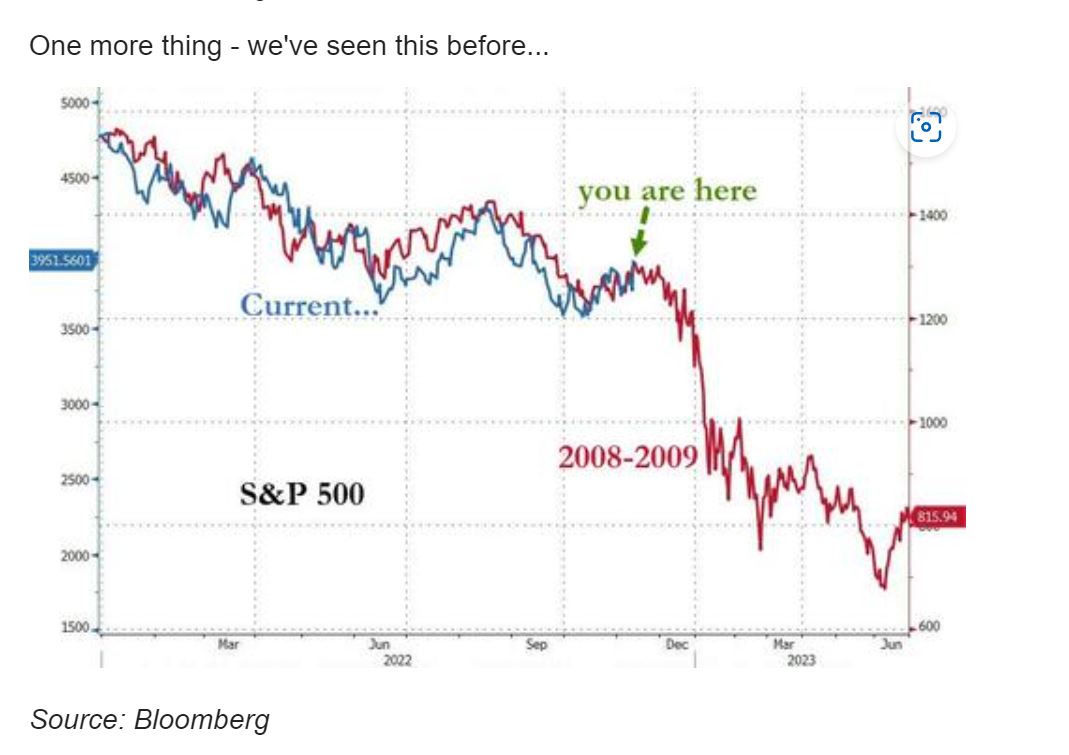
Still too early but I am throwing this out here (yet again) as something to consider.
The casino market awaits the election as if it’ll make a difference one way or another. The Uniparty both marches to the tune of the New World Order. You better believe it. Kabuki theatre for the masses.
Today went about as well as I could hope considering yesterday’s post warning that Minor 2 high was probably “in”. We did not get a 1-point rate hike but all the same the market head faked higher and then sold off bearishly into the low at the close. Today is the proposed “kickoff” of Minor 3 of Intermediate wave (3) down in the markets and being wave 3 of (3), this should be the strongest down wave(s) yet to come.
The path of least resistance is still downwards. If the count is correct, we are looking for the first Minute wave [i] of 3 of (3). Ideally, Minute [i] should again take prices lower than the previous lows, perhaps even much lower than shown here.
I’ve changed my tune somewhat tonight based on the last 2 trading days (which have gone sideways). The price action looks like “distribution” from strong hands to weak. All the “fever” of media news articles to come out since Friday’s ramp predicting higher prices now seem suspect. And we have a wave count to back it all up.
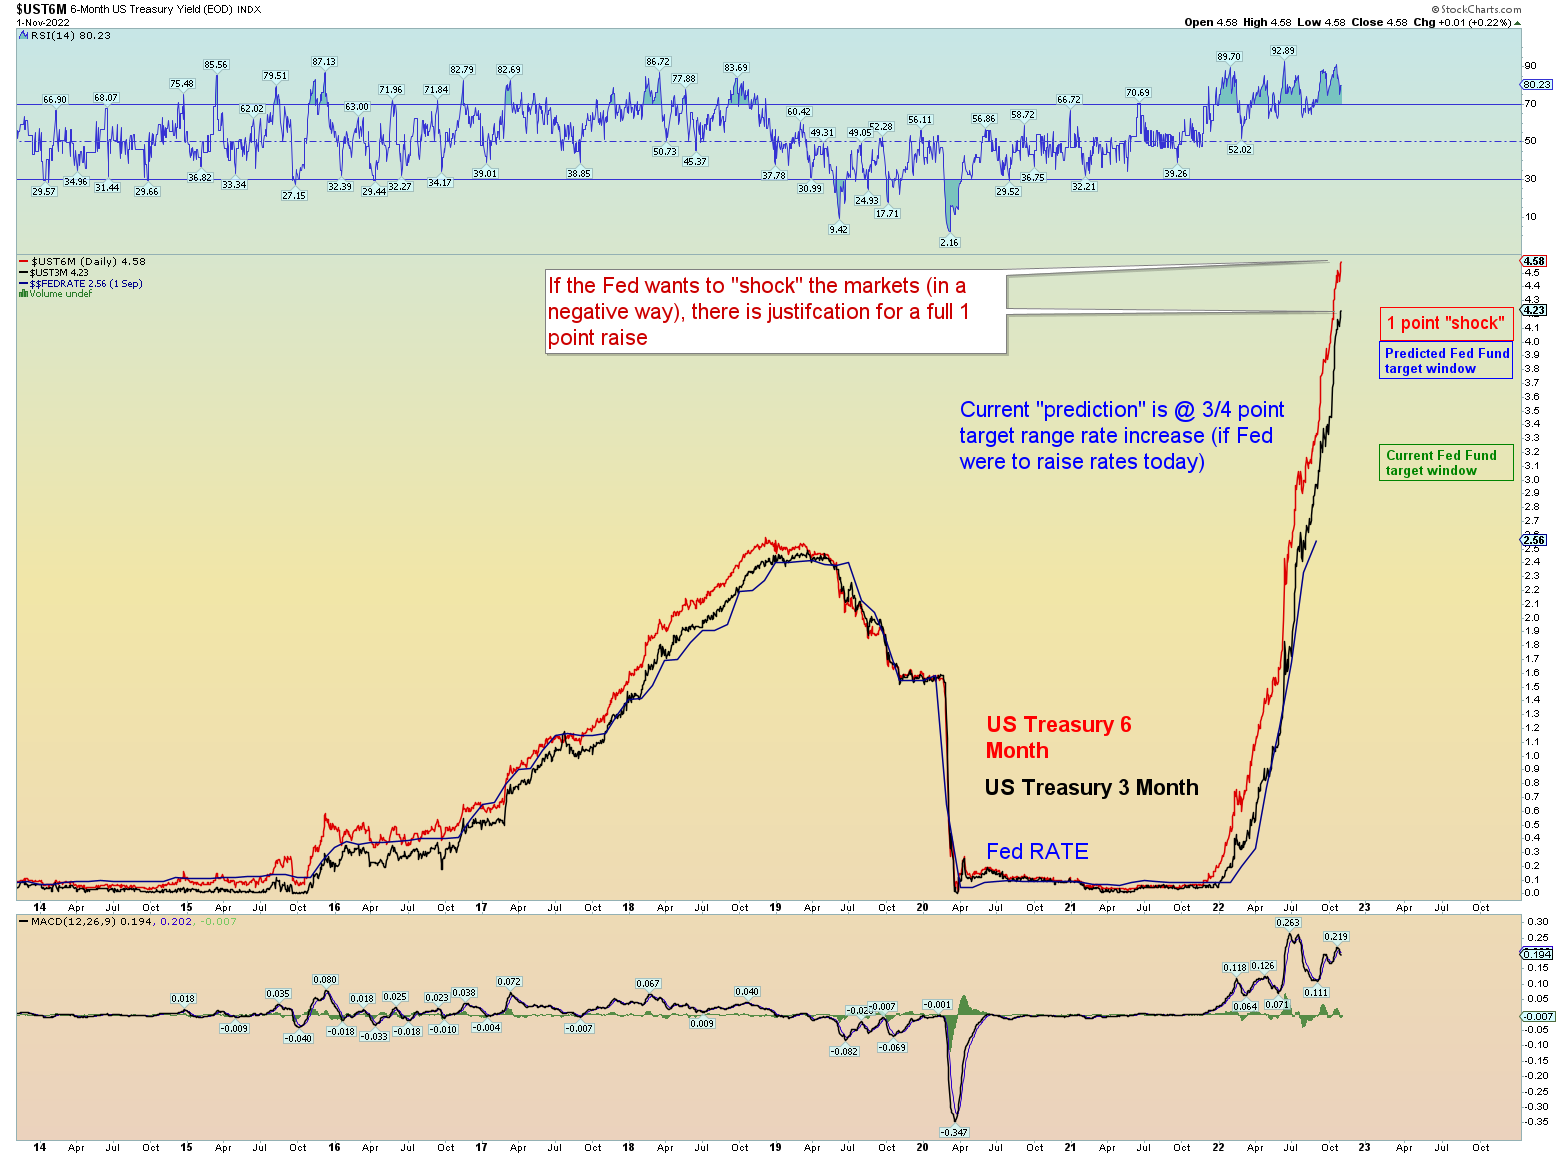
First things first. What will the Fed do tomorrow? Well, the 3/6-month yield chart suggests that 3/4-point raise is in the bag. However, if the Fed wants to “shock” the market in a truly negative way, a full 1-point rate hike is not off the table. In fact, had the 3-month yield been only a few ticks higher, that would be a done deal.
I have been saying the “marching orders” for the Fed (from Satan) for the past year is to not help the markets at all. And so, the odds of a full 1-point hike tomorrow resulting in the biggest market collapse in a long time is palpable. If not, nevermind.
Do we have a “stealth” ending diagonal triangle that does not actually overlap waves one and four? Could be. Advancing in a-b-c formations. The disparity between the “generals” (DJIA) and the “troops” (Nasdaq and the rest of the market) is quite glaring.
Retarded DOW, which is why I, don’t use it for primary overall count. I hate this count but the rapid rise since the recent low has been historic. Over 50% of the entire decline since peak.
The overall primary count of wave 3 of (3) down is a powerfully negative predicted wave. We may on the verge of the “kickoff” of the greatest downdraft the markets have seen in many a decade.
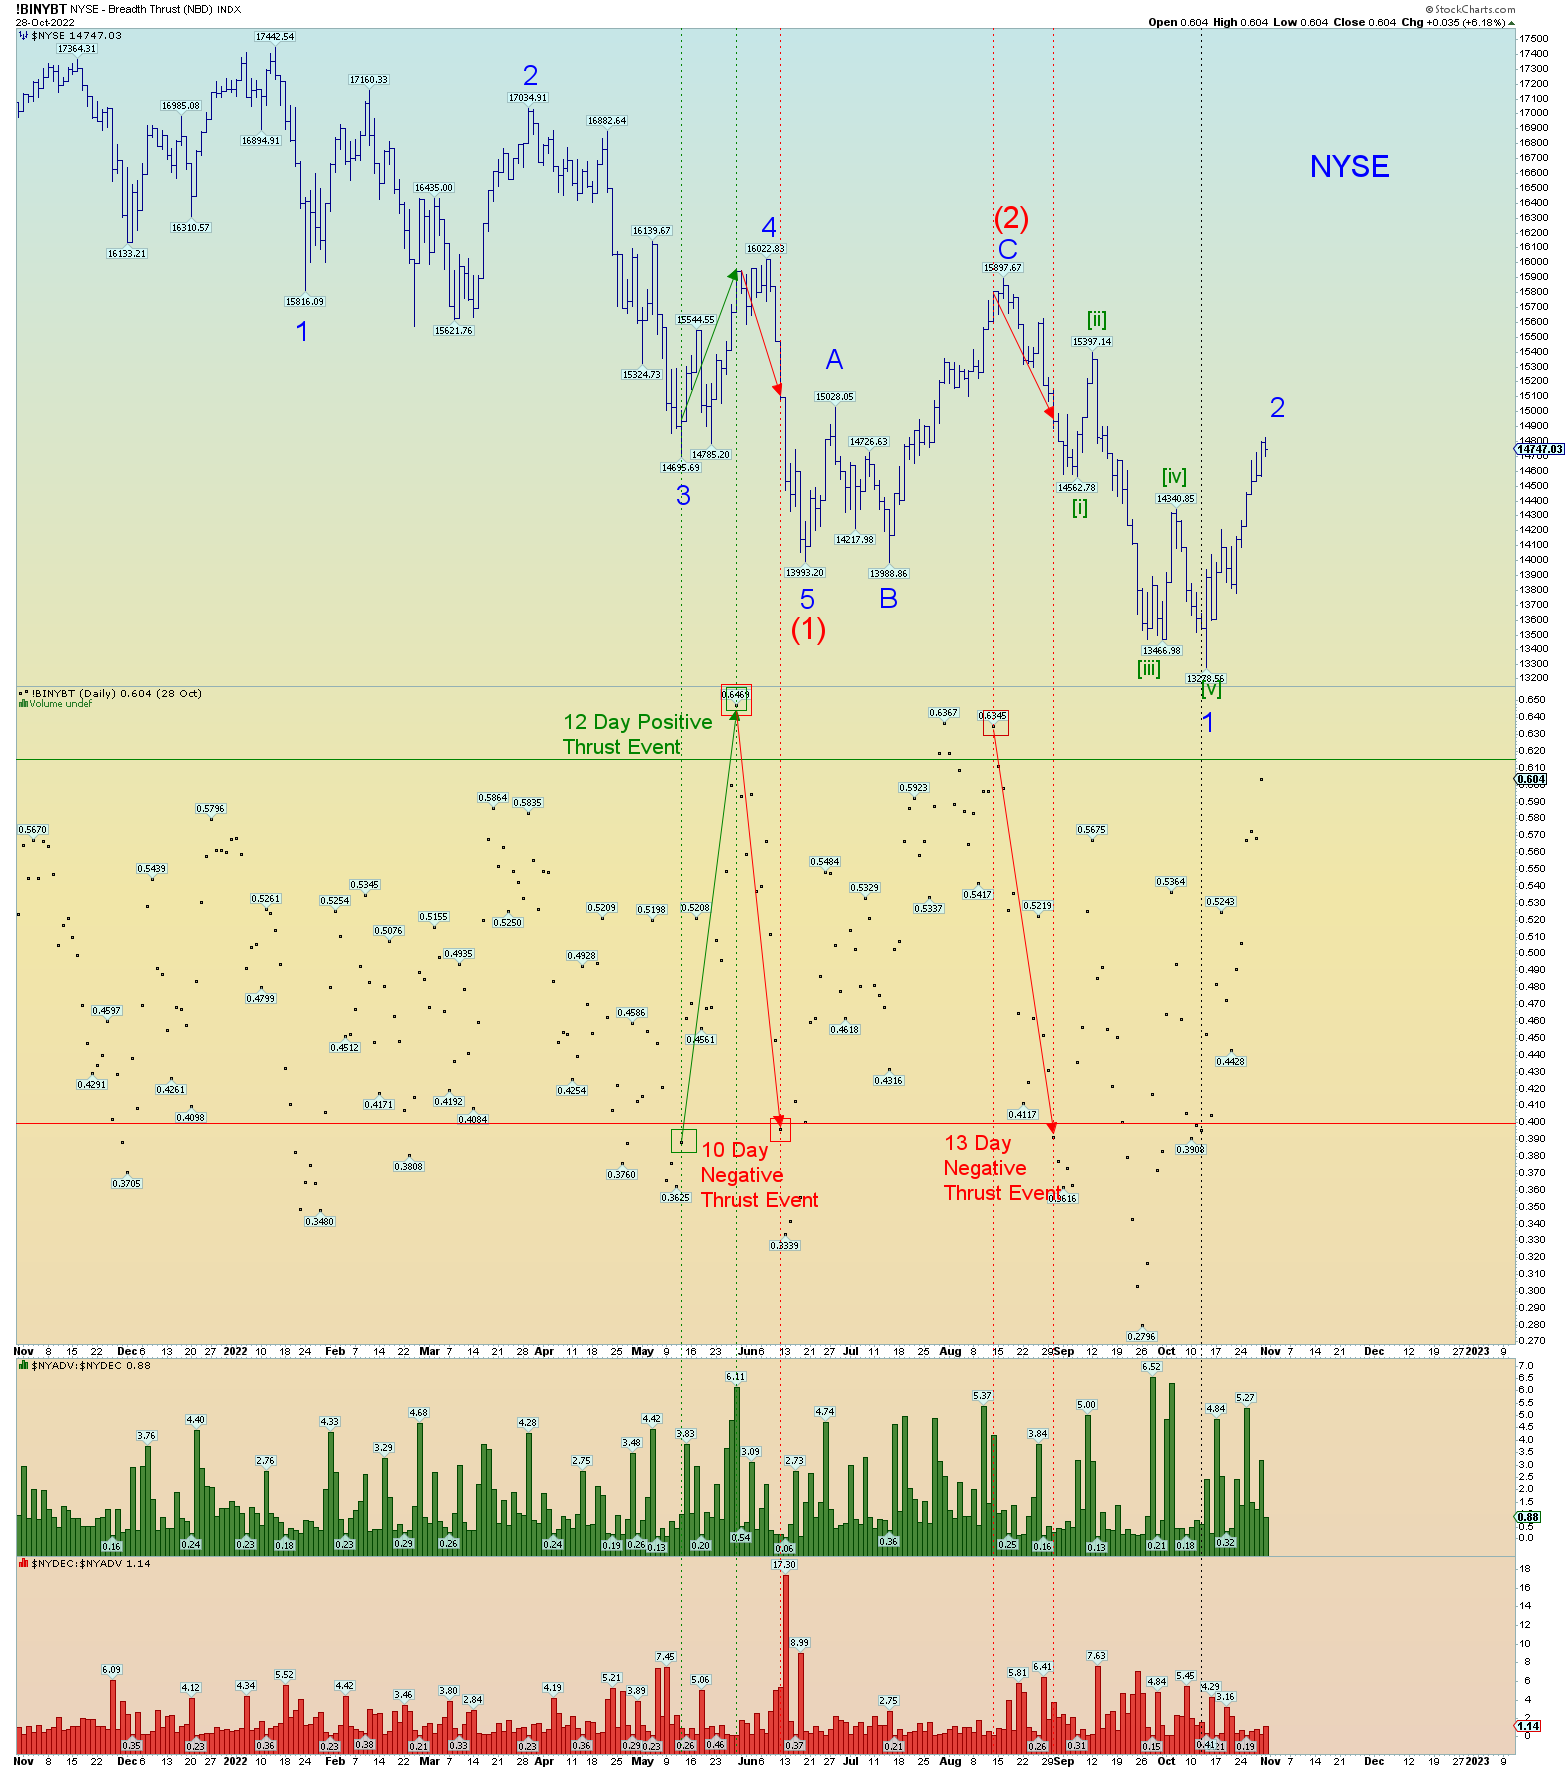
Well, today was a kick in the nuts for bears. The market is likely heading higher, perhaps closing the open gap down in the SPX. Today may have even triggered a NYSE “breadth thrust event” (13 days) as I like to call it. I won’t have that data until Monday though from Stockcharts.
Therefore, the count is much like Intermediate wave (2) in that wave “C” of (2) stretched itself out very bullishly (and then collapsed). It seems Minor 2 of (3) is doing the same. Wave [c] of 2 is stretching itself out to the fullest perhaps.
200 DMA seems “hell or bust”.
200 DMA seems a likely target.
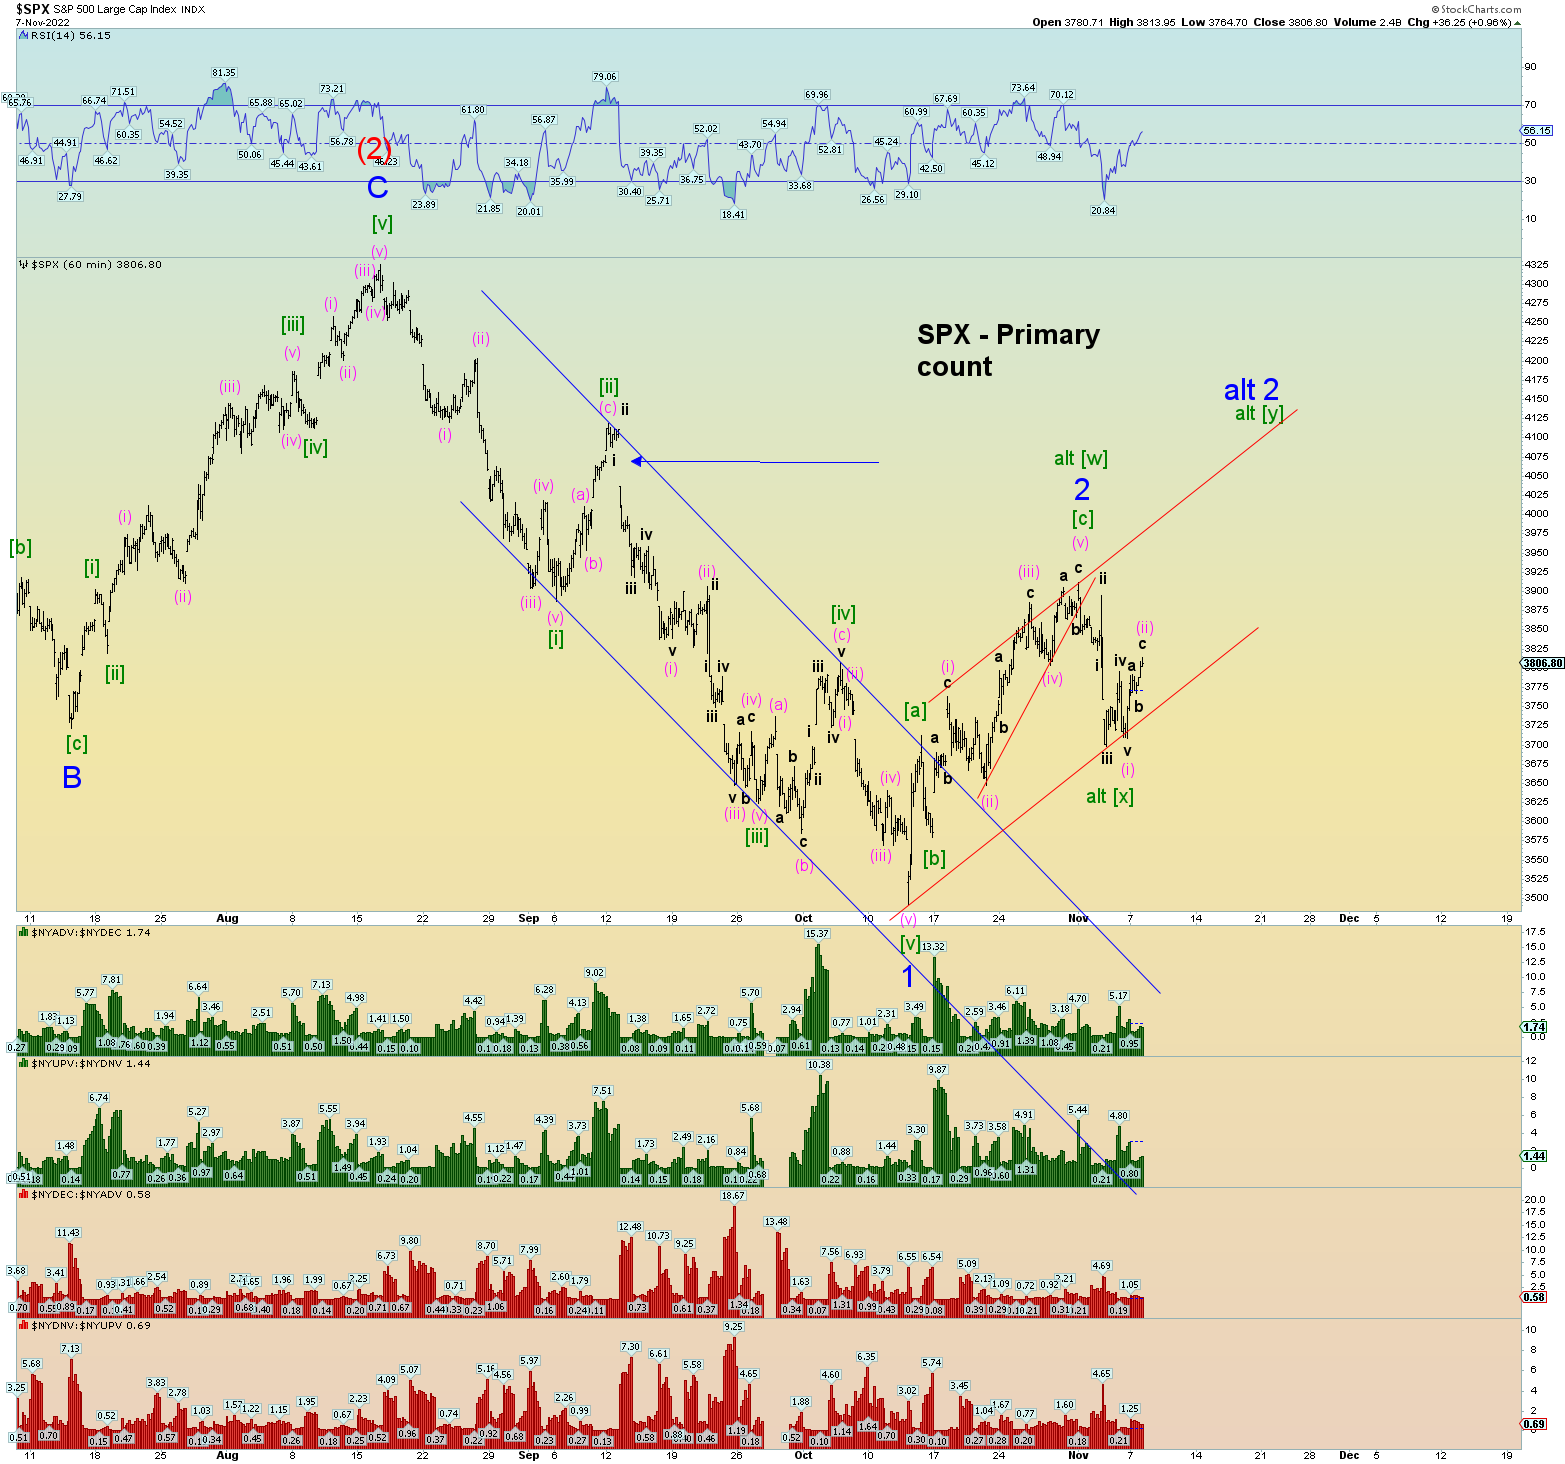
The ultimate long term alternate count is that Intermediate (1) finished at the low and we are in an aggressive Intermediate (2) that will retrace quite some distance at least a Fibonacci 61.8% of the entire drop and perhaps even more.
At what point does this count come into play? The hourly squiggle chart (The first SPX chart in this post as shown above) is what we should be looking at. No need to get ahead of things. First things first. Allow the market to stretch its legs all the way to 4100 if need be before we talk about other counts.
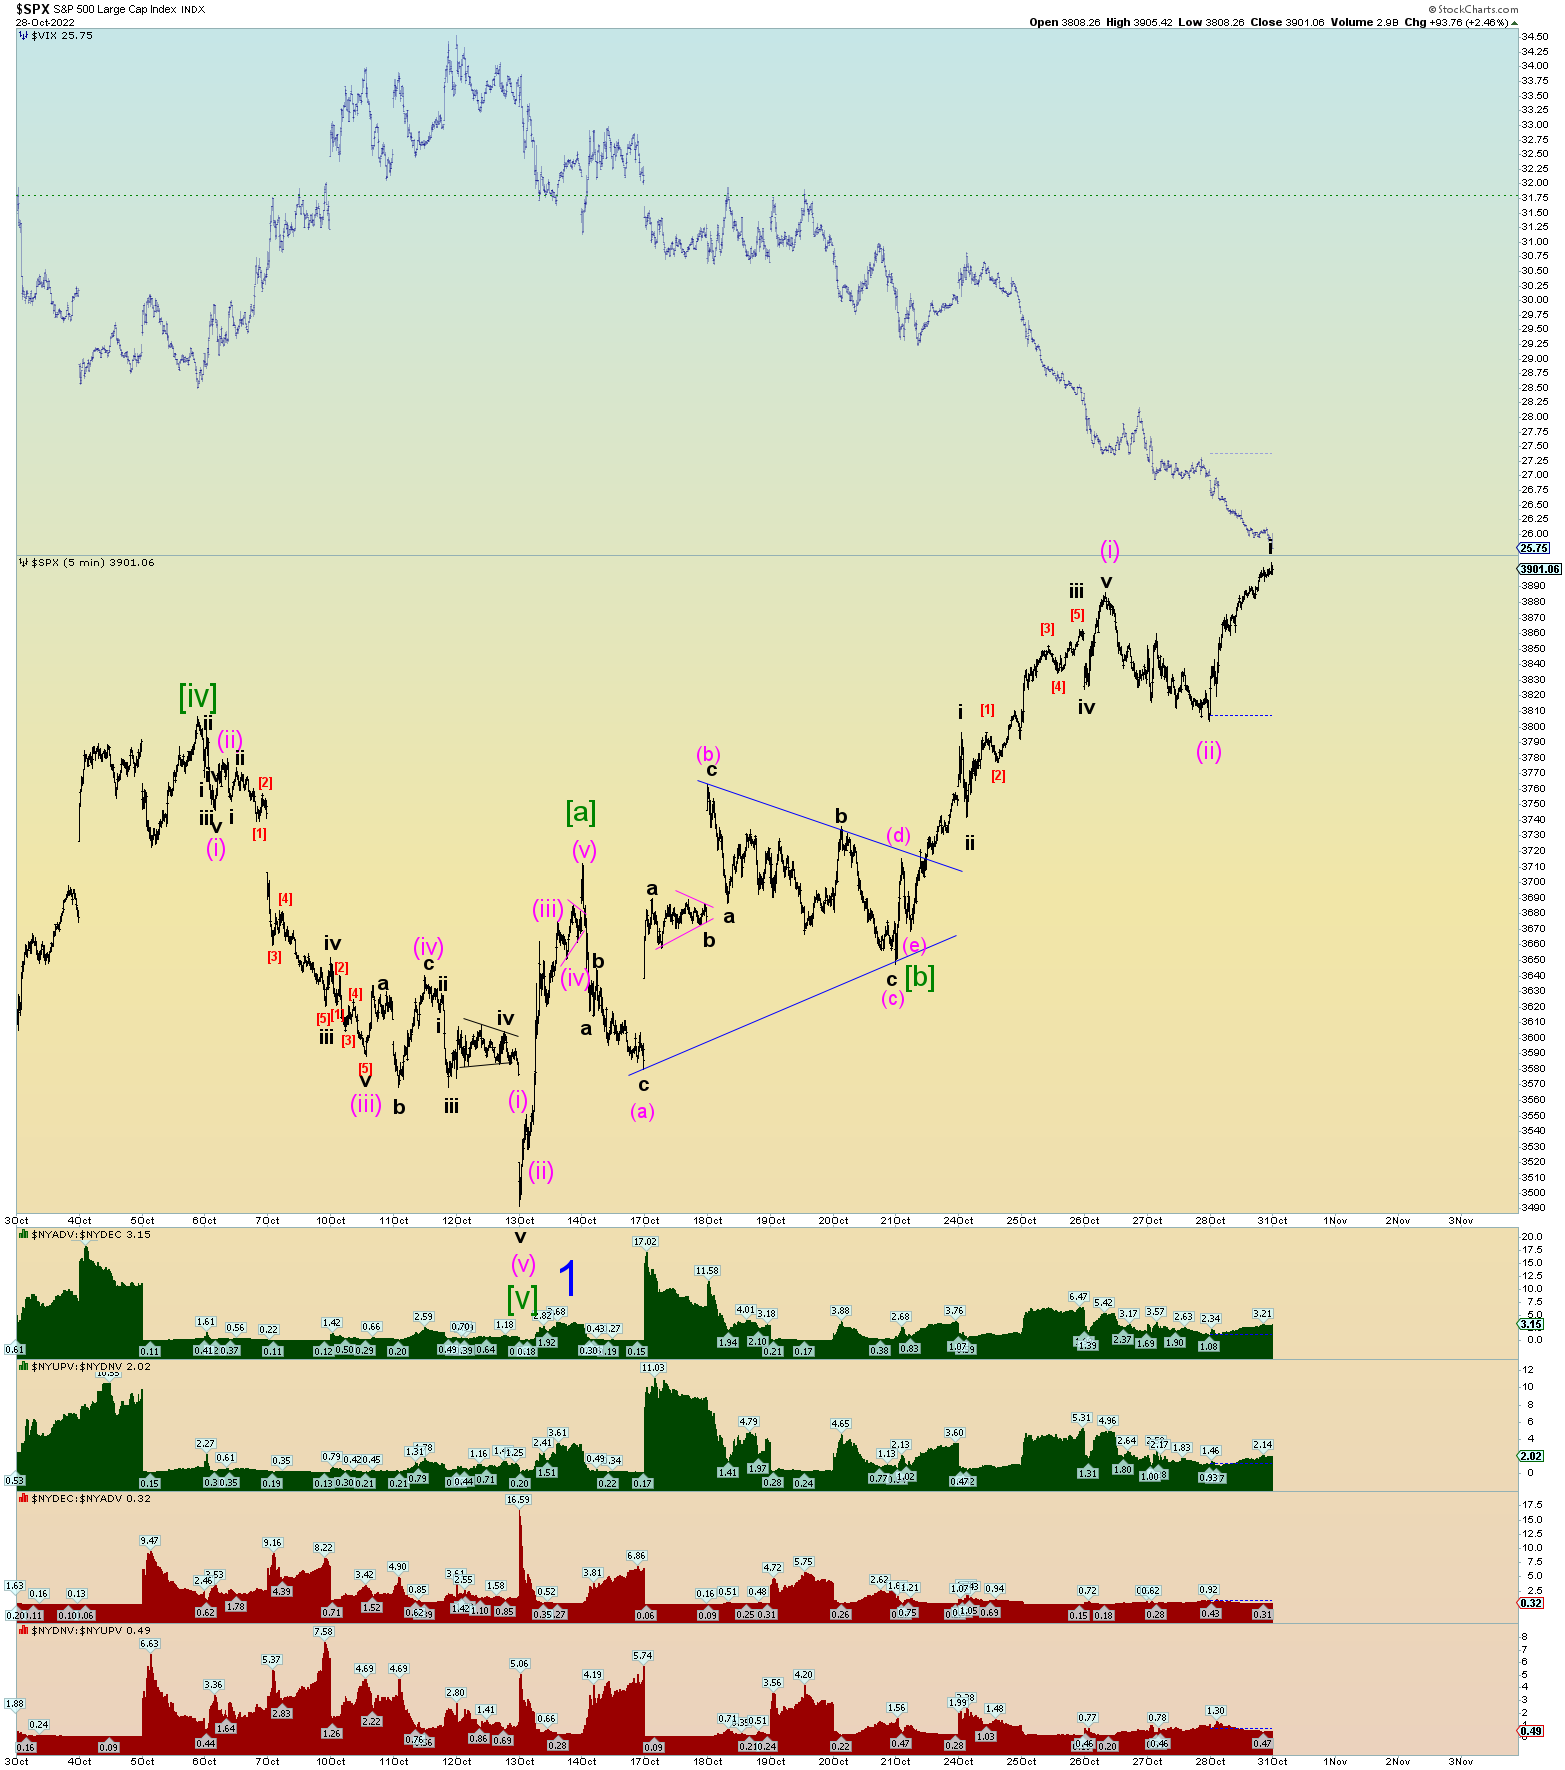
Potential squiggle count if Minor 2 has topped. This sets up for a market down-type opening tomorrow and we’ll see how after hours goes. Futures are closed as I write this and have recovered about halfway and stand at ES 3791. So, whatever. We’ll see how they choose to push the overnight tape.
The DJIA is masking just how bad the market rot underneath has gotten. Almost “overbought” on the daily RSI, simply amazing.