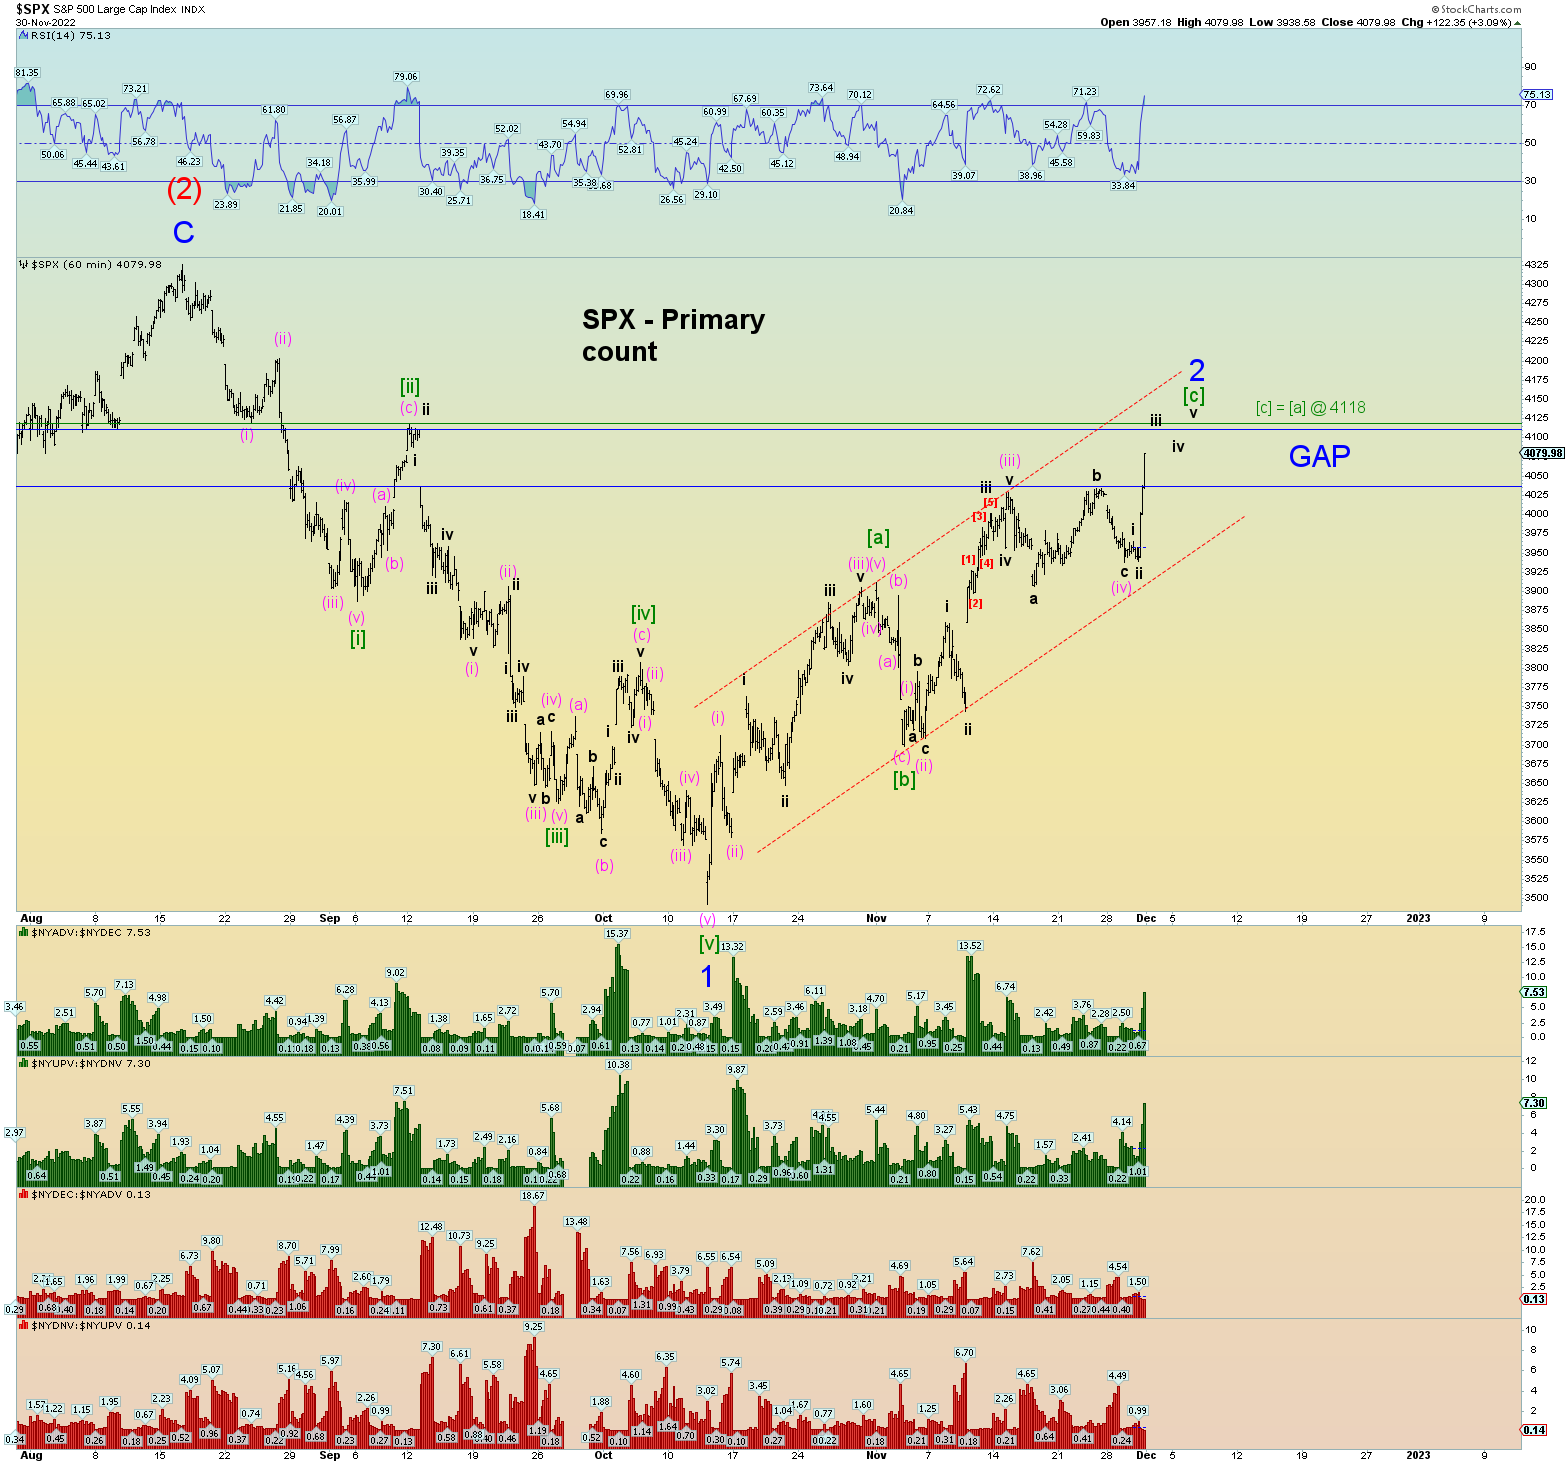
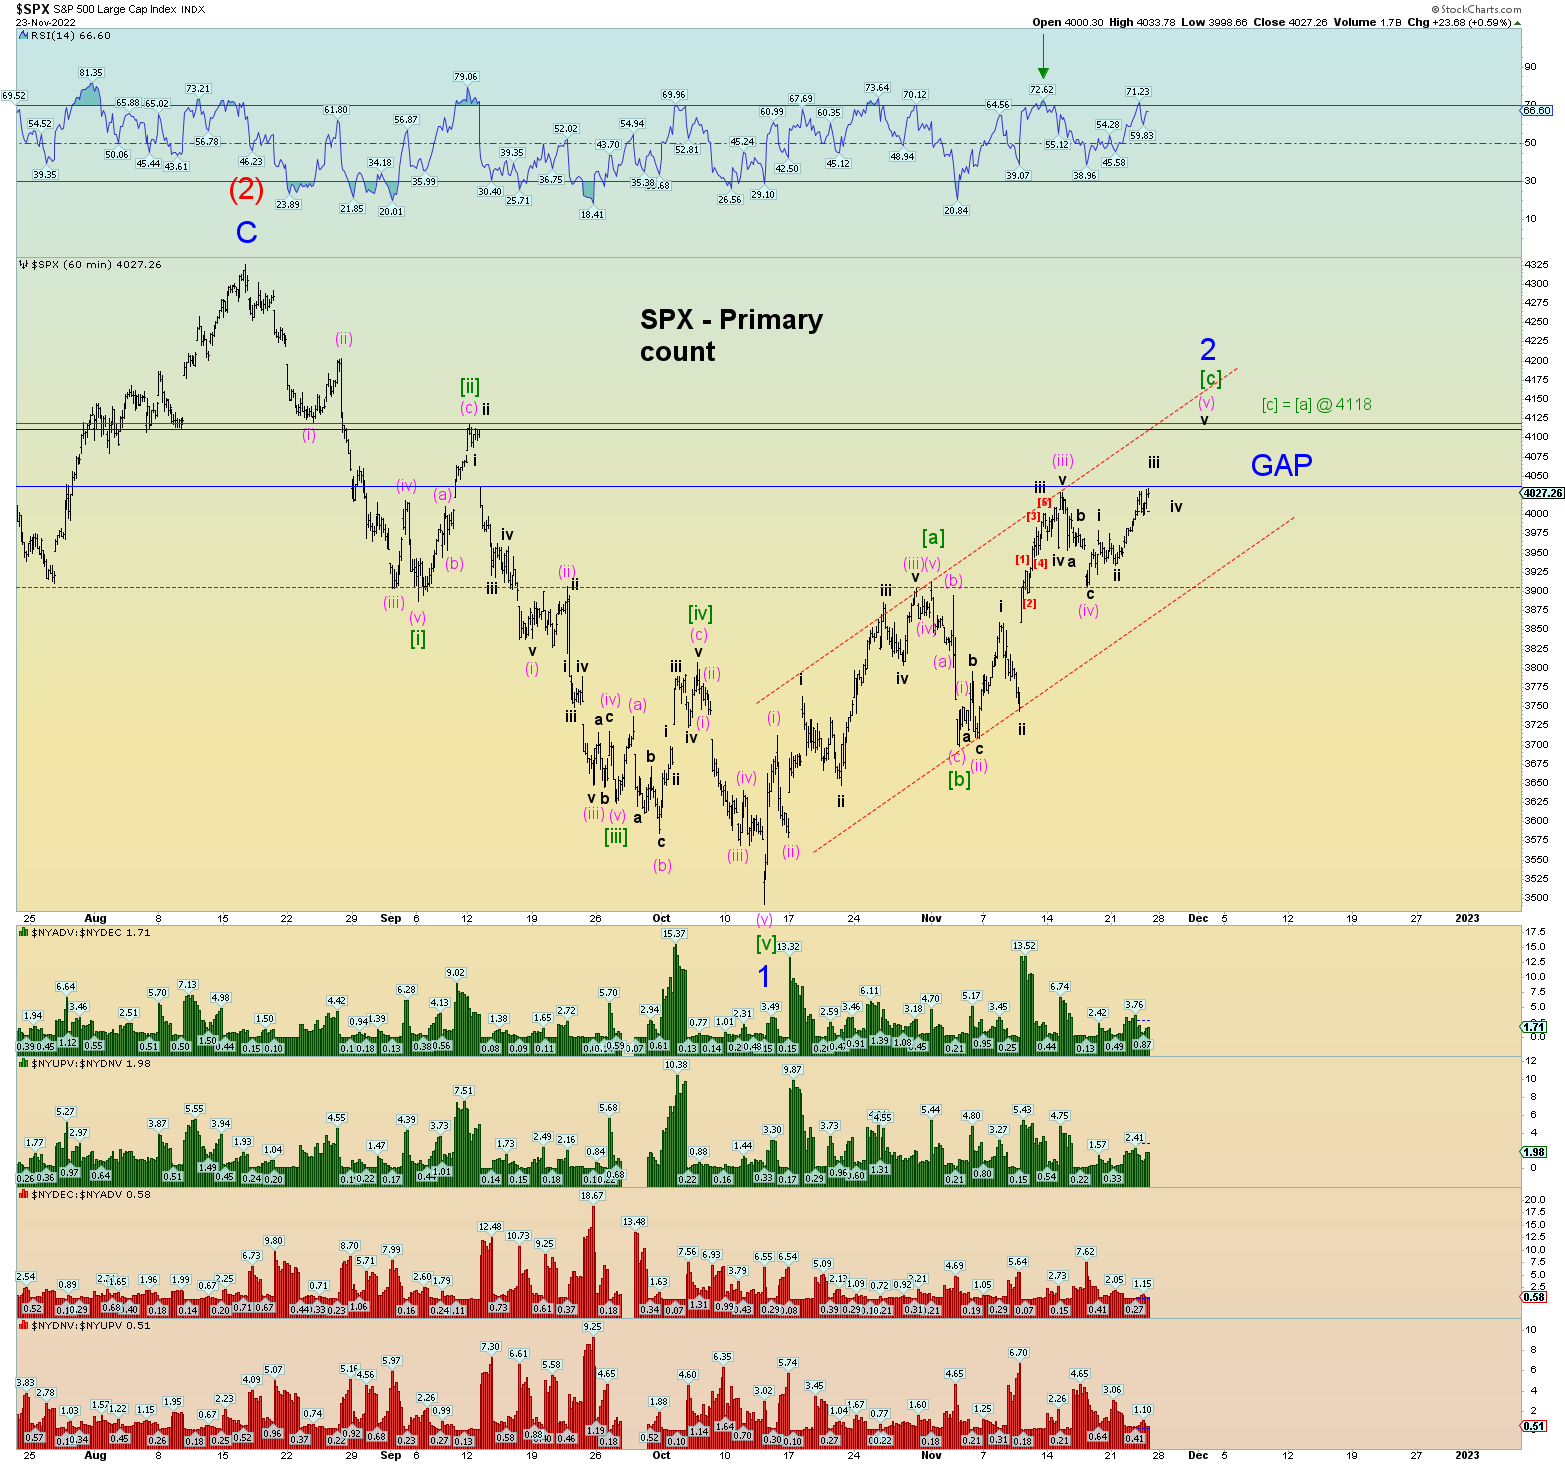
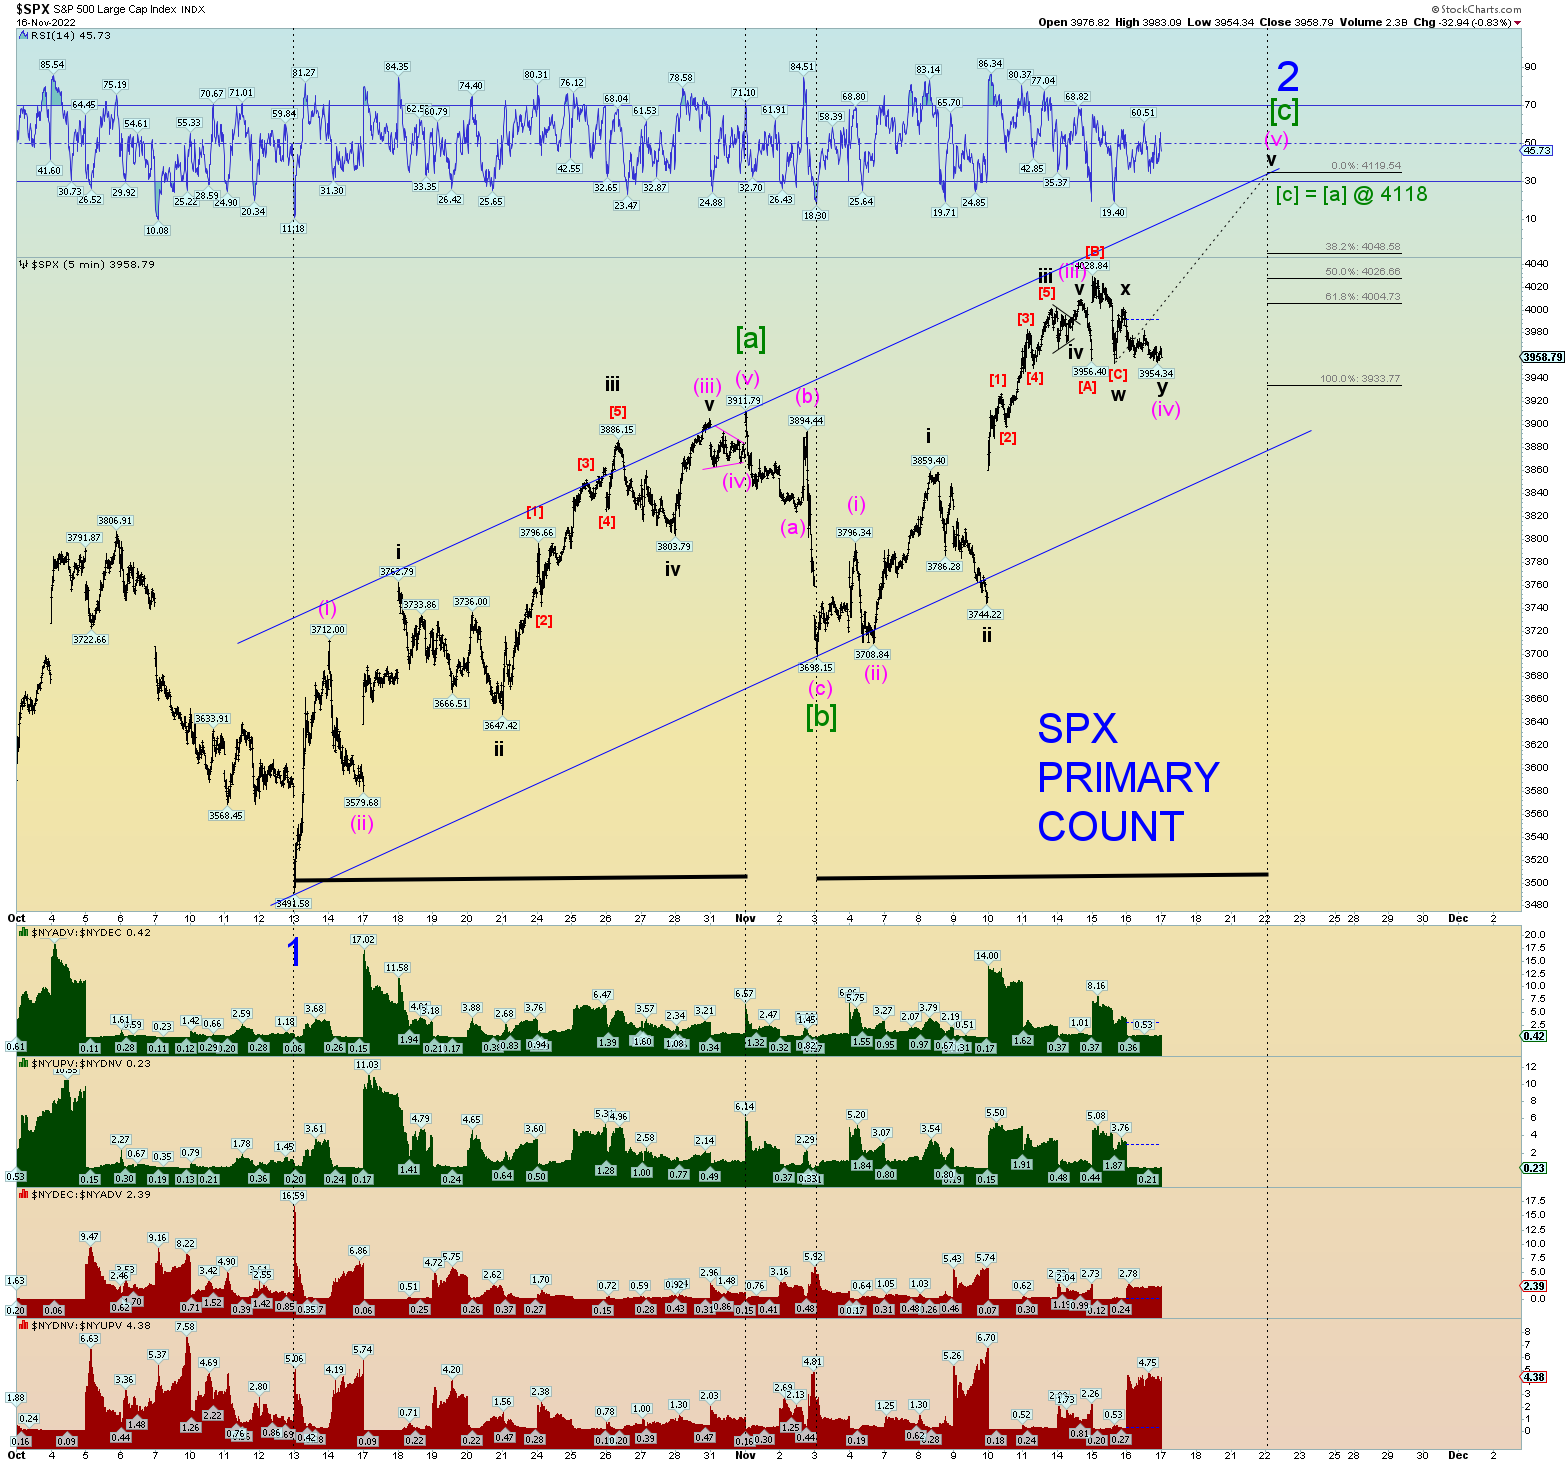
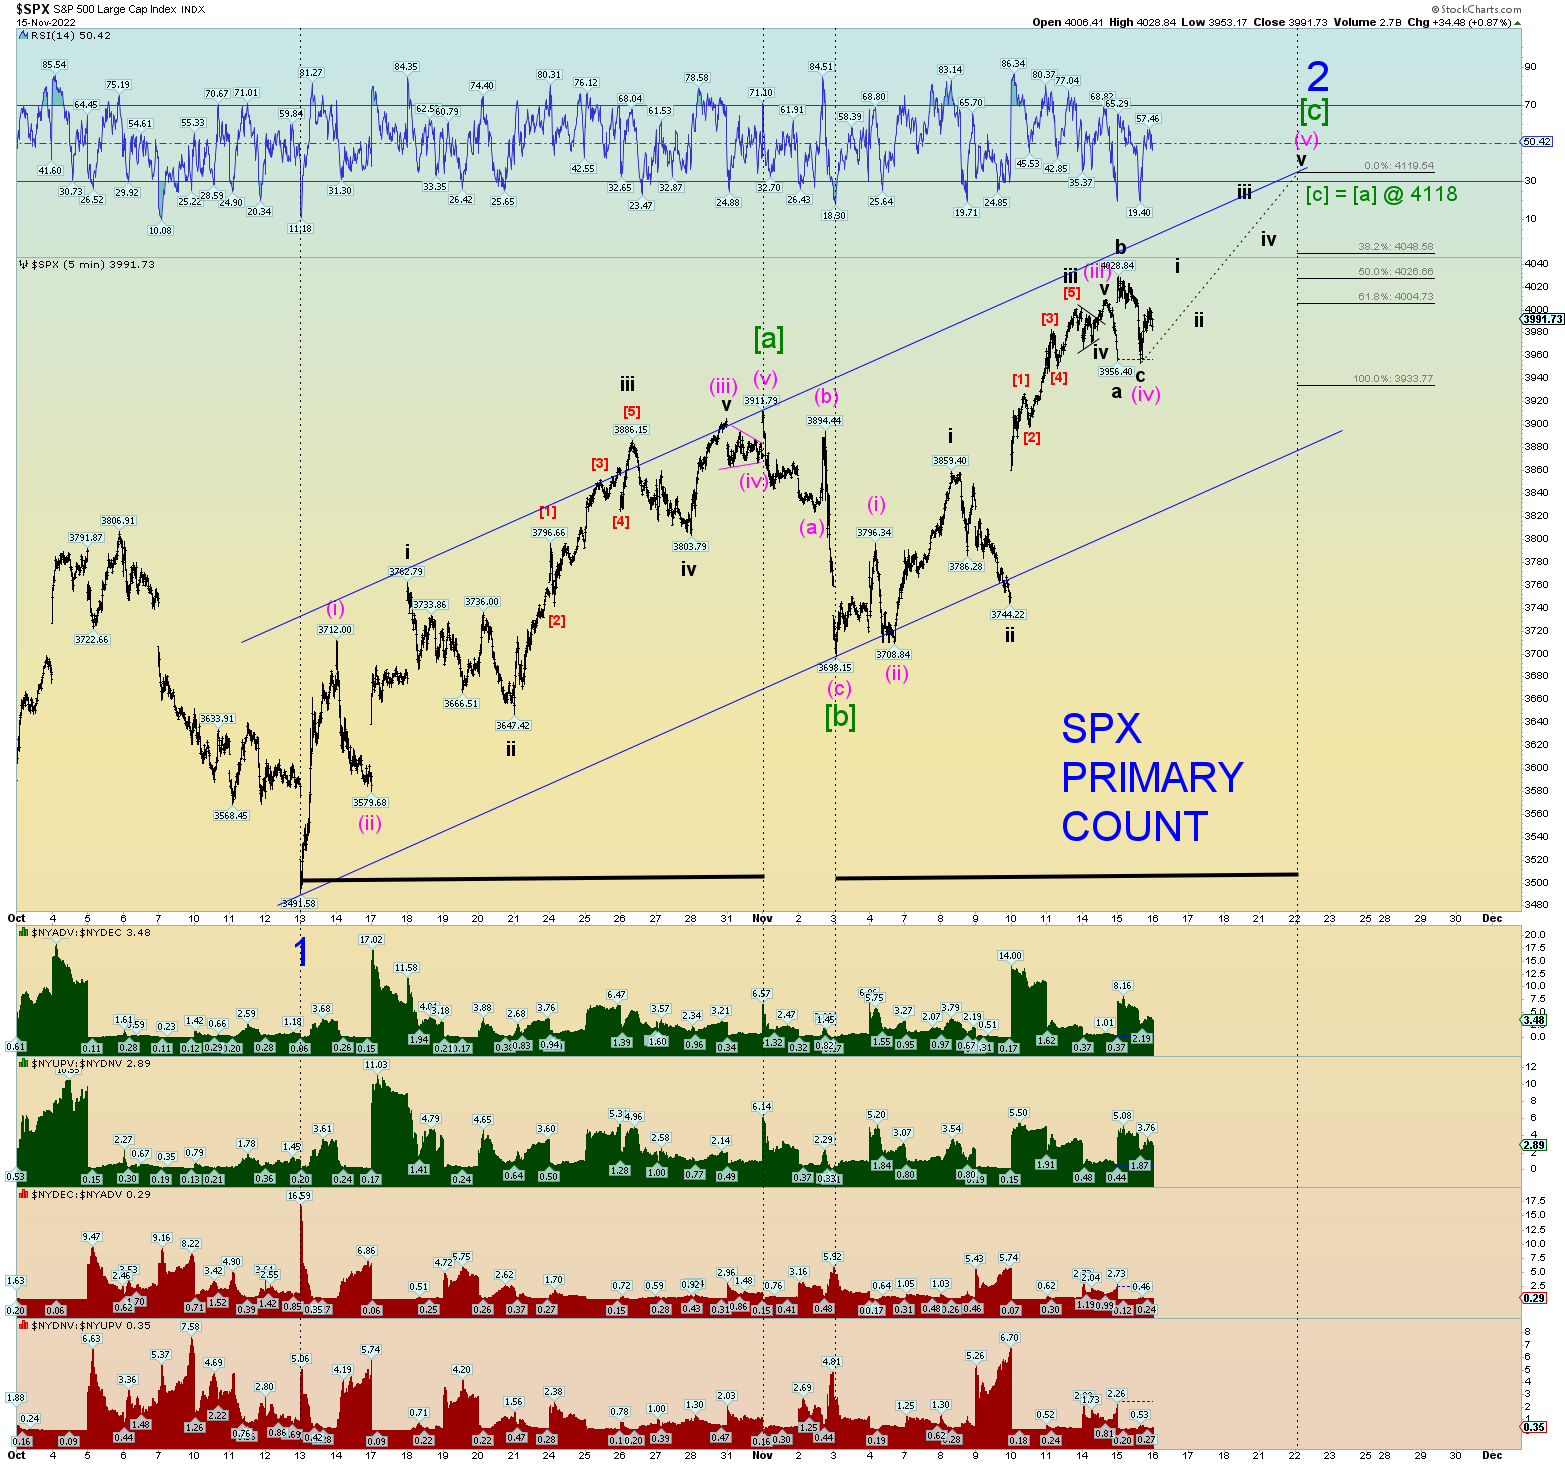
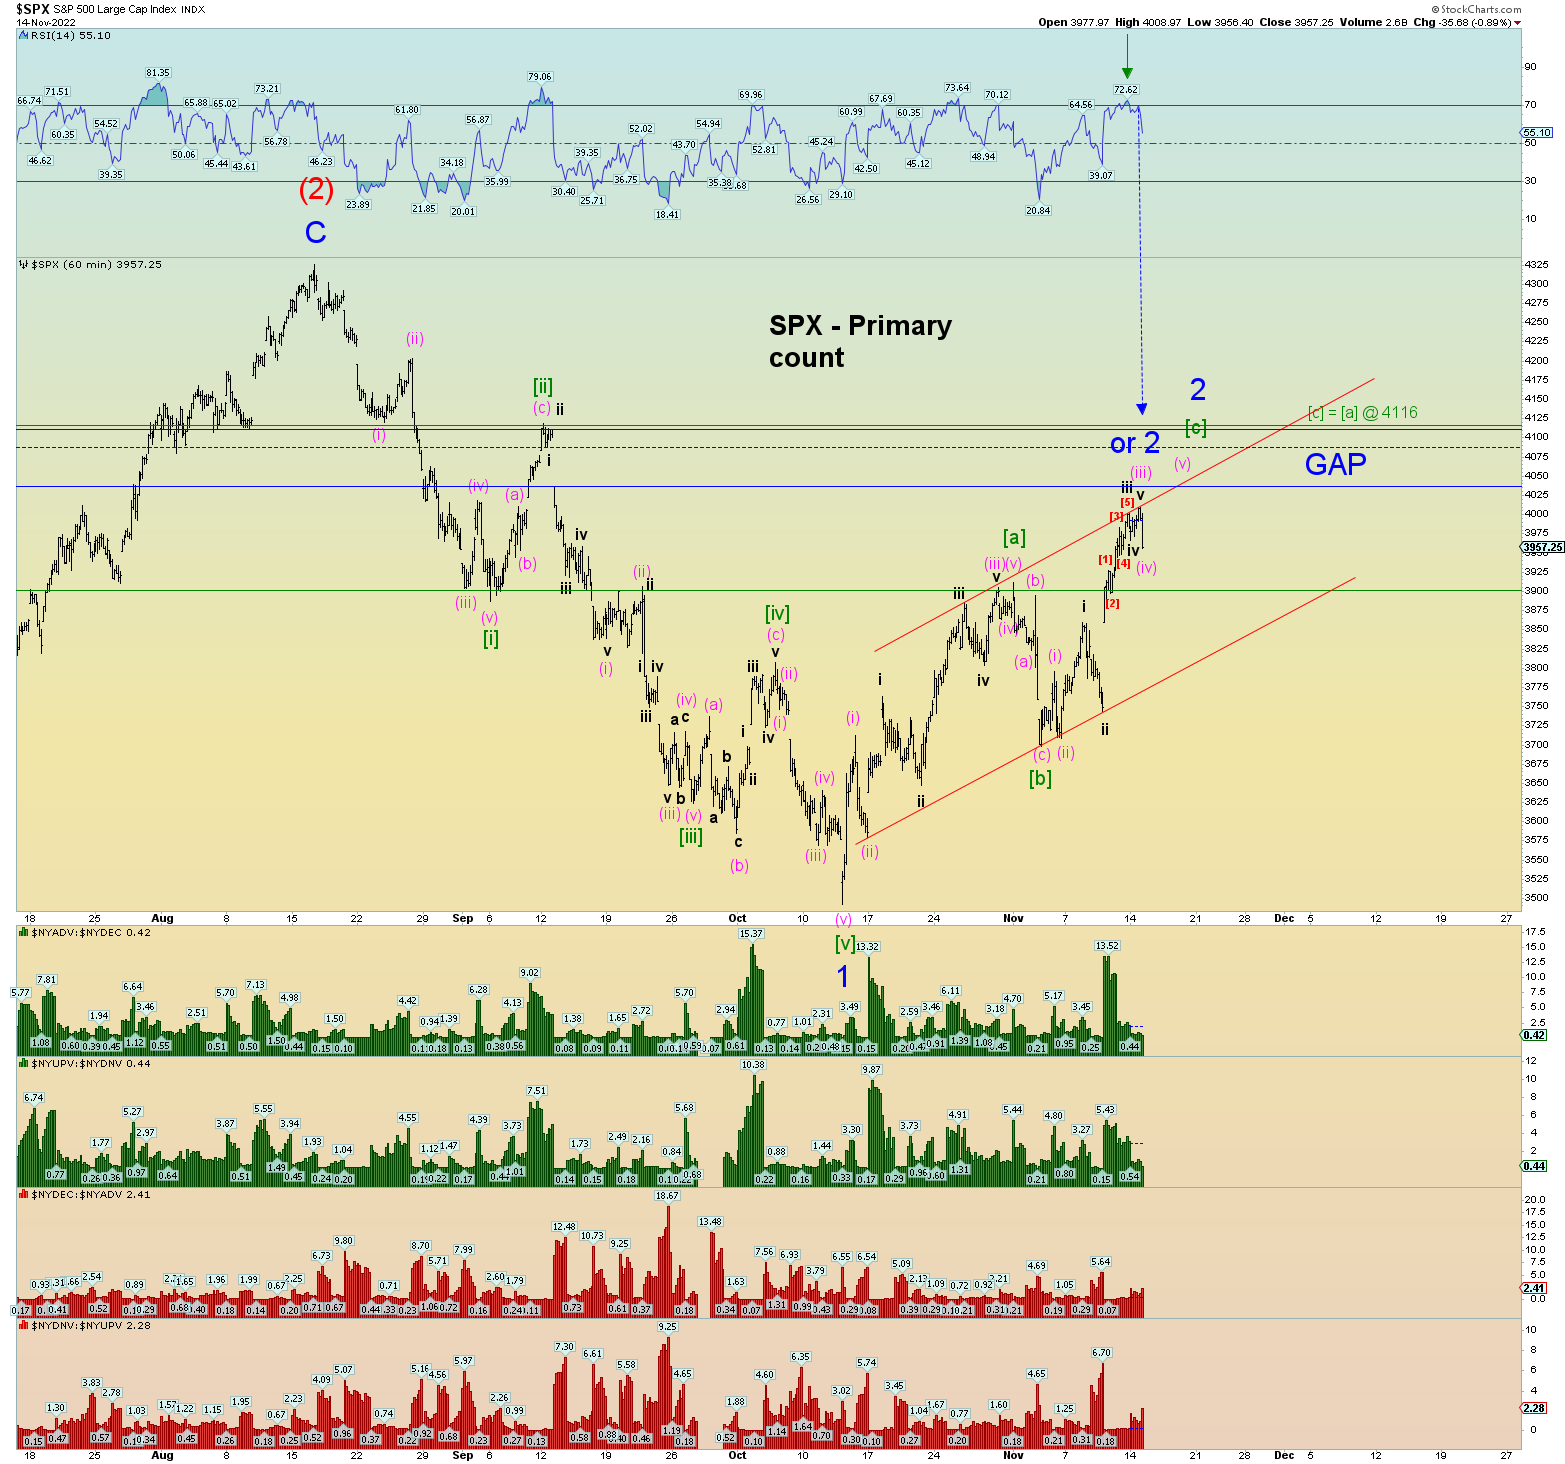
You knew that once prices begin to breach the huge open chart gap down it would accelerate. It’s almost as if the market knew what Powell would say. Anyways, tis better the gap closed. [c] = [a] @ 4118 SPX so let’s see what happens. Solid up day internally on the NYSE.
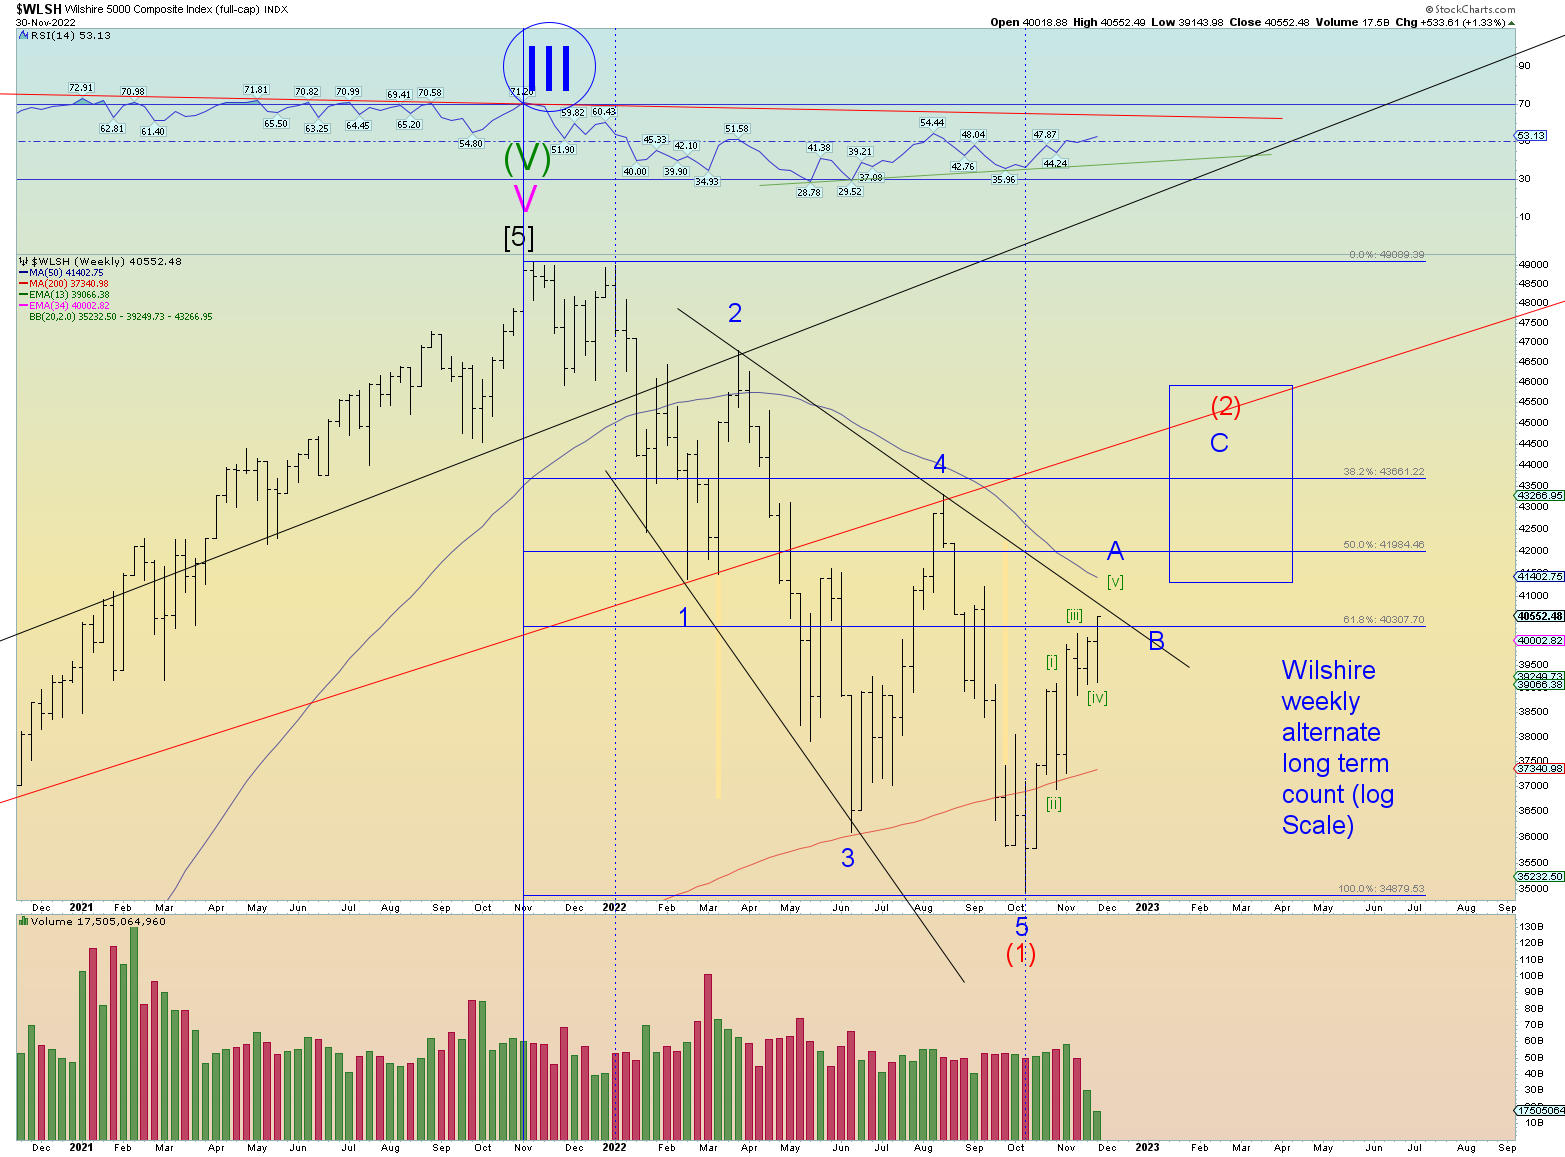
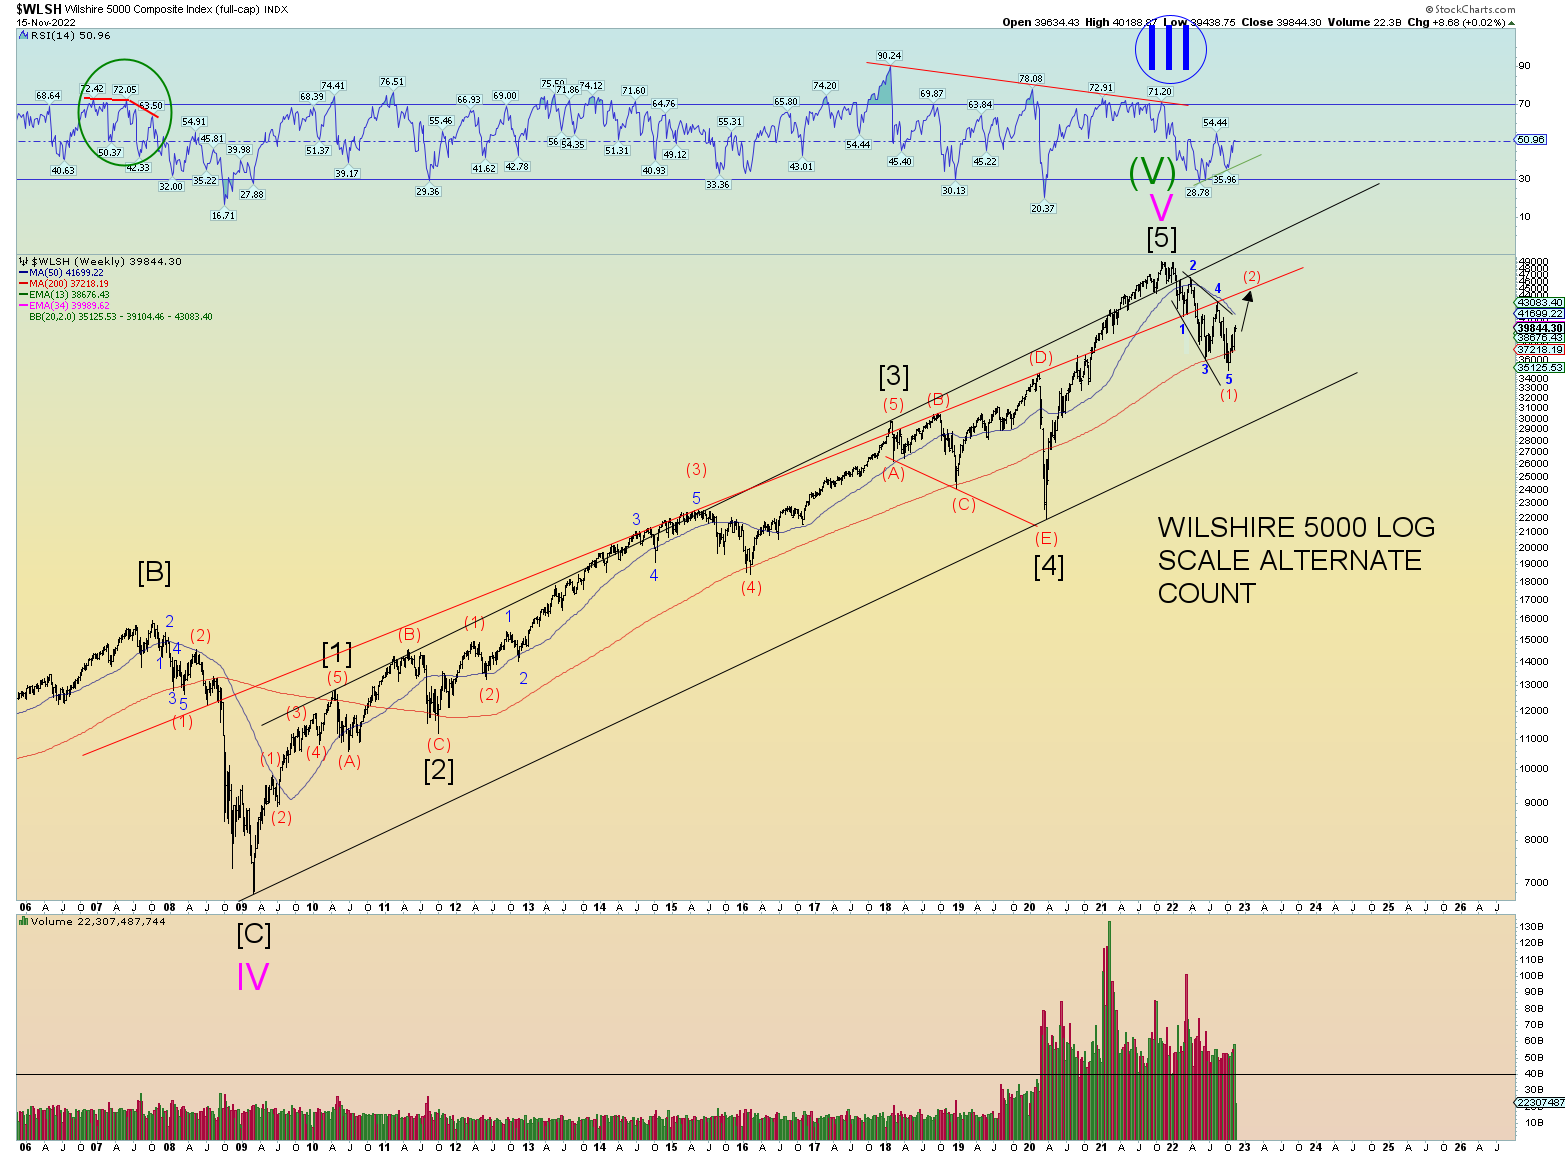
Otherwise, the long-term alternate count could be in play which suggest prices will go much higher and take much longer.
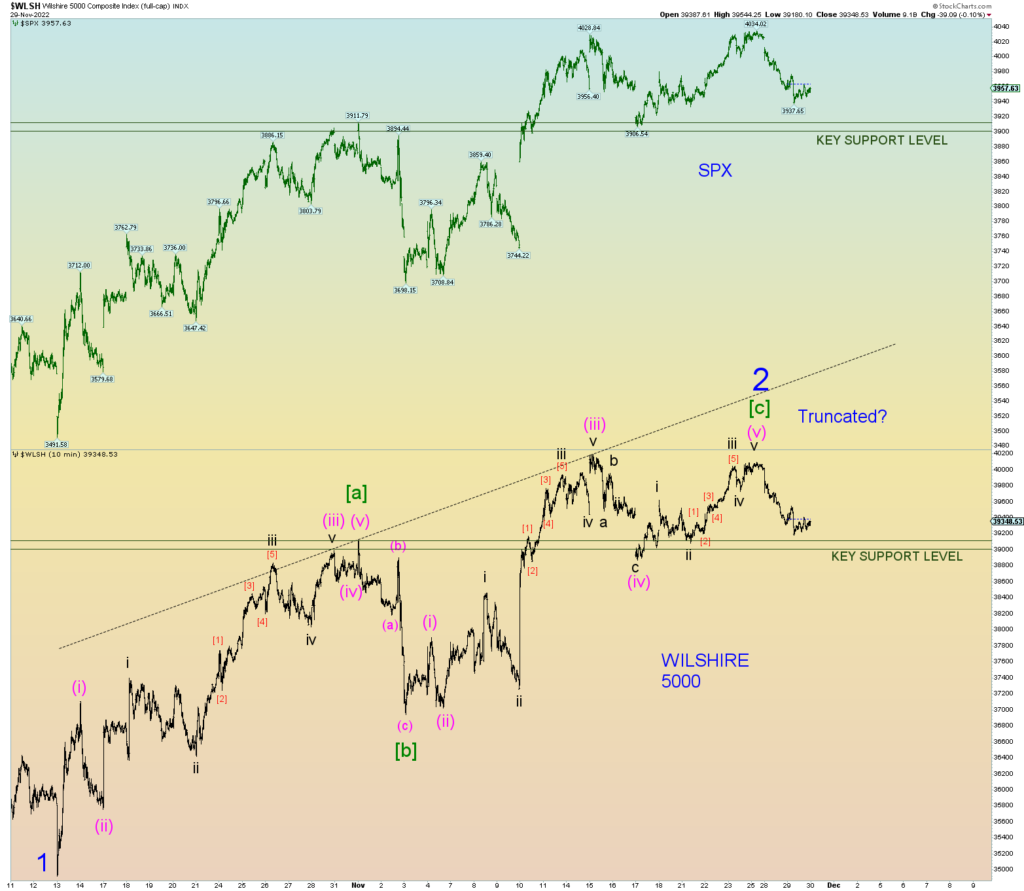
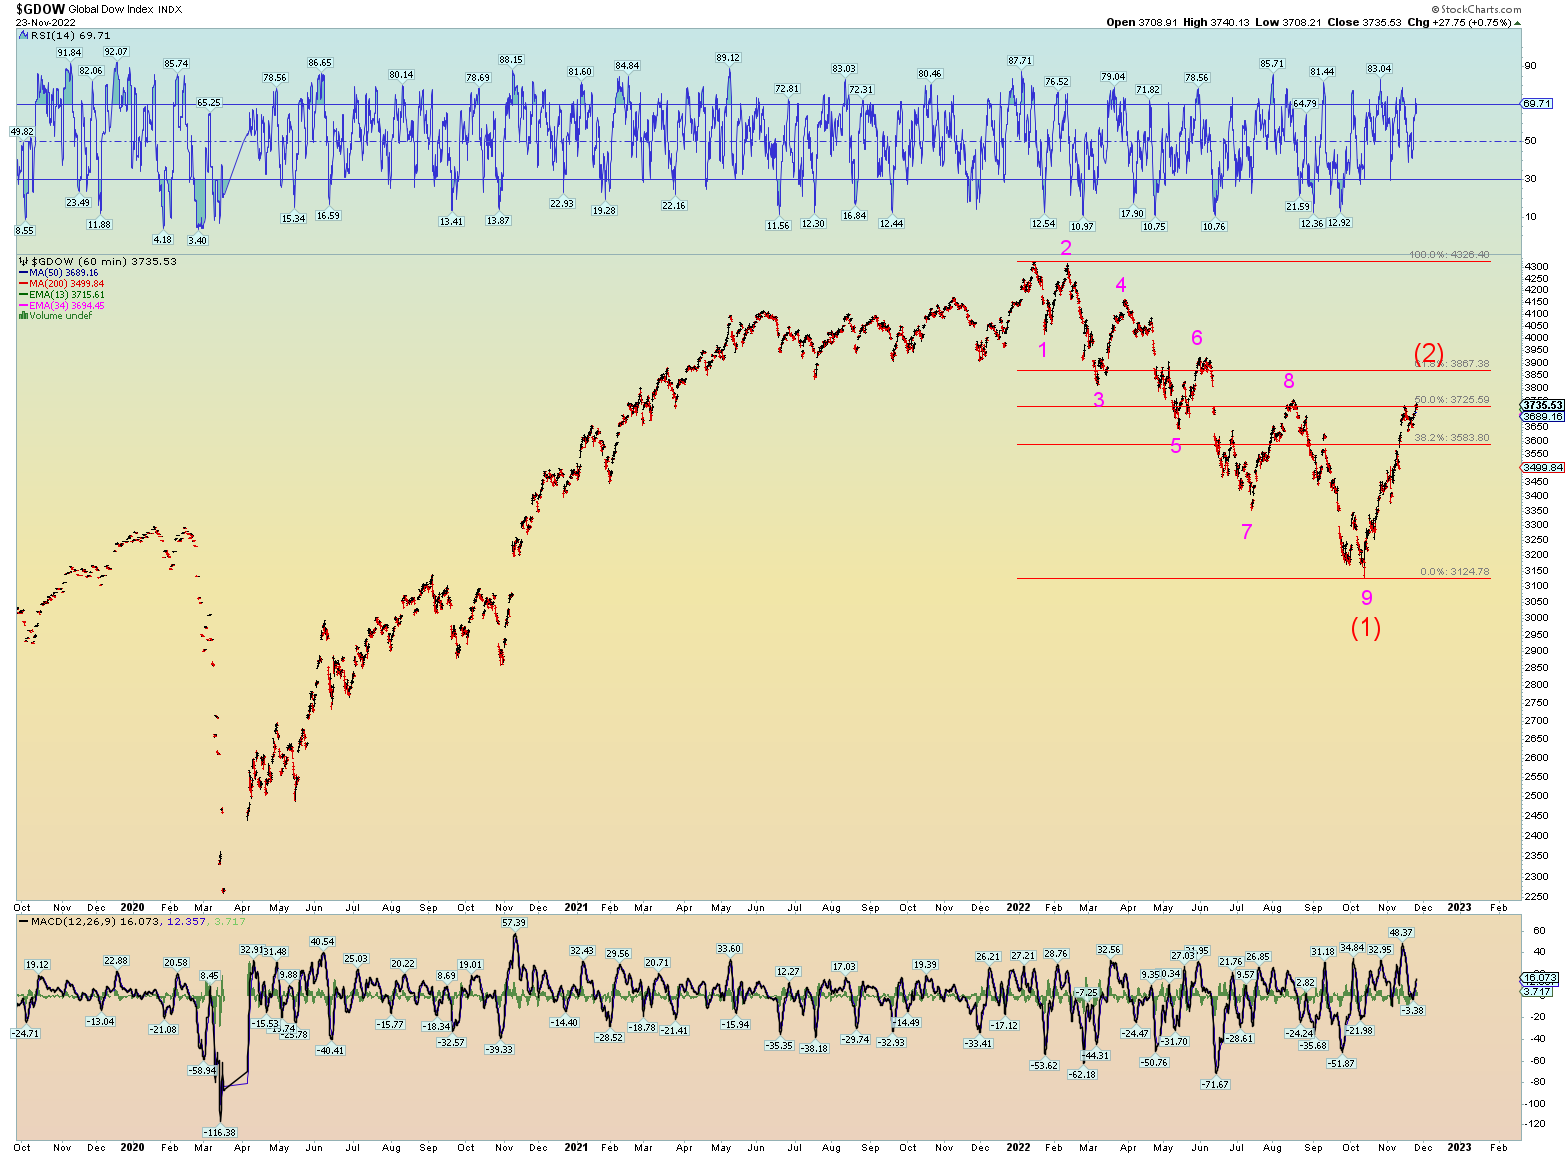
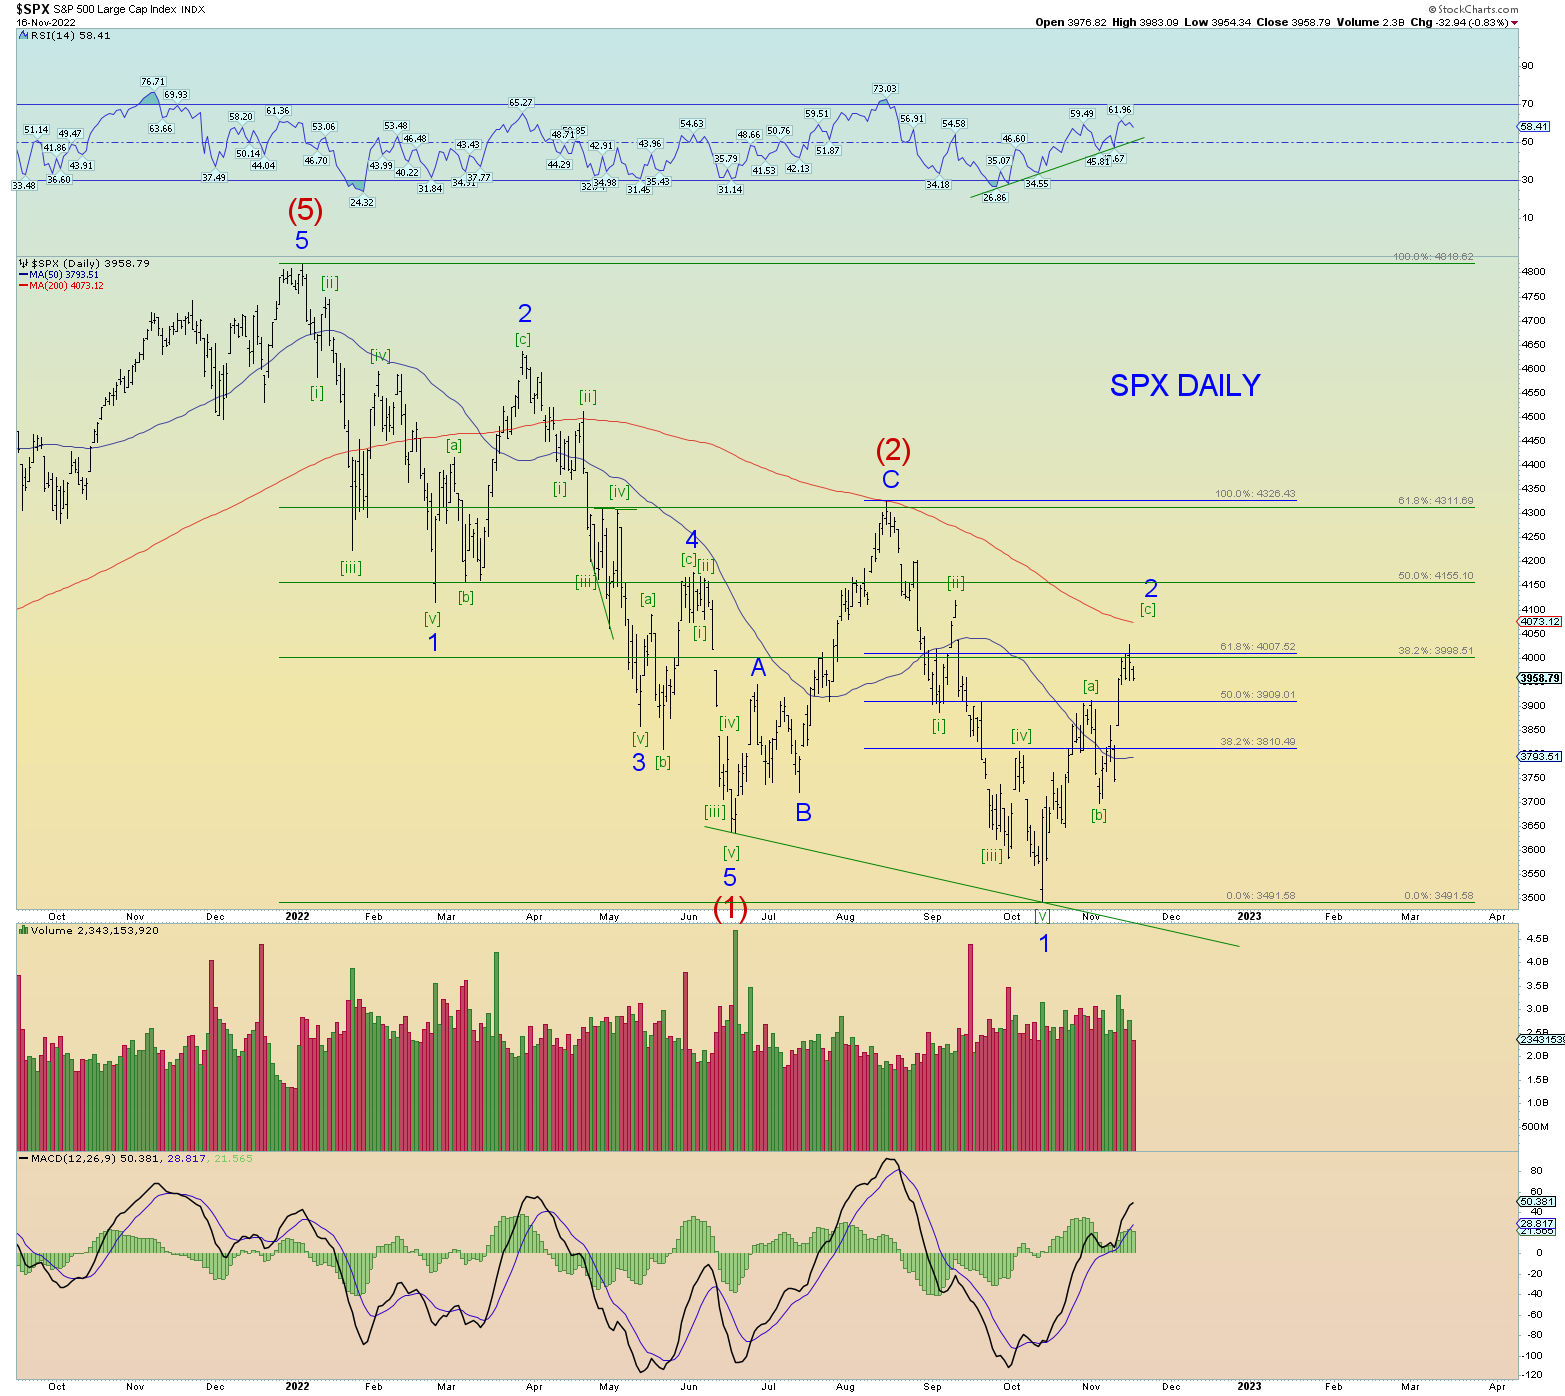
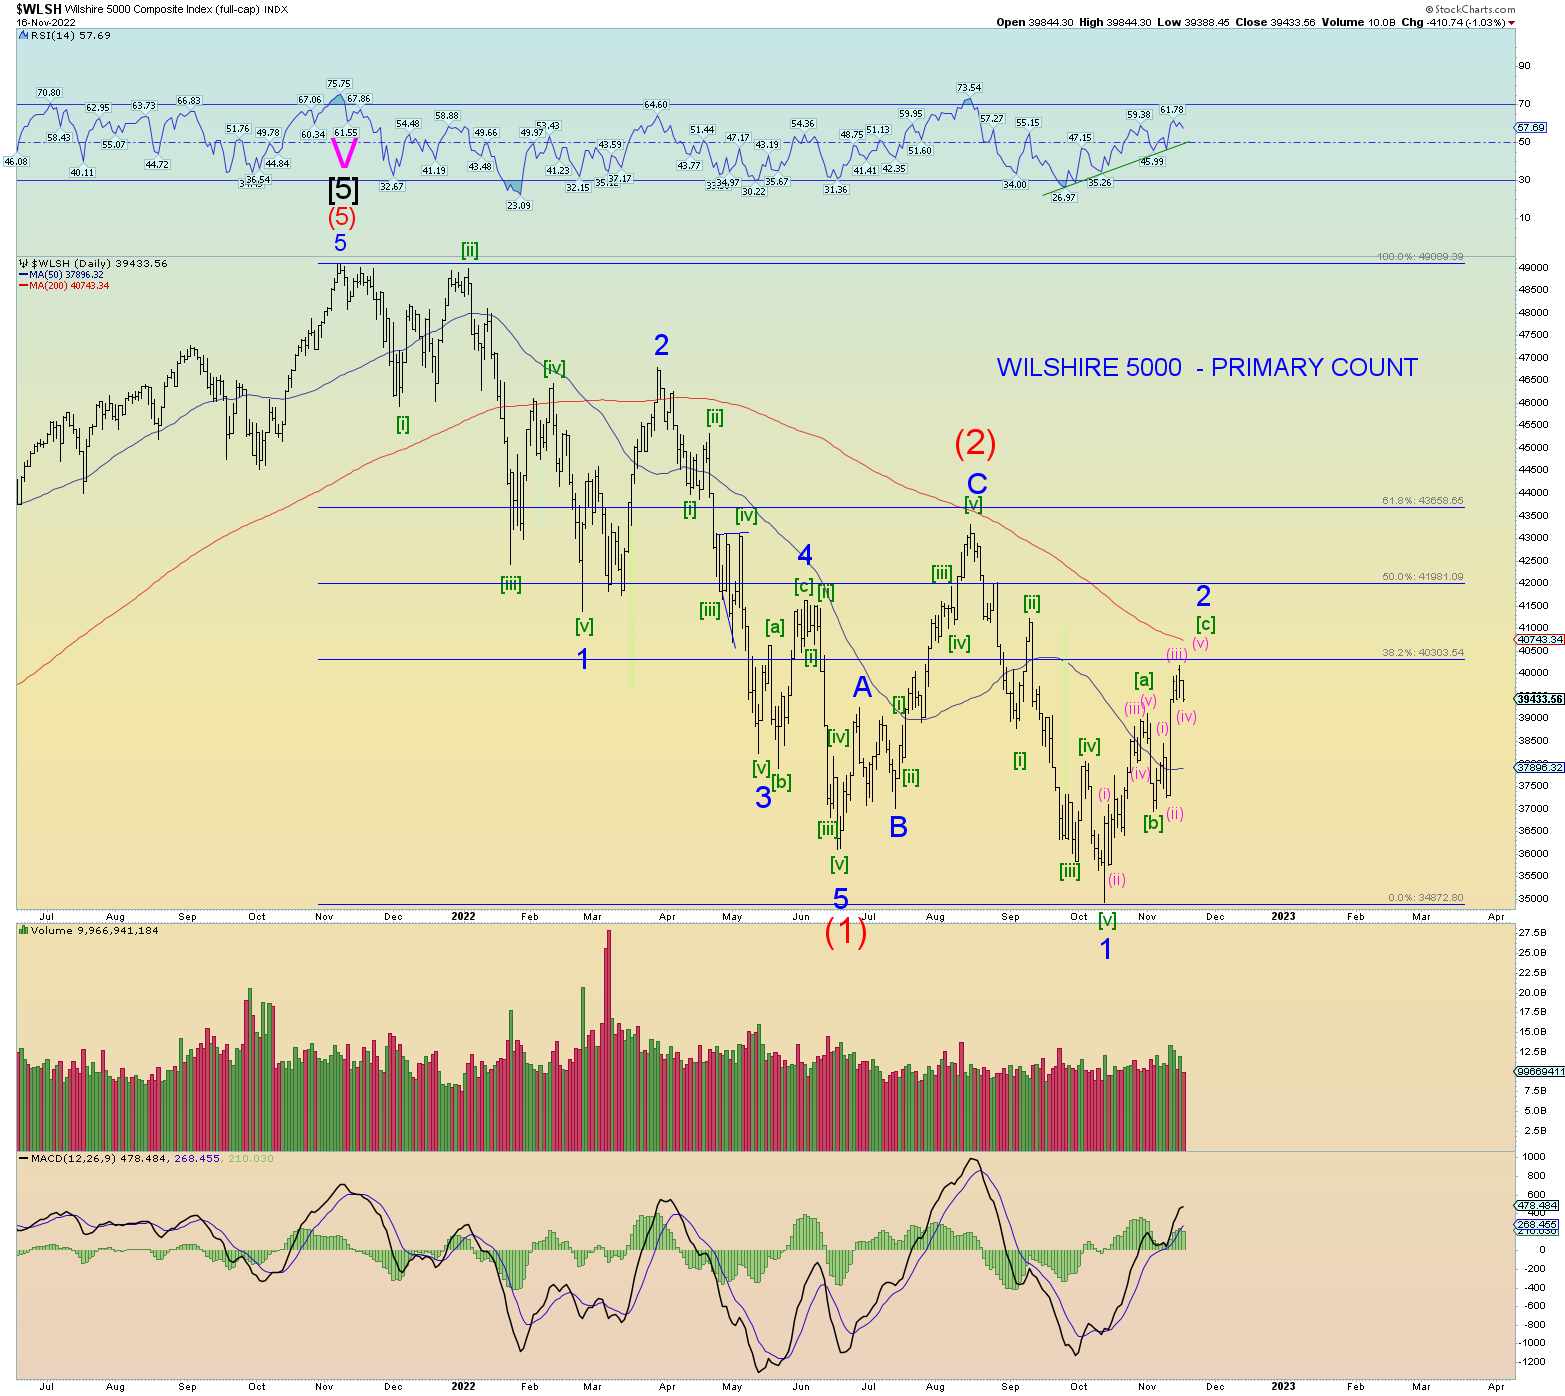
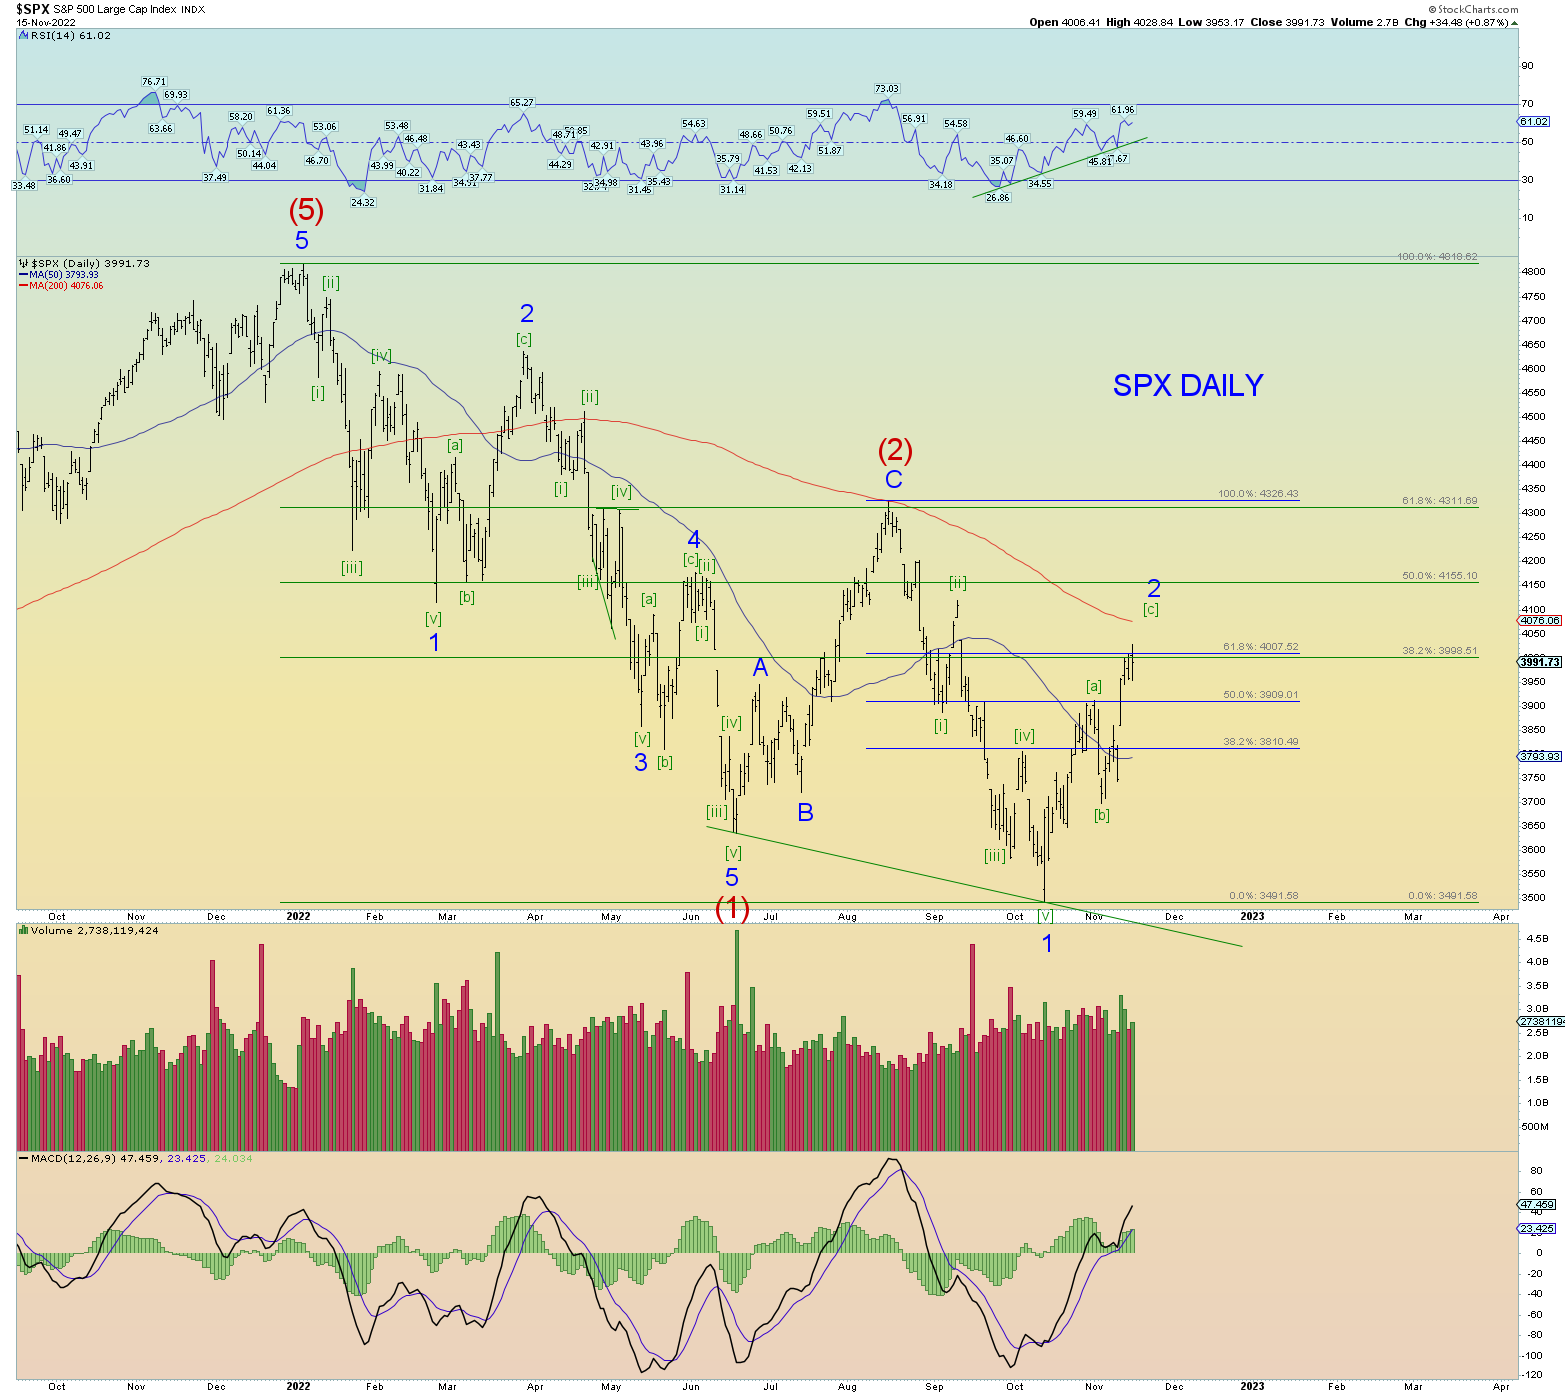
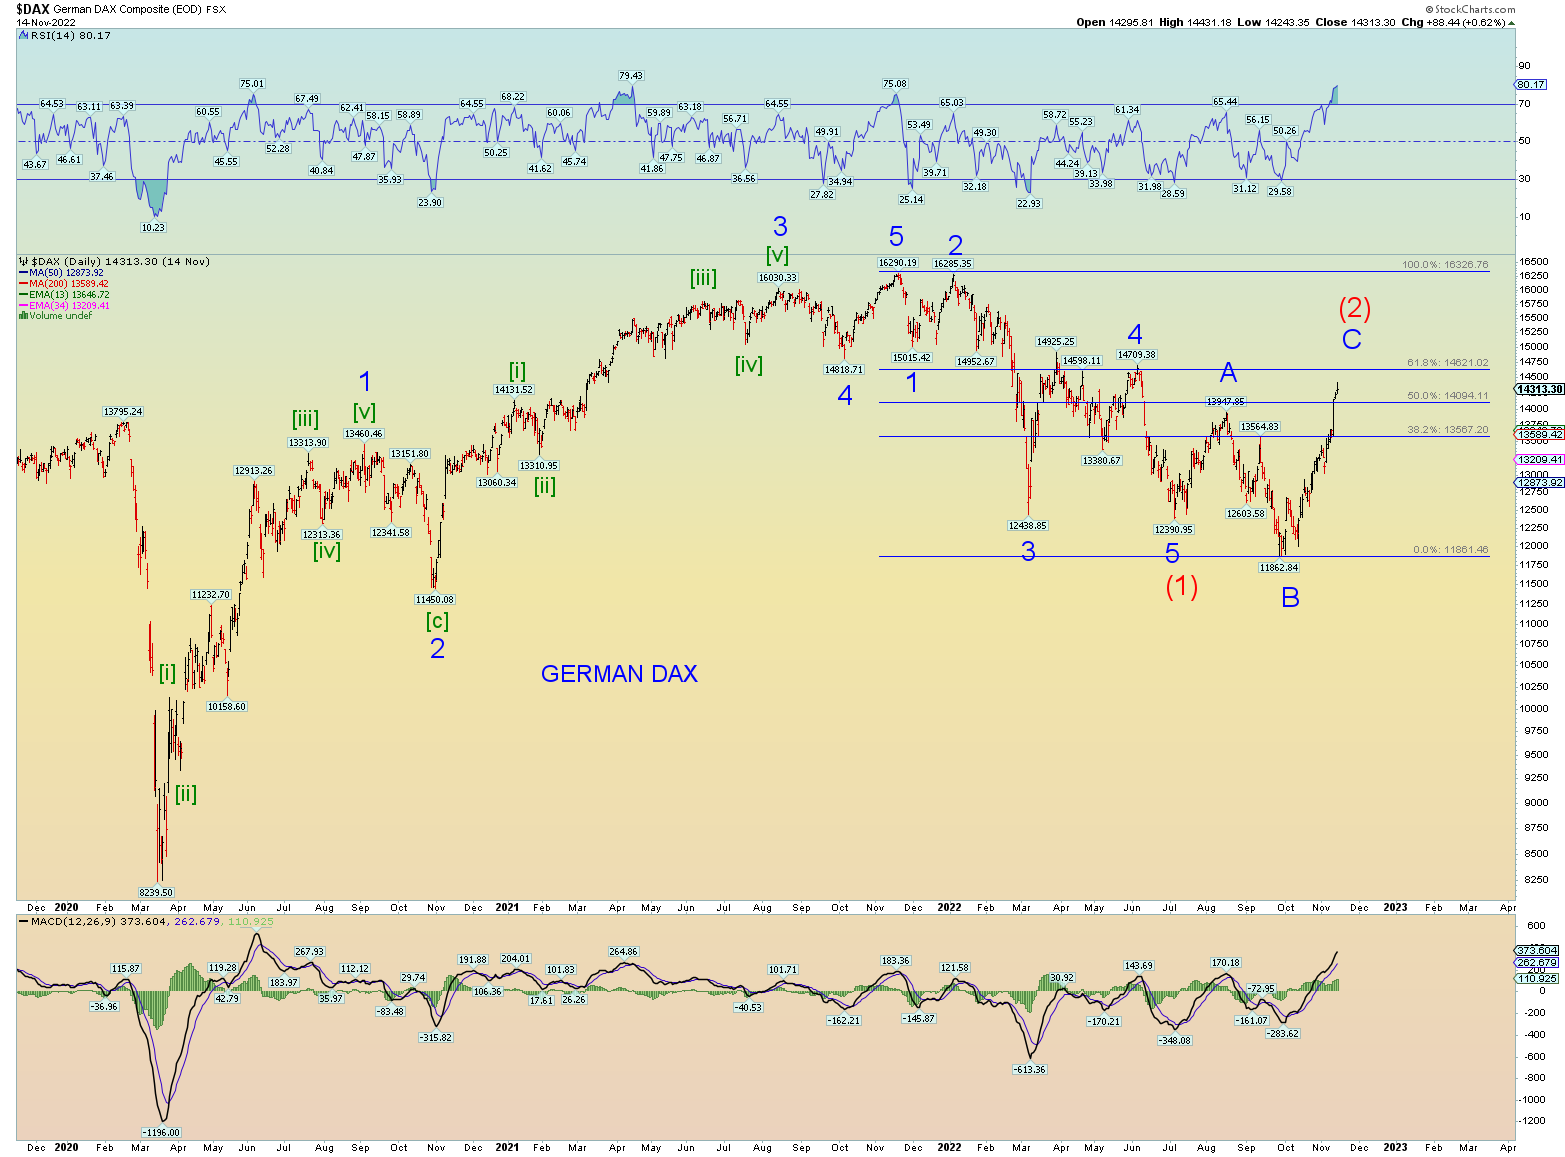
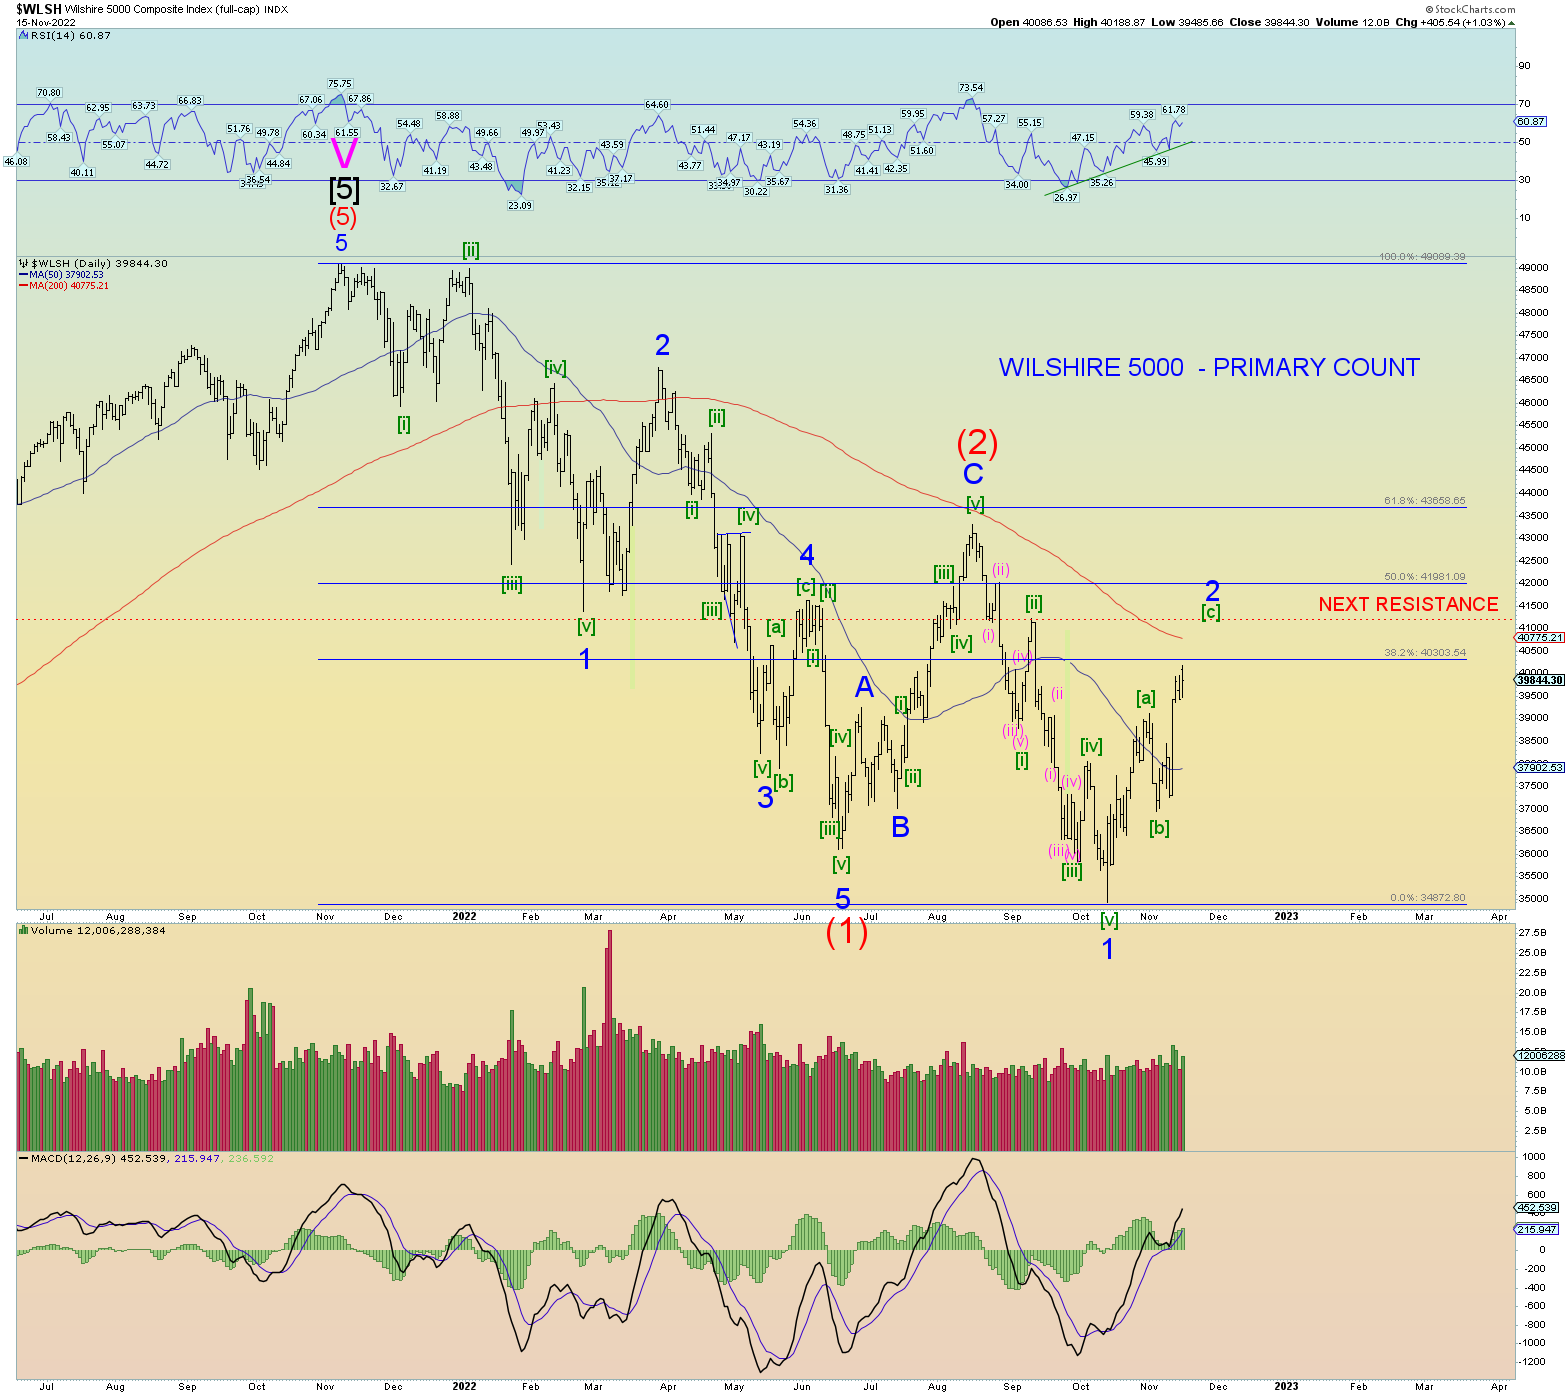
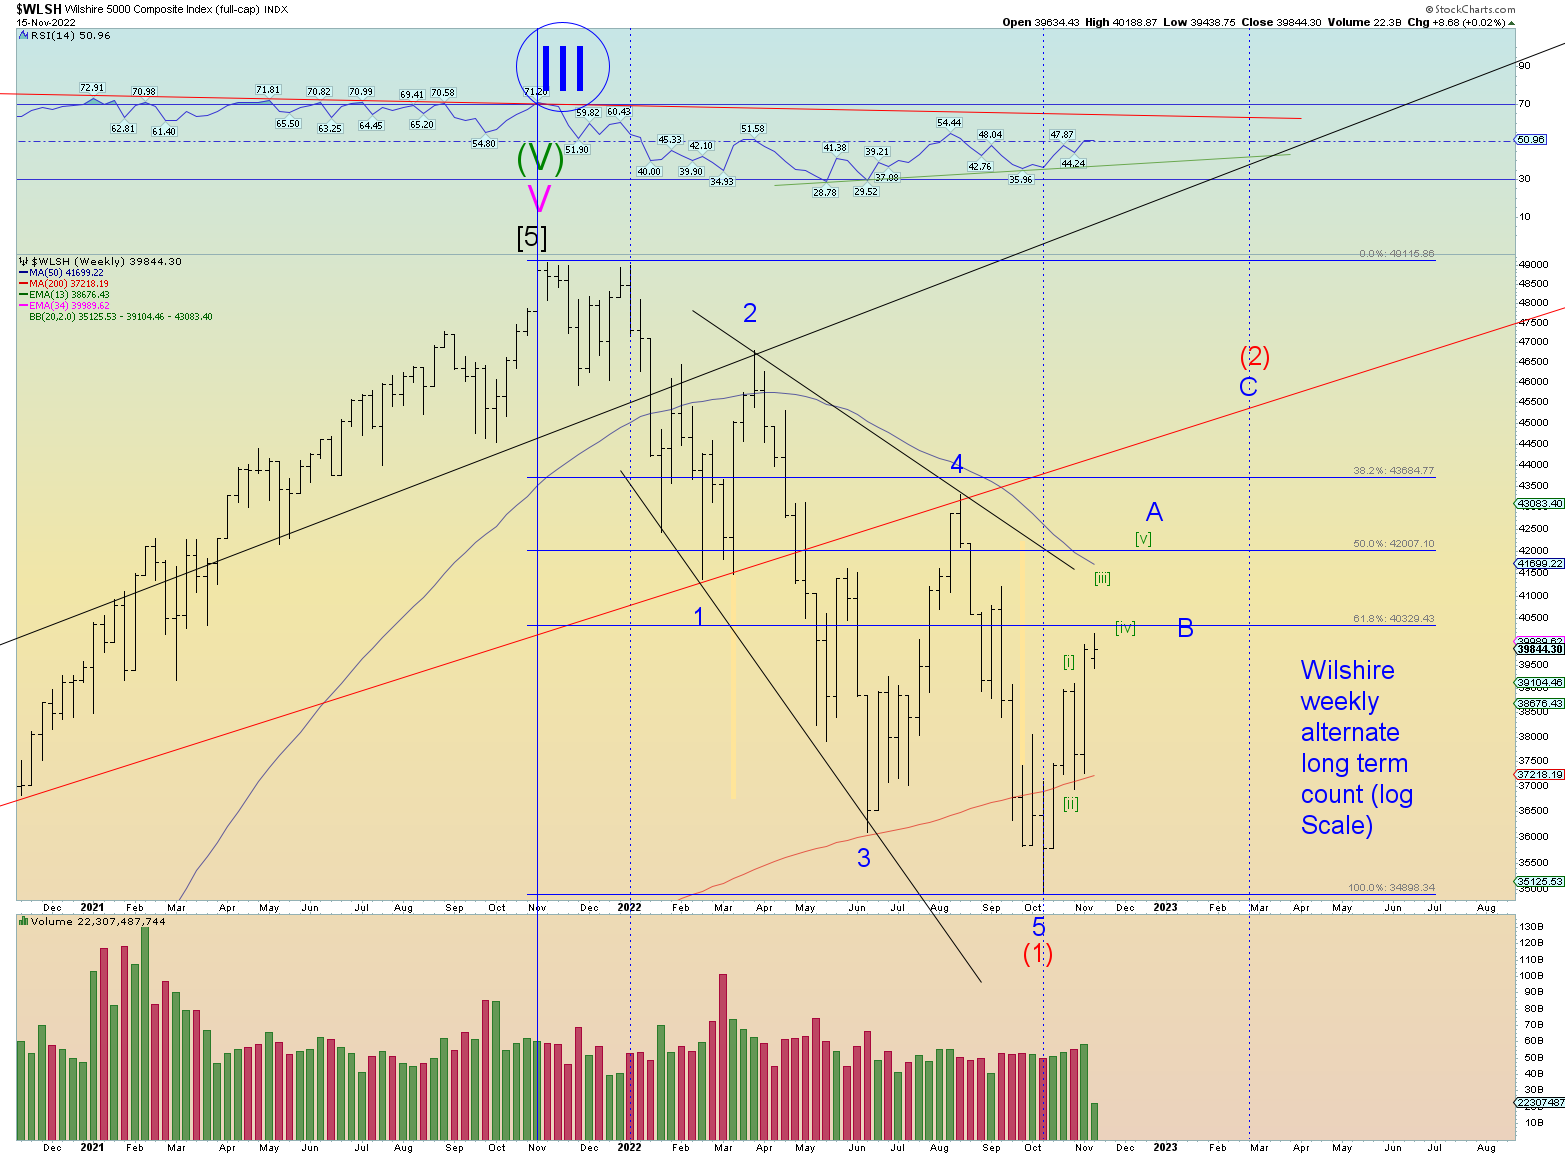
The key support level band is shown. More or less 3900 on the SPX and the corresponding level of 39,000 on the Wilshire 5000. A solid break of this level is very bearish for the market and would confirm that the pattern since the mid October low was indeed an overall 3 wave corrective pattern.
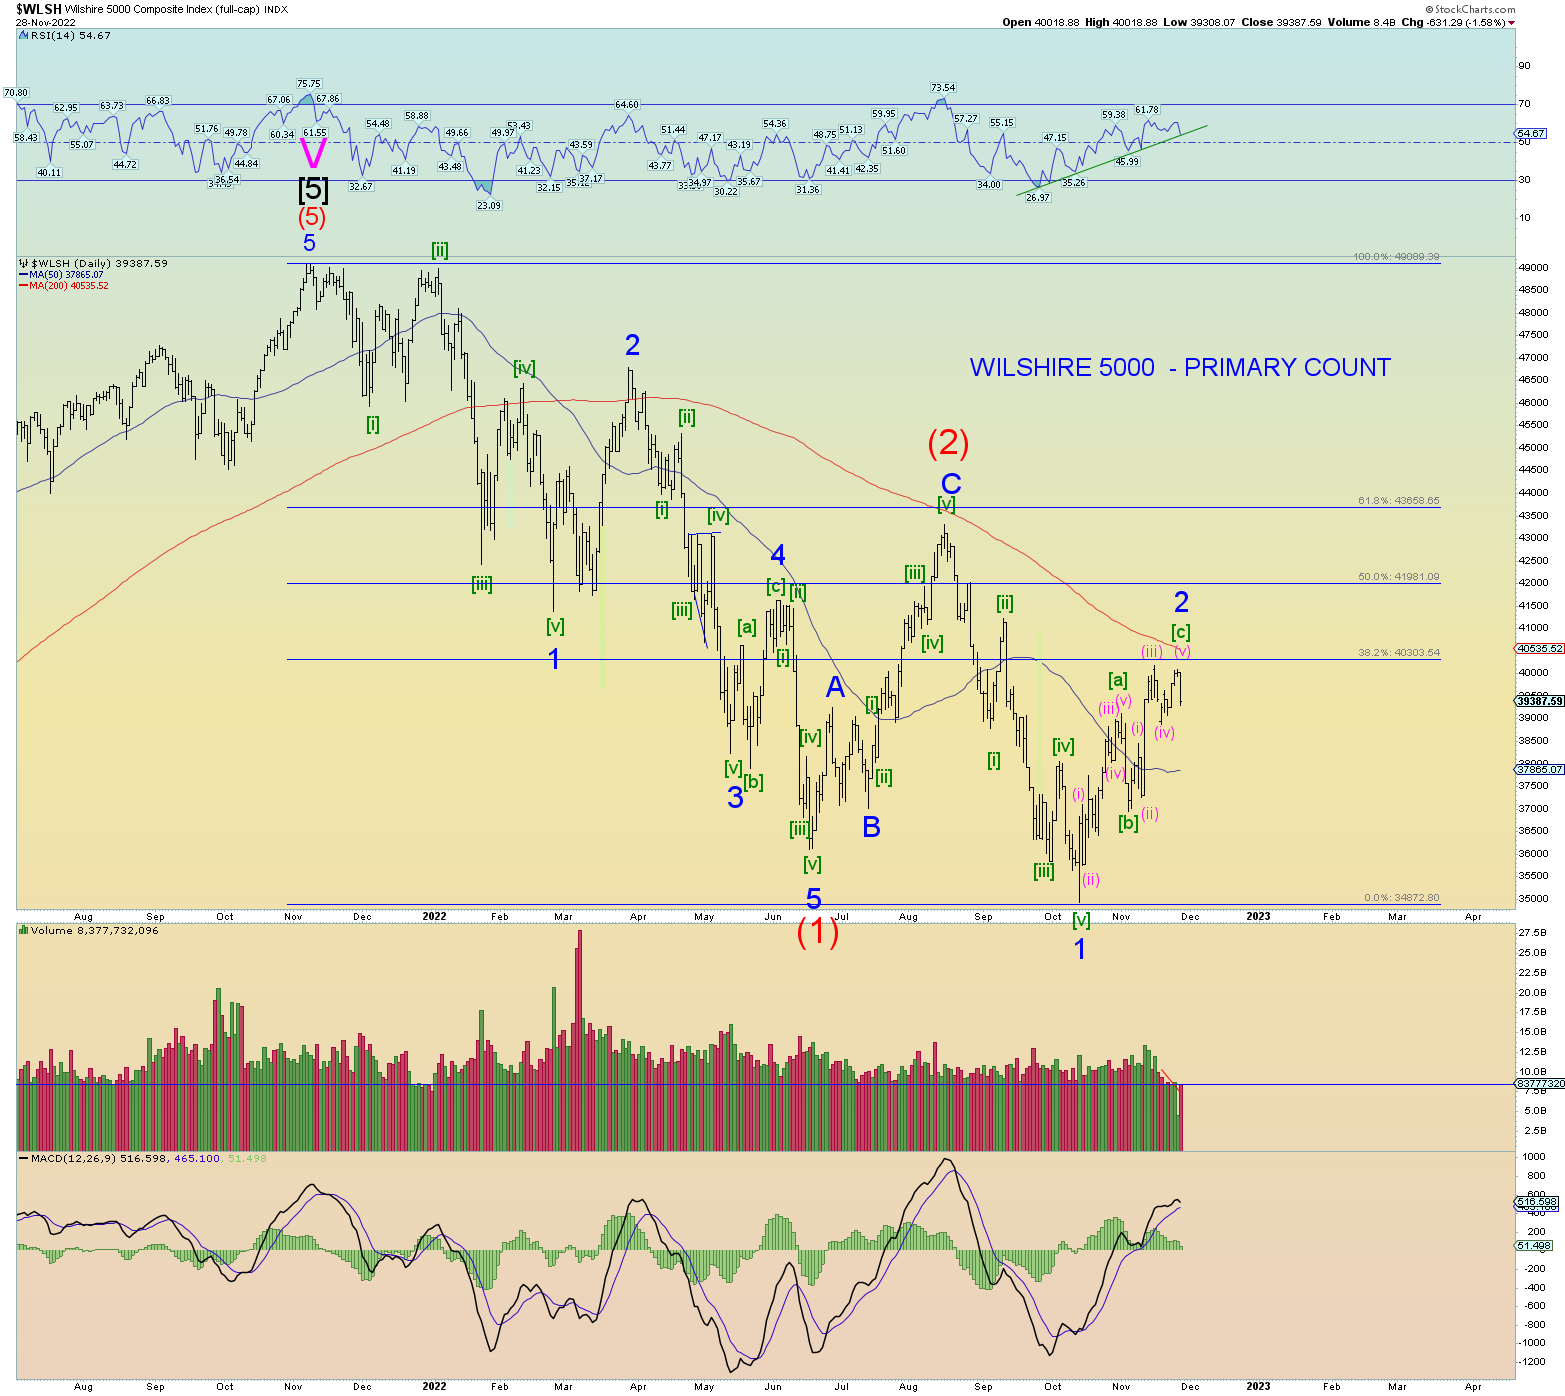
The move from the recent 4034 SPX high to today’s low looks more impulsive down rather than corrective which implies the trend has reversed and we are heading lower. Again, the market (and everyone else) knows very well that 3900 is key support.
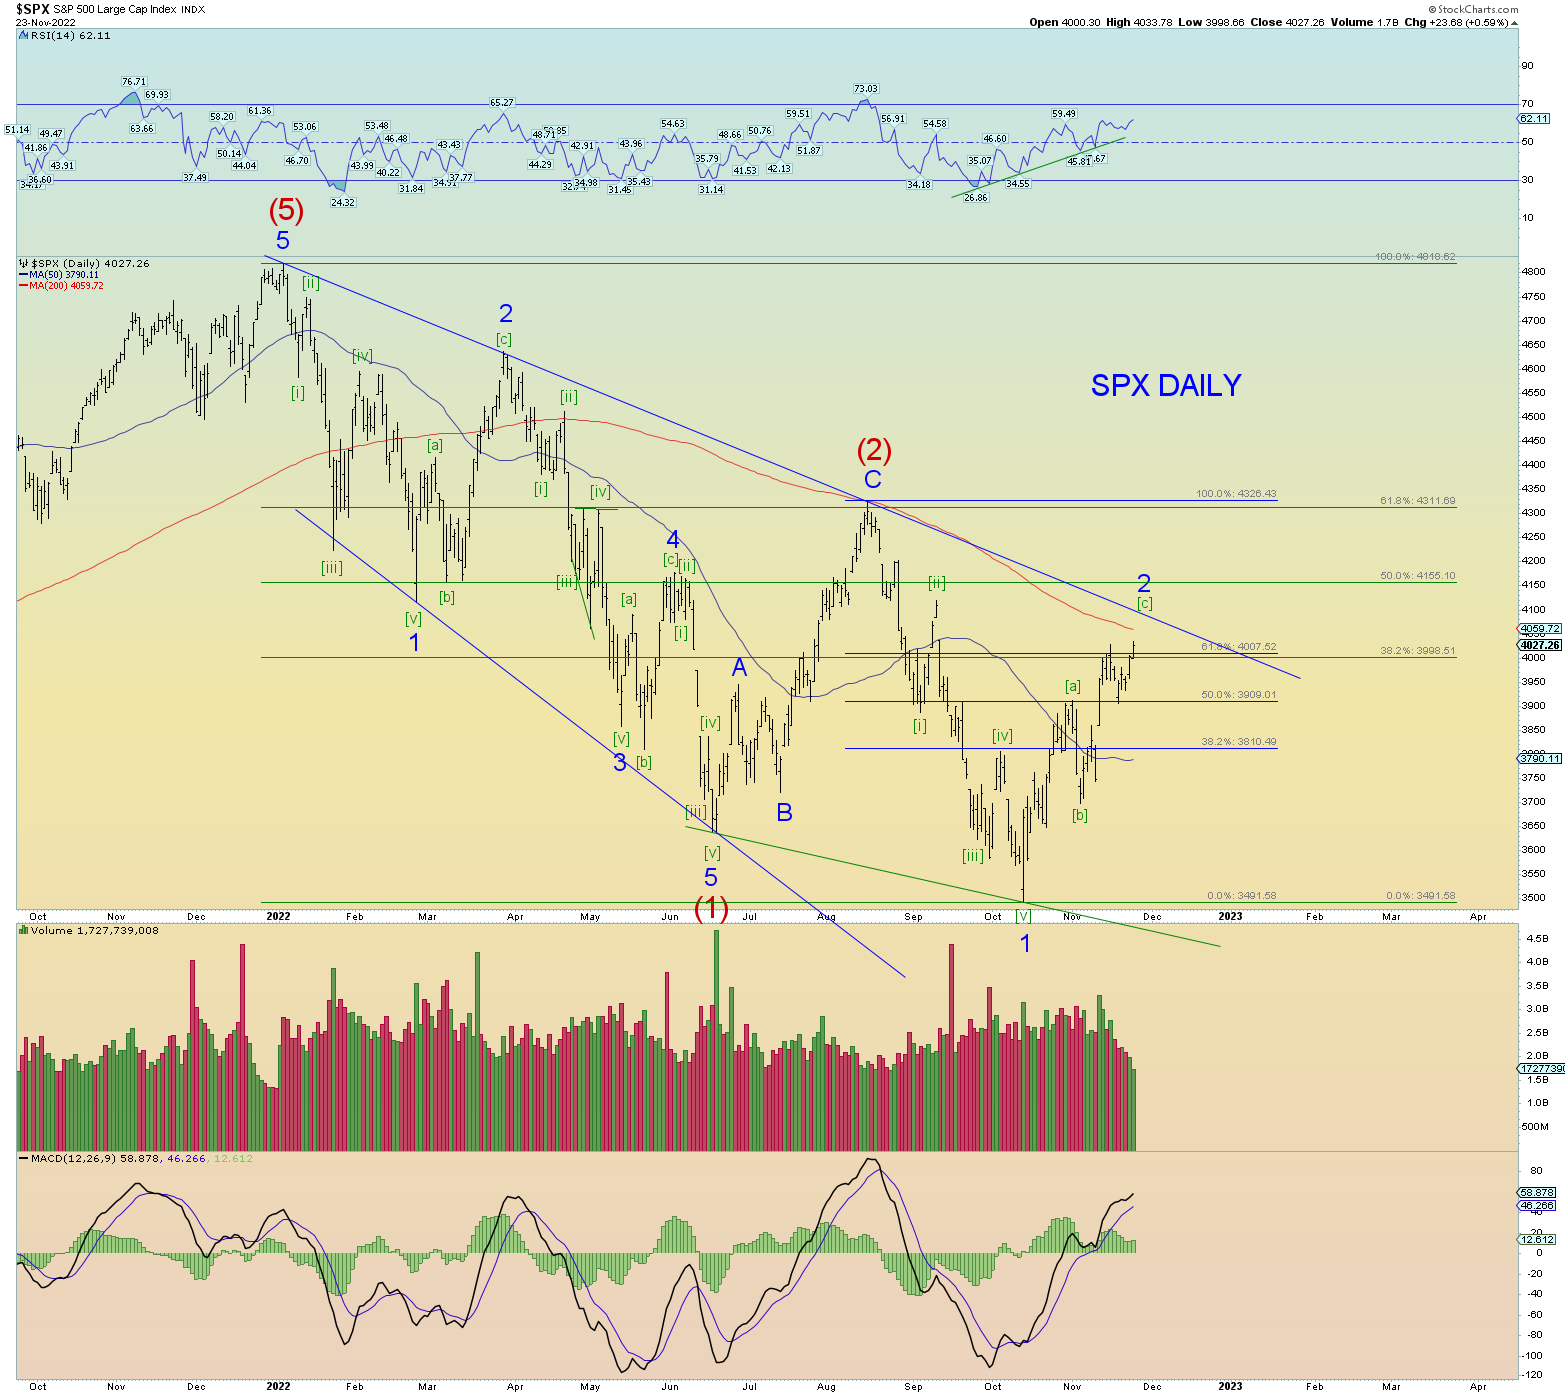
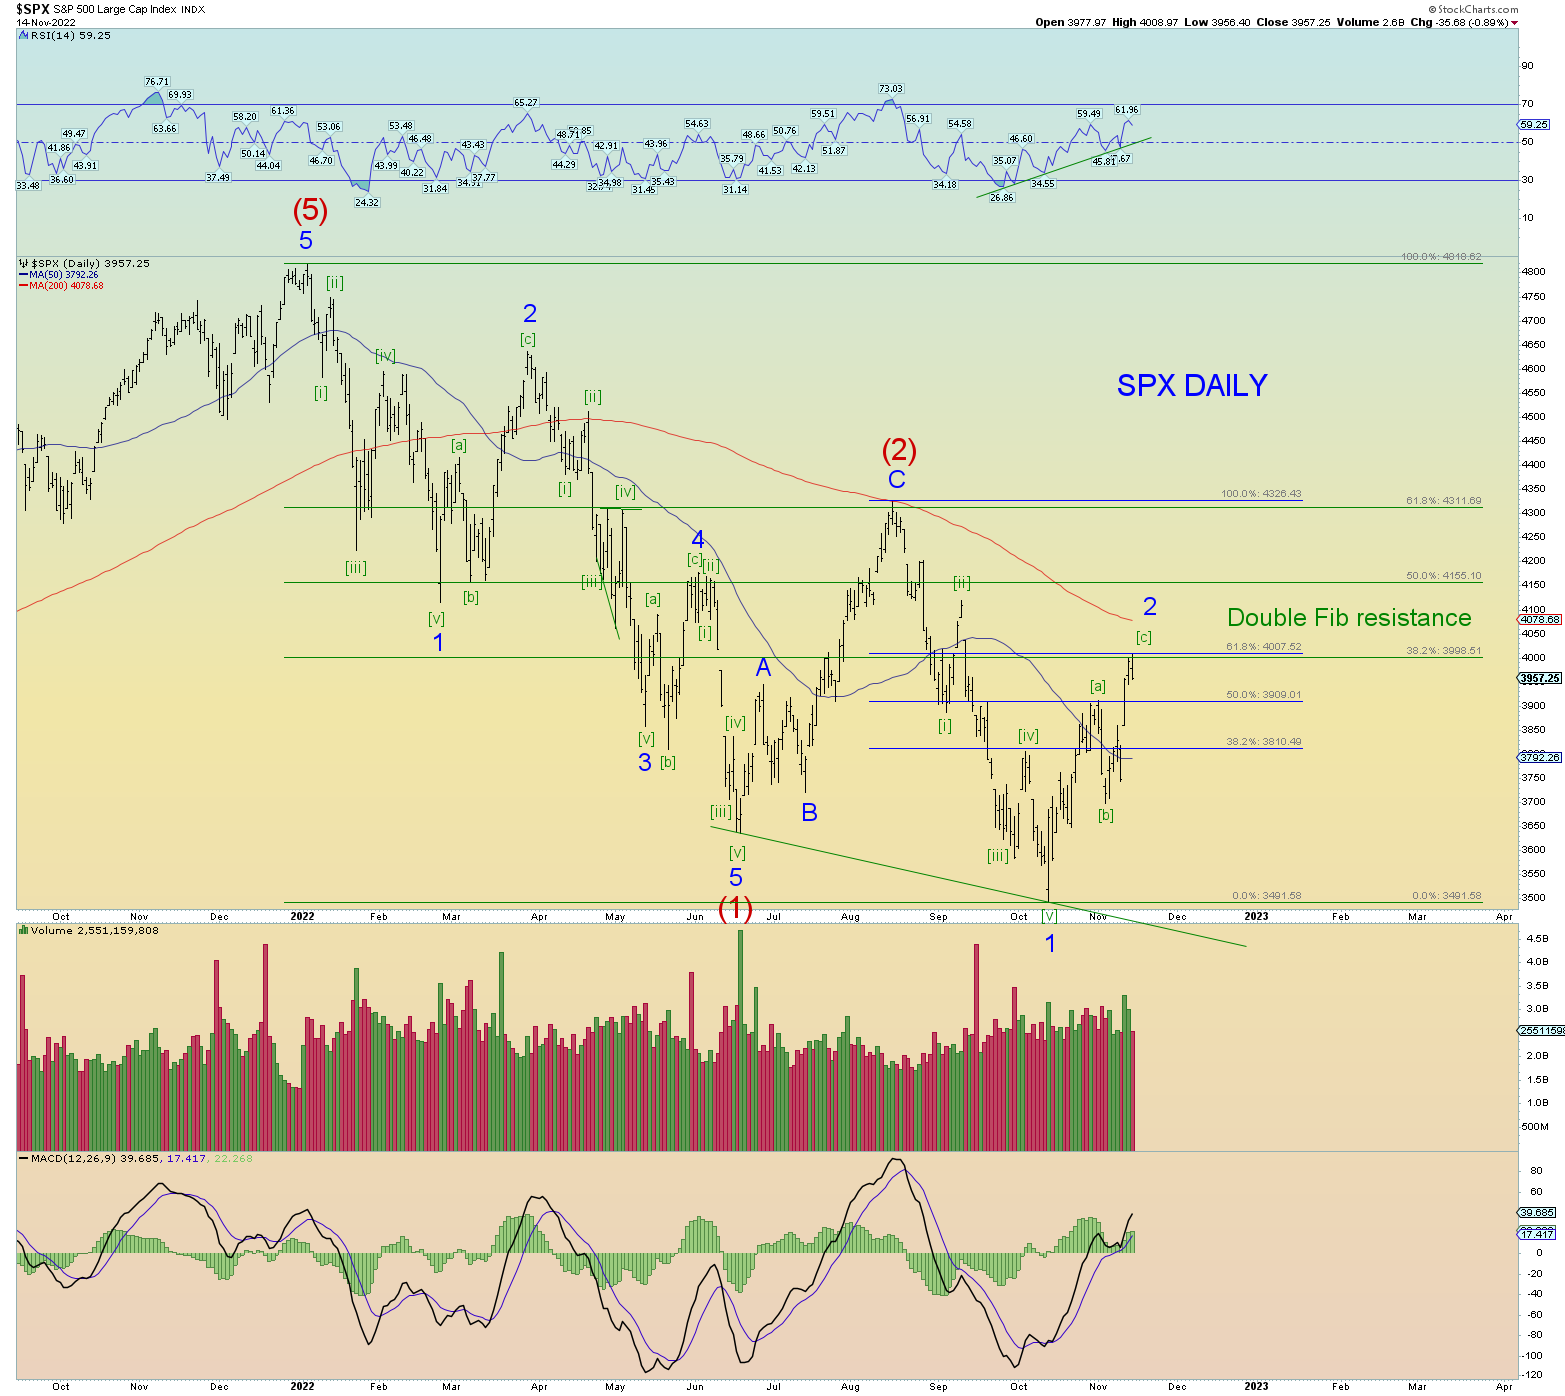
On the Wilshire daily (and SPX) you can see a classic 5-3-5 [a]-[b]-[c] zigzag (or even a double zigzag) for Minor 2 up. Just seems a classic corrective pattern which implies sooner or later, the big wave (3) down will commence.
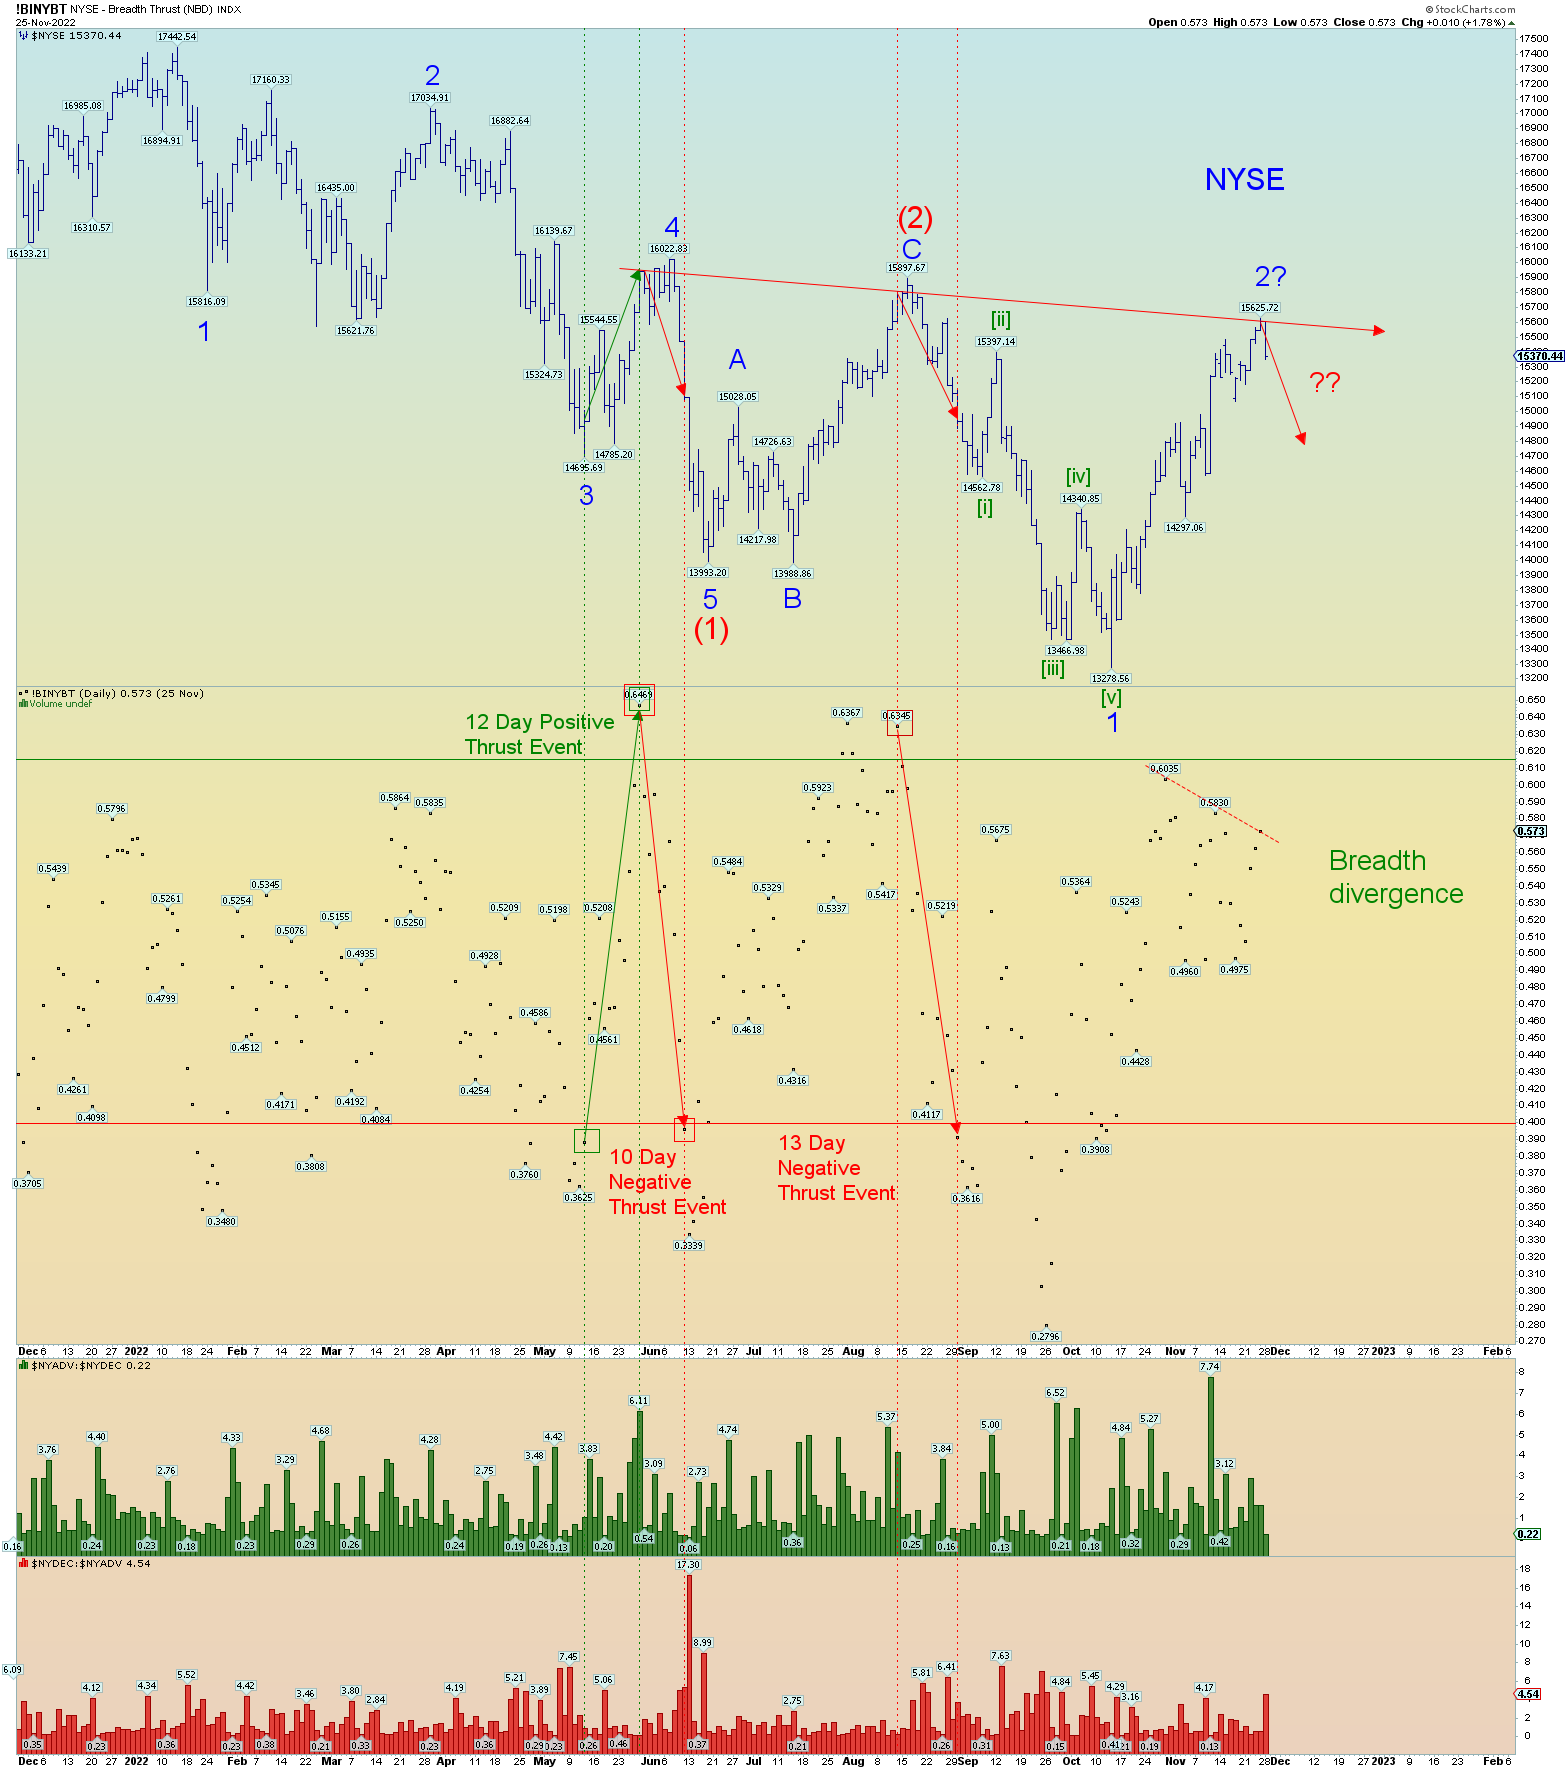
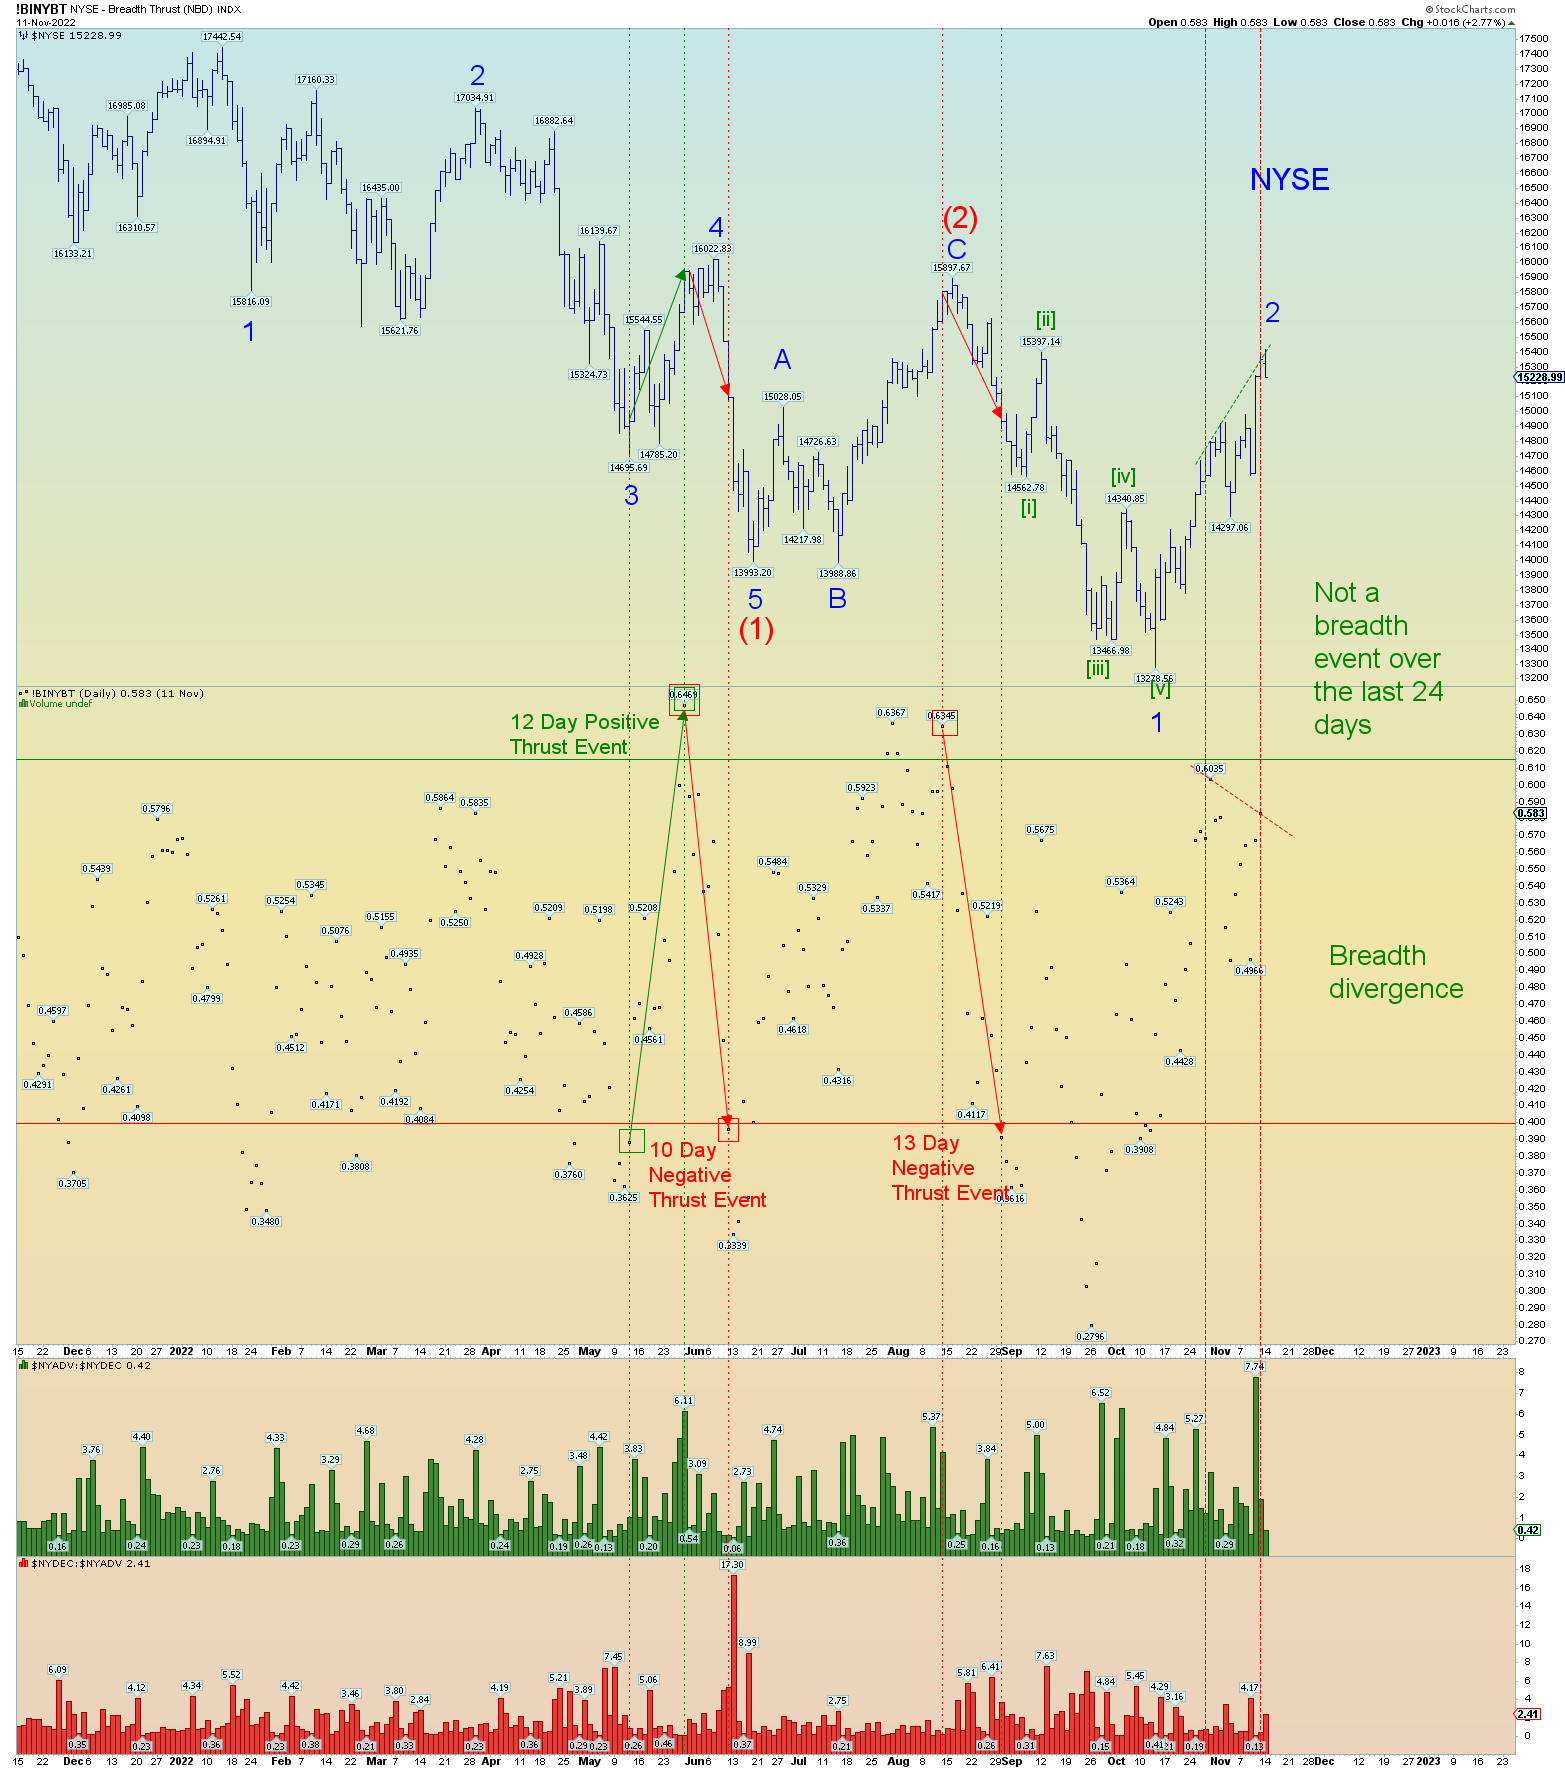
Prices have again reached the point on the NYSE where a bad negative thrust event should occur.
And if there was any doubt the Jewish fix is in, I’m laughing out loud. At this point you just have to. The NY Times Jewish propaganda fest for the masses has the Jewish King of Crypto still scheduled as a speaker:
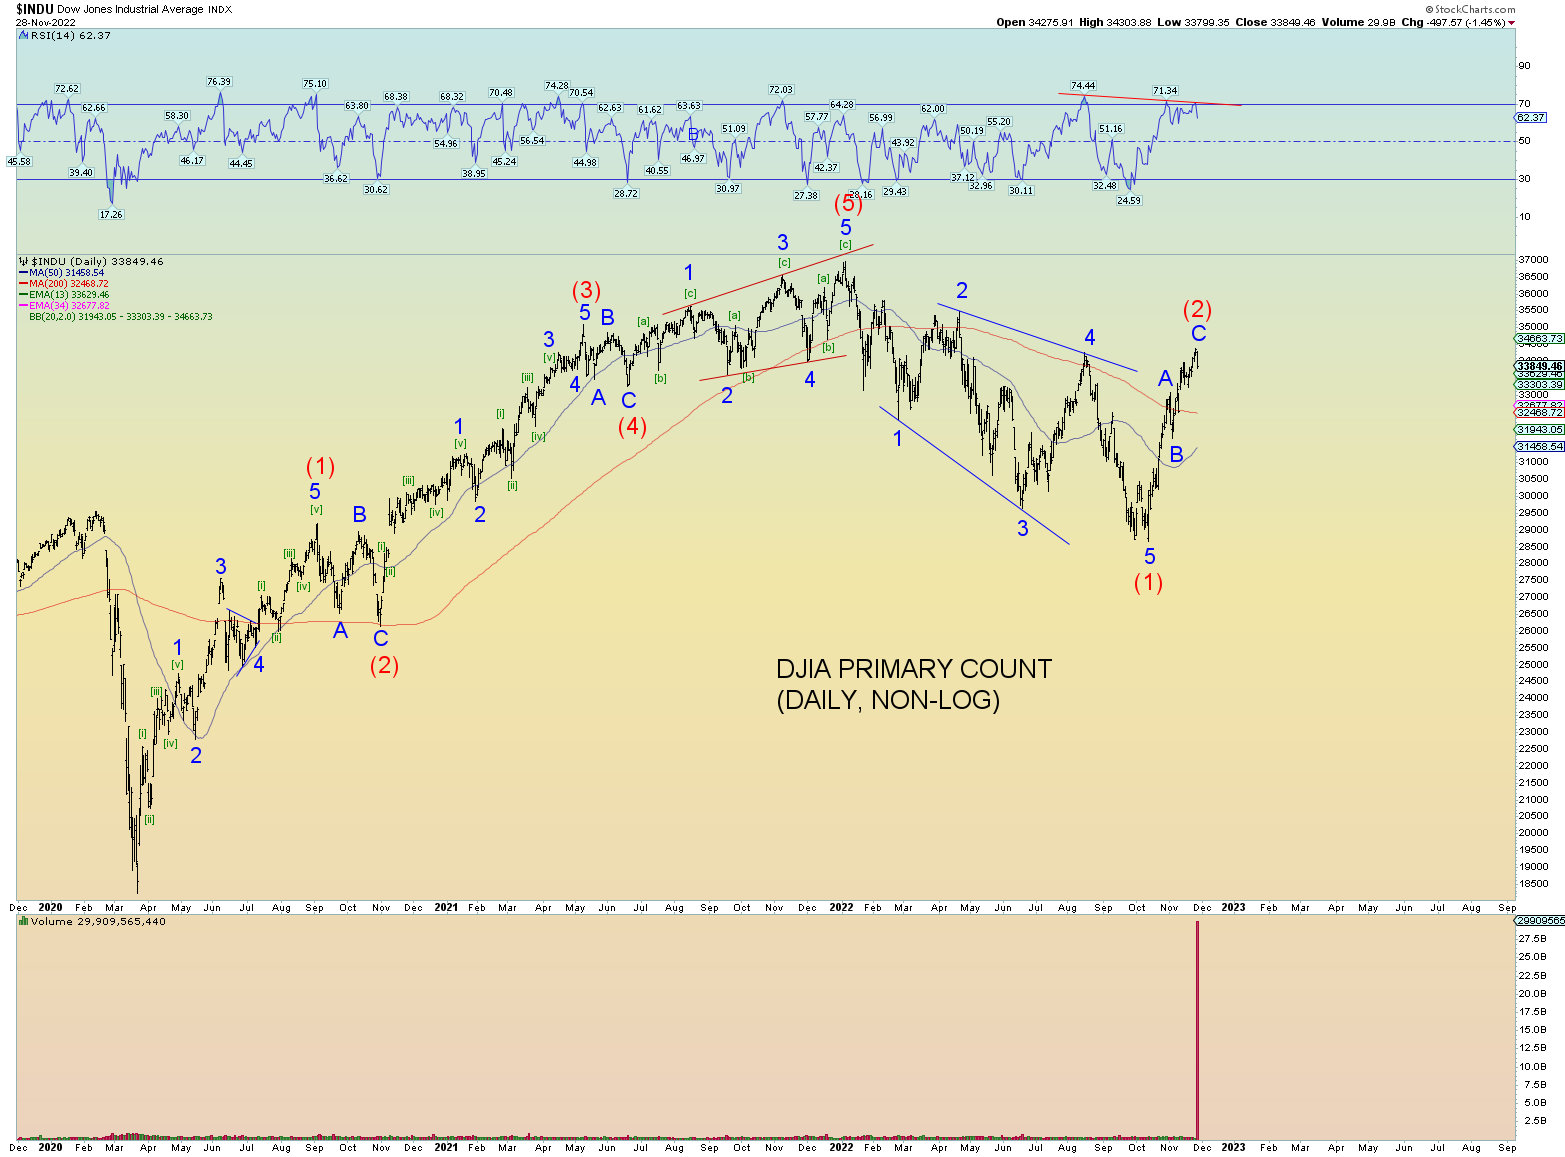
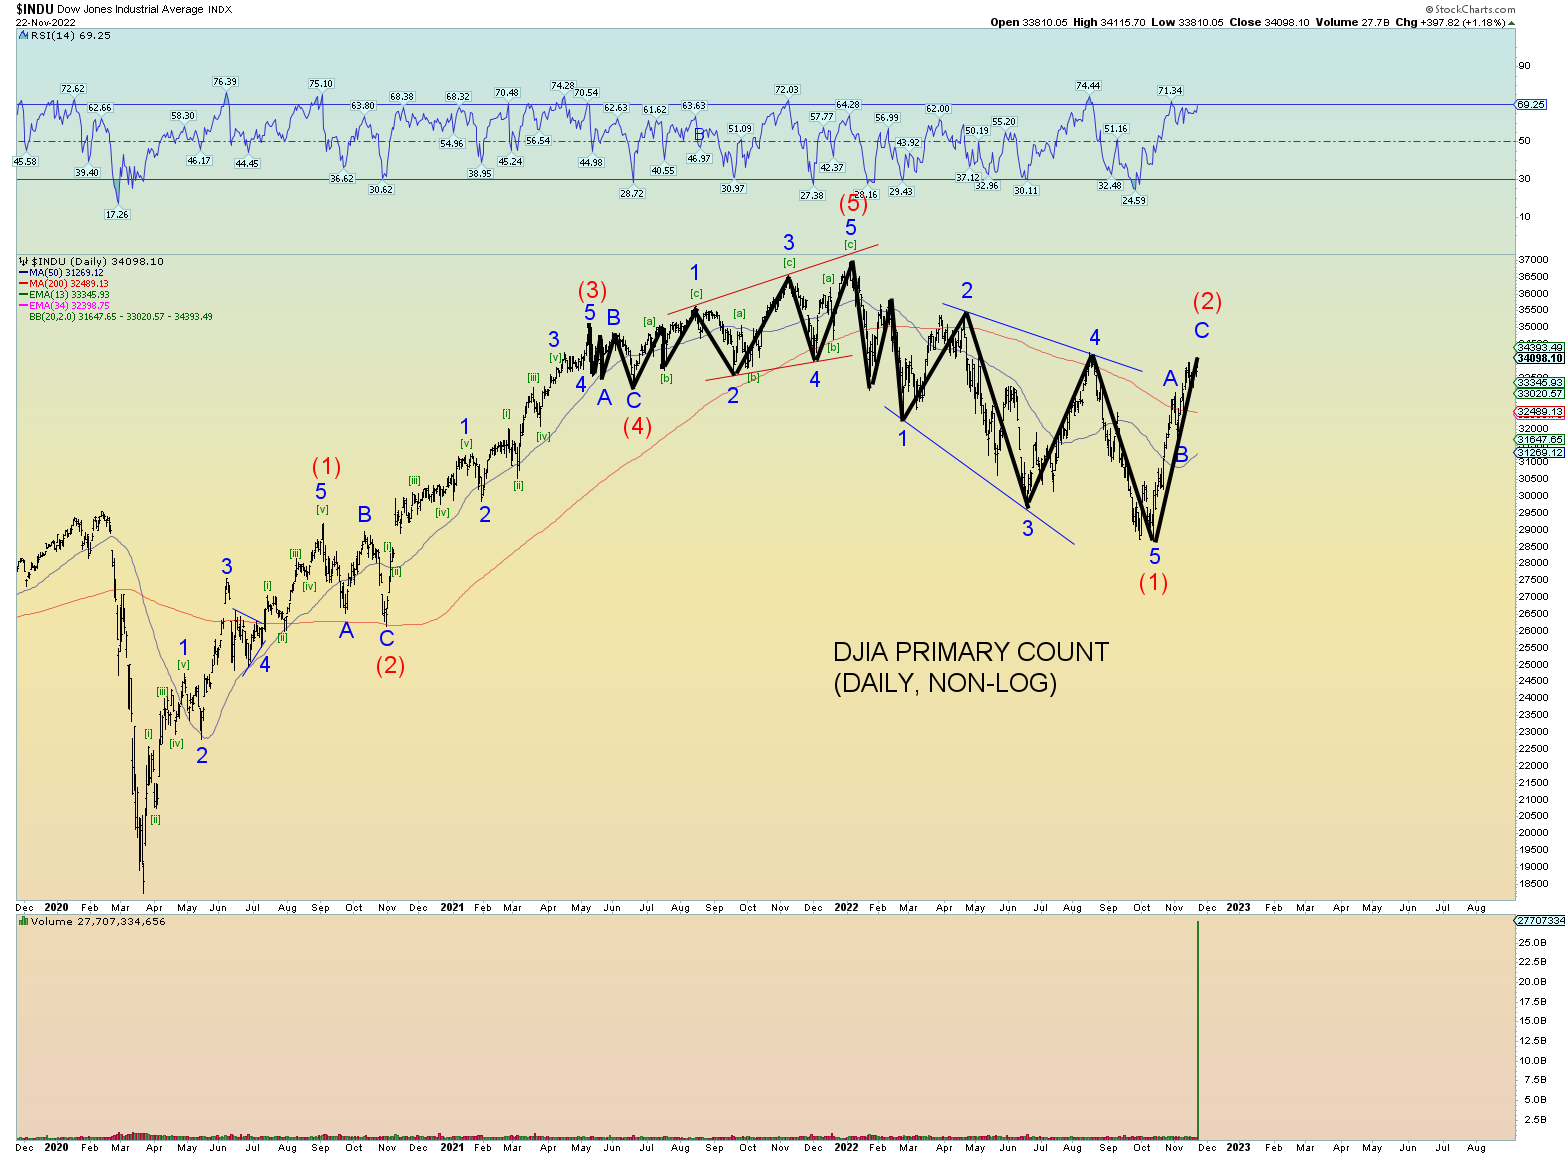
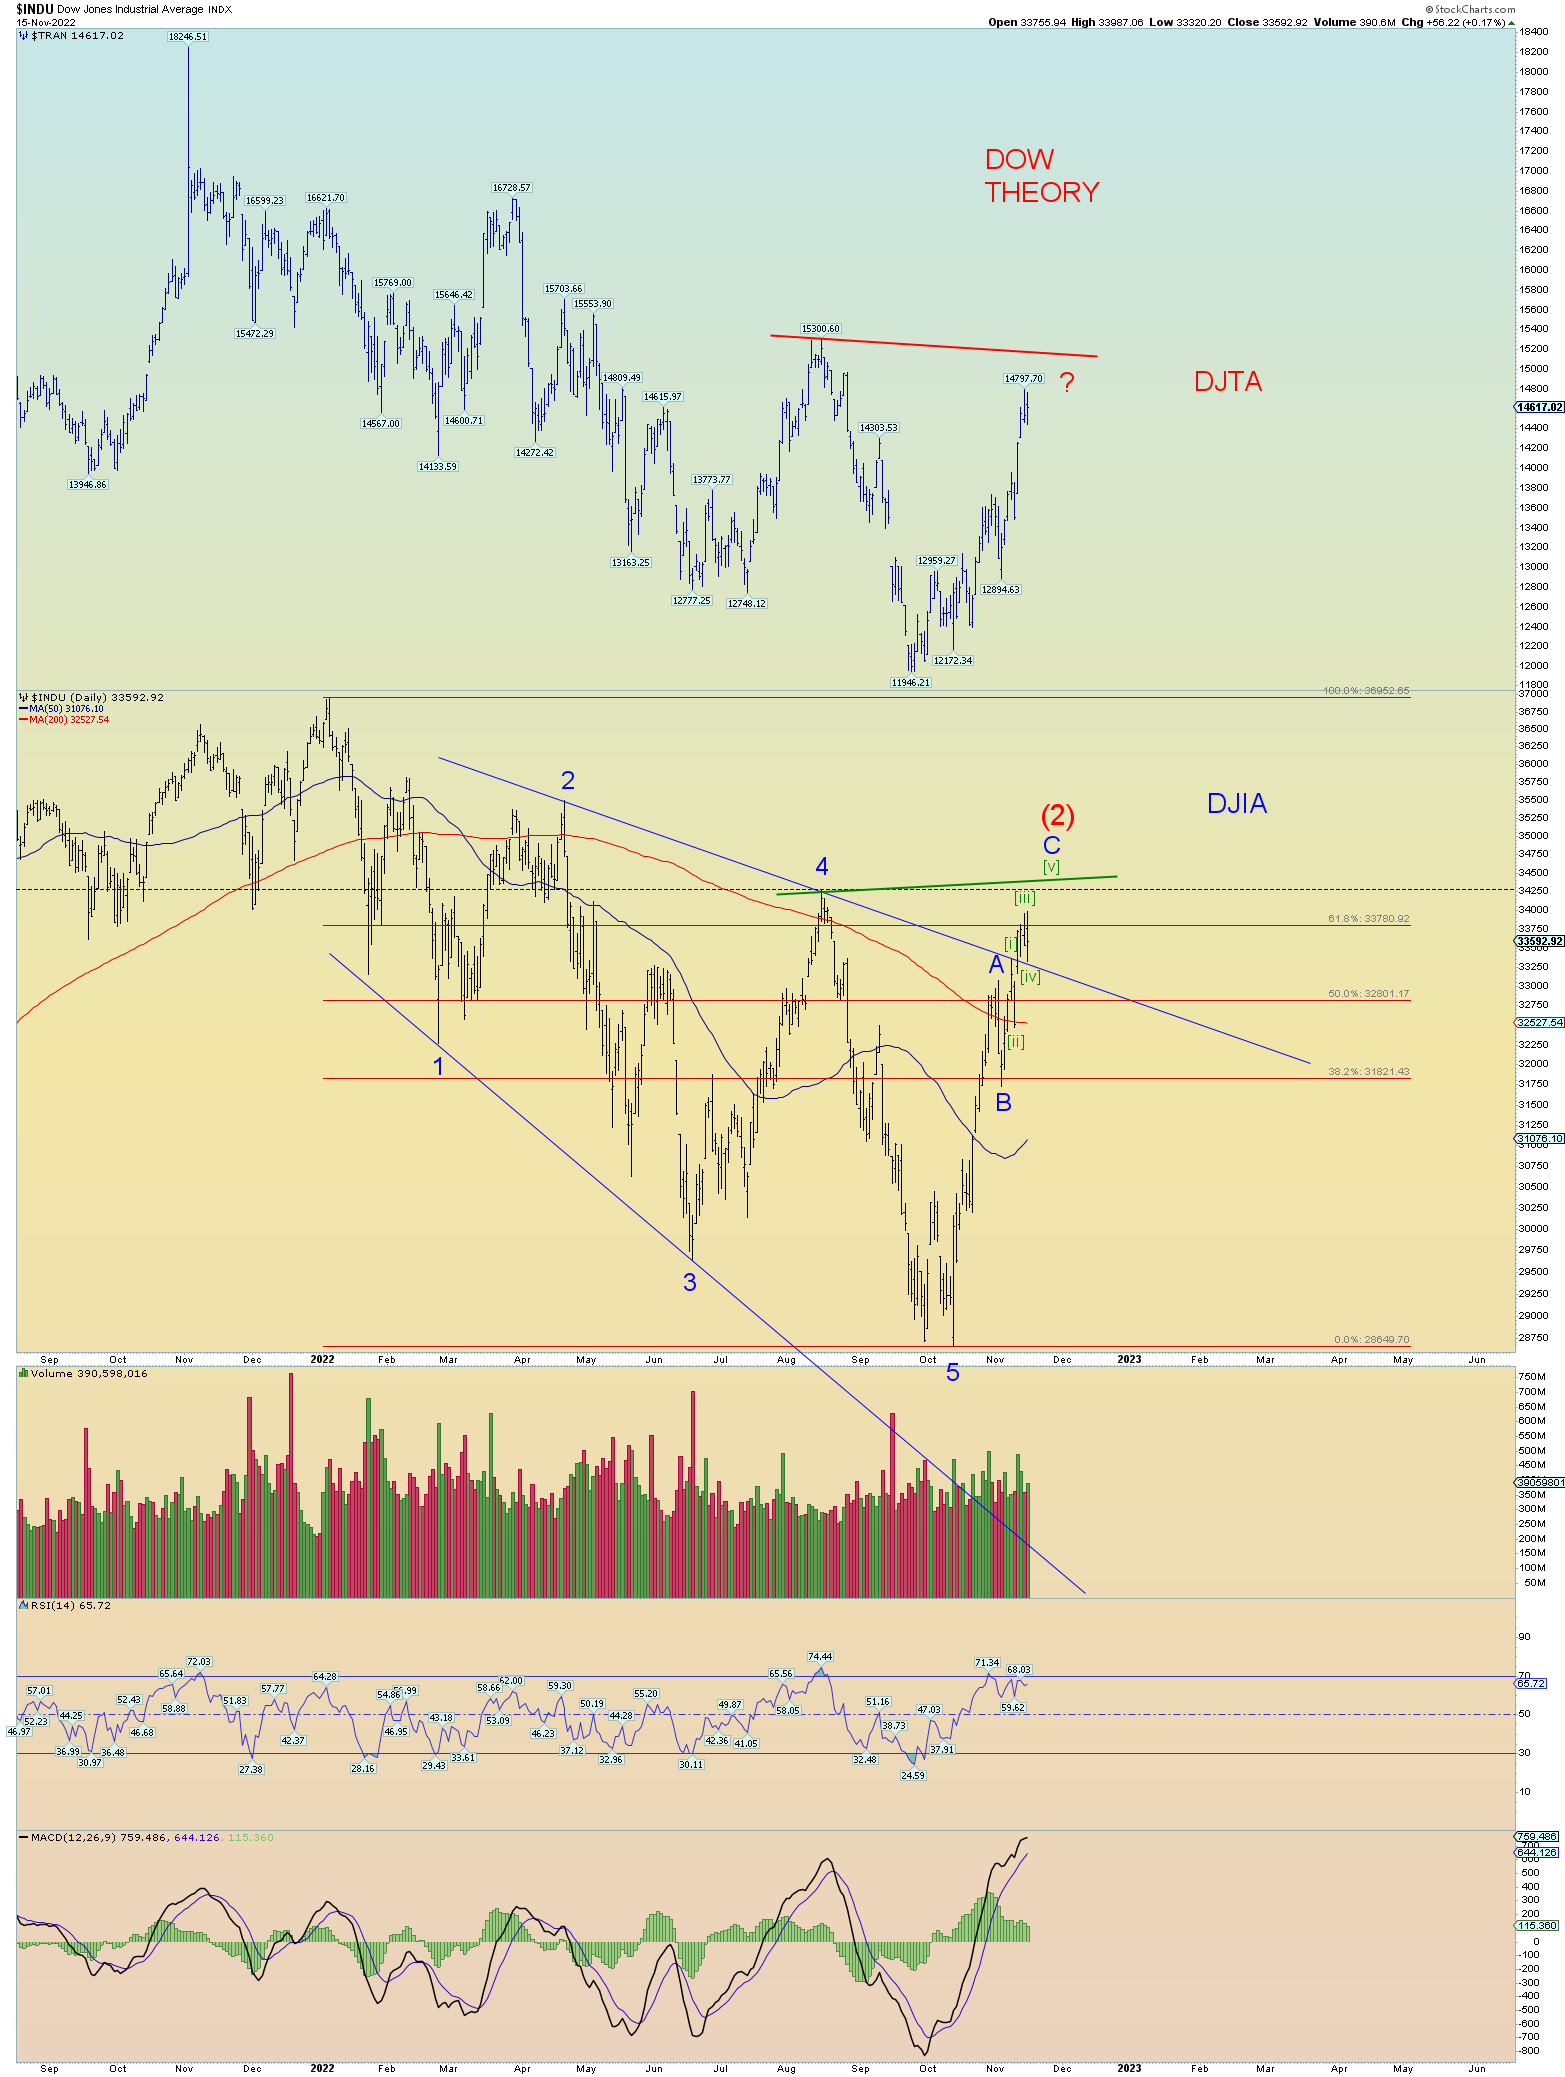
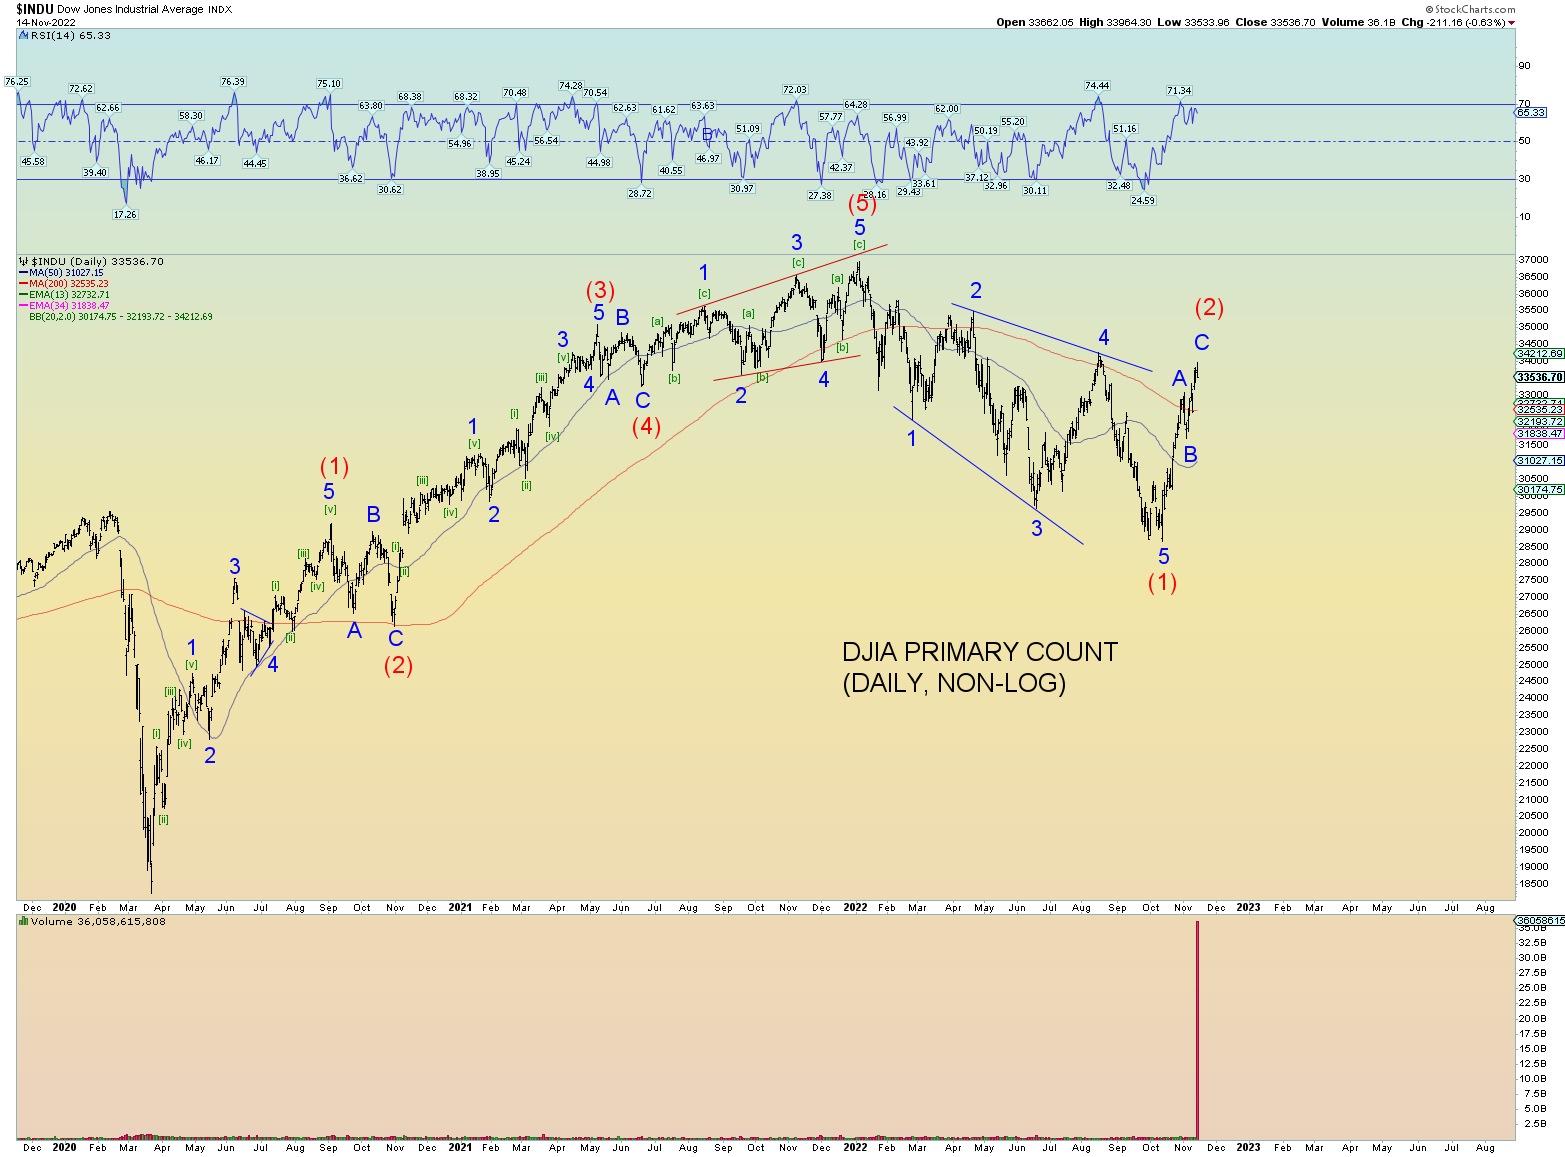
The DJIA closed at its highest since early April and is less than 8% from making a new all-time high. Yet the NASDAQ Composite is still some 30% beneath its all-time peak. The difference is remarkable.
DOW theory is in danger of triggering if the transports cannot follow the Industrials.
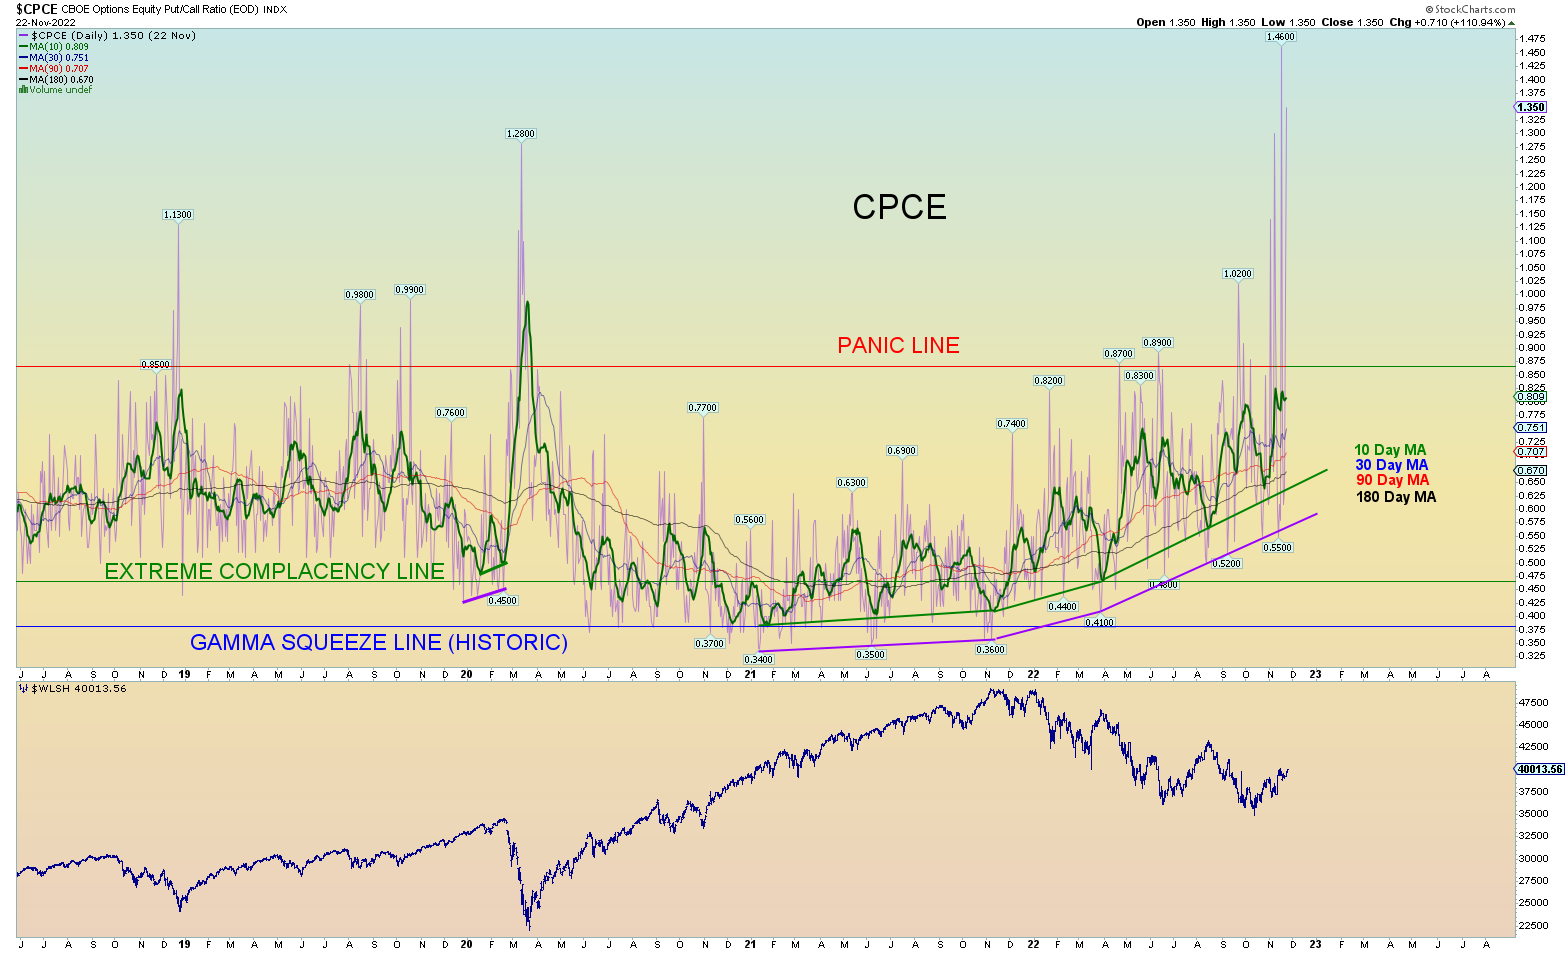
Yesterday’s CPCE data. A herky-jerky affair from one extreme to another.
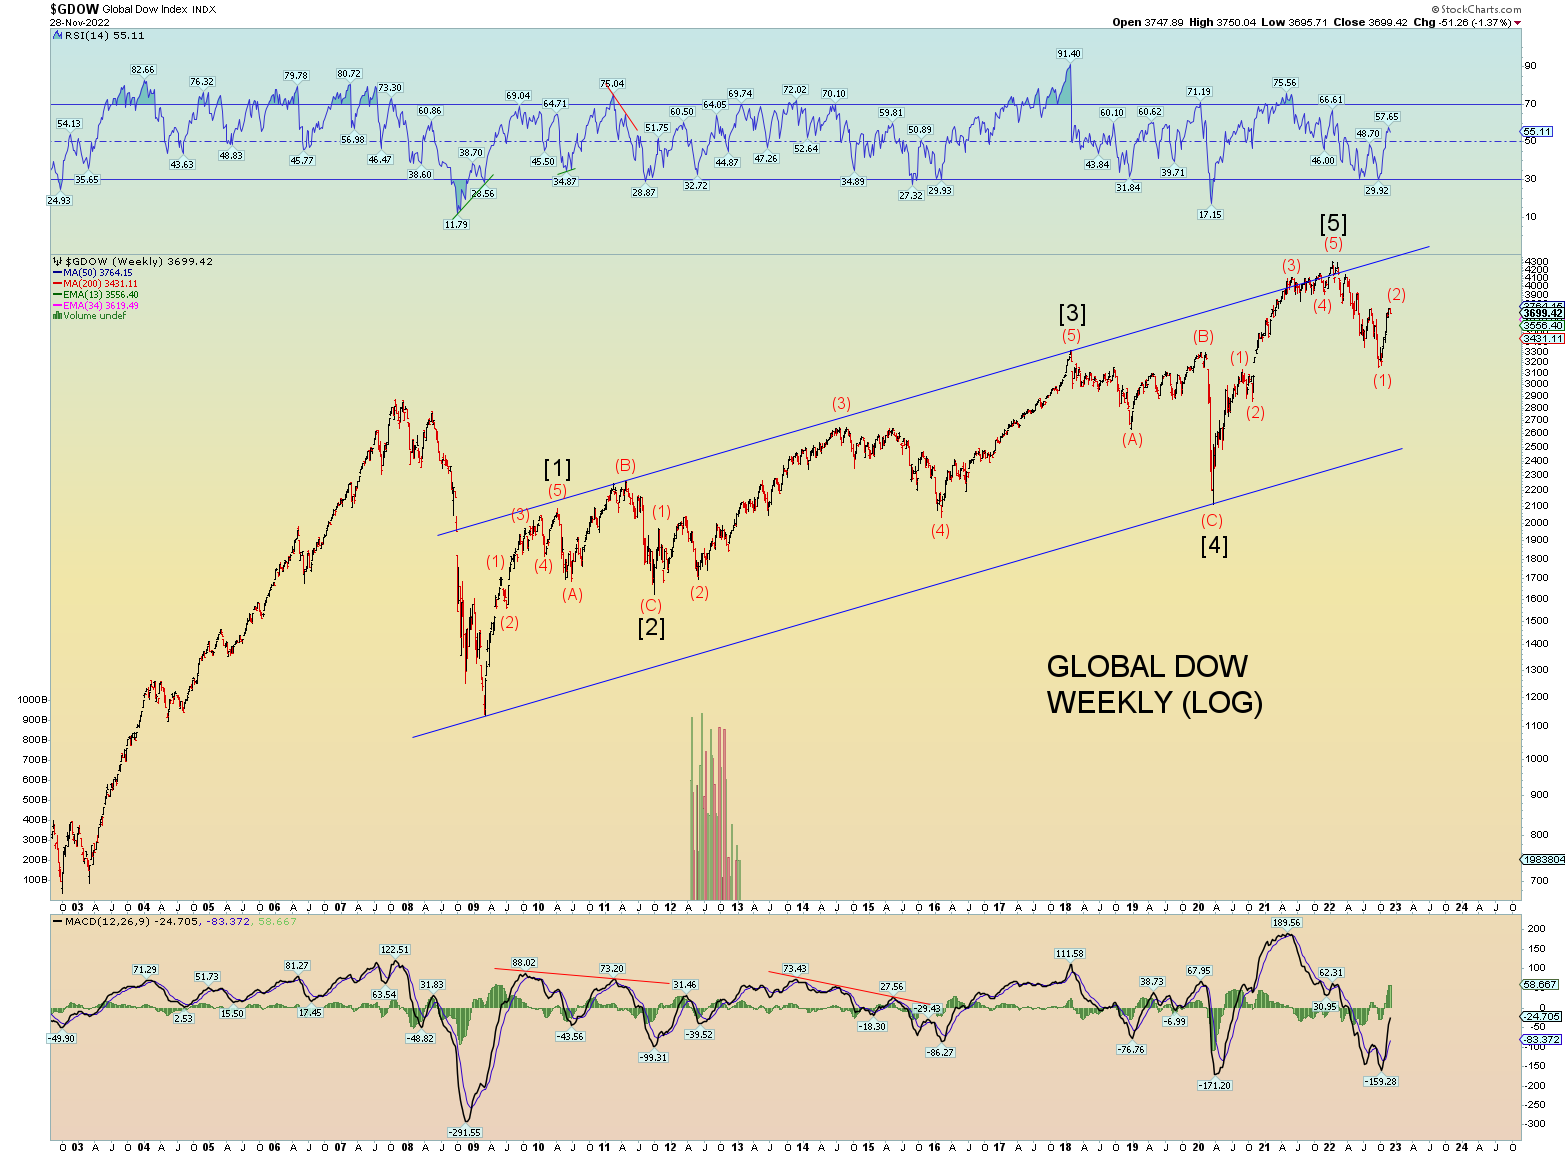
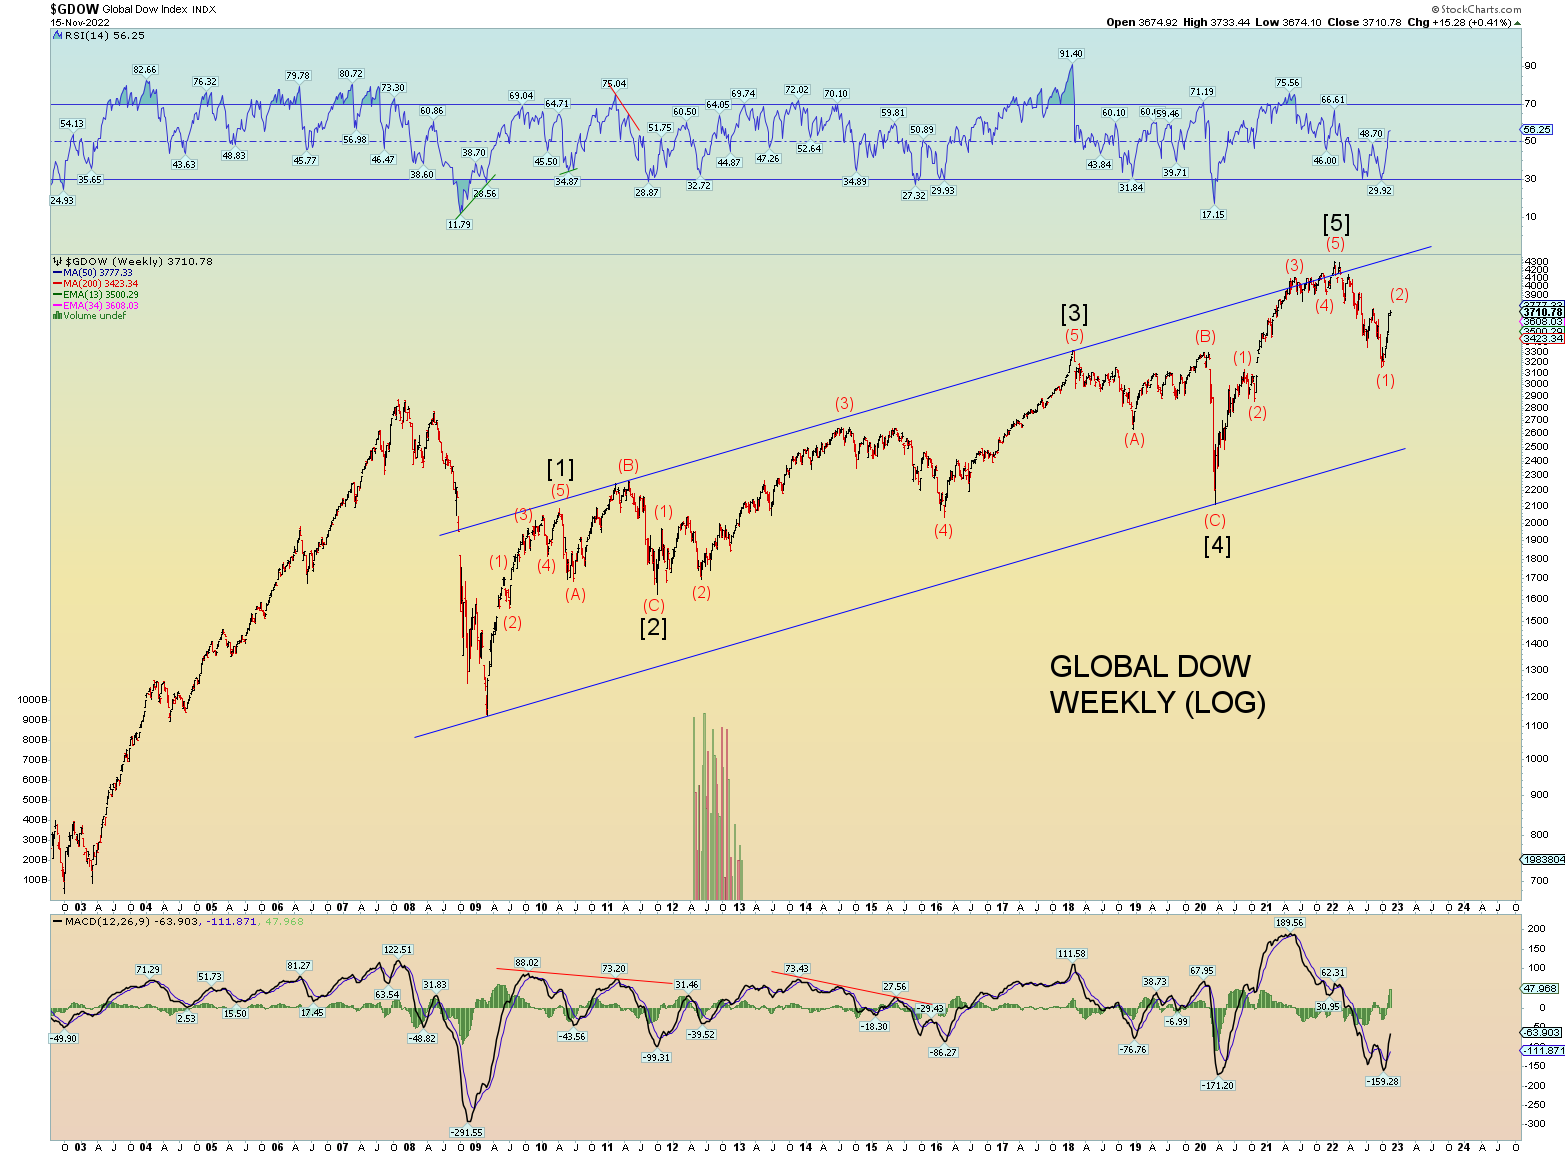
Global Dow:
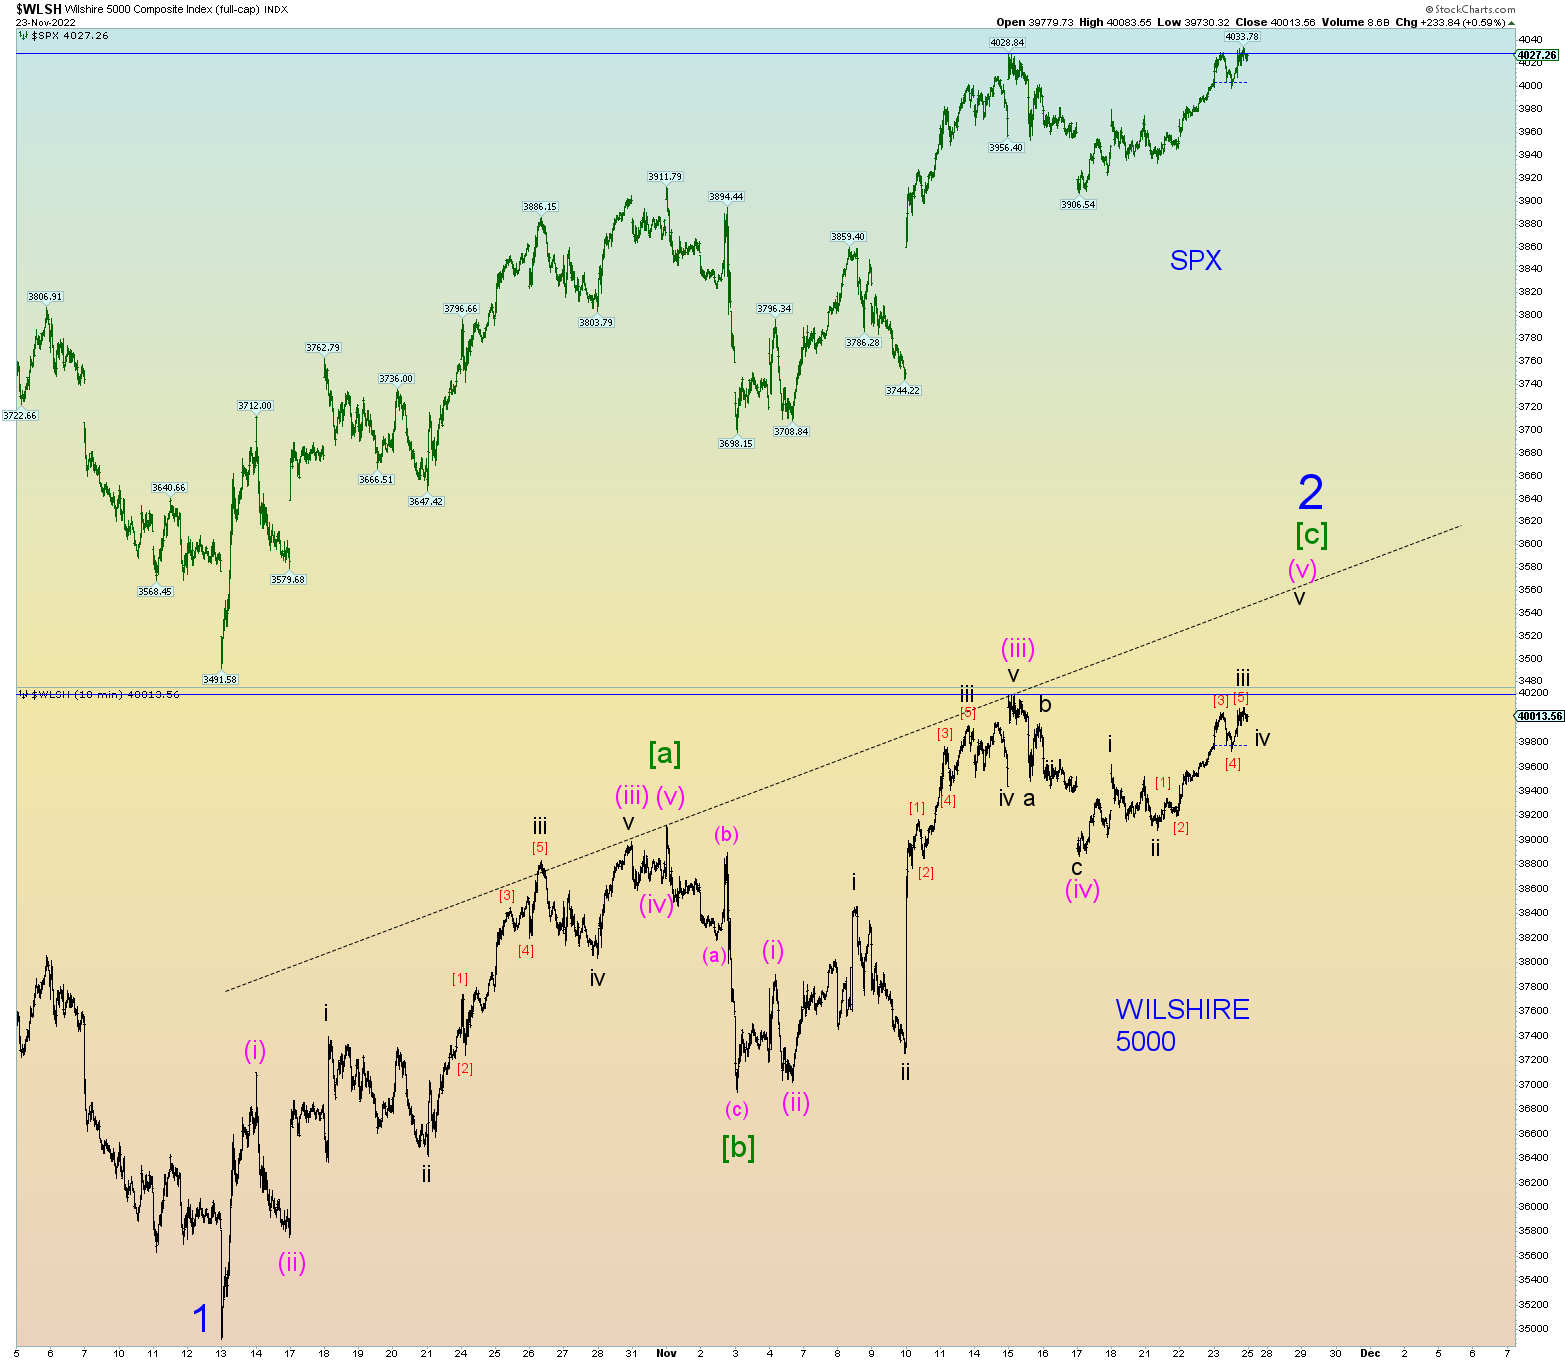
A comparison of the Wilshire and SPX. New recovery Minor 2 high for the SPX but the Wilshire was unable to achieve the same. Sometimes the minor differences between these close cousin indices are a clue the trend is about to reverse.
And of course, the SPX is knocking on the bottom of the huge open chart gap. Note that wave [c] = [a] @ 4118.
And close to a key downtrend line and its 200 DMA
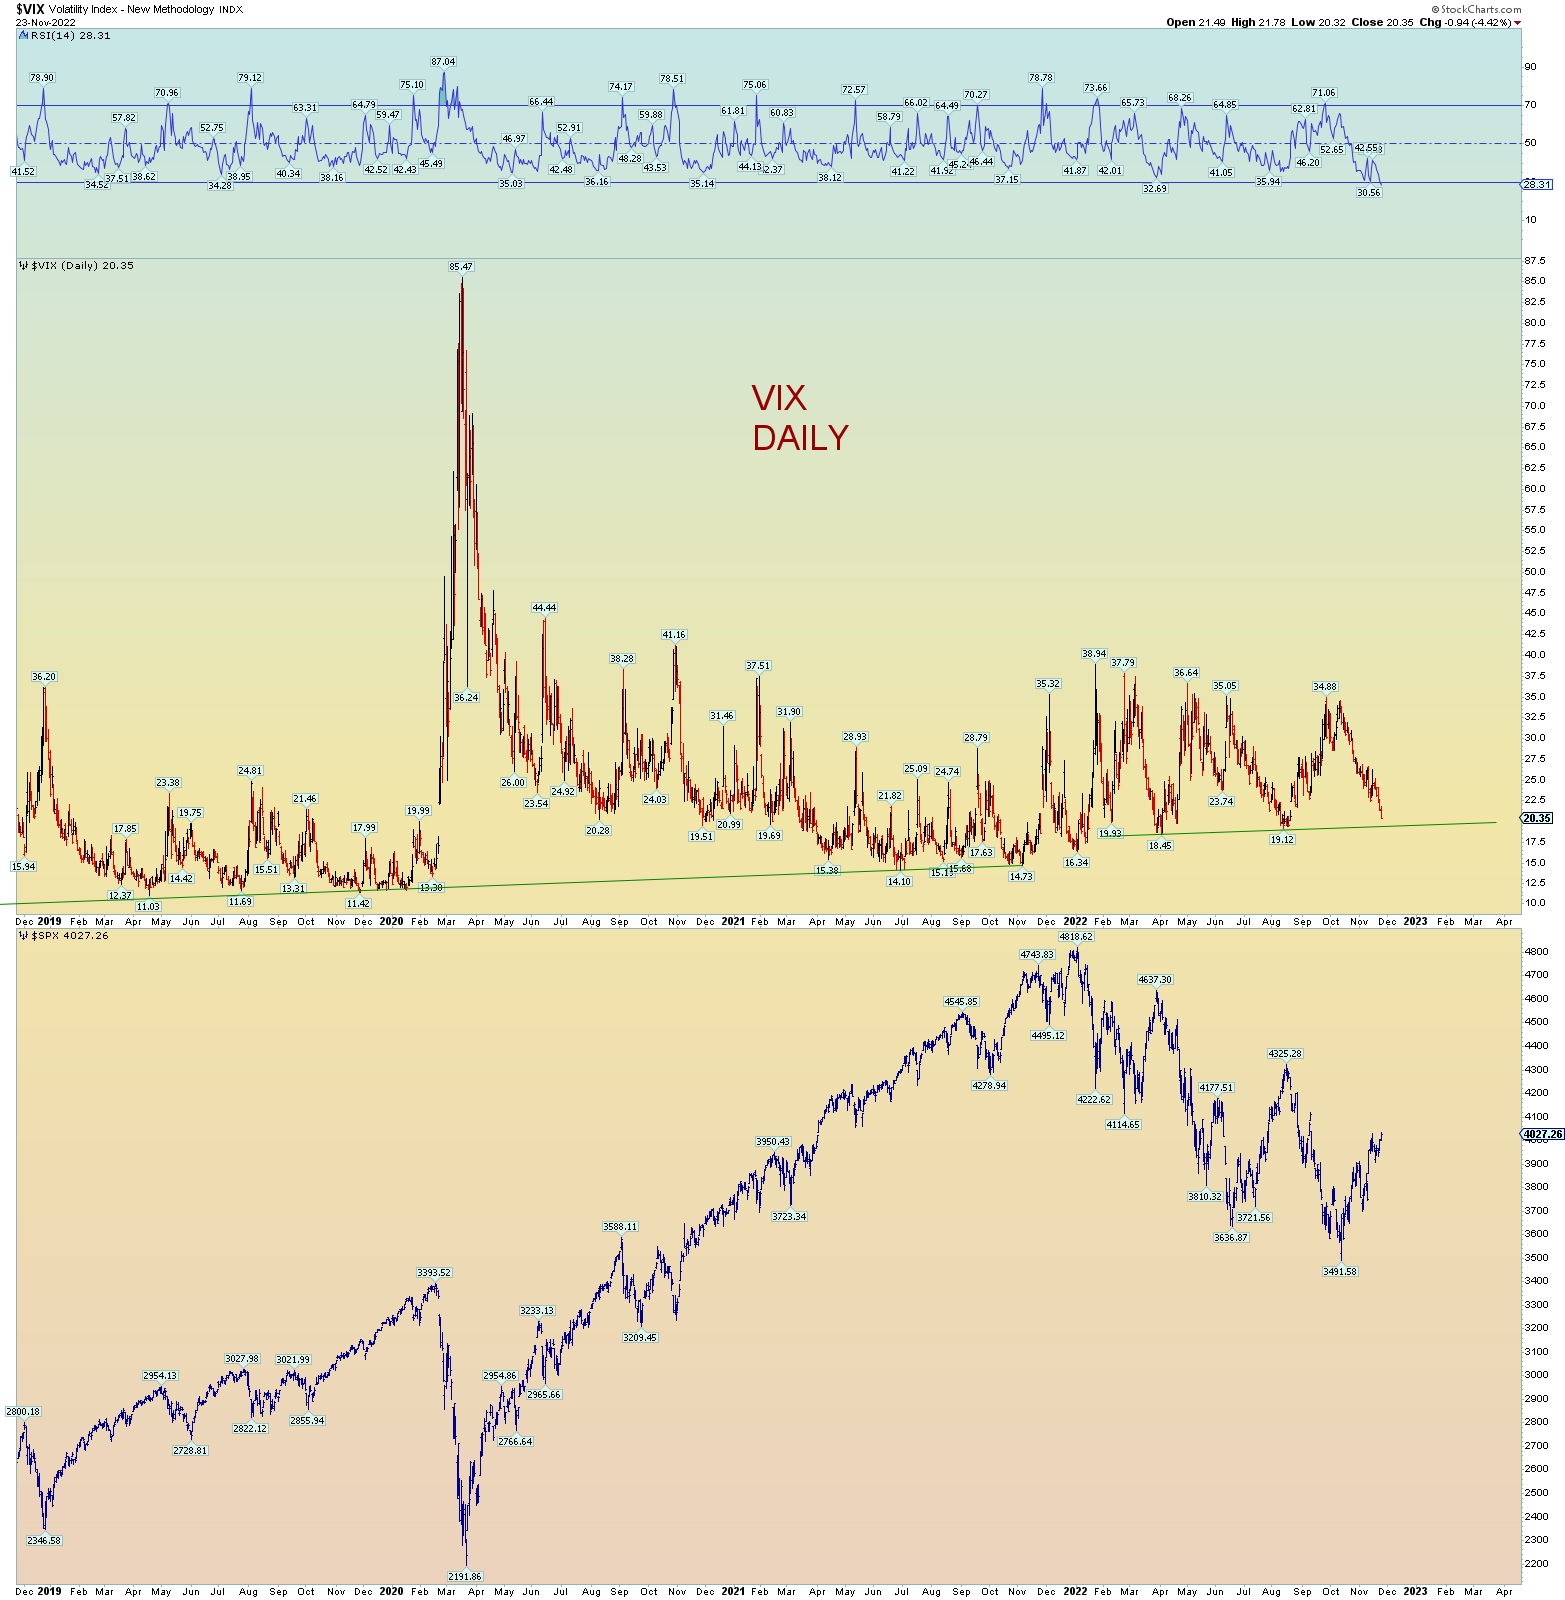
The VIX is reflecting the newborn complacency of the market. This is how the market works off oversold bearish sentiment conditions. Some 500+ points lower than in late March in the SPX, yet the VIX is trading about the same.
Even though the market finally broke higher again – as this blog has been patient to realize – suddenly tonight, the bearish count looks kind good again. There is not enough confidence to make it the primary count, but we’ll just call it the bearish count. The primary count still suggests the huge overhead gap will be closed.
The market seems to be at one of those major inflection points.
DJIA almost makes its highest high since early March. DOW theory is flashing red if the Industrials manage a higher high above the August high and the transports fail to adchieve.
Notice any pattern here? How about a broken market?
It was the Jews who rejected Jesus in the 1st century that were the early persecutors of Christians. It will be Jews who rejected Jesus in the 21st century who will lead the effort to establish the New World Order and they are hell-bent on revenge. And once again, Christians will be persecuted by the same religion that Jesus so hated and still does. The bible will repeat itself as in all things.
The wicked United Nations gave birth to the imposter Jewish nation of Israel in 1948. It has fooled all of Christianity and what should we expect? The Devil is the great liar who knows how to patiently manipulate mankind to work his evil end-times plan of a one world government, a one world religion and a one world currency.
Crypto King of the Jews. Not my title. He ripped off millions, but then again it is acceptable for Jews to steal from the “Goyim”. Funneling money to the wicked Democrats (and their Republican Uniparty co-horts).
The Jews have Babylon USA – The Great Whore – as the chief ally to carry out the plans of Satan. And although we find many, many members of Biden’s cabinet members and key institutions Jews, those who would not be caught dead to consider themselves “Jewish” instead have elected to be Freemasons, the Jewish ally offshoot born of the Jewish Kabbala and Babylonic Talmud.
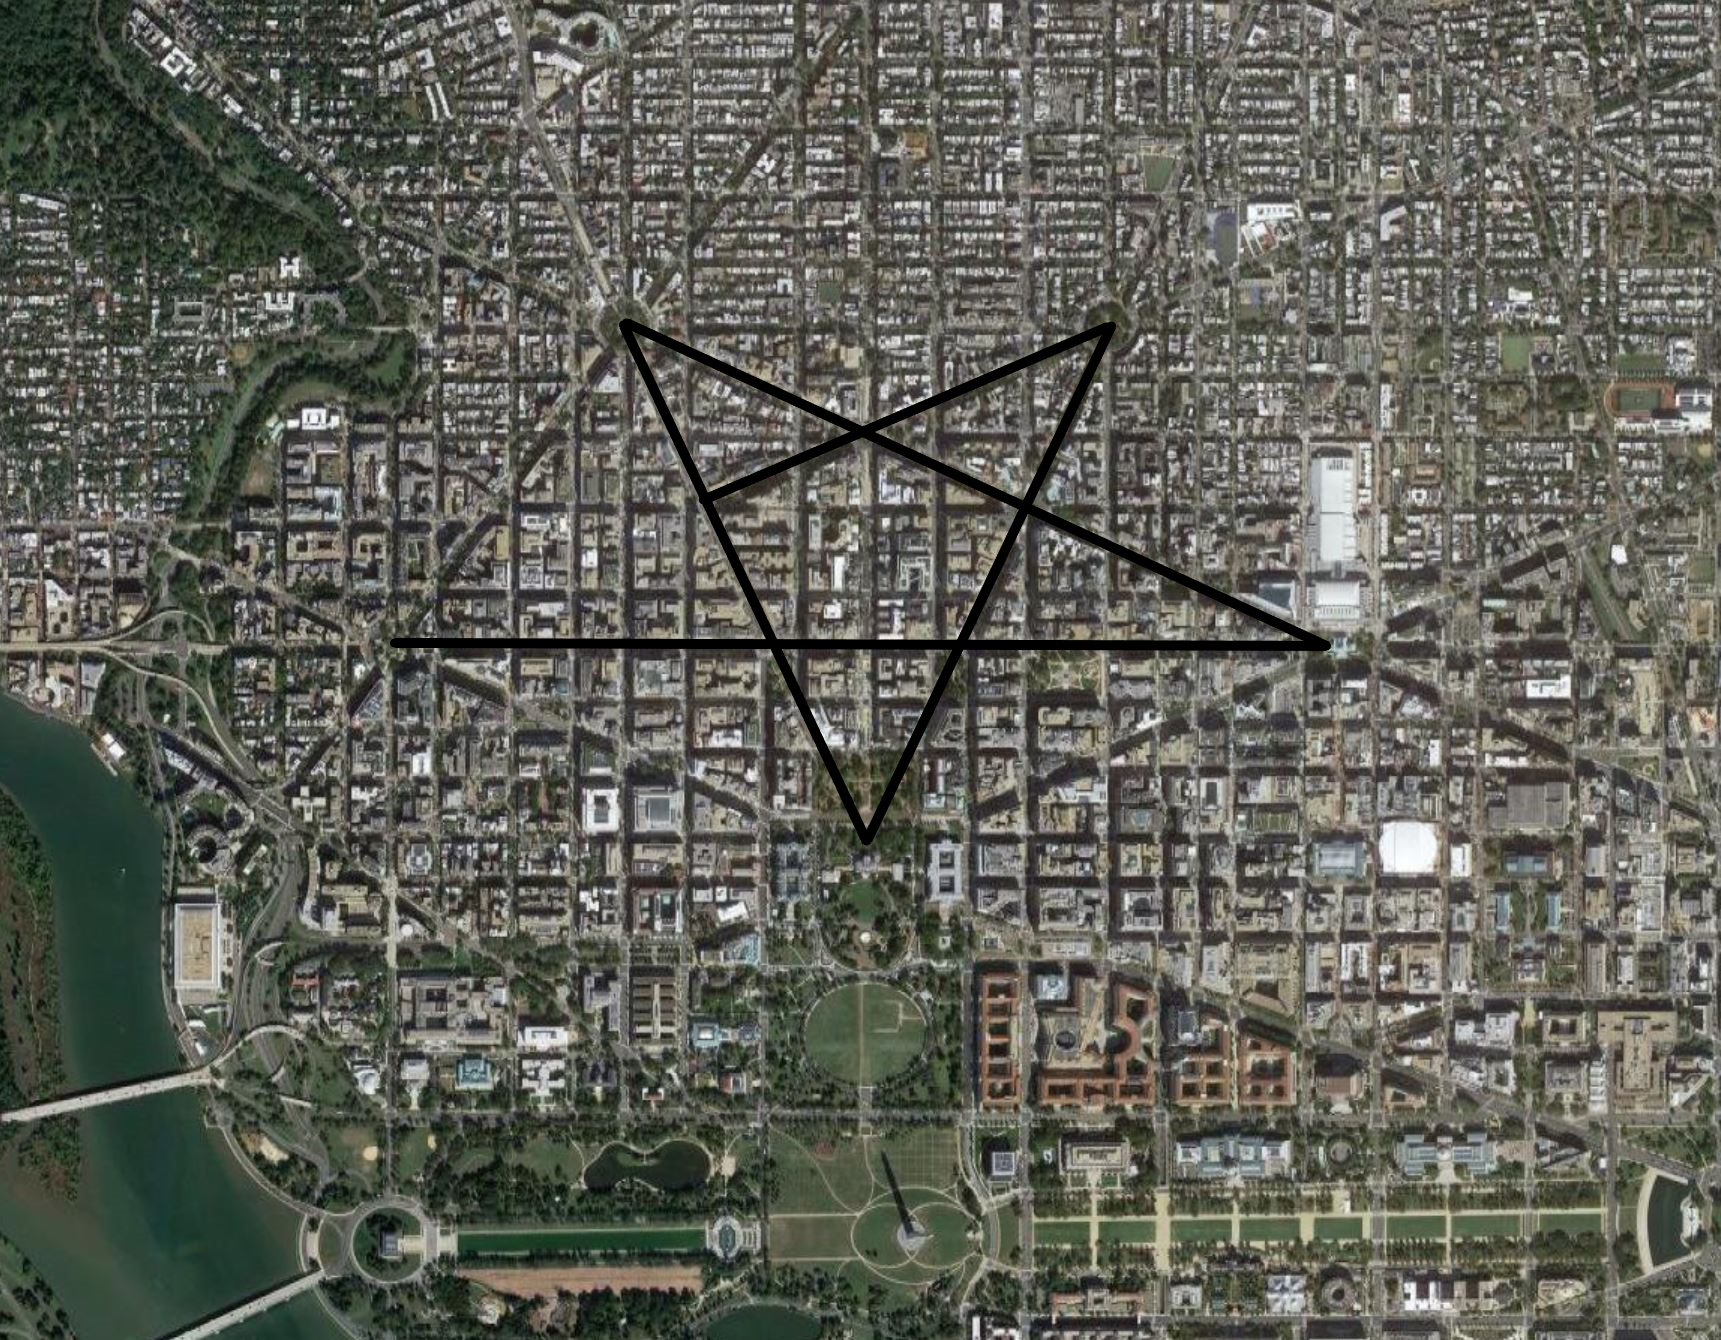
I remind you that Washington D.C. (himself a level 33 Freemason) was founded by level 33 Freemasons. Full of Roman architecture and the epicenter for idolatry in the United States. And yes, the bottom point converges on the door of the White House.
I say this not to be hateful to Jews. I wish the individual that can hear decides to opt out, hear the Gospel, and get saved to Jesus. But we know how almost impossible that is for Jews. They have been blinded by God for over 2000 years. And they were allowed to gather again in Israel not to be magically “saved” by seeing Jesus when he comes back (this is Satan’s biggest lie) but to be ground to powder by the cornerstone. Jesus Christ, the true Messiah.
Revelation chapters 2 and 3, Jesus calls those who call themselves Jews (hint: its the Jews), the “synagogue of Satan”.
Rev 2:9 I know thy works, and tribulation, and poverty, (but thou art rich) and I know the blasphemy of them which say they are Jews, and are not, but are the synagogue of Satan.
Just to make sure you know who will be doing again the persecuting he repeats himself in chapter 3. And just to make sure the reader is not confused he uses the word synagogue of which the only religion to worship in a synagogue is Jews. Jesus knew how to get the message across to us who understand.
9 Behold, I will make them of the synagogue of Satan, which say they are Jews, and are not, but do lie; behold, I will make them to come and worship before thy feet, and to know that I have loved thee.
Christians get the last laugh. For the wicked will be defeated and sent to Hell but not before being humiliated and in great torment. Hell has a special place reserved for this guy, CEO of Pfizer. He is an unsavable Reprobate child of the Devil. They all are. Or Merrick Garland who is torturing innocent people in Washington D.C. dungeon(s). Or that Jew from the CDC Walensky who pushes the jabs on innocent children. Or Chuck Shumer, Senate majority leader. Or Blinken, Secretary of State. Or Yellen, Secretary of the Treasury. All Jews by some weird coincidence!
And of course, the porn industry, Hollyweird, the music industry and most of the banking system.
It is all just because they work hard! Or some weird coincidence!? No, it’s bible prophecy coming true for the end times. Over 240 years in the making since America and Kabbalistic Freemasonry was founded. The march to the centralization of Jewish power has been a steady plan and we are nearing the “reveal”.
The destiny of Babylon USA is near:
NOVUS ORDO SECLORUM translates as “New Order of the Ages” and of course “E Pluribus Unum” as “Out of many, one”. The Egyptian pyramid and the Eye of Horus, or Lucifer if you prefer.
The Star of Remphan and its close cousin the Masonic symbol placed within.
Acts 7:43 where the first martyr of the bible, Stephen, is giving the sermon of the century to the Pharisee Jesus-hating Jews:
Yea, ye took up the tabernacle of Moloch, and the star of your god Remphan, figures which ye made to worship them: and I will carry you away beyond Babylon.
They stoned him to death afterwards if you know the story.
Or how about my favorite? Mr. Antichrist-in-the-running himself, yet another Jew unleashing his Satanic fury upon the world in which world leaders have pledged their fealty to him.
So, you can see the torment of the world at the hands of Jews has been well under way whether you see it or deny it. It is too late. But it was destined to happen this way. I sit back and am very relaxed. It’s popcorn time. When persecution comes, I’ll have to take it in stride and know that Jesus will reward me in the Resurrection.
There will be plenty of non-Jews and non-Freemasons also persecuting Christians. However, it is the Freemasons, who also have a “temple” in every small town of America proudly displaying the Star of Remphan (aka “Star of David”) who will be manning the guillotines. The Antichrist will be believable to them. God casts a great delusion to “seal the deal” once the Abominations of Desolations happens. It has been all foretold.
But hey, that’s the fate of Christianity and we have ourselves to blame. Listening to the lies of Satan and yoking ourselves with wicked Judaism was about the worst thing we could have done. But it all makes sense for the end times that the bible so succinctly lays out. Most Christians (at least in America) believe in the “pre-trib’ rapture (there is a rapture, but we’ll have to face the Antichrist first). Well, it’s the second greatest lie of Satan. He has been preparing the world for over 2 centuries, since the founding of the United States.
We only ponder the timing.
THE COUNTS
And timing we do ponder. And global war. The November weather window for a cross-strait invasion of Taiwan is slowly closing.
An interesting article I read today about how XI has consolidated power and put the Chinese government on a war footing.
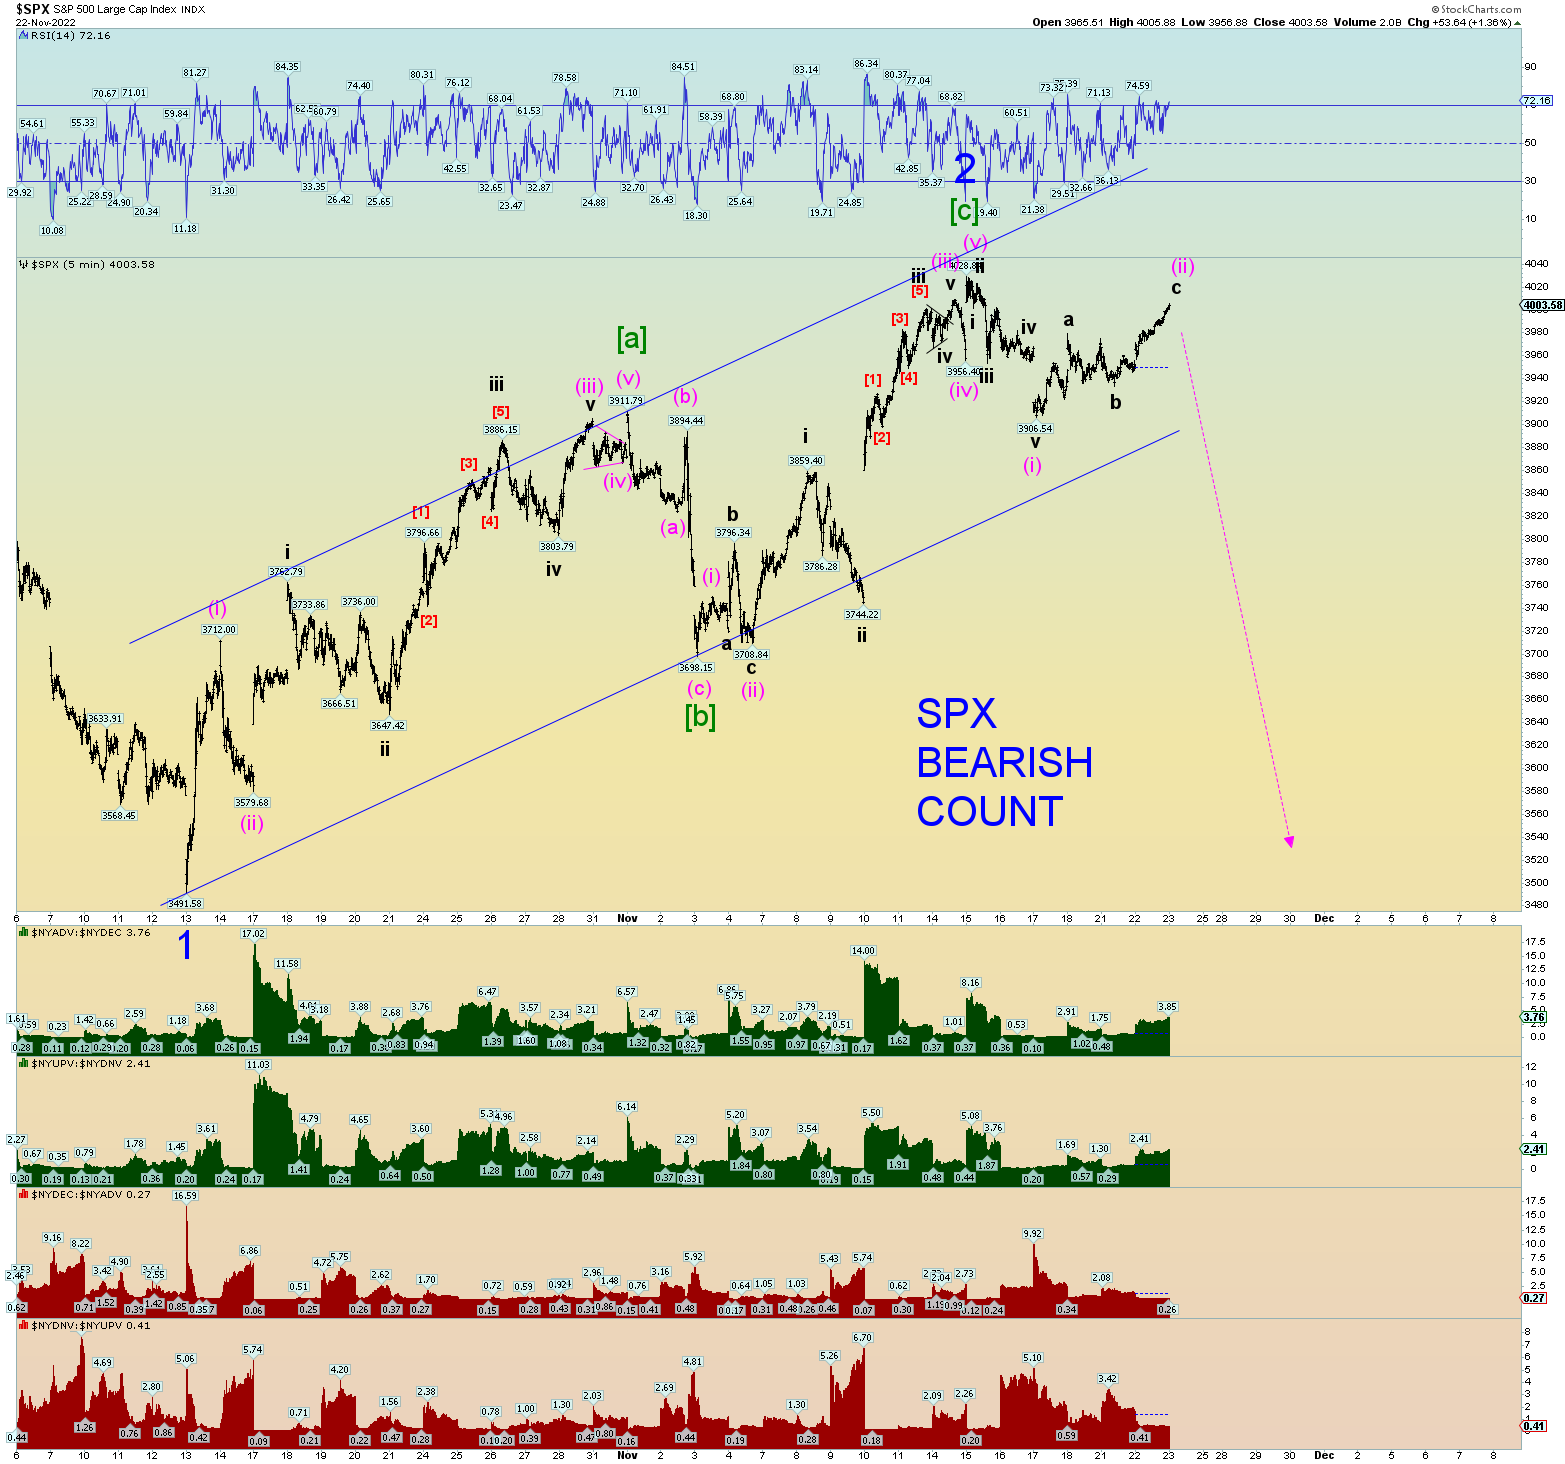
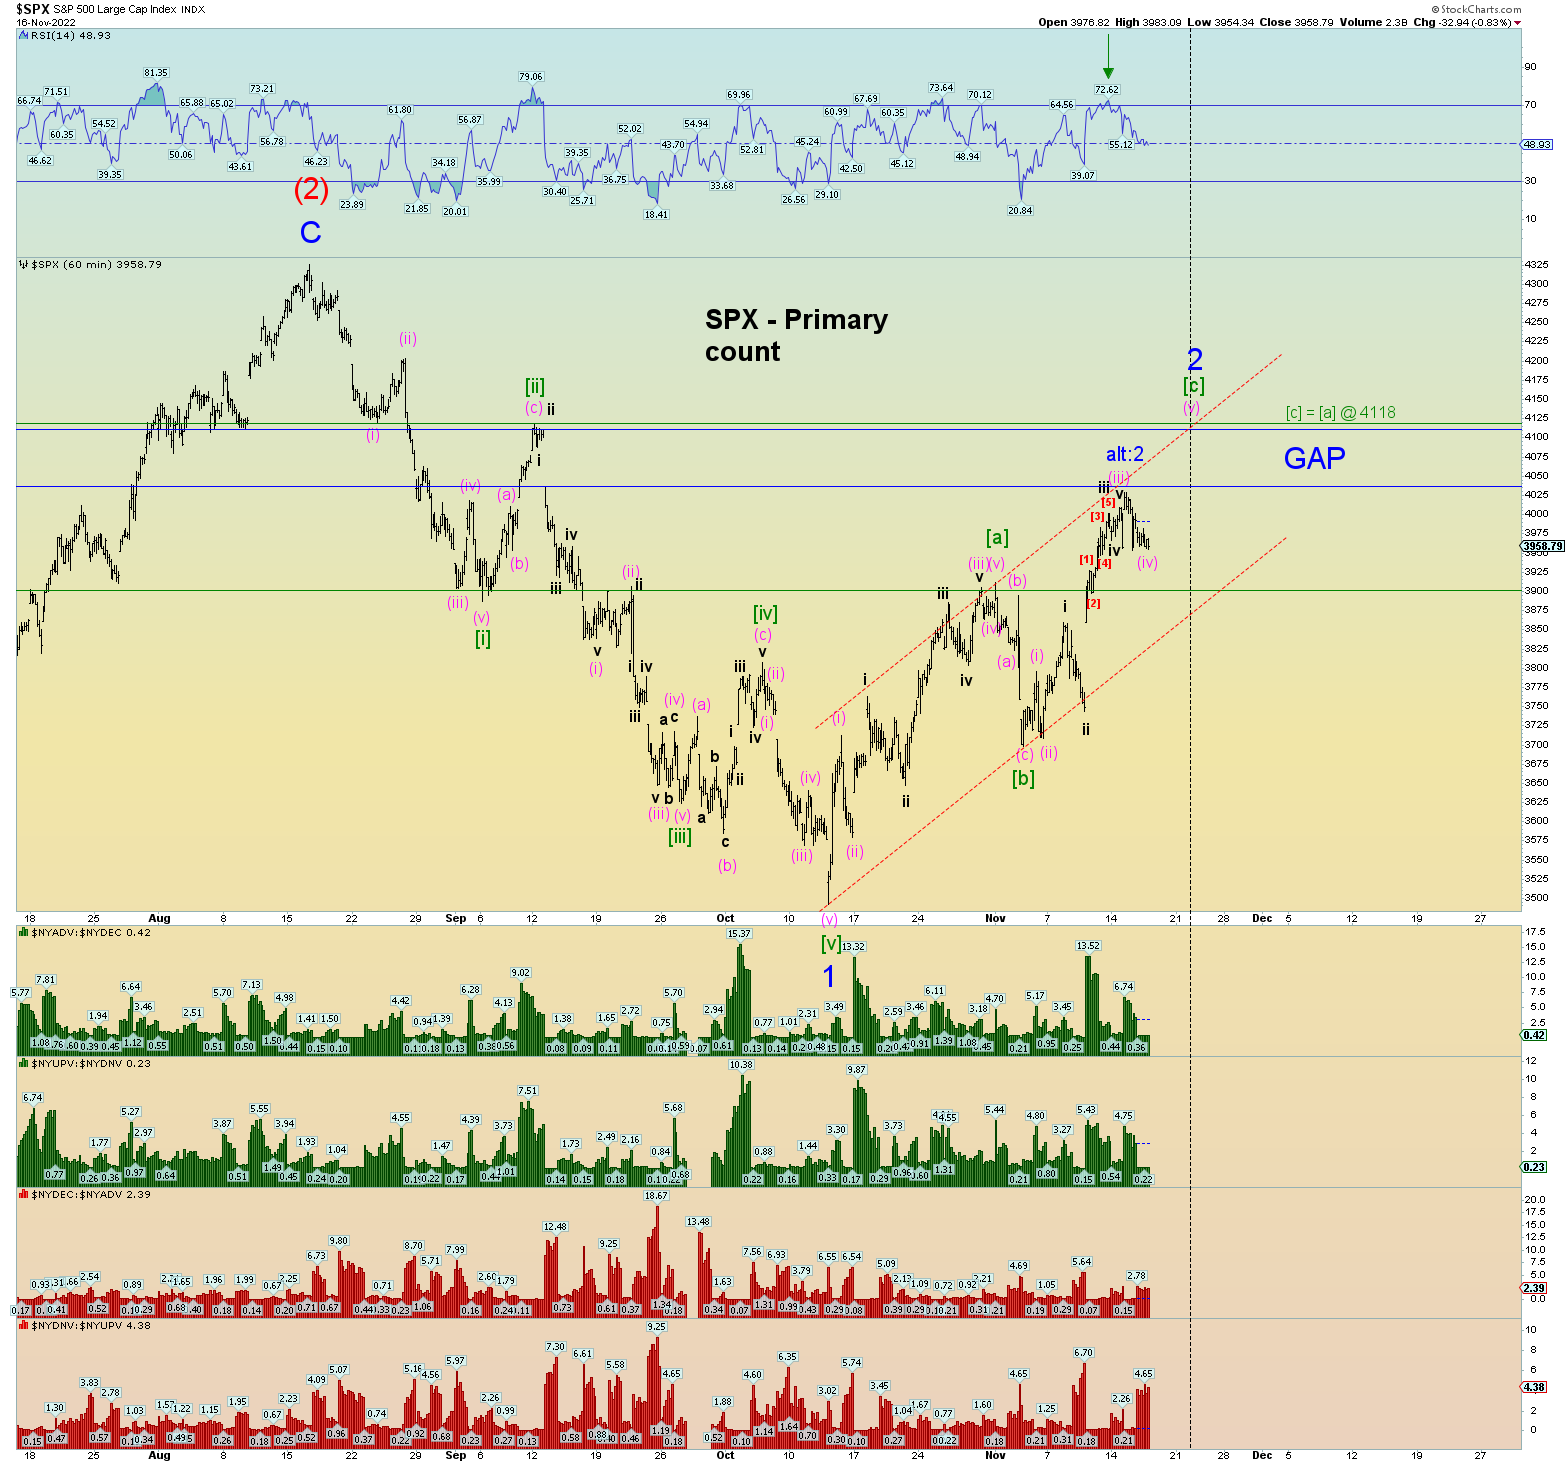
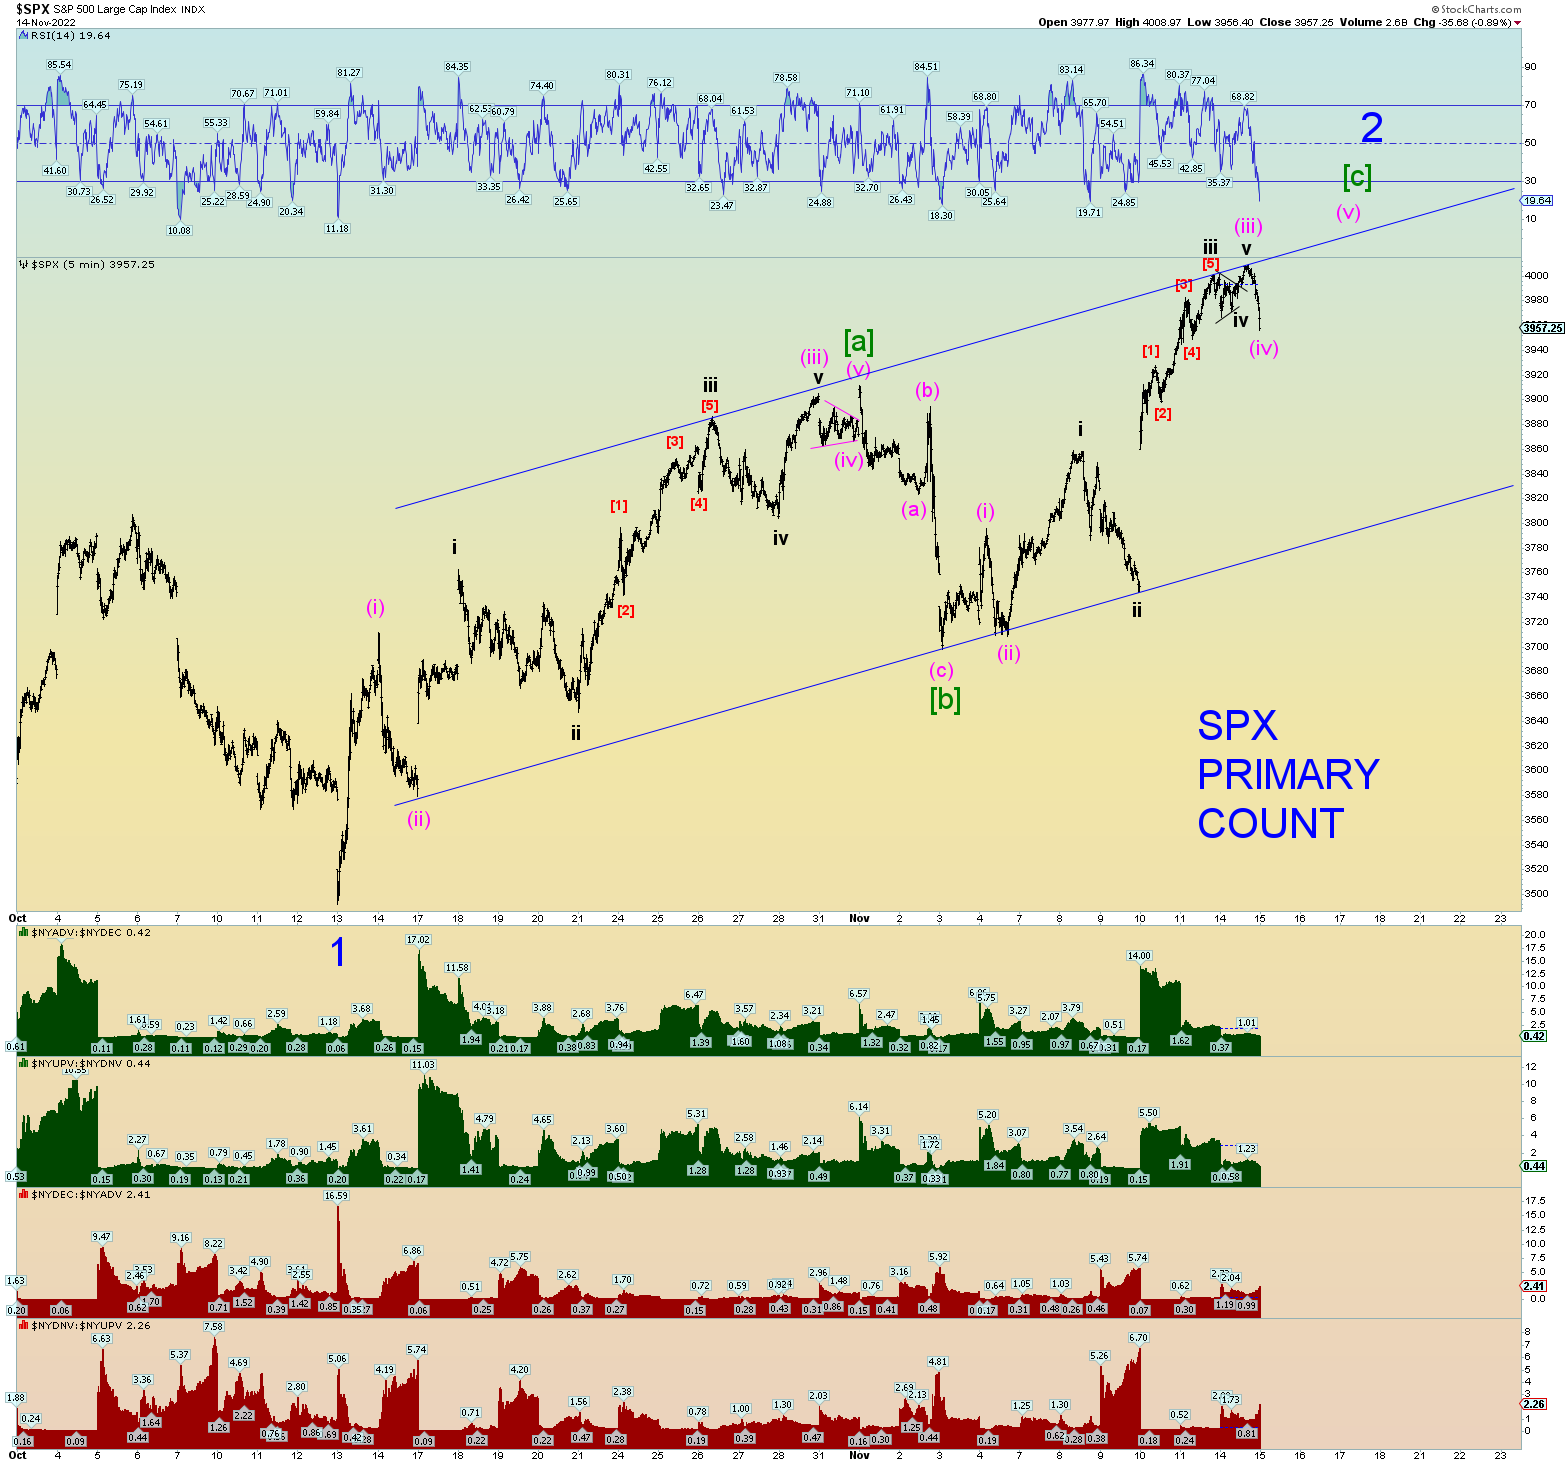
Huge open up day Monday is the call: wave iii of (v) of [c] of 2 of (3) [fixed]. Then a gap up peak on Tuesday to complete Minor 2 above 4100 and then the real selling begins.
The purpose: to close the huge open chart gap down.
We must still assume the SPX challenges the huge open chart gap just above it. The count seems to be missing a squiggle or two.
I will say there are enough waves to consider Minor 2 over, but again, probably need to be patient a bit more.
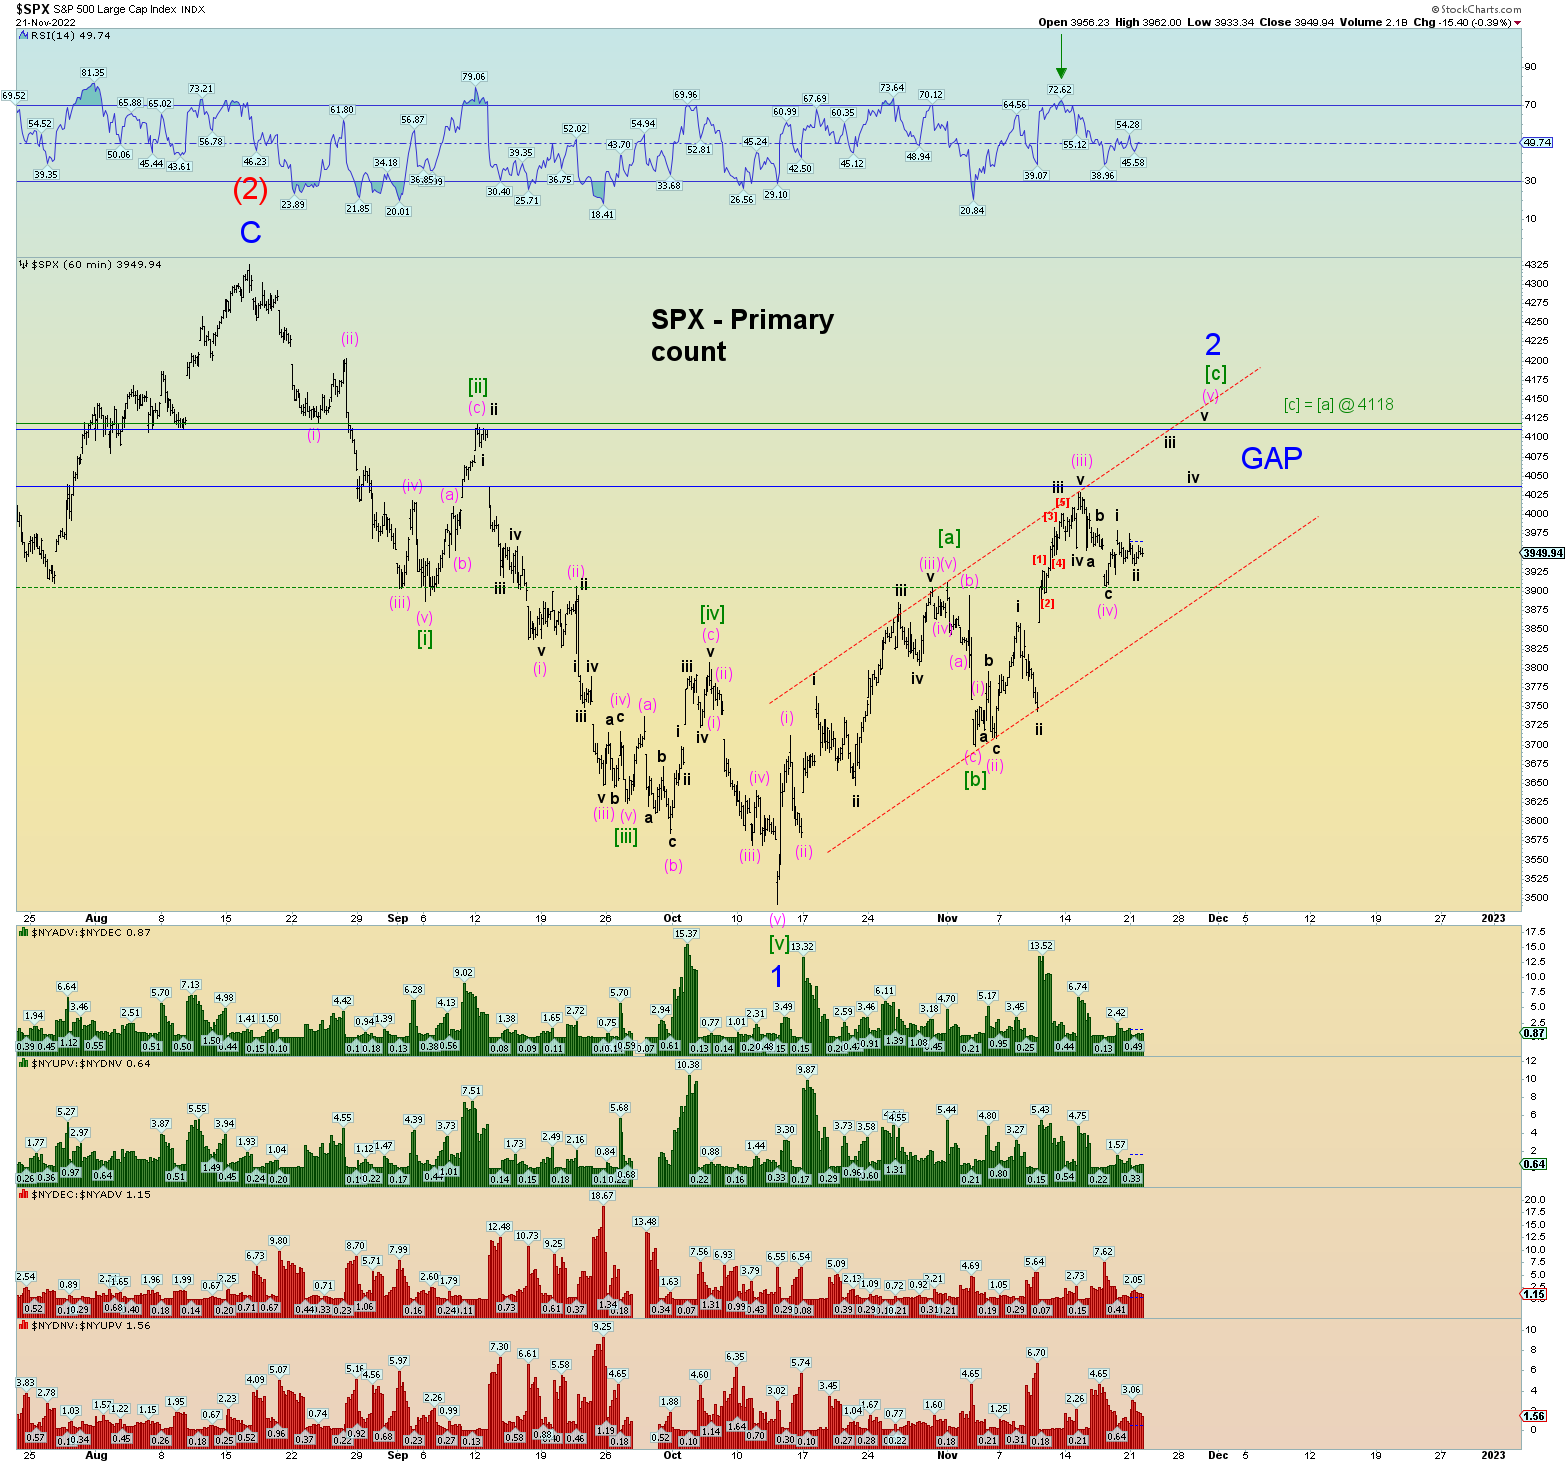
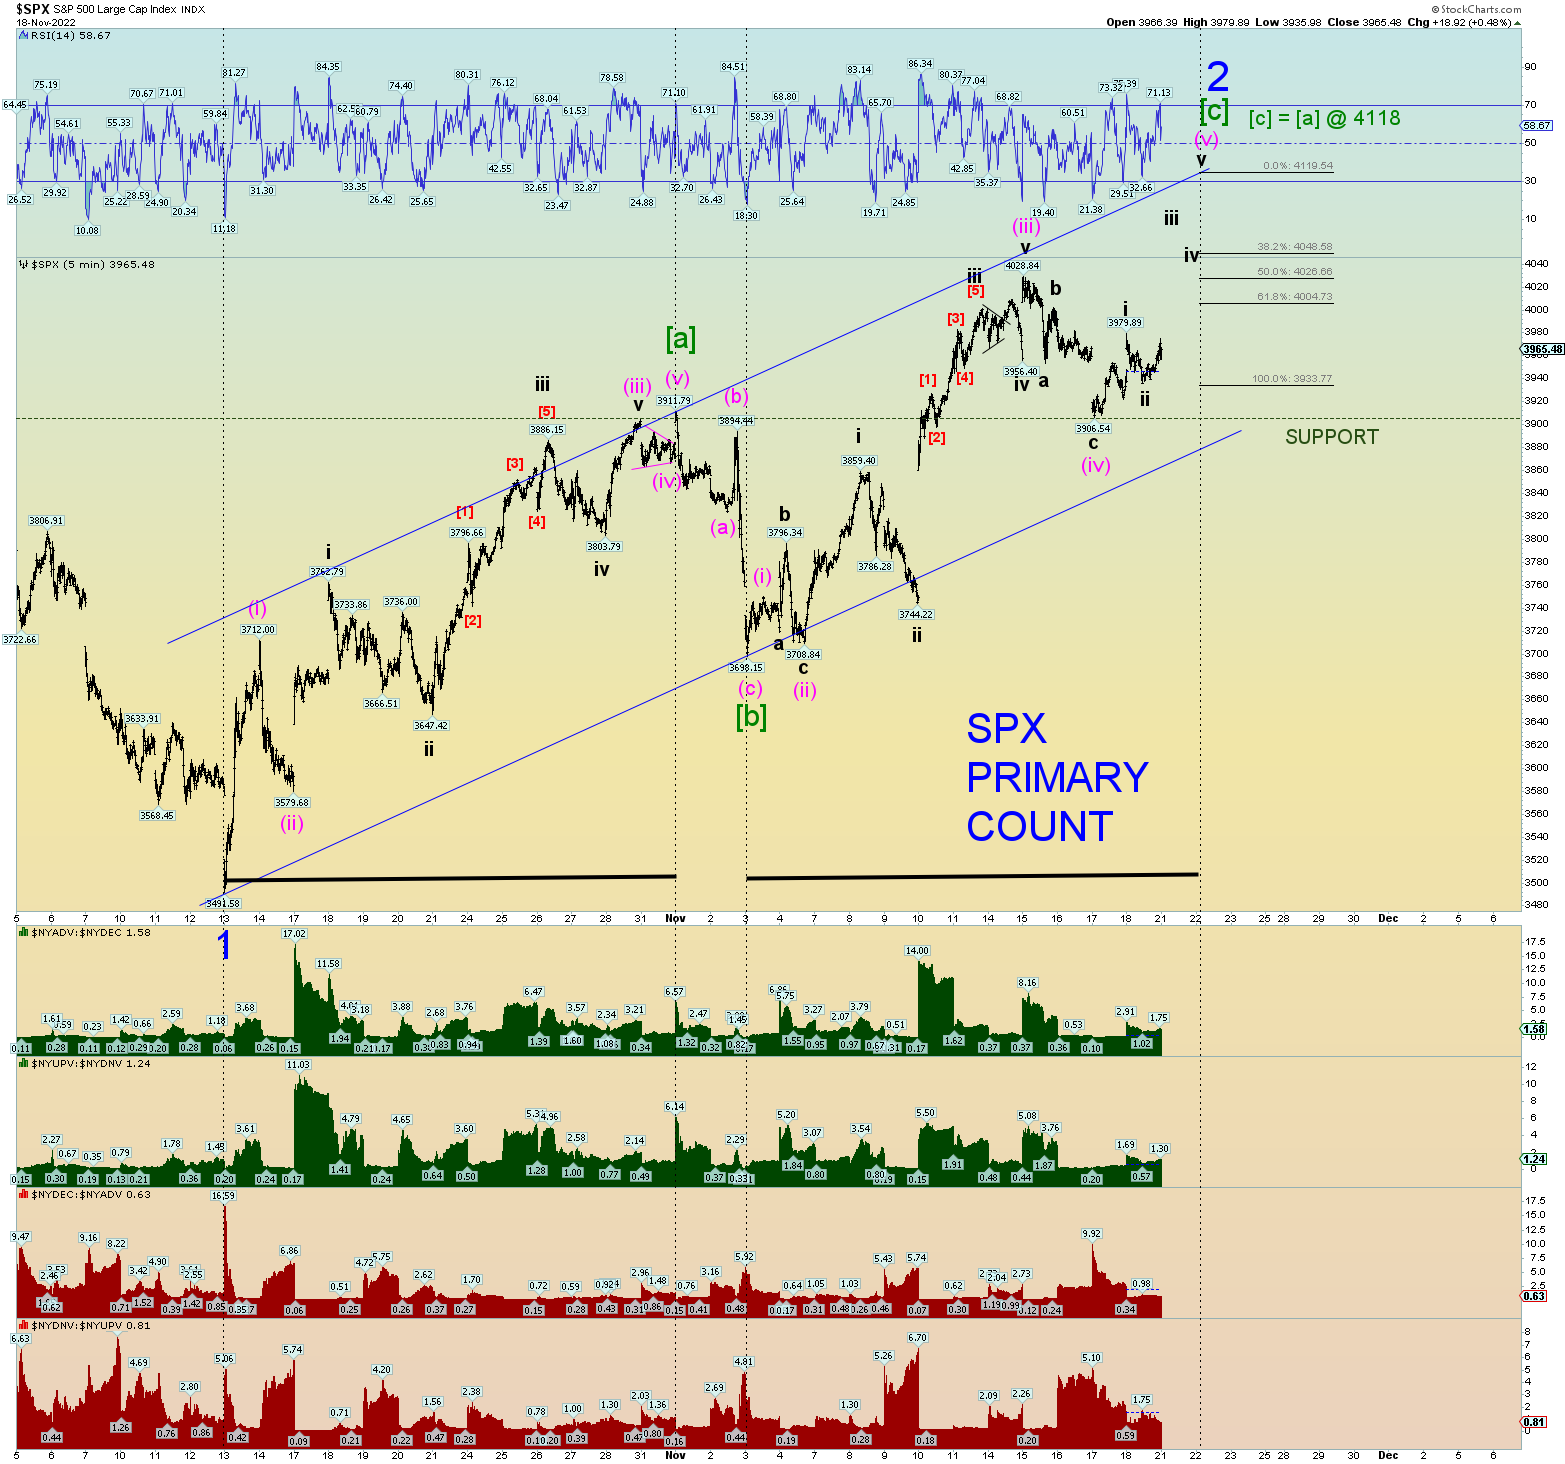
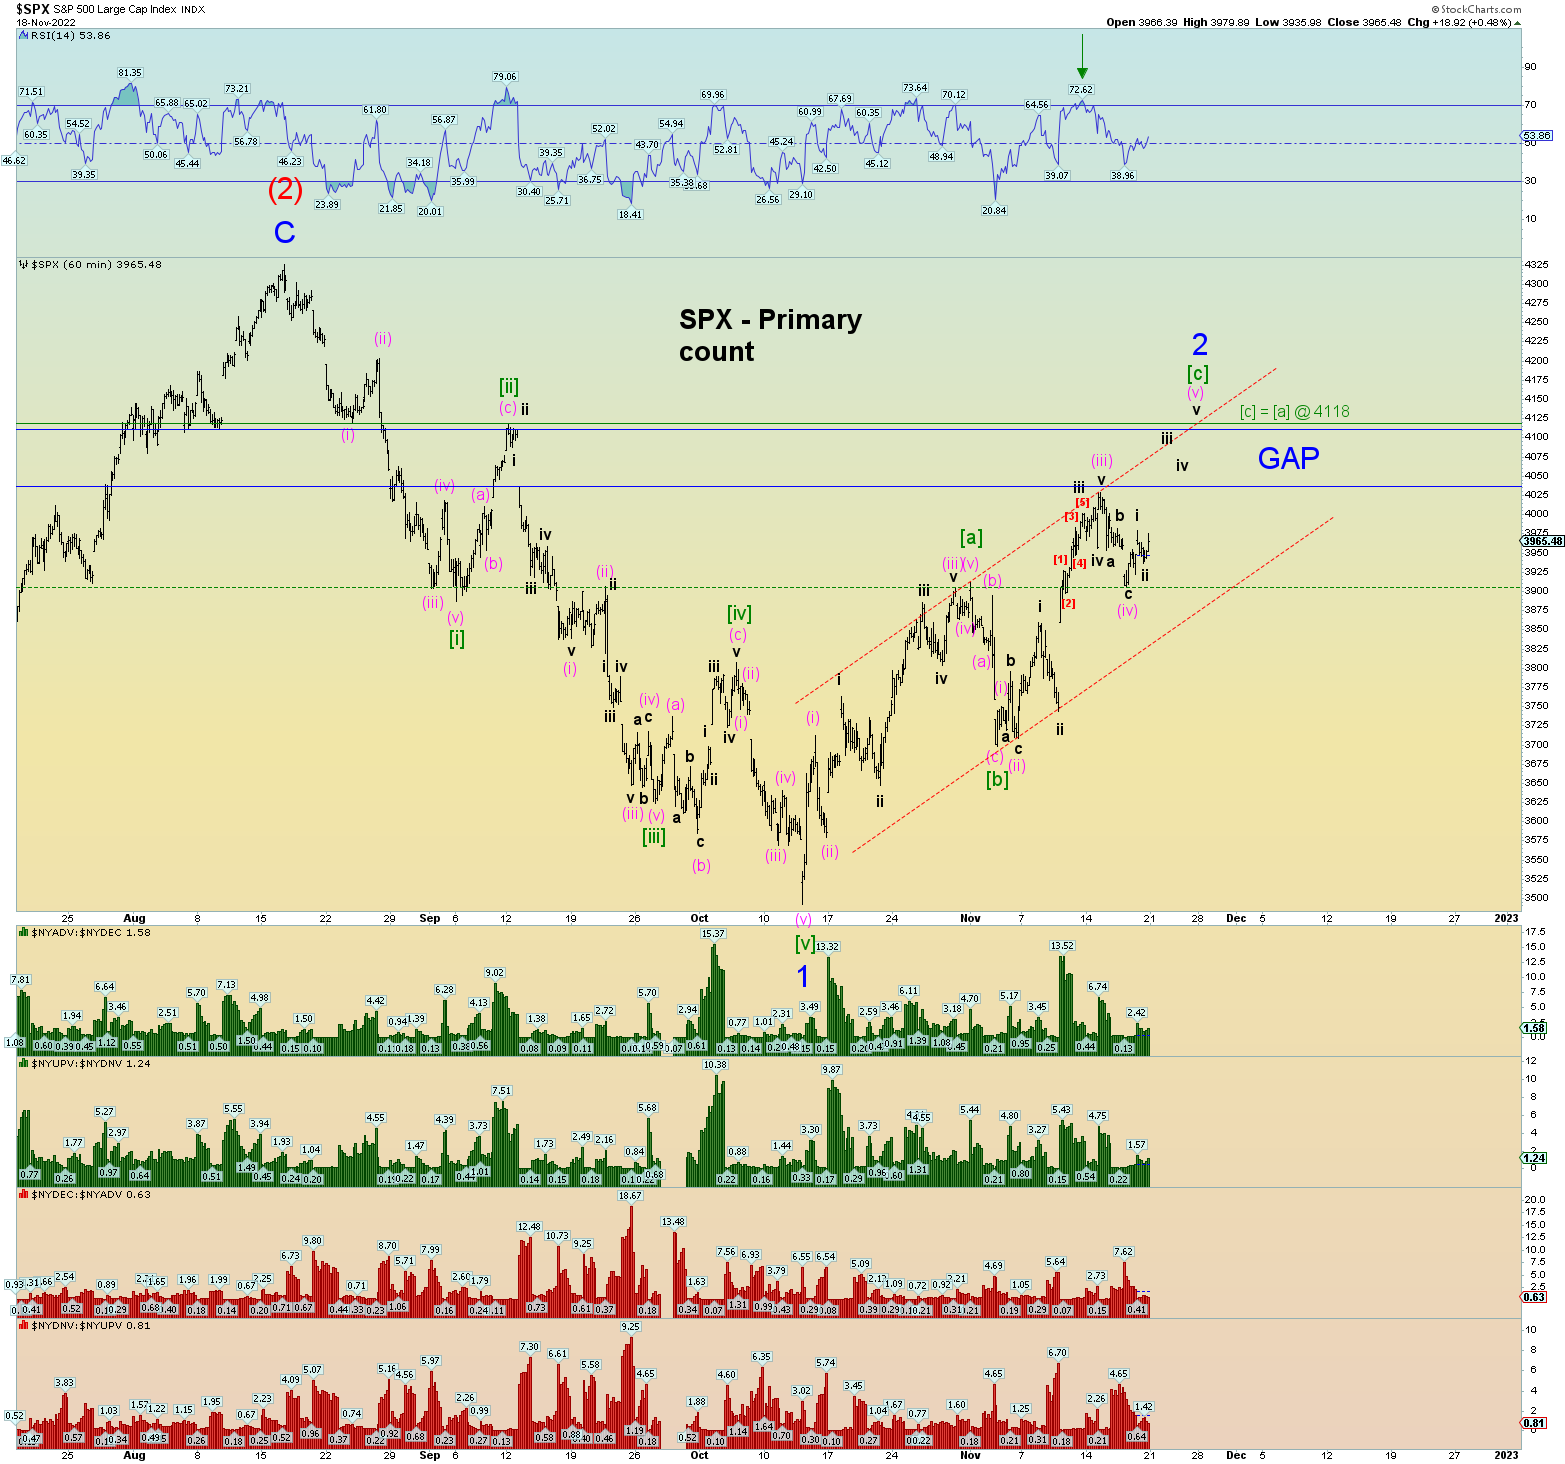
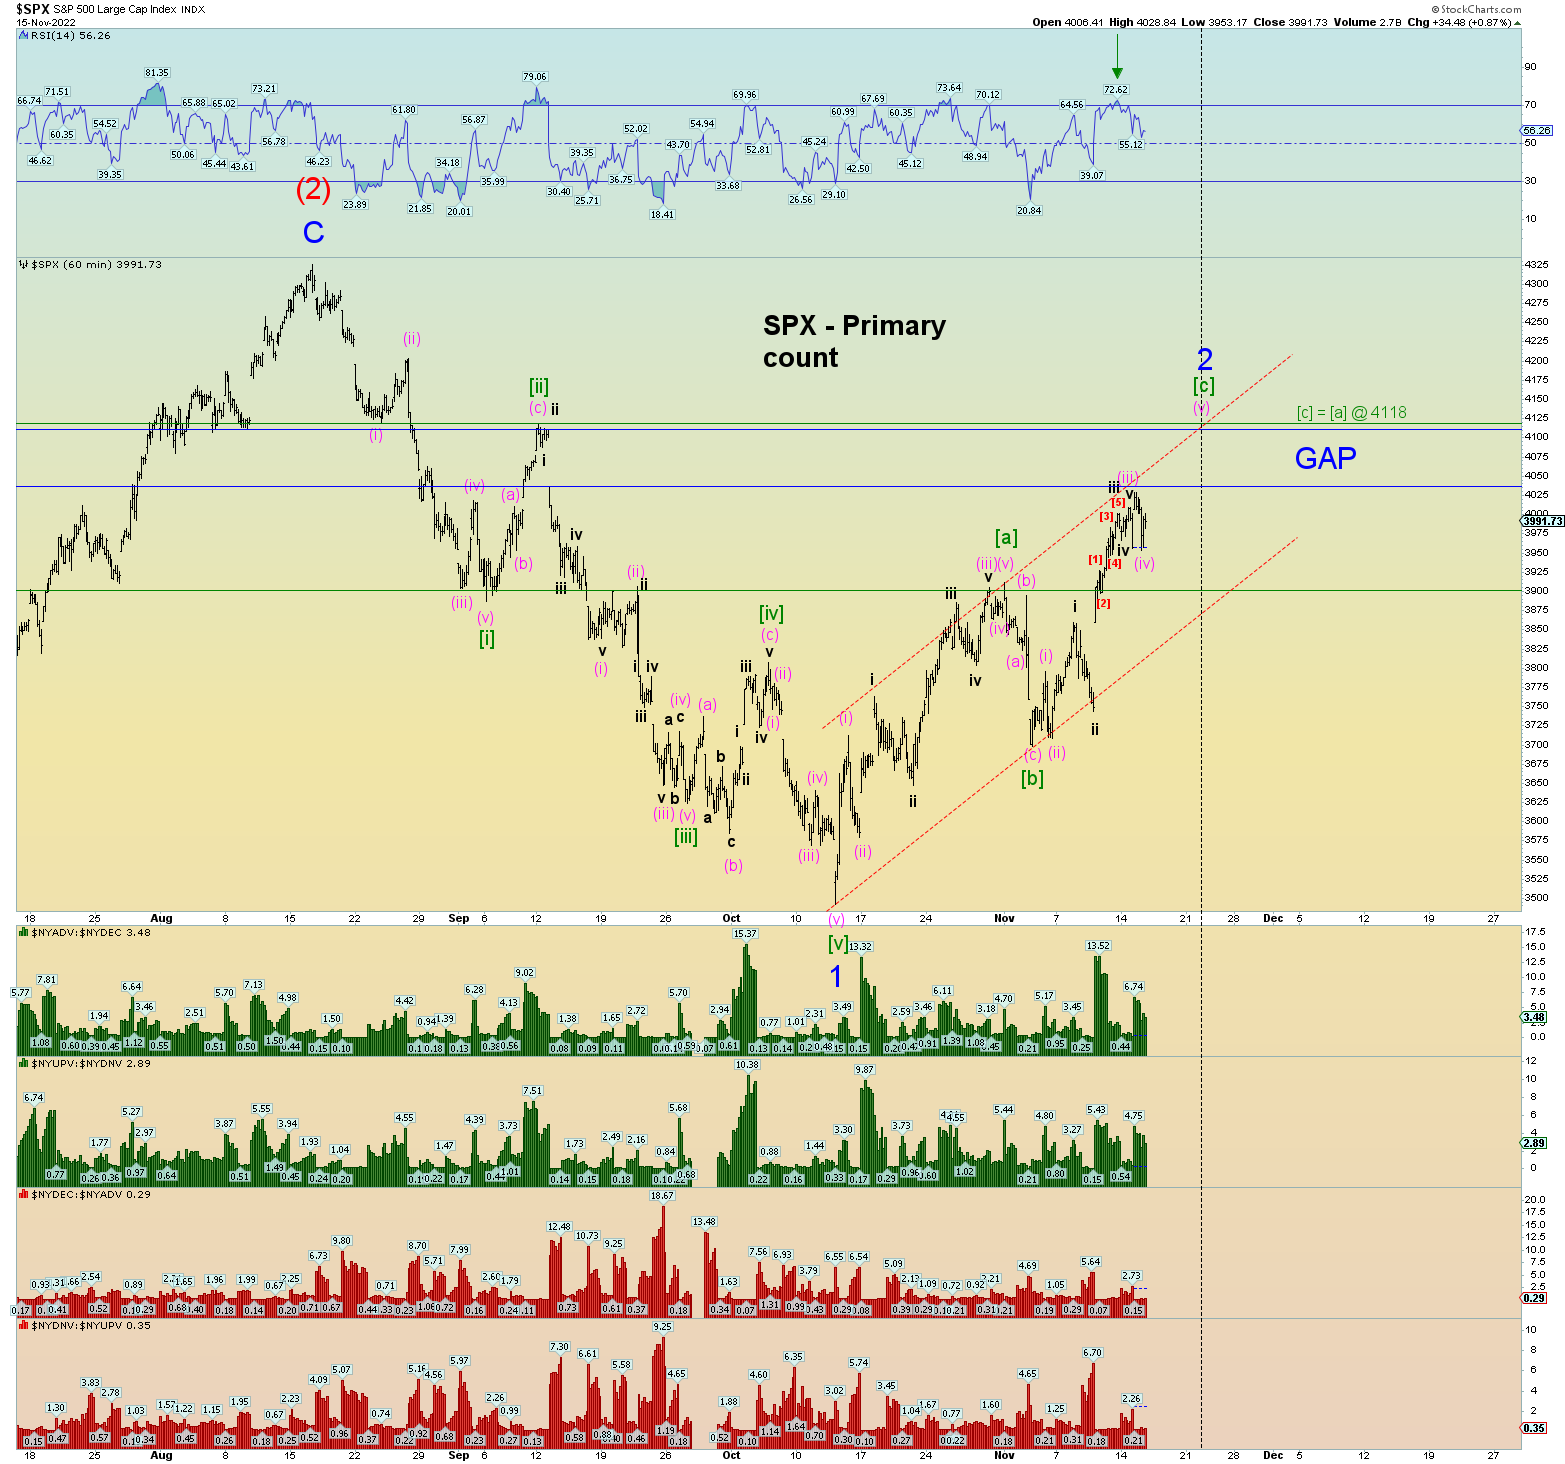
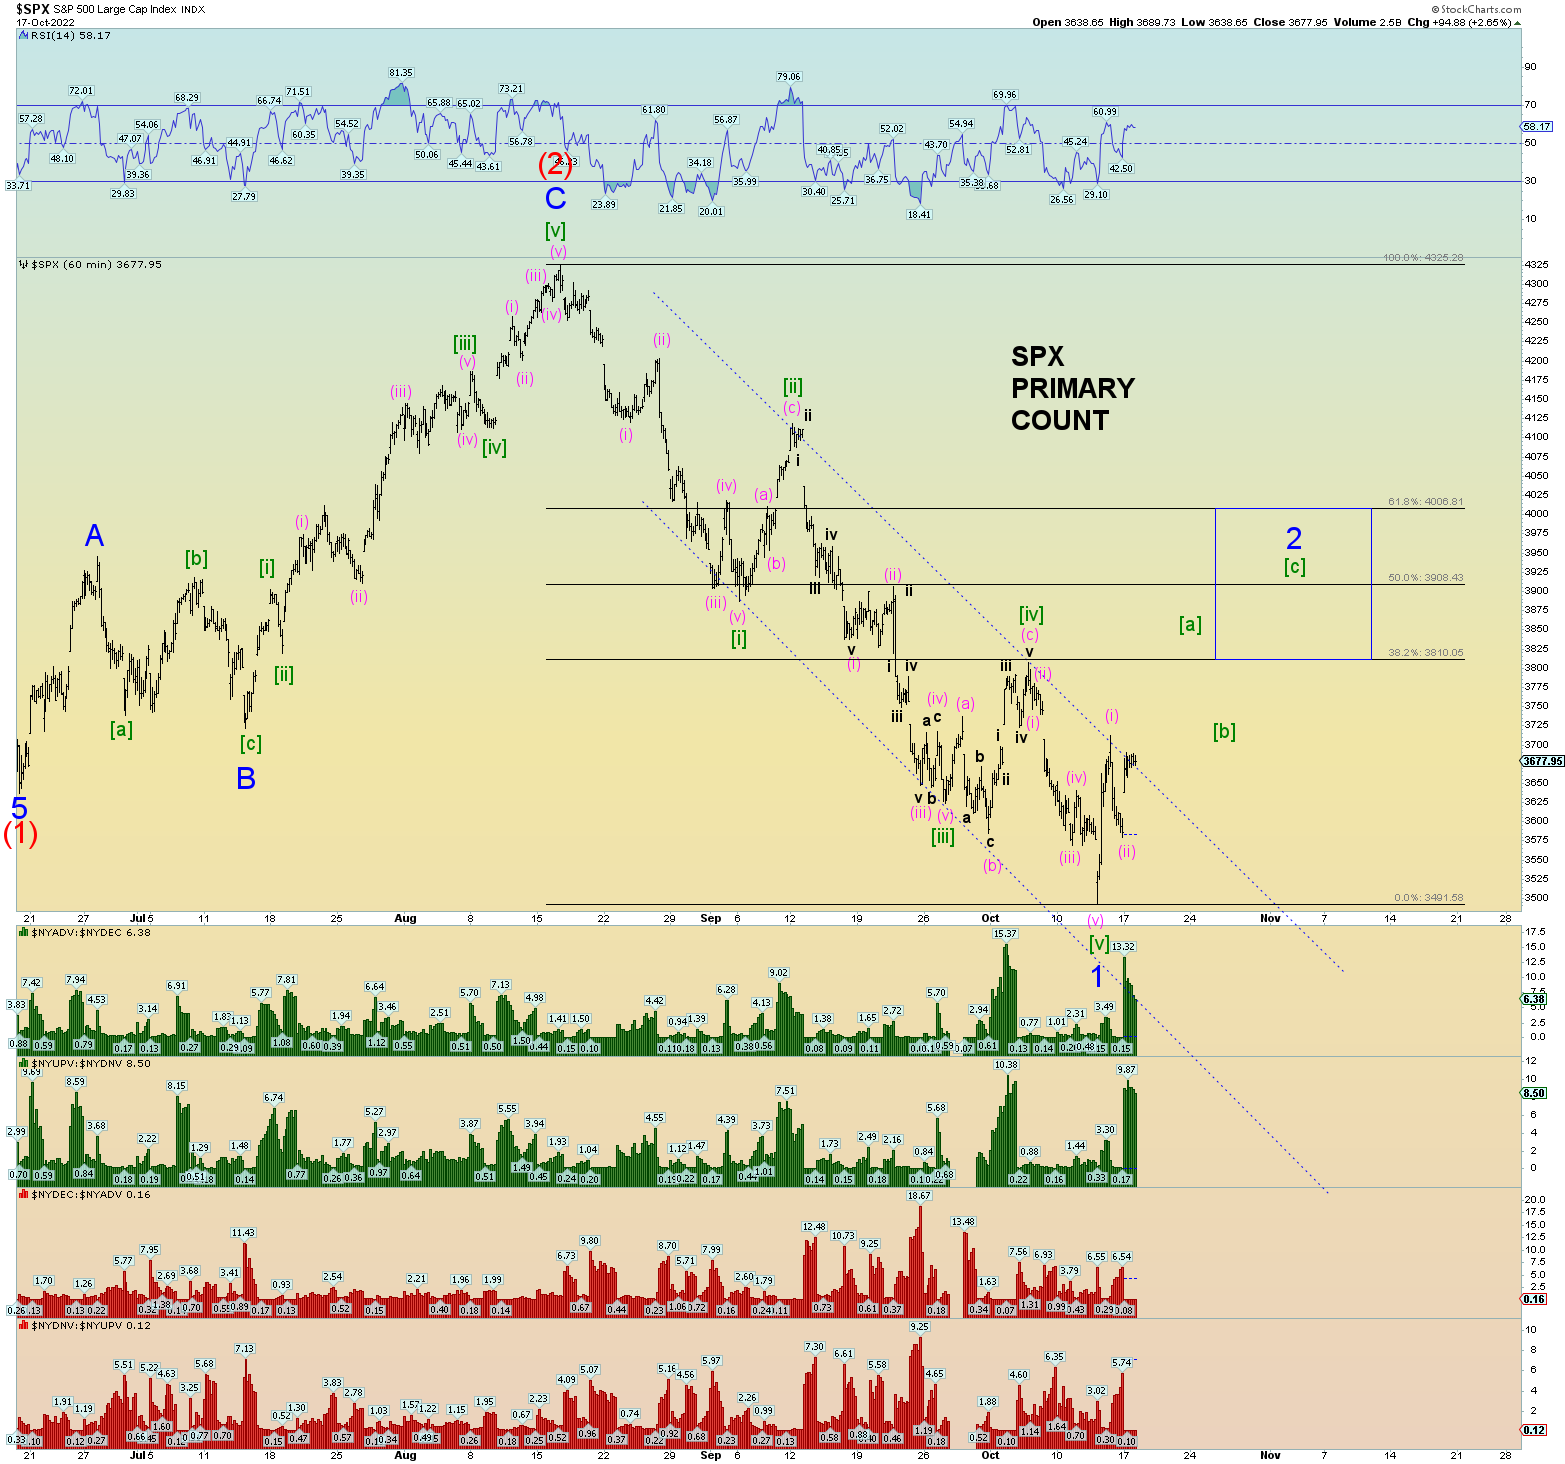
Wave [c] would equal wave [a] in both time and price possibly Tuesday’s opening bell on the 22nd Of November. But as you can see, the entire Minor 2 wave structure can only – at least at this time, be counted on the whole as an [a]-[b]-[c] corrective wave upwards. The channeling is that of a classic 5-3-5 zigzag.
The hourly chart shows the price/time relationship if wave [c] = [a] in both. 4118 would close the open gap fully. I know this is pushing things, but I generally pushed things with the count down to a Minor 1 low back in early October and the patience proved true. A further price rise through the gap will absolutely crush any remaining bears and get retail back fully on board. Just in time of course.
Maybe we need a DOW theory non-confirmation. Keeping an eye on it. Need another wave up on the DJIA to finish [v] of C of (2).
The only blip in the primary counts is that the weekly has a significant positive RSI divergence and for it to “play out” prices would go above where we have Minor 4 marked on this chart and thus making the SPX and Wilshire counts the exact count as we have the DJIA in as shown above. This implies Intermediate wave (2) would likely back test the red trendline (again) and time-wise would probably take until mid-January, minimum, 2023 or possibly longer. We have to be prepared for this possibility.
But first things first. The S&P hasn’t even broken into its open chart gap down yet.
Again, the size of the waves are huge yes?
Here is that same chart literally zoomed in. If the weekly positive RSI divergence was to fully develop, that implies prices are going above where Minor 4 is marked just as the DJIA is close to doing breaking above its previous pivot high. And that would take some time I suppose although it sure didn’t take much time for the DOW.
Anyways, this technical aspect of weekly positive divergence has been on my mind, and this would be the likely result if it played out fully.
The entire structure is a “classis” opening move leading expanding diagonal triangle, and it is hard to ignore. The overlapping deep retraced waves along with expanding megaphone shape is a huge structure. And if it pans out to be accurate in that it is a wave (1) – or even just wave (A) of something else down, the wave (3) or wave (C) will be a spectacular downfall.
We would just have to patiently wait for it though.
What would spark this “news-wise”? What would be the market’s excuse? I suppose a temporary cease-fire deal in the Ukraine war where 2 weary armies sit things out for the winter.
In our simplified EW count of the SPX, the count allows for another small wave higher. It doesn’t have to happen there are enough waves in place. Additionally, the “time and price” factor of Minor wave 2 retrace is ideal as it is.
The 61.% Fib (from Intermediate wave (2) peak) and Veterans Day of the 11th give or take a few days seemed doable. And so, it has. We have double Fib resistance along with SPX 4000 resistance. It seems a “foregone” conclusion that the SPX will close that massive open chart gap down that lies just above, but sometimes if that’s what everyone expects, then the opposite happens. Or at least the pathing to get there is not a direct route.
Despite what others are saying, last week was not a “breadth event” as I like to say. In fact, last Friday’s data shows divergence and I don’t have today’s data, but it will show even more divergence tomorrow. Basically, today could have been Minor 2 high occurring on decent negative breadth day.
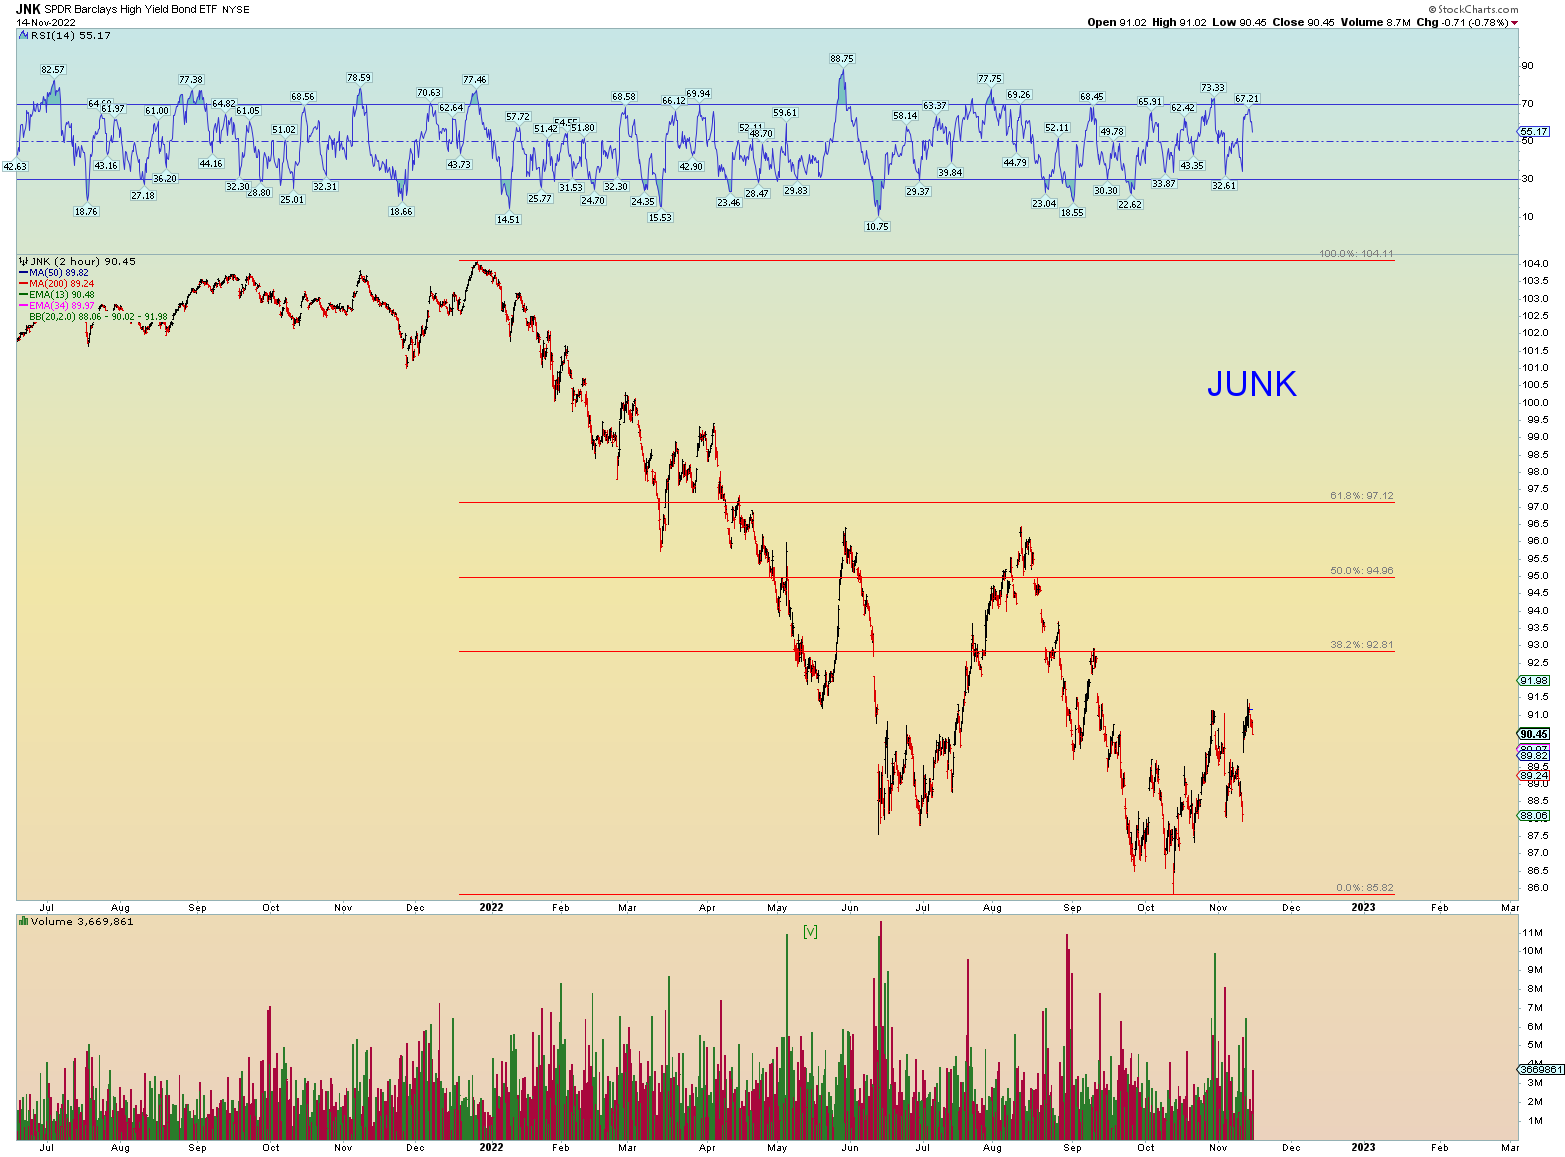
JUNK is lagging. Still a risk-averse market.
The DJIA is trying to mask the overall rot that exists underneath on the market as a whole. The size of the waves is huge compared to what came before. In my estimation a huge beginning set of waves to a bear market could indicate that the overall collapse will be prolonged and deep. And of course, I am predicting the end of the world as we know so yeah, there ya go.


