POTENTIAL TRADING IDEA ALERT!
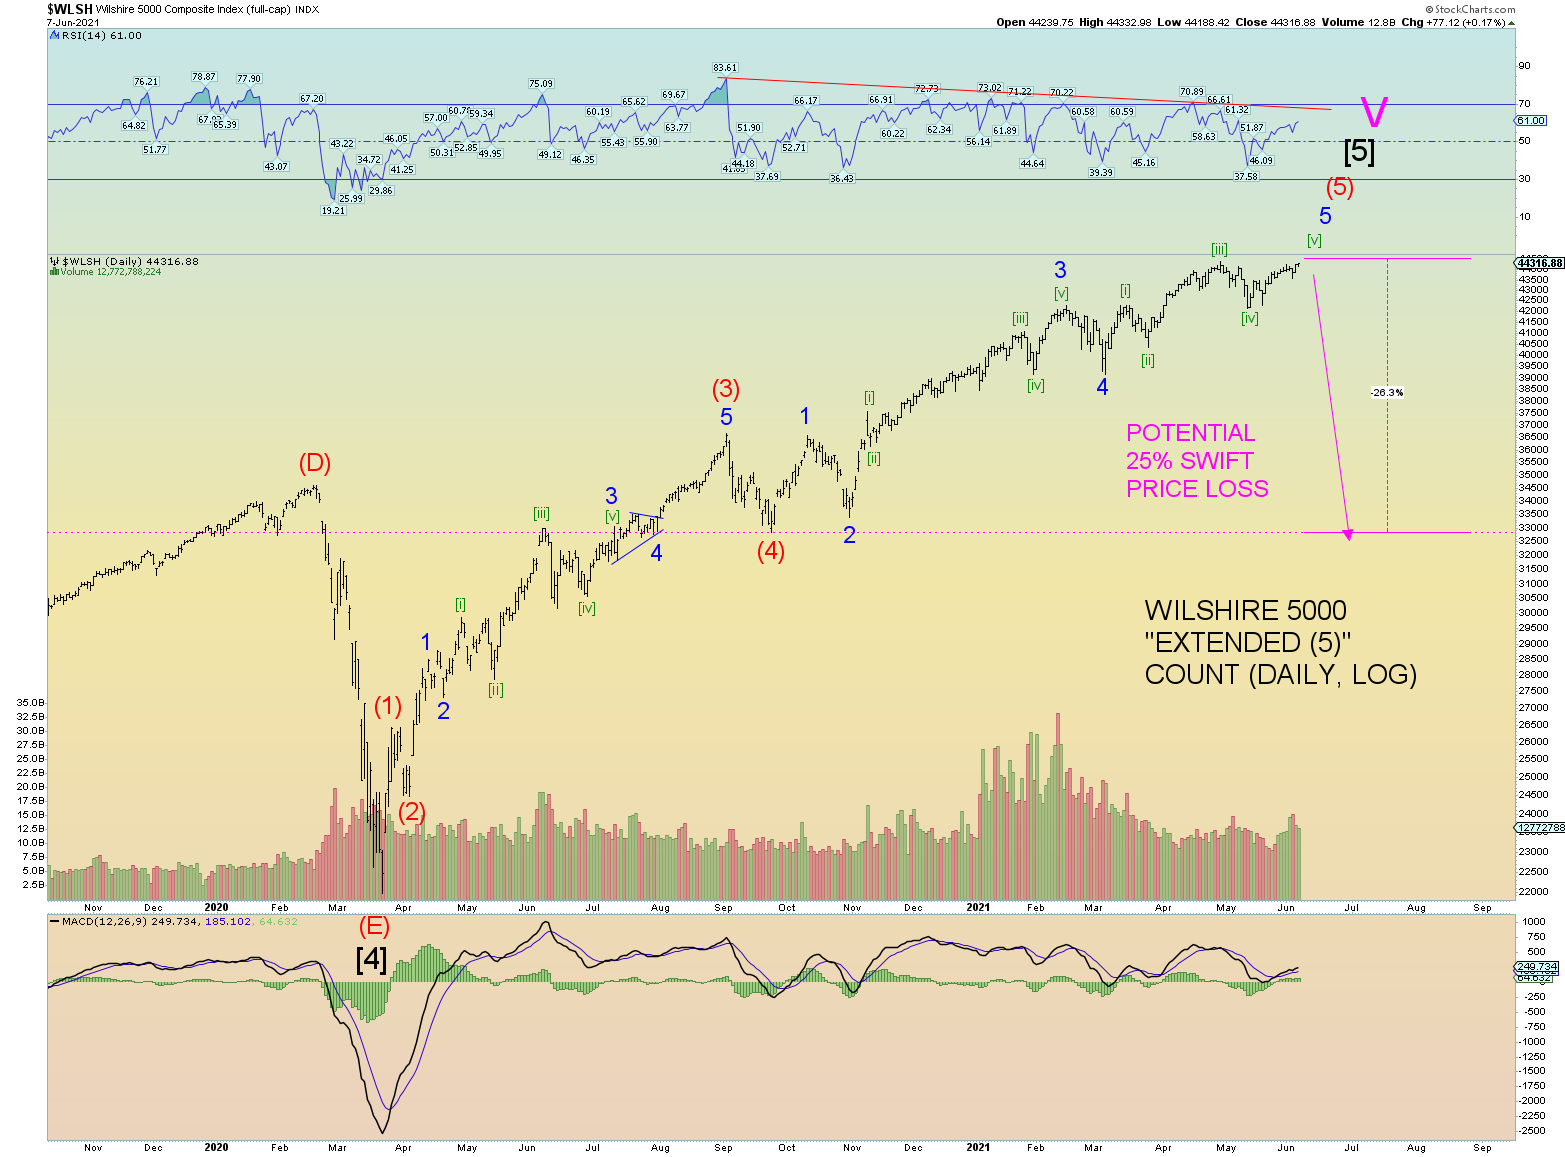
This is a RARE opportunity to catch a perfect SHORT ENTRY into the market. This is based on the strong Elliott Wave guideline that the market may be in an extended Intermediate wave (5) of some magnitude and is considered an “exhaustive” move. Therefore subsequent price reversal will SWIFTLY retrace in price the entire wave (5) often ending BENEATH the start of wave.
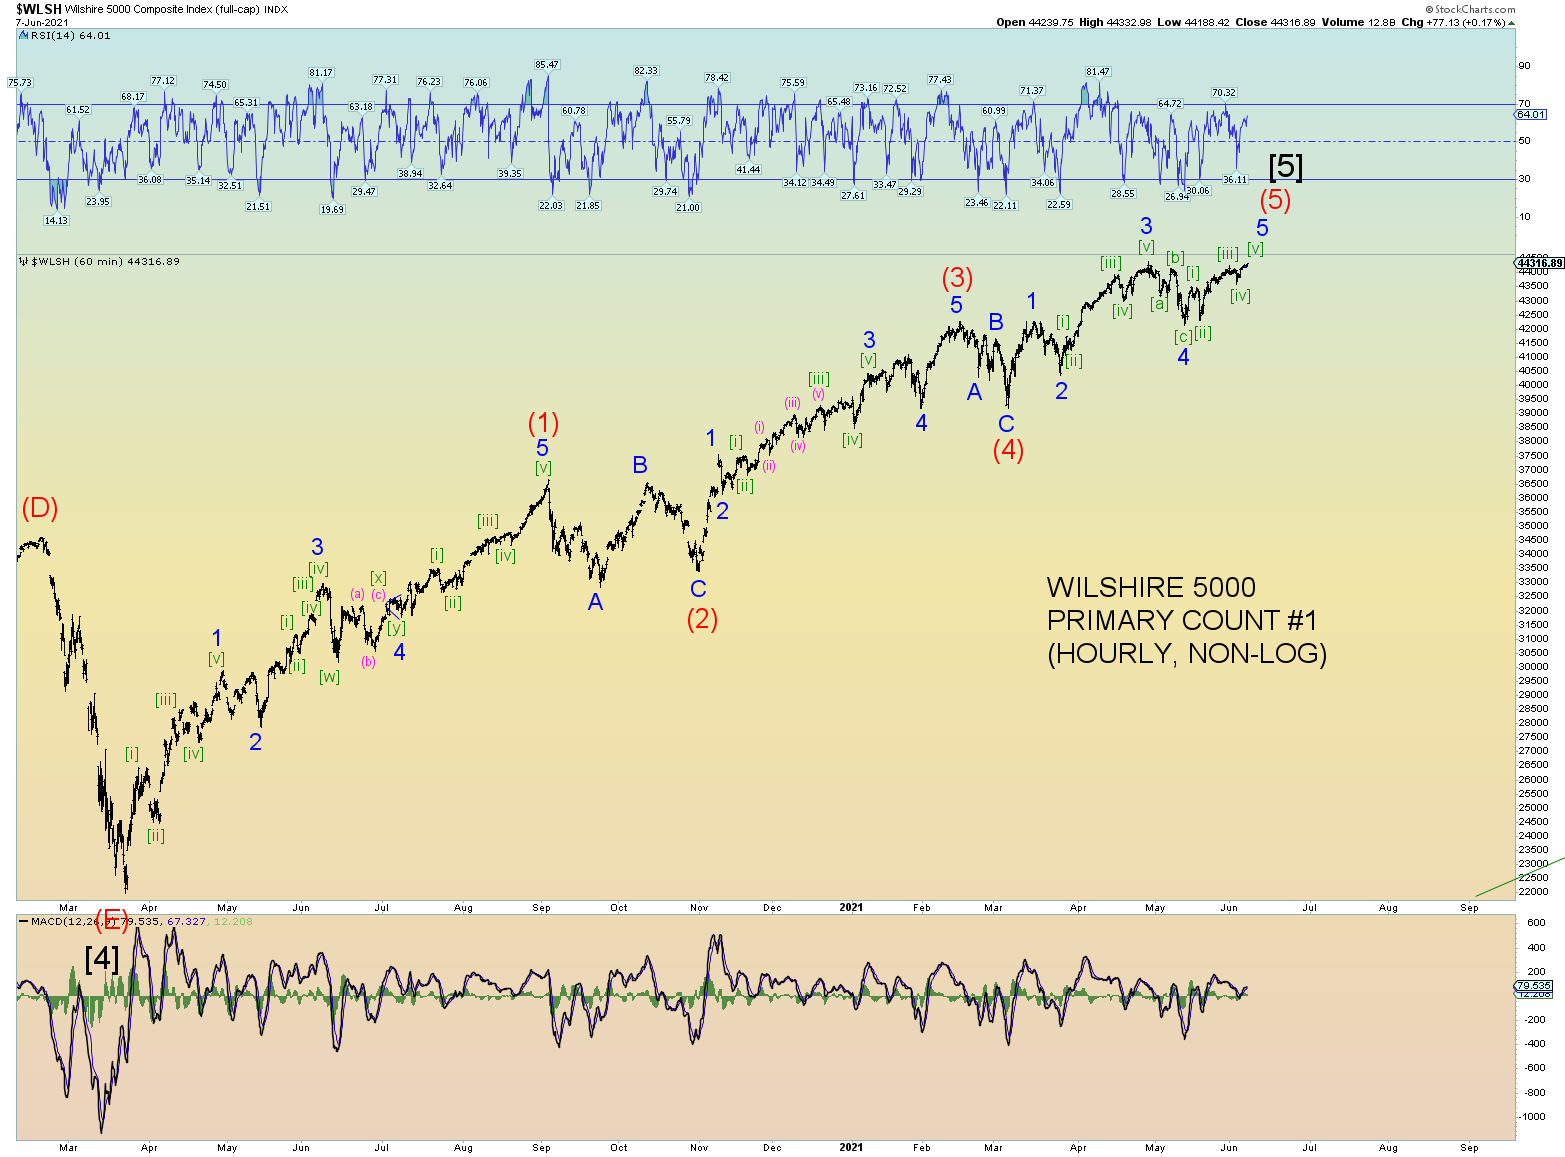
In other words, you take the short entry and have “diamond hands” and watch prices drop like a rock – to the Earth, baby! It is kind of like a 1987 crash situation. And in this case, the drop will be perhaps more intense and swifter than the March 2020 “crash”. For instance, I can count the Wilshire 5000 itself in this 5th wave pattern.
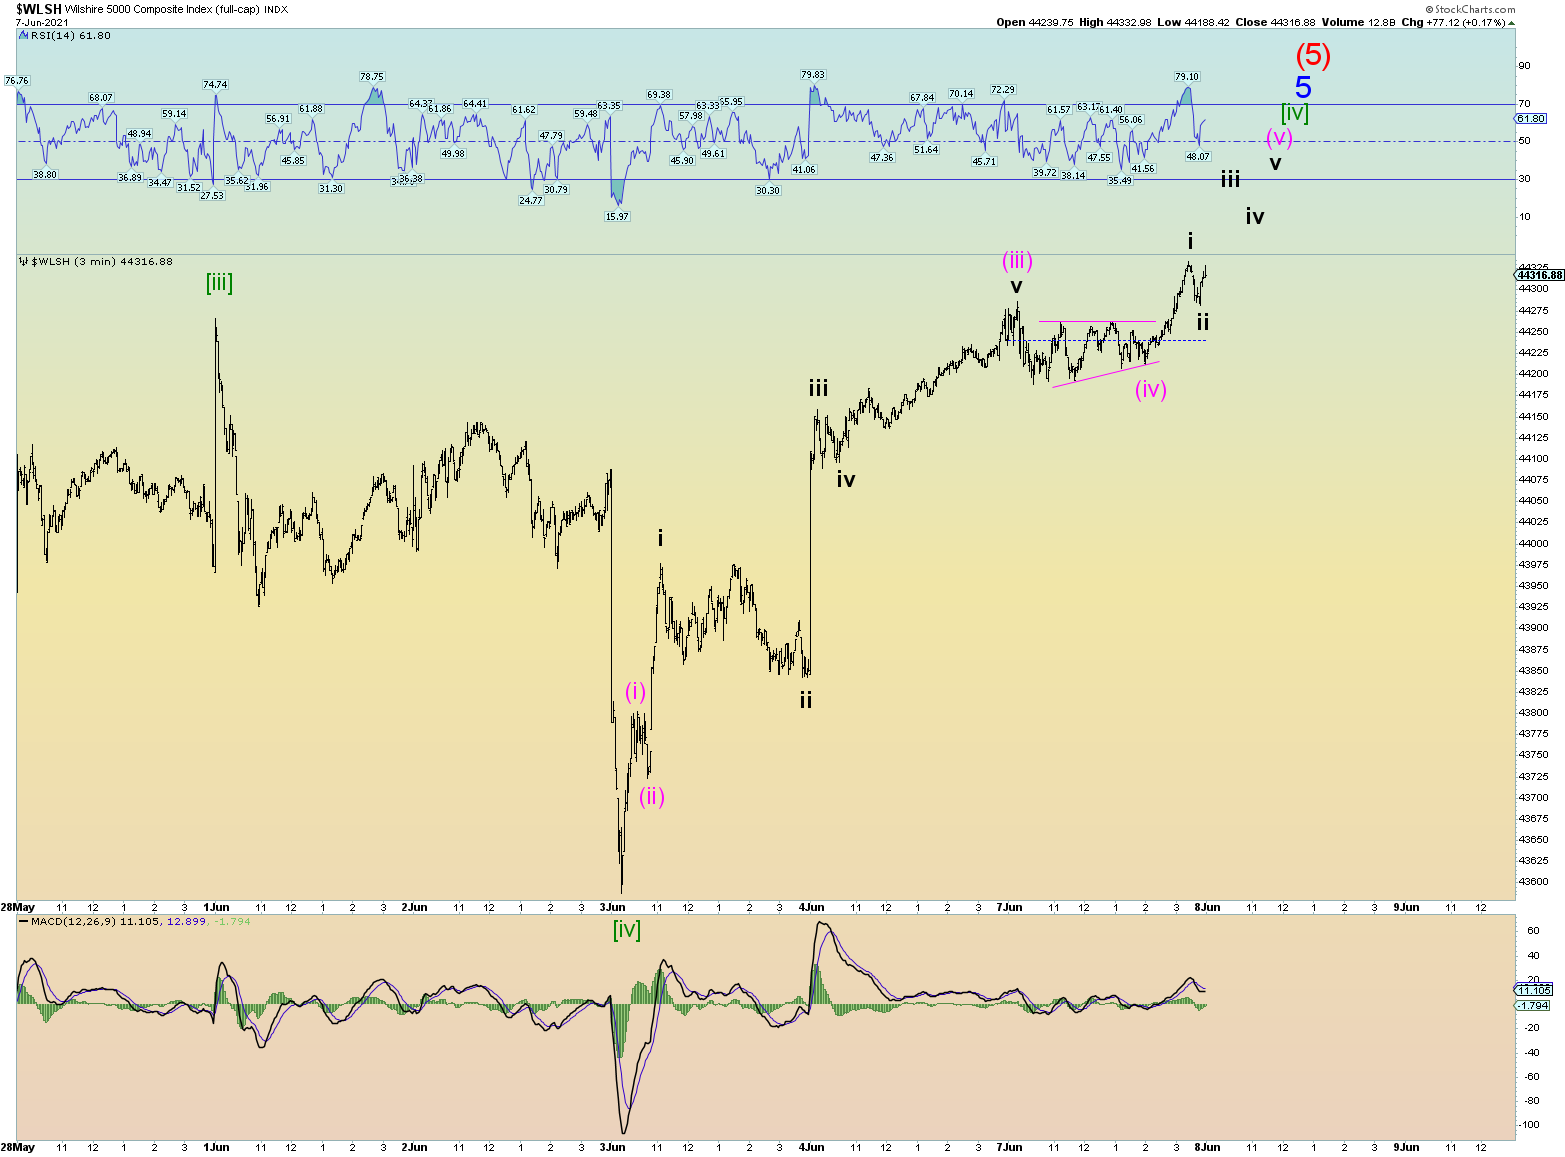
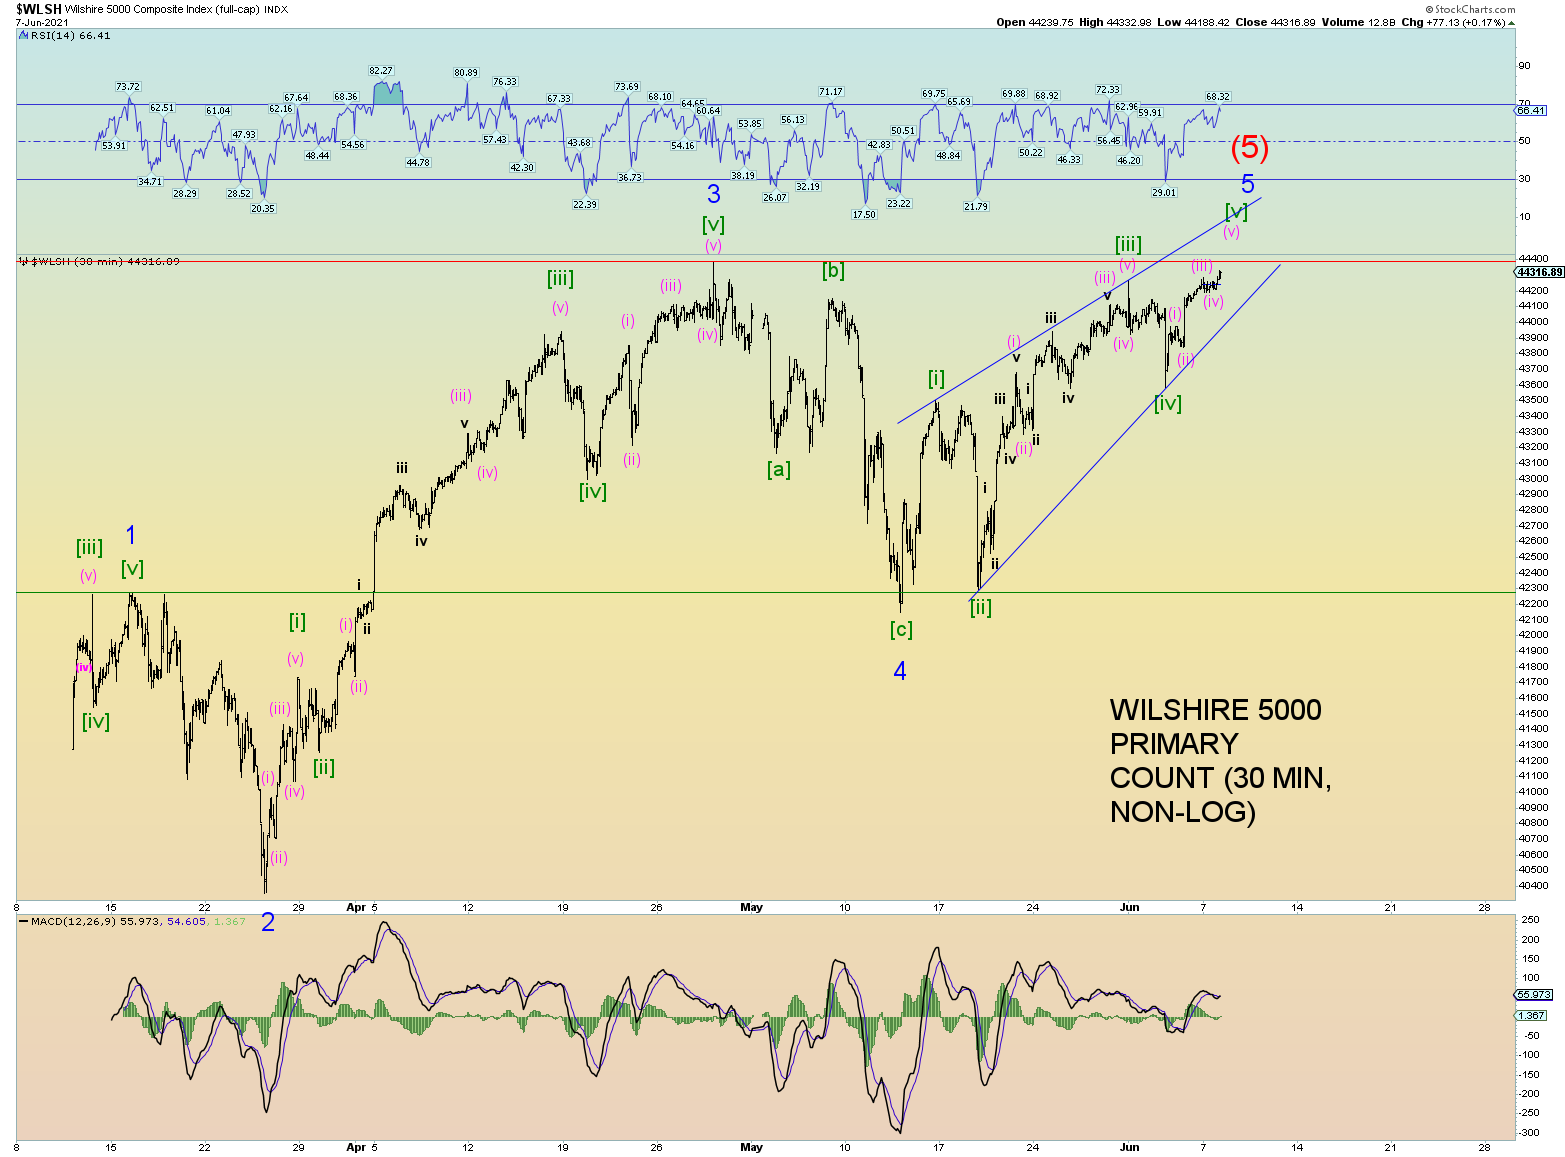
And here would be the squiggle count for the extended wave (5). Working on the final squigglies!
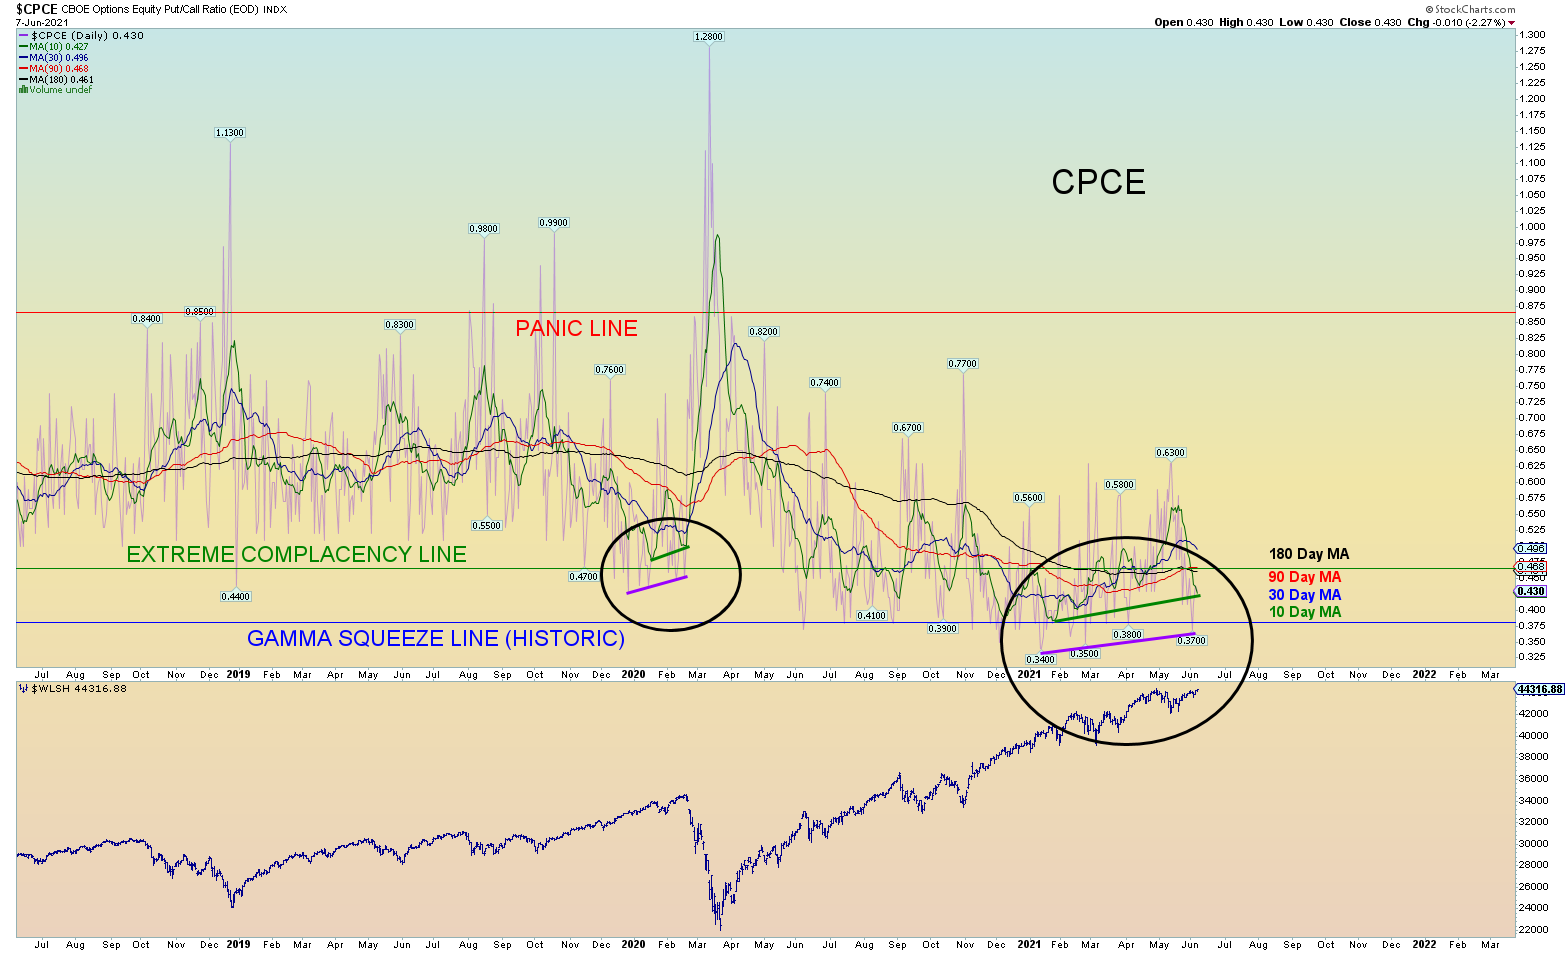
And we know the goosed CPCE data suggests a huge reversal is coming. The trend has been so one-sided for far too long. Folks those moving averages aren’t the usual 3, 5, 10 and 30. They are 3 and 6 month trends! And we are setup in the same divergent scenario as the Feb 2020 high yet we are by far way more extreme.
A new closing high today for the Wilshire 5000 again. It is still shy of it’s intraday high in late April. One more small push would do it.
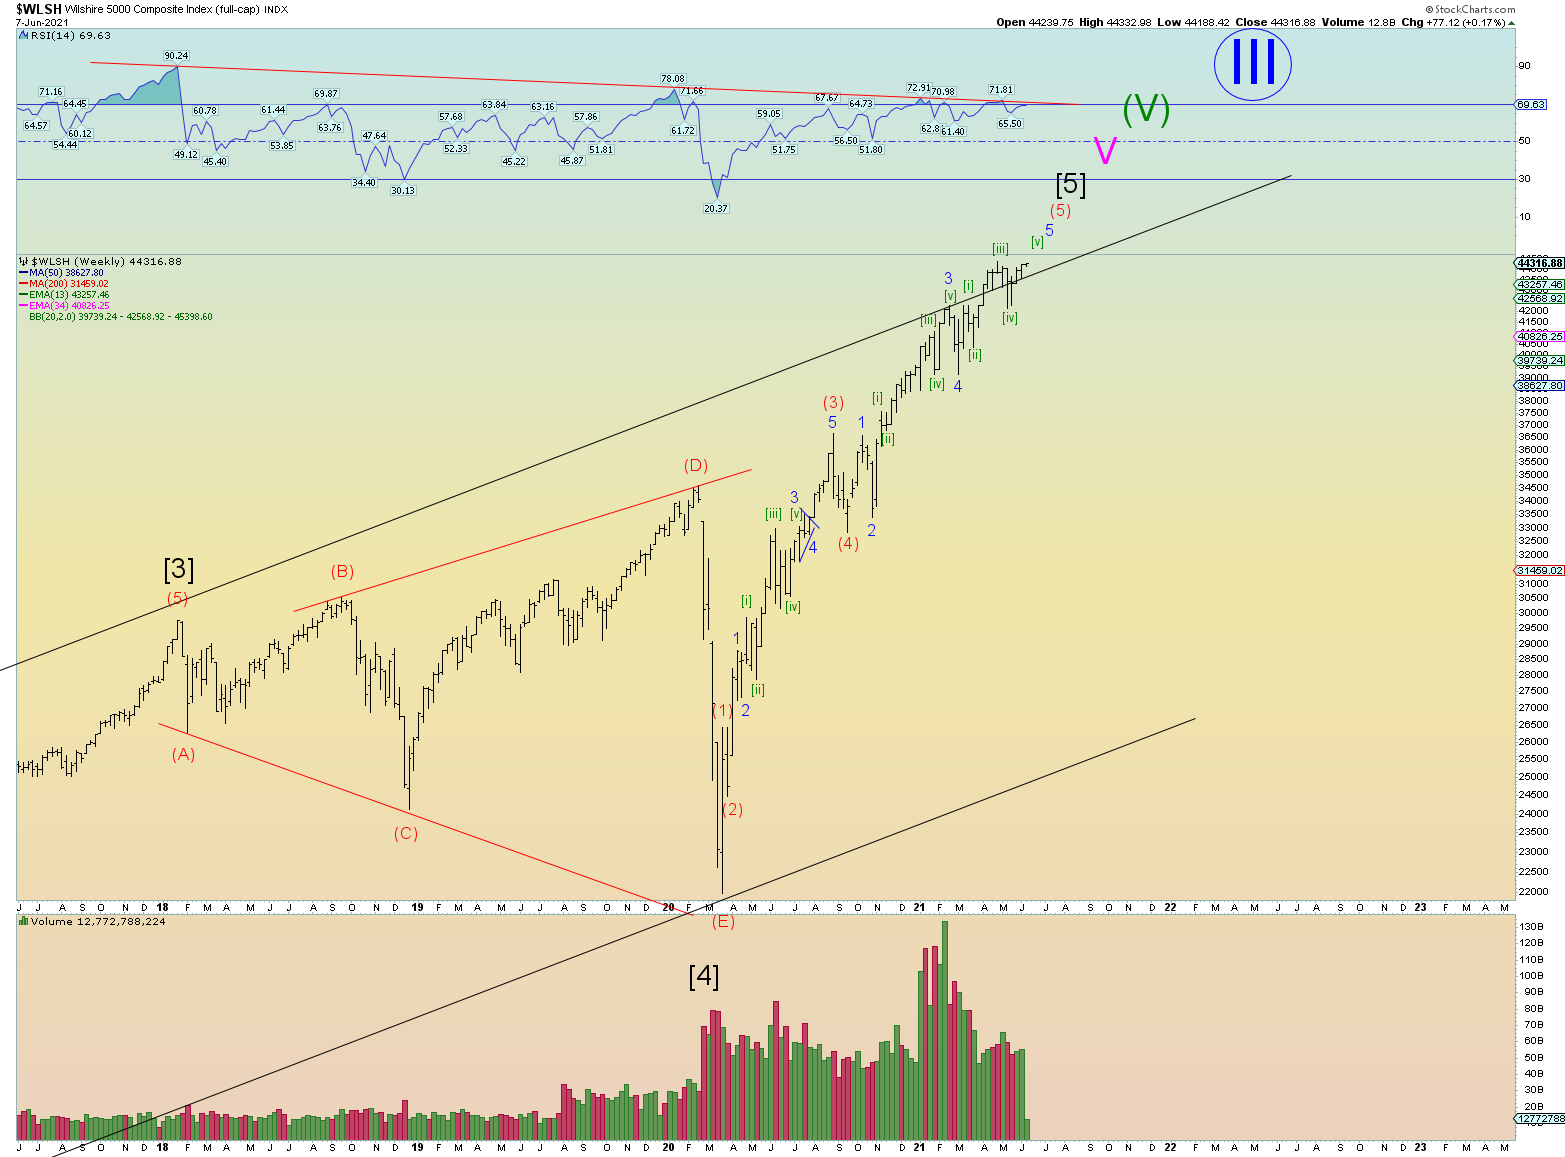
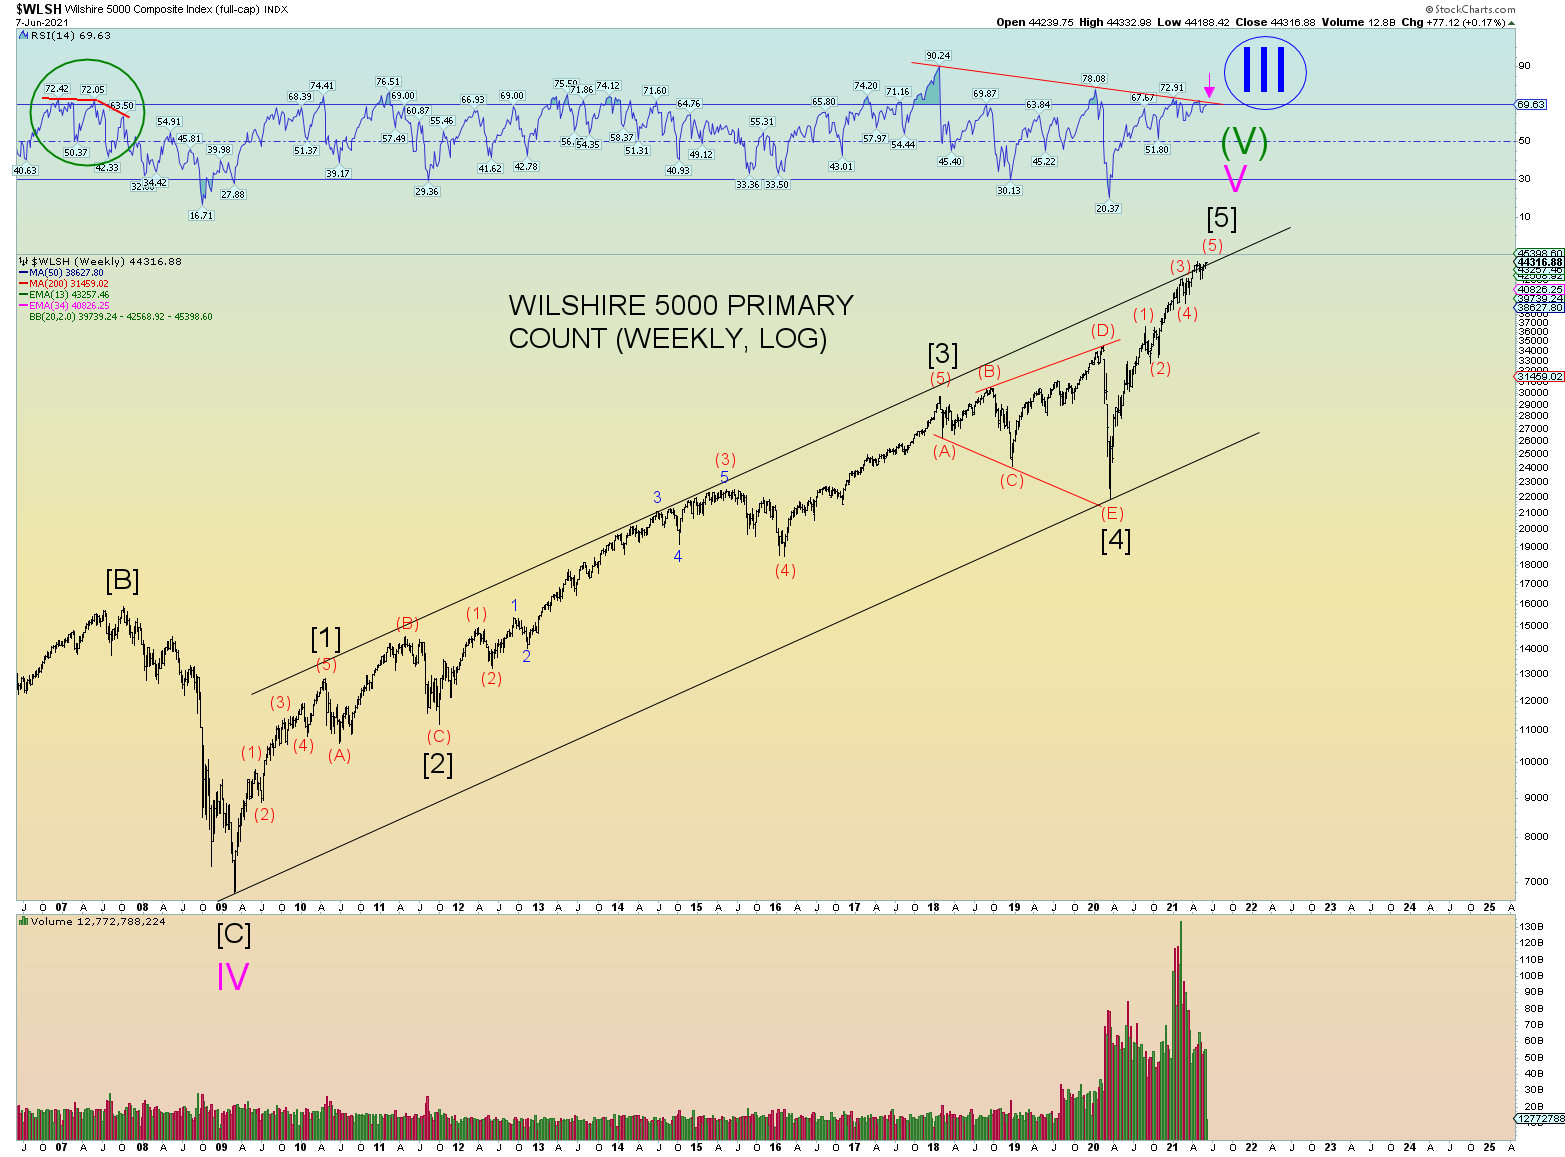
The weekly tells the story of the stock market since the March 2009 low. The market is into its Fibonacci 13th year since that low. We have an all-time closing high on ever waning and diverging RSI. We had peak RSI at [3] as expected and it has waned ever since. This is currently considered a fourth divergence above or at “overbought” 70 RSI. My point is, I couldn’t paint a better script for the wave count overall considering the extreme peak RSI of 90.24 surely marks the top of wave [3].
The following charts do not show the “extended” fifth wave count(s). Just a more-normal-type count. Either is acceptable, yet the extended fifth above works very well also.
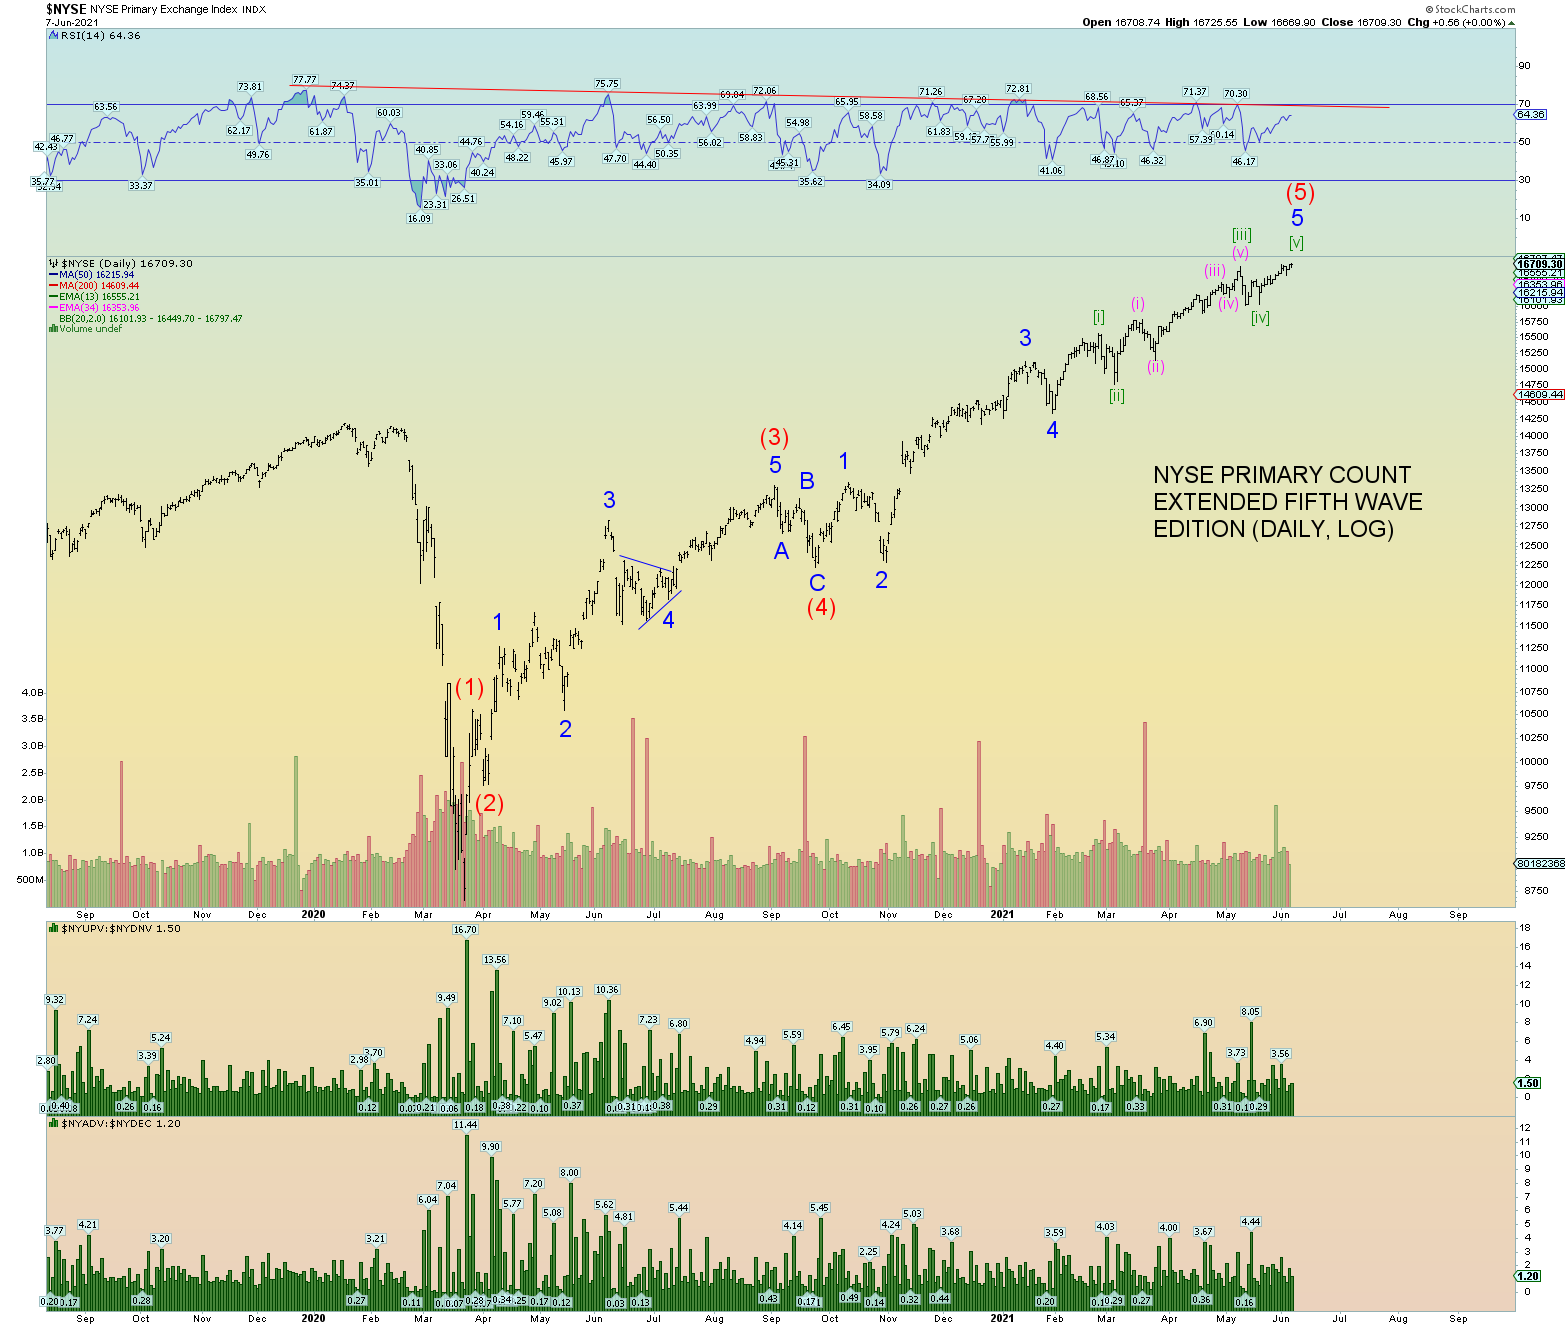
Now the other indexes count better in a different way – as an extended Intermediate wave (5) as talked about in the beginning of the post. NYSE also a new all-time high today.
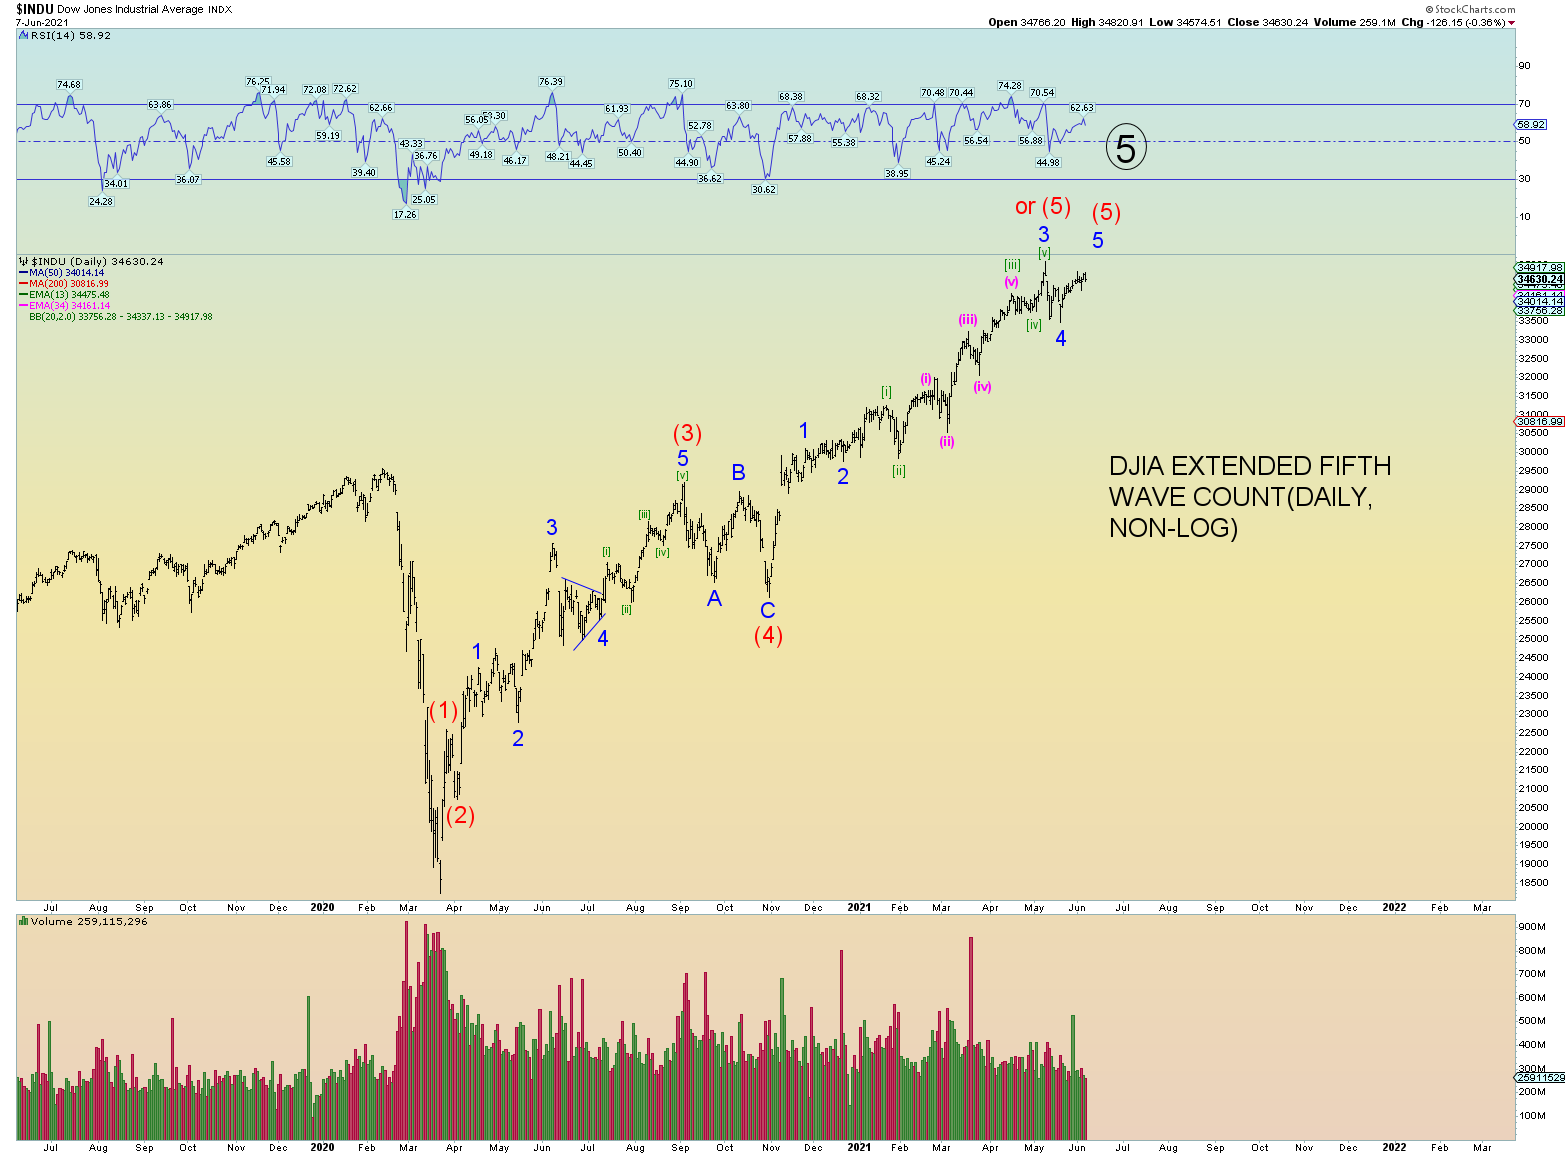
Not sure about the DOW but it may have topped.
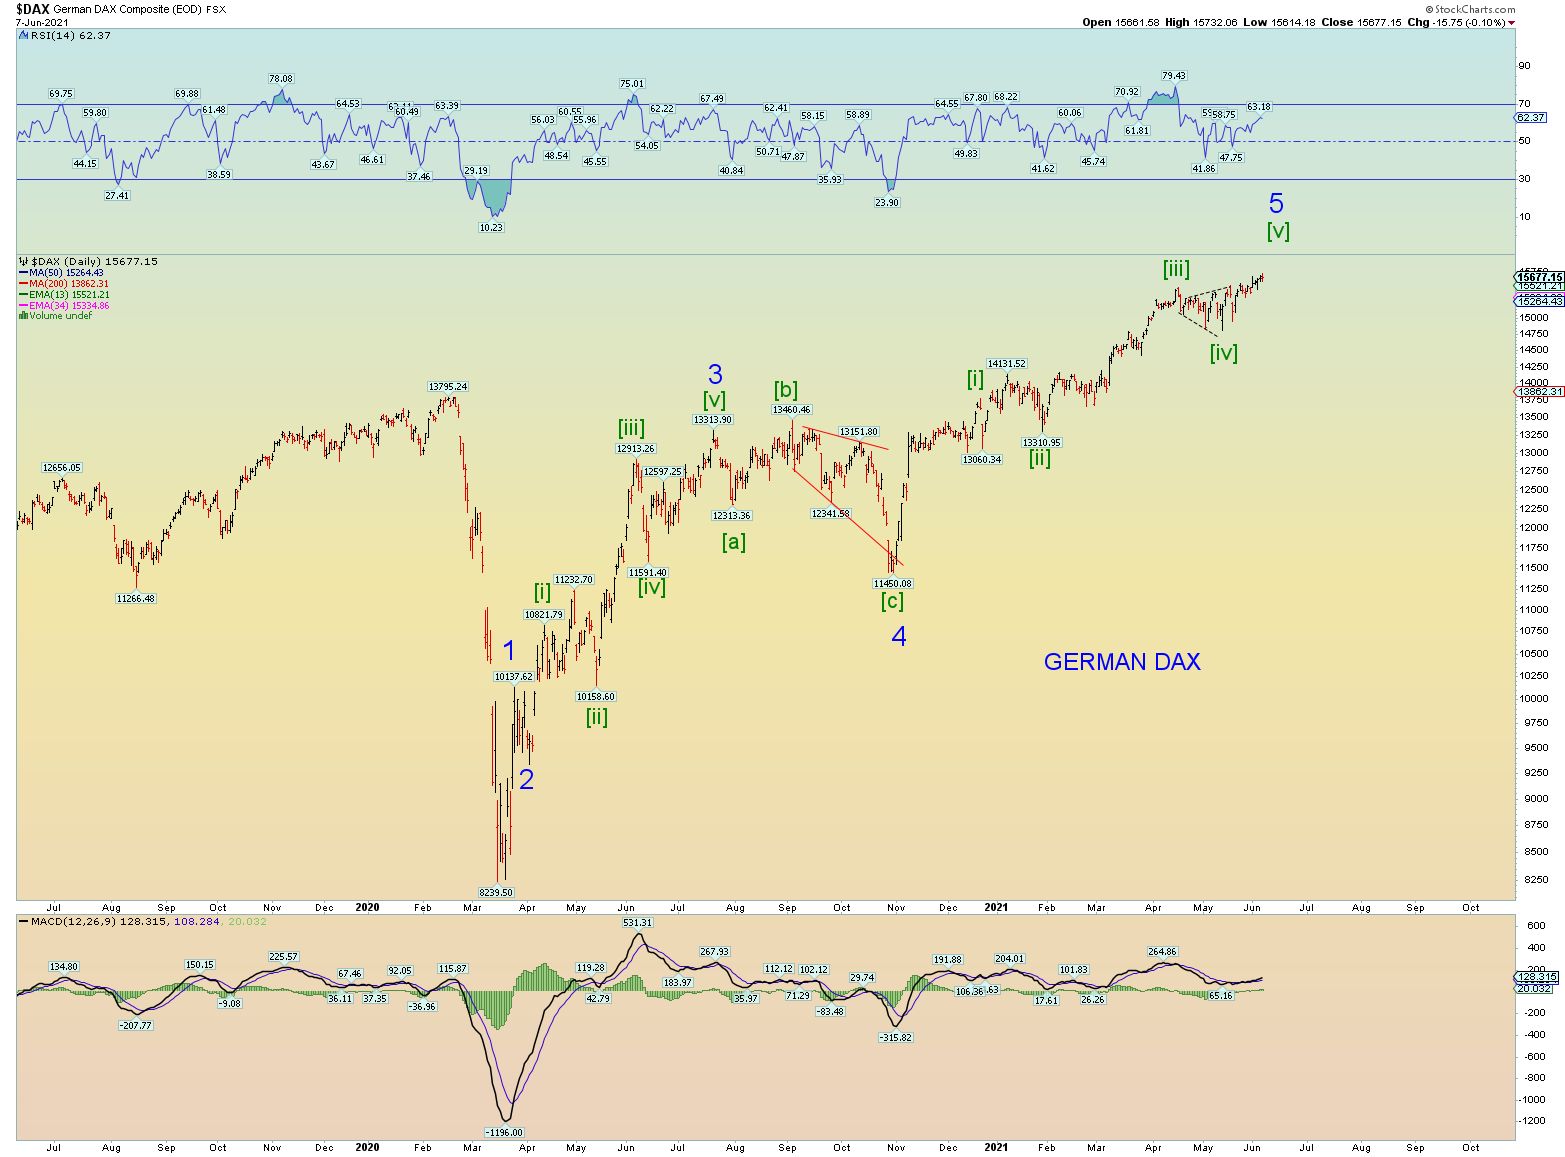
The only way to make heads or tails of the German DAX – which isn’t the greatest counting index anyway – is to put it also in an extended wave 5. I should have higher wave degree labels on here but am too lazy to change it, you get the idea.
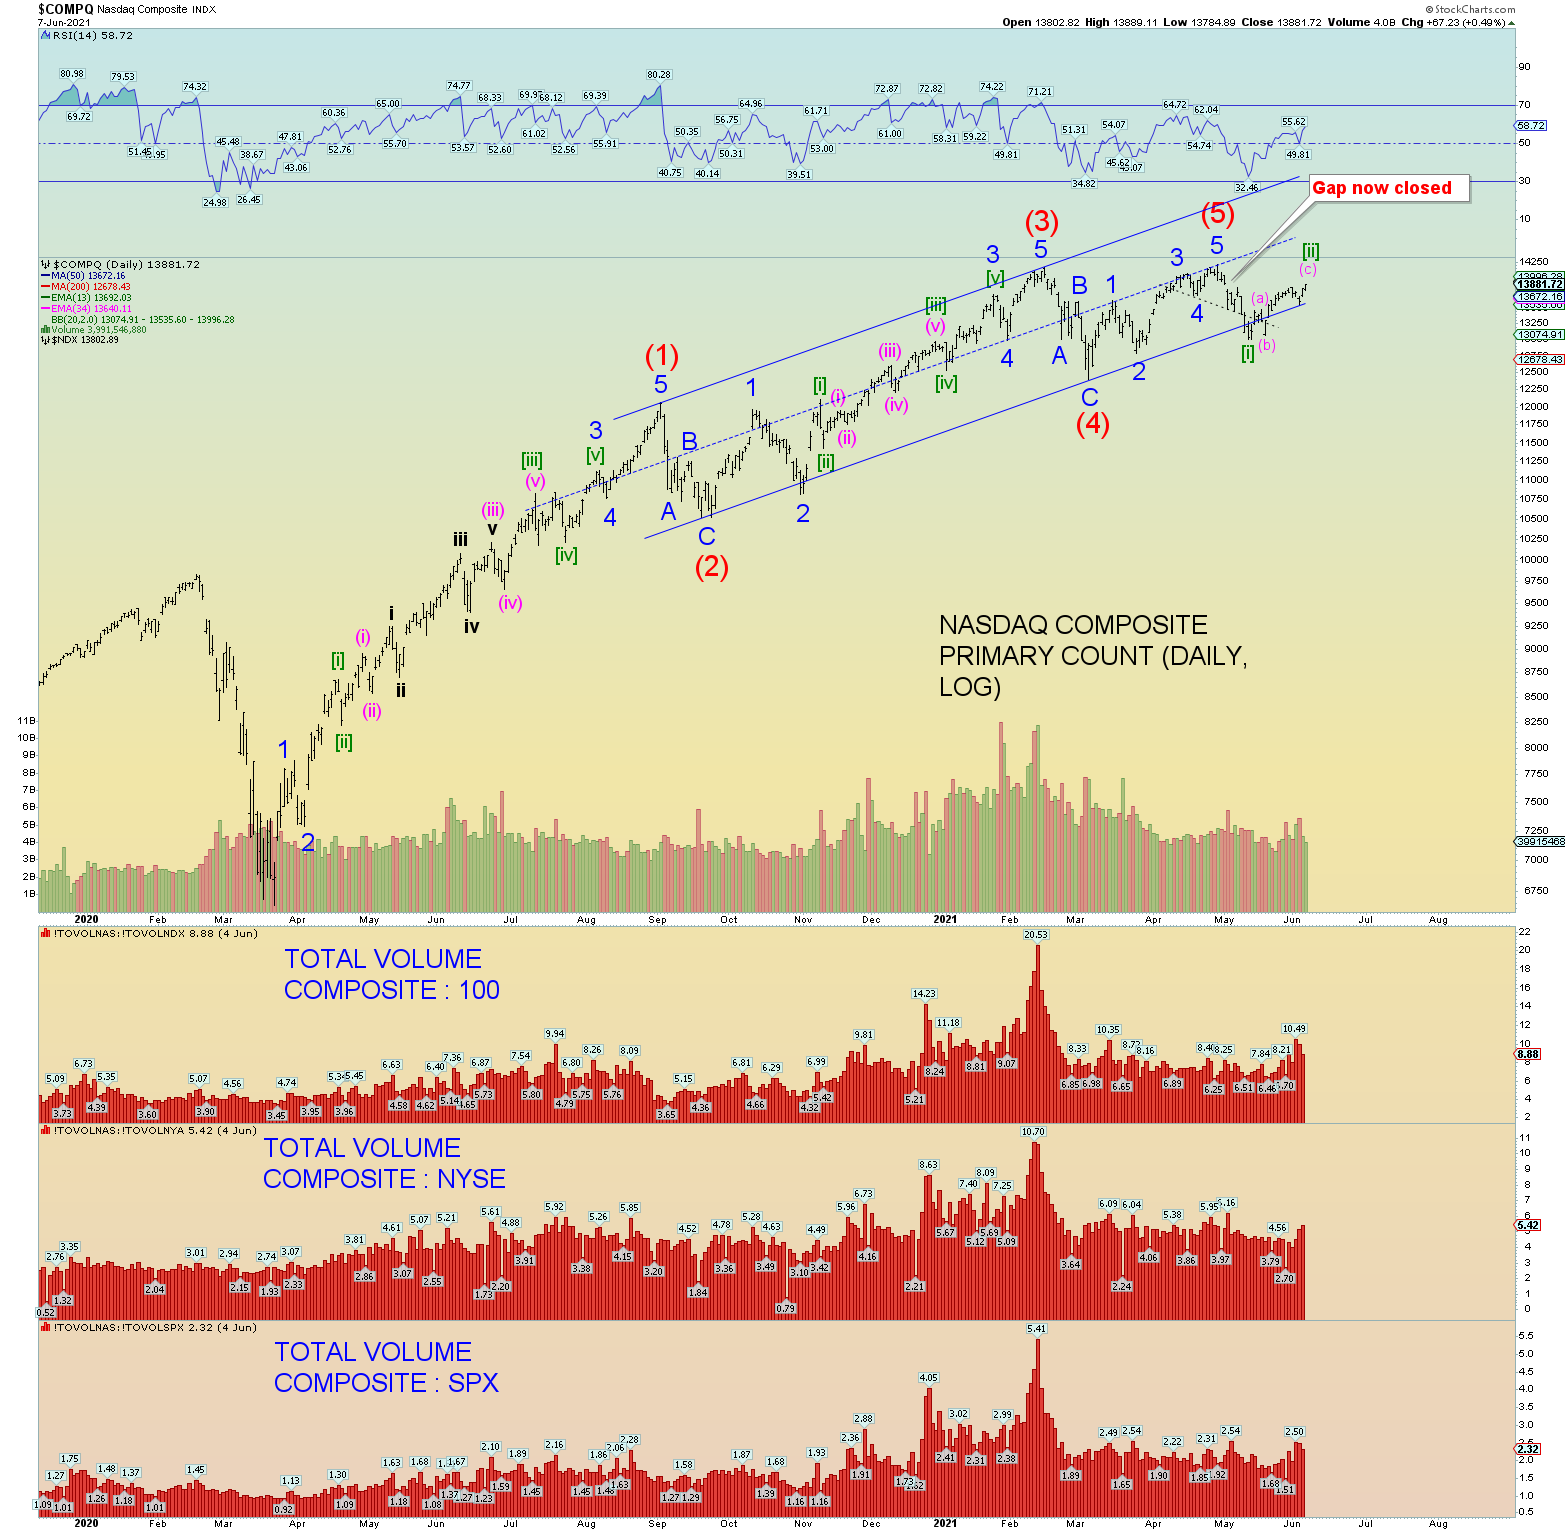
NASDAQ Composite has filled is open chart gap. I don’t have a great count for this making a new all-time high so I am hoping my count holds. Just another piece of the puzzle perhaps that all these counts are correct.
Wilshire weekly again this time shown as the extended wave (5) count. It works well enough.