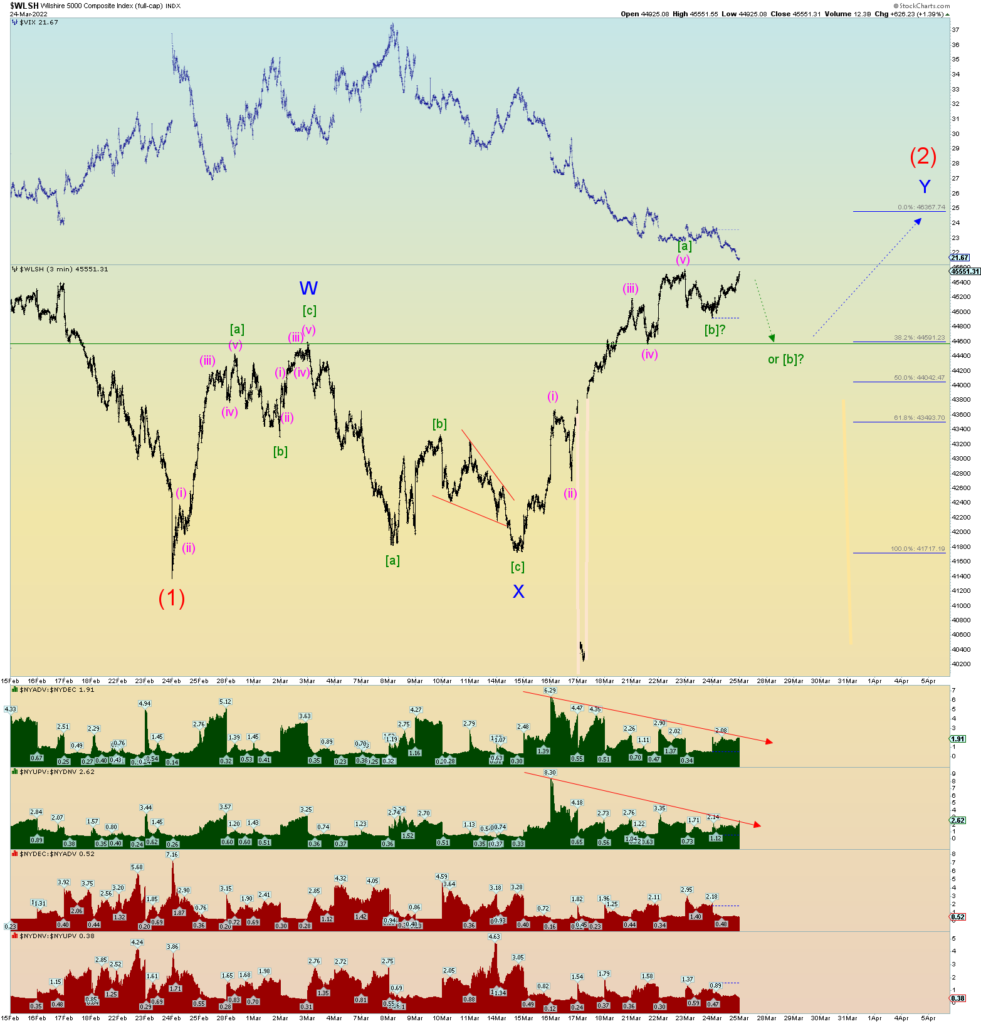
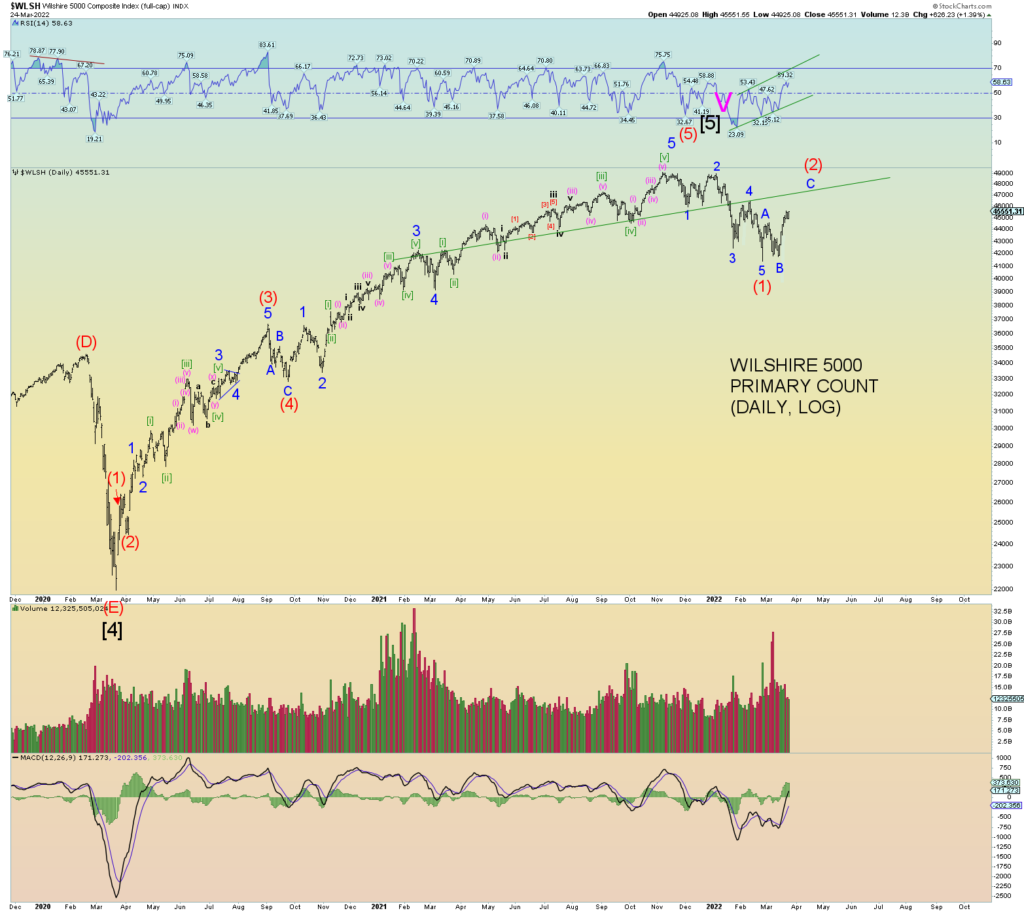
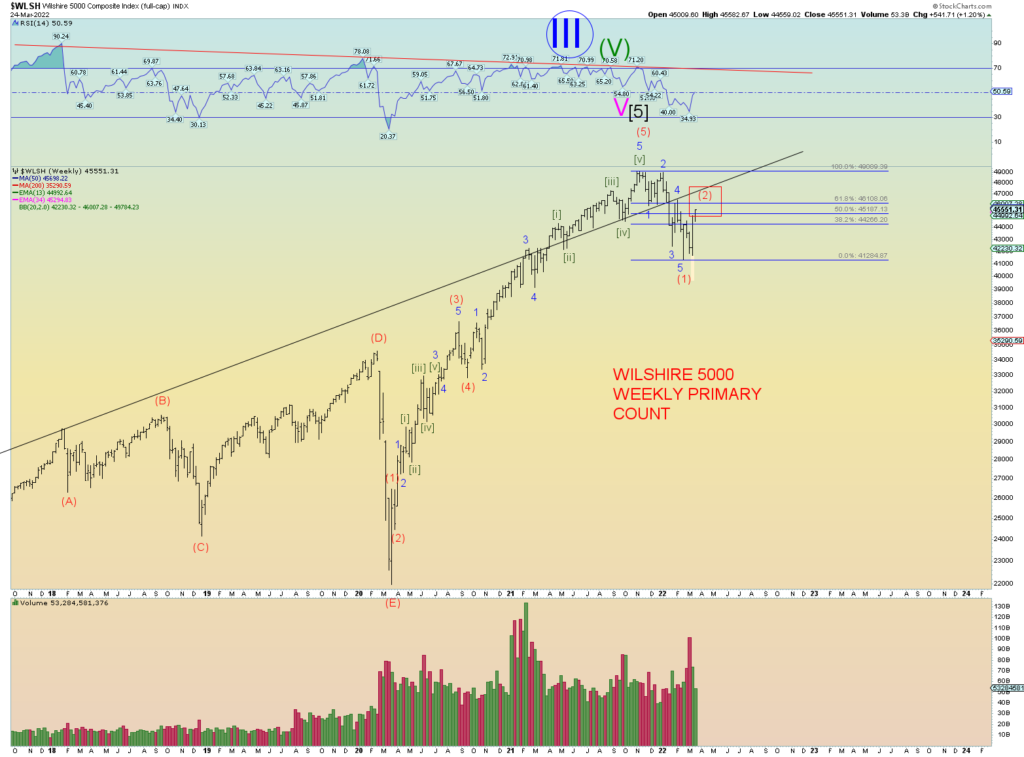
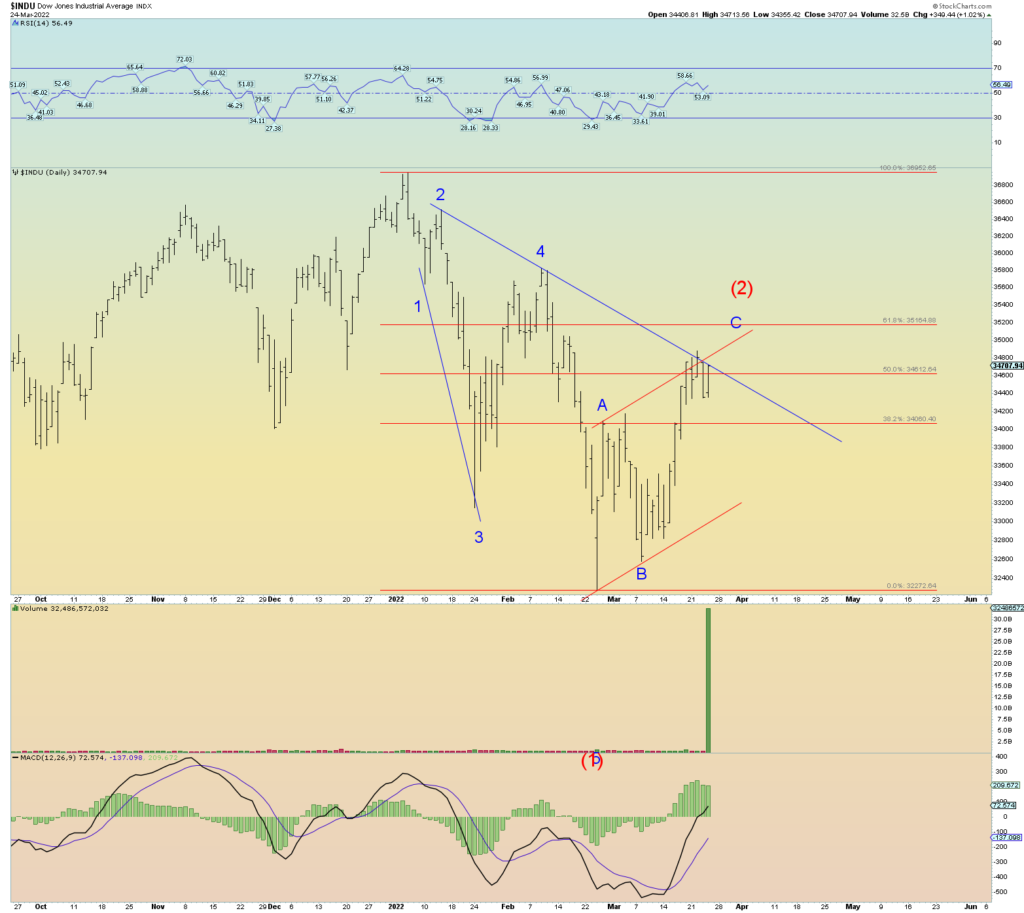
We have a potential stopping zone for wave (2) of the Wilshire 5000. It is an area of lots of convergence. 1) 200 DMA @ 46,000. 2) 61.8% Fibonacci retrace of the entire drop from peak @ 46,140. 3) Wave Y of (2) would be 1.5 x wave W of 2 @ 46,200. 4) Fibonacci sequence #24 is at 46,368. 5) Wave Y of (2) would be 1.618 wave W of (2) @ 46,577. 6) Previous peak of 4 of (1) down is in this range.
So, the target range would be 46,000 – 46,580 thereabouts with the Fib Sequence #24 right in the middle of that range @ precisely 46,368. And then the market should run out of steam. My wave (2) target topping date is April 6th after the quarter is over and the subsequent rebalancing.
Ideally wave (2) would peak on great news (as if there has been any as of late.) A “ceasefire” (which I would judge as a temporary or false ceasefire) would fit the definition. If there is a true ceasefire, sell that news hard.
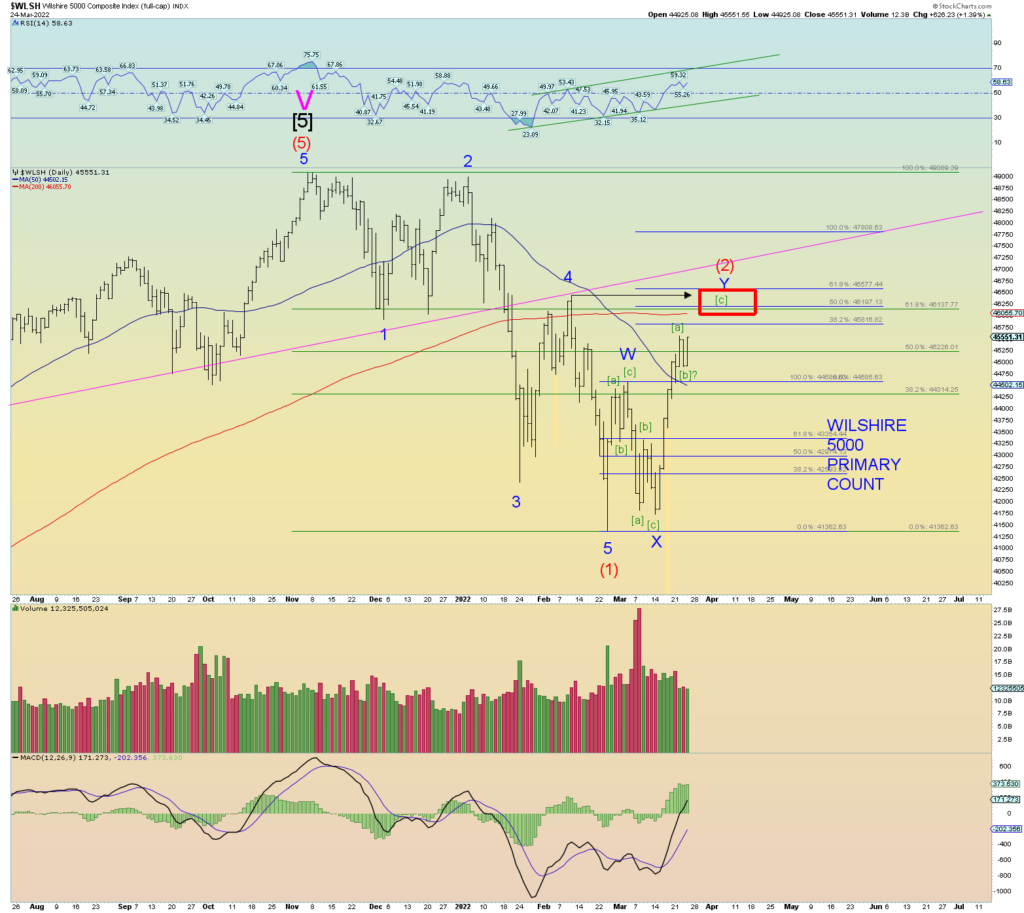
I attempted a squiggly chart. There is a misprint on the Wilshire stockcharts I try and cover it up. The retrace pattern of wave (2) appears to be a double zigzag which we would label W-X-Y in place of A-B-C. This would be typical as one zigzag was not enough in price or time. Therefore, the pattern repeats and the second zigzag is behaving as a third wave would with strength. But eventually that strength dies out in wave [c] of Y.
