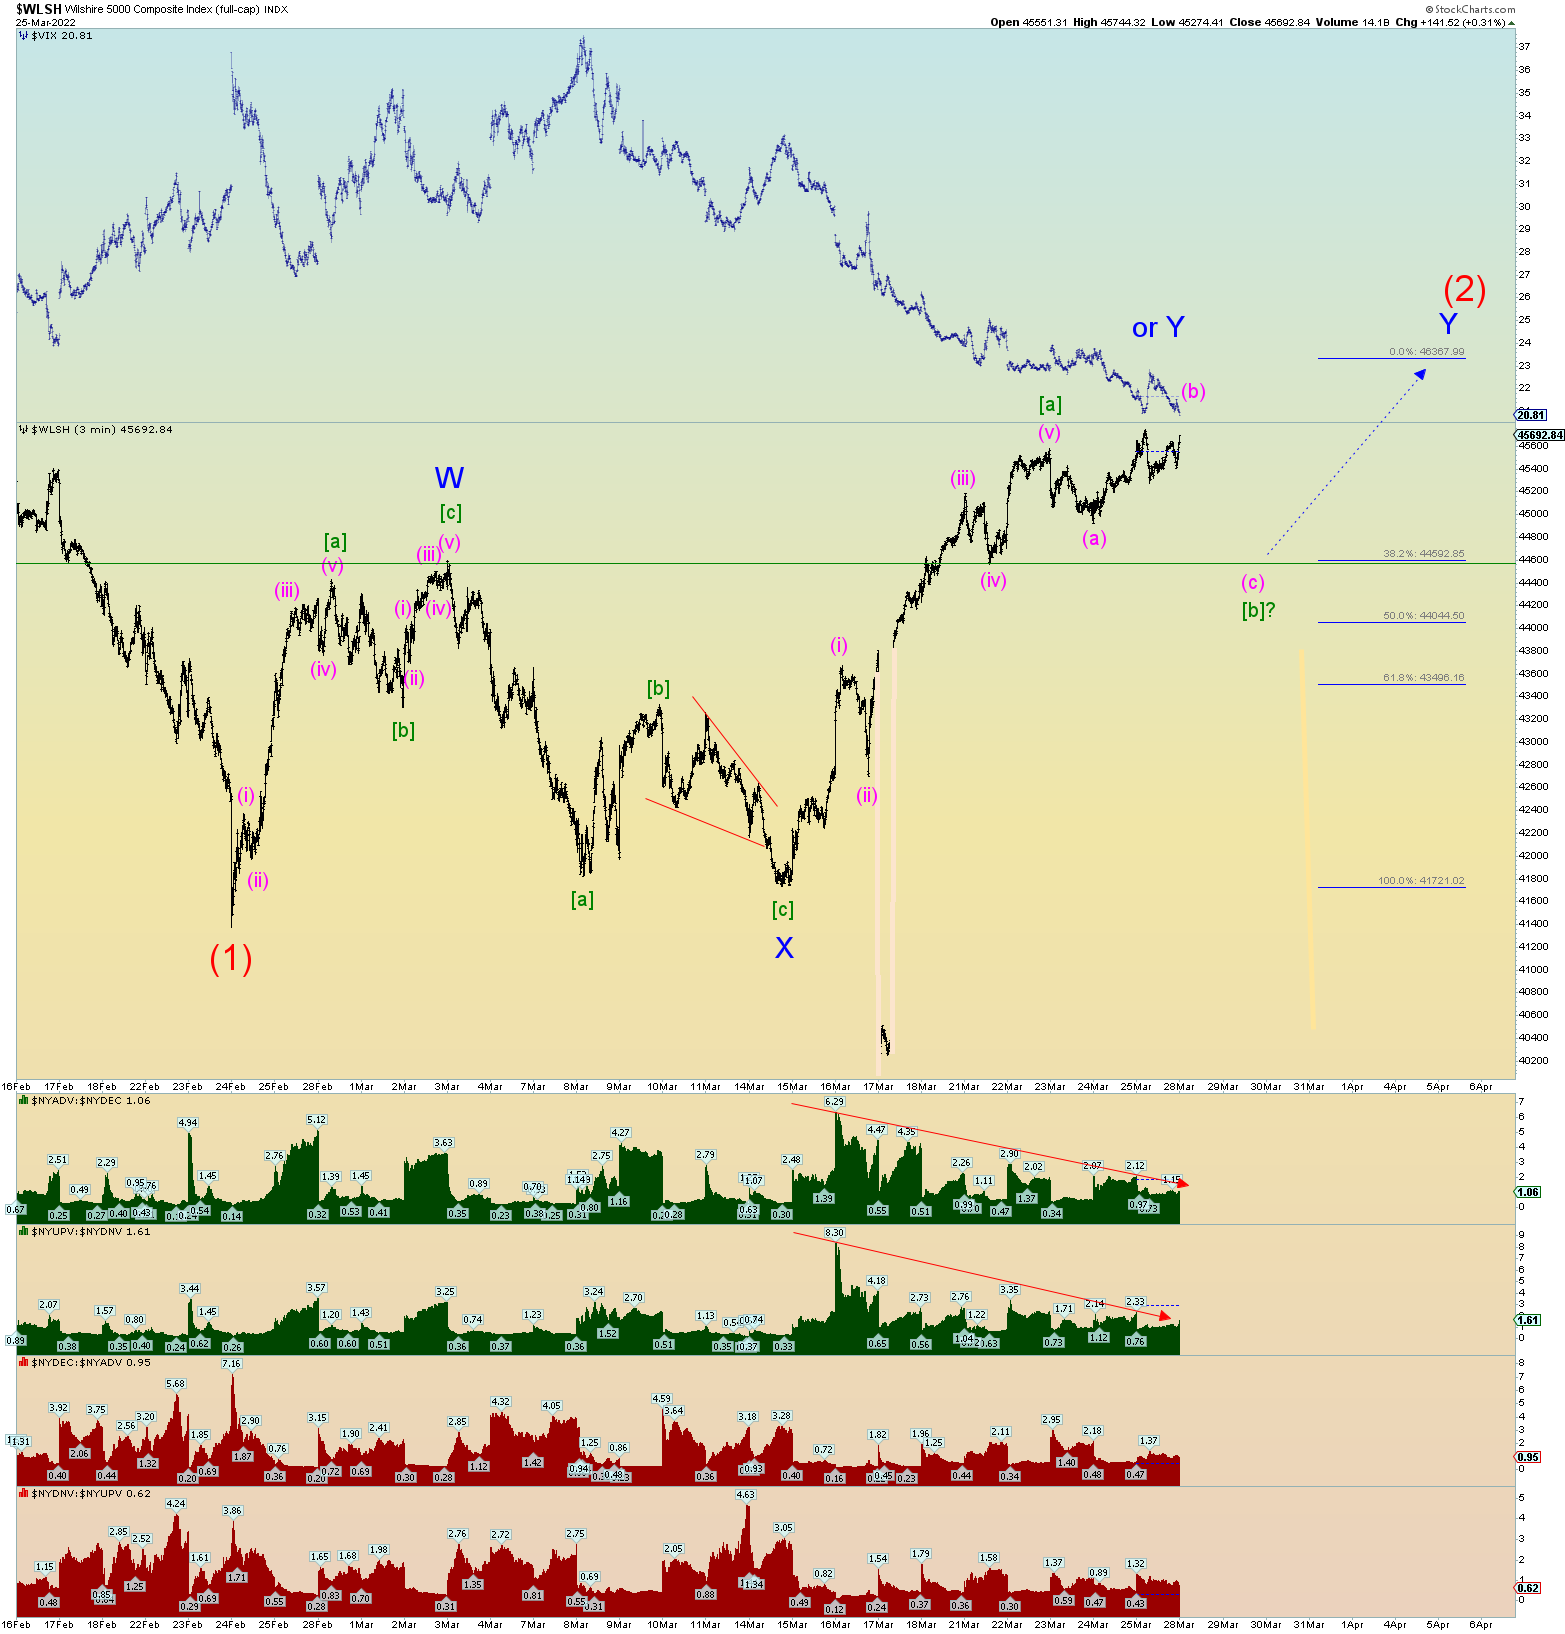
Best guess squiggle count for the double zigzag pattern for wave (2). Still looking for confirmation of a wave [b] of Y. I’m looking for a dip down early next week and then rally through the end of quarter on Thursday the 31st.
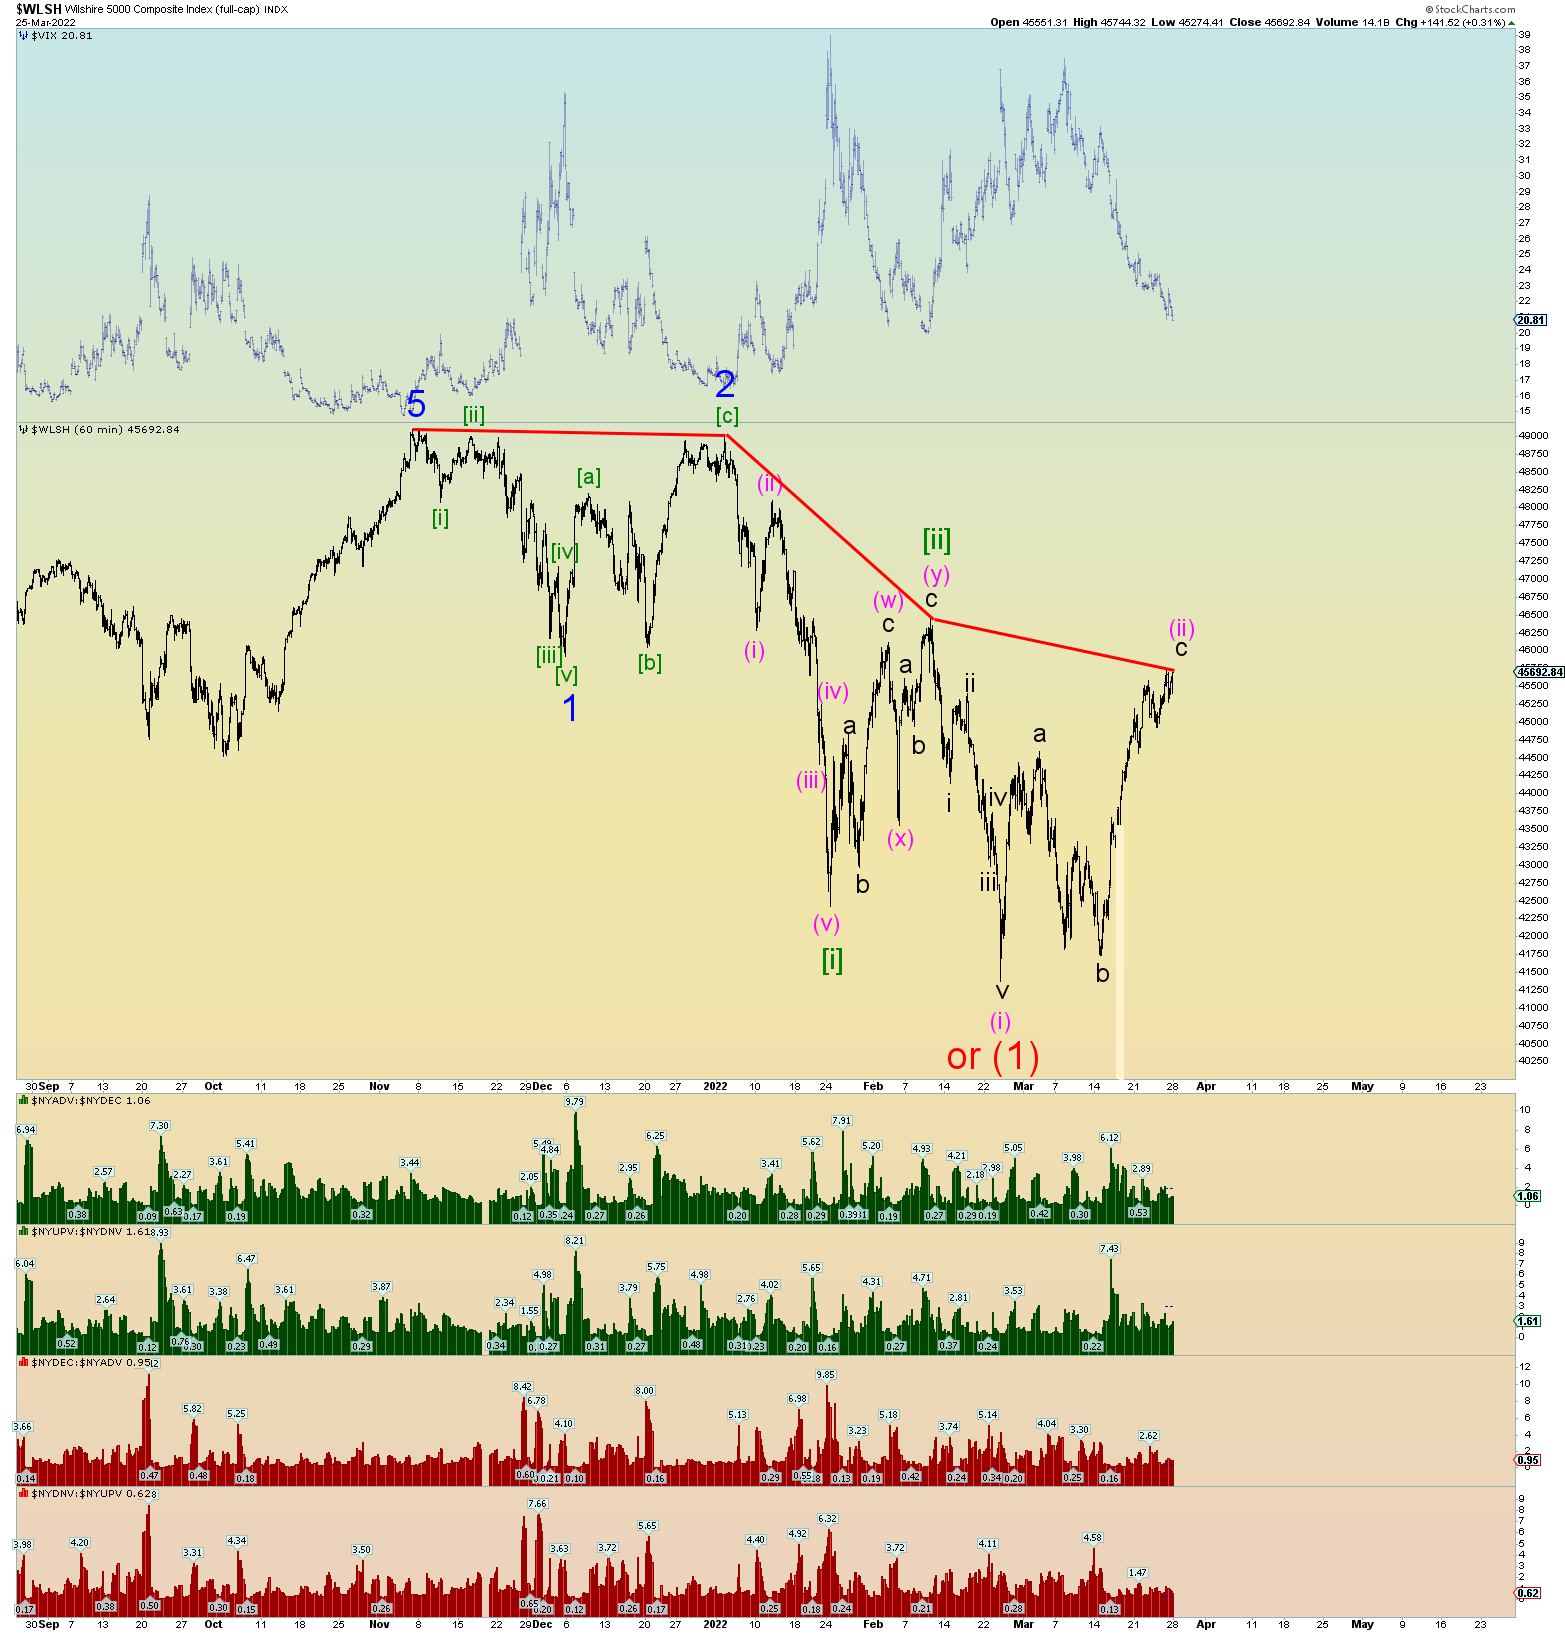
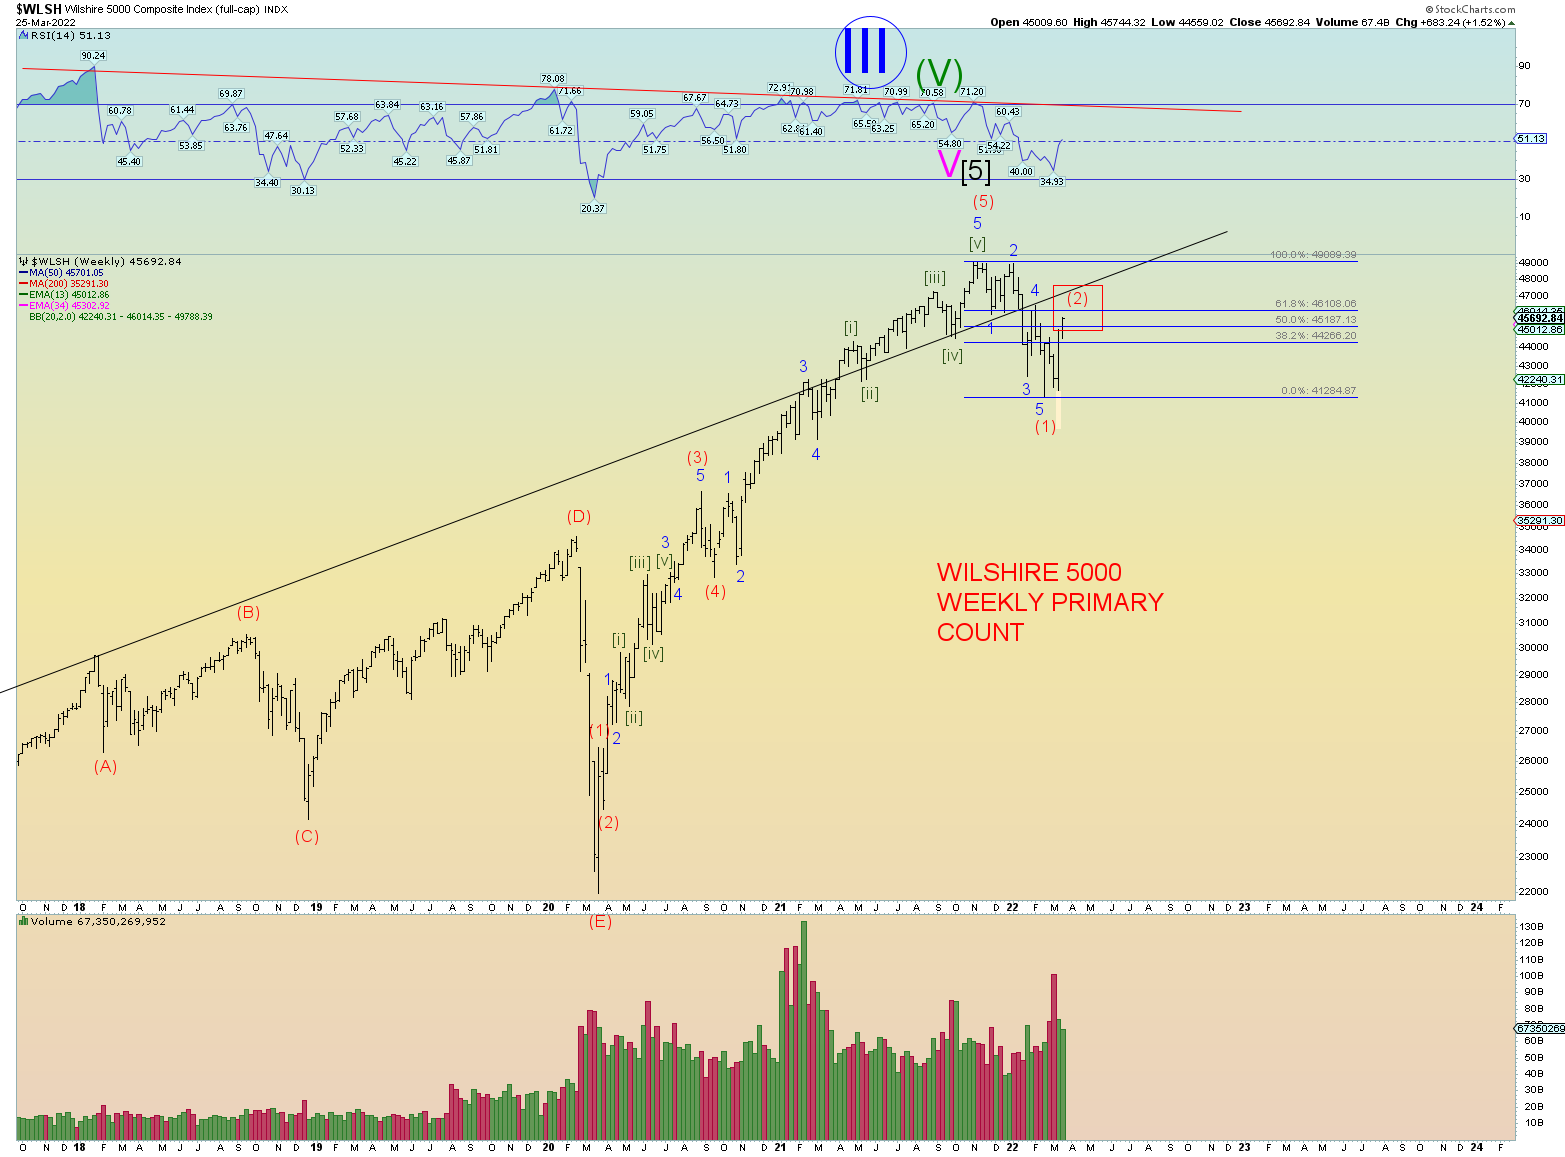
If you compare the above Wilshire count (which topped 1st week of November) and the DJIA chart below, you can see why a quicker, rather than longer, resolution to wave (2) would work nicely. Obviously at the tops there was significant divergence.
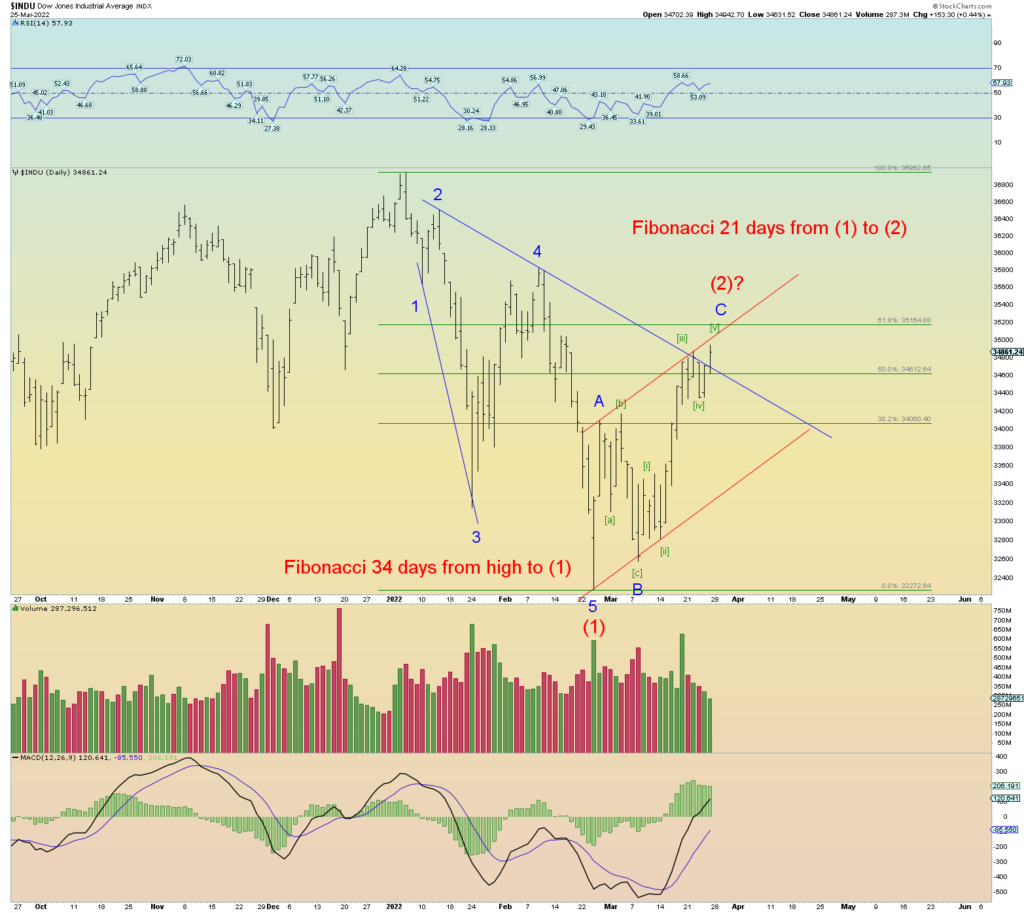
But this is why I use the total market Wilshire 5000 as my base index for counting waves. We have a clear 5 waves down albeit with waves 1 and 4 overlap which is not ideal. However, considering a total market in transition the Wilshire traced a remarkable pattern. Yet even so, the DJIA is interesting also. A potential leading diagonal triangle down.
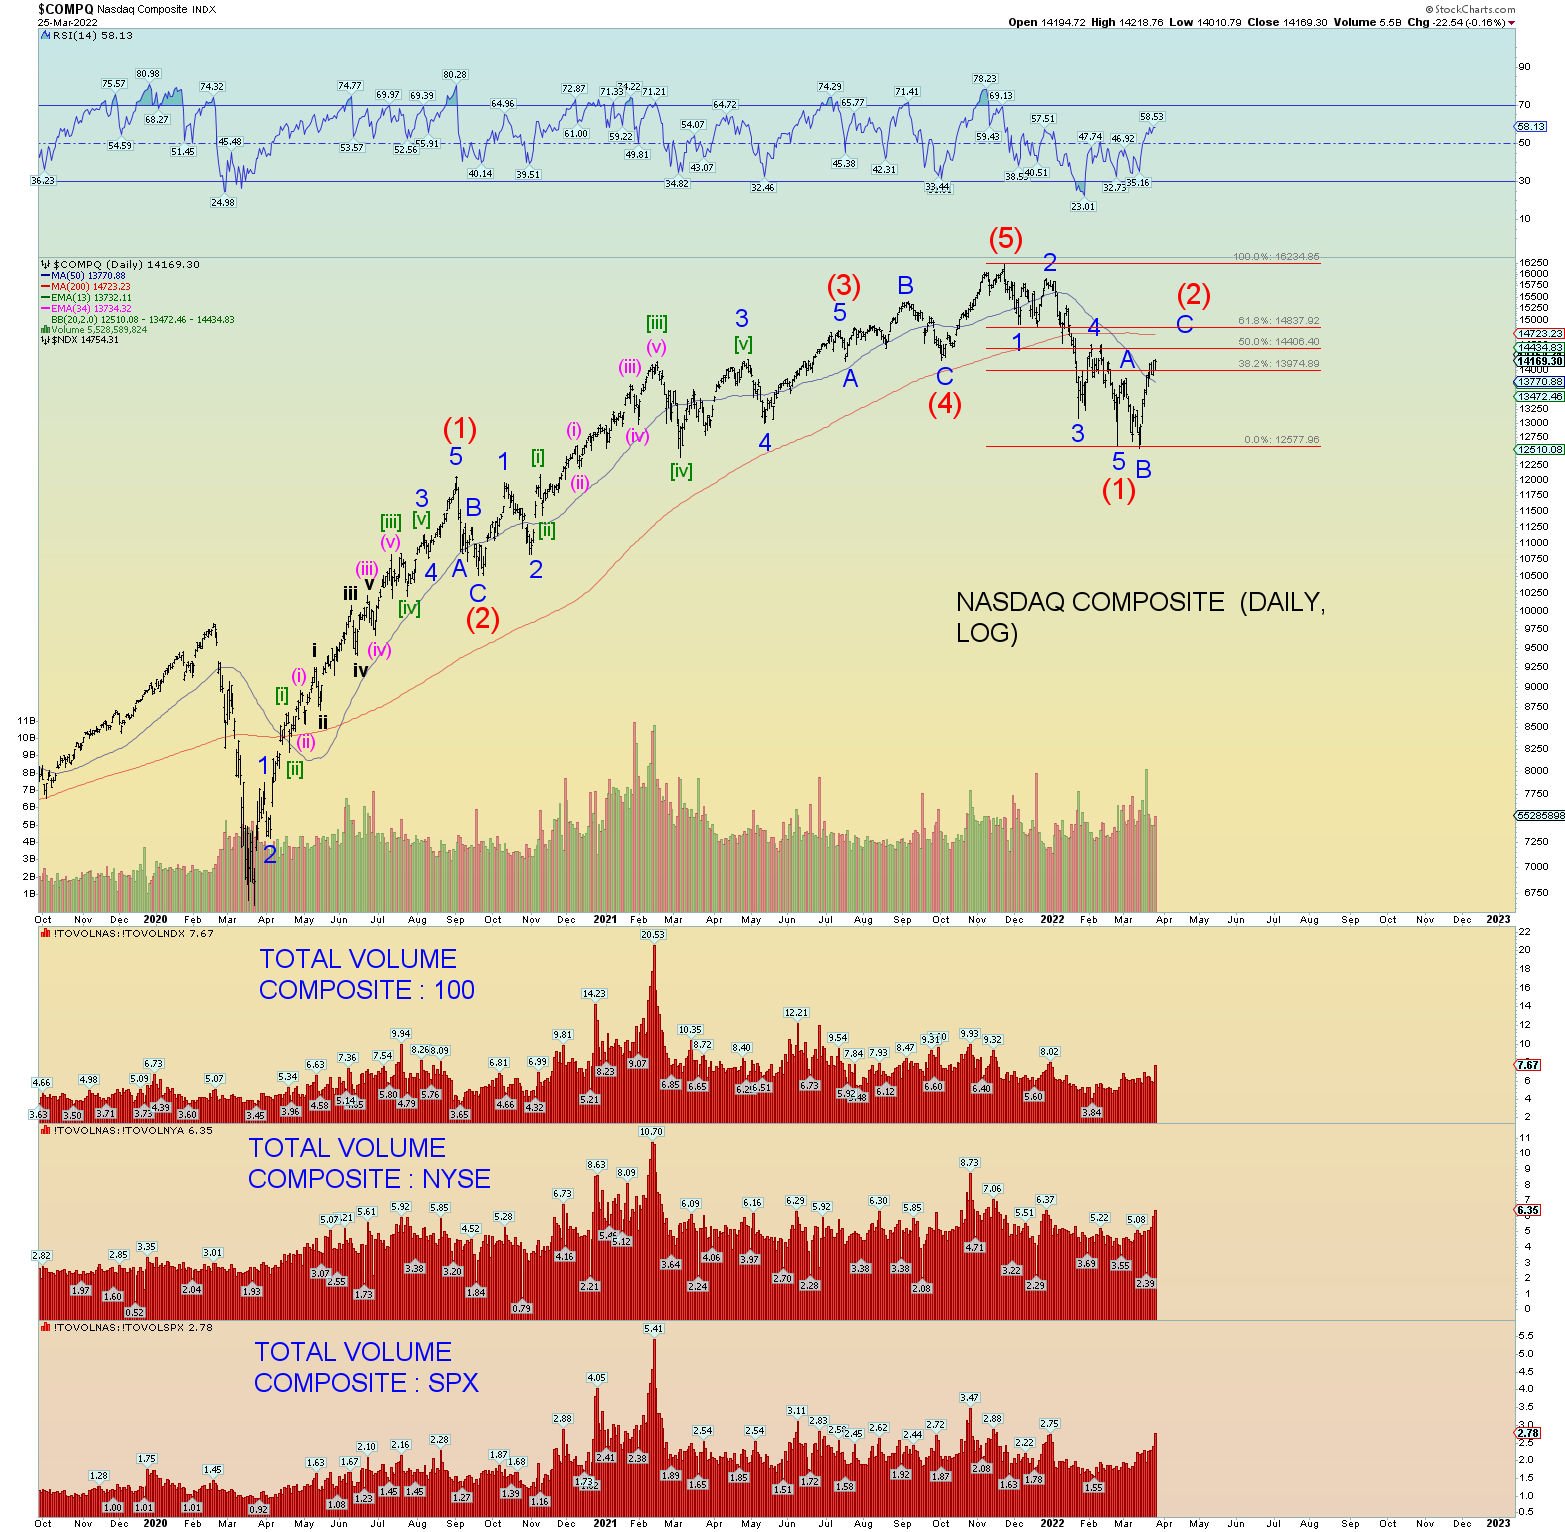
Wave (2) could very well be over. A very nice 34/21 split in time for the DJIA (and SPX). The retrace in all the indices – DJIA, SPX, Wilshire, and NASDAQ Composite has more than satisfied a typical wave (2) retrace (although the Composite is lagging a bit but to be expected it is considered leading the way lower).
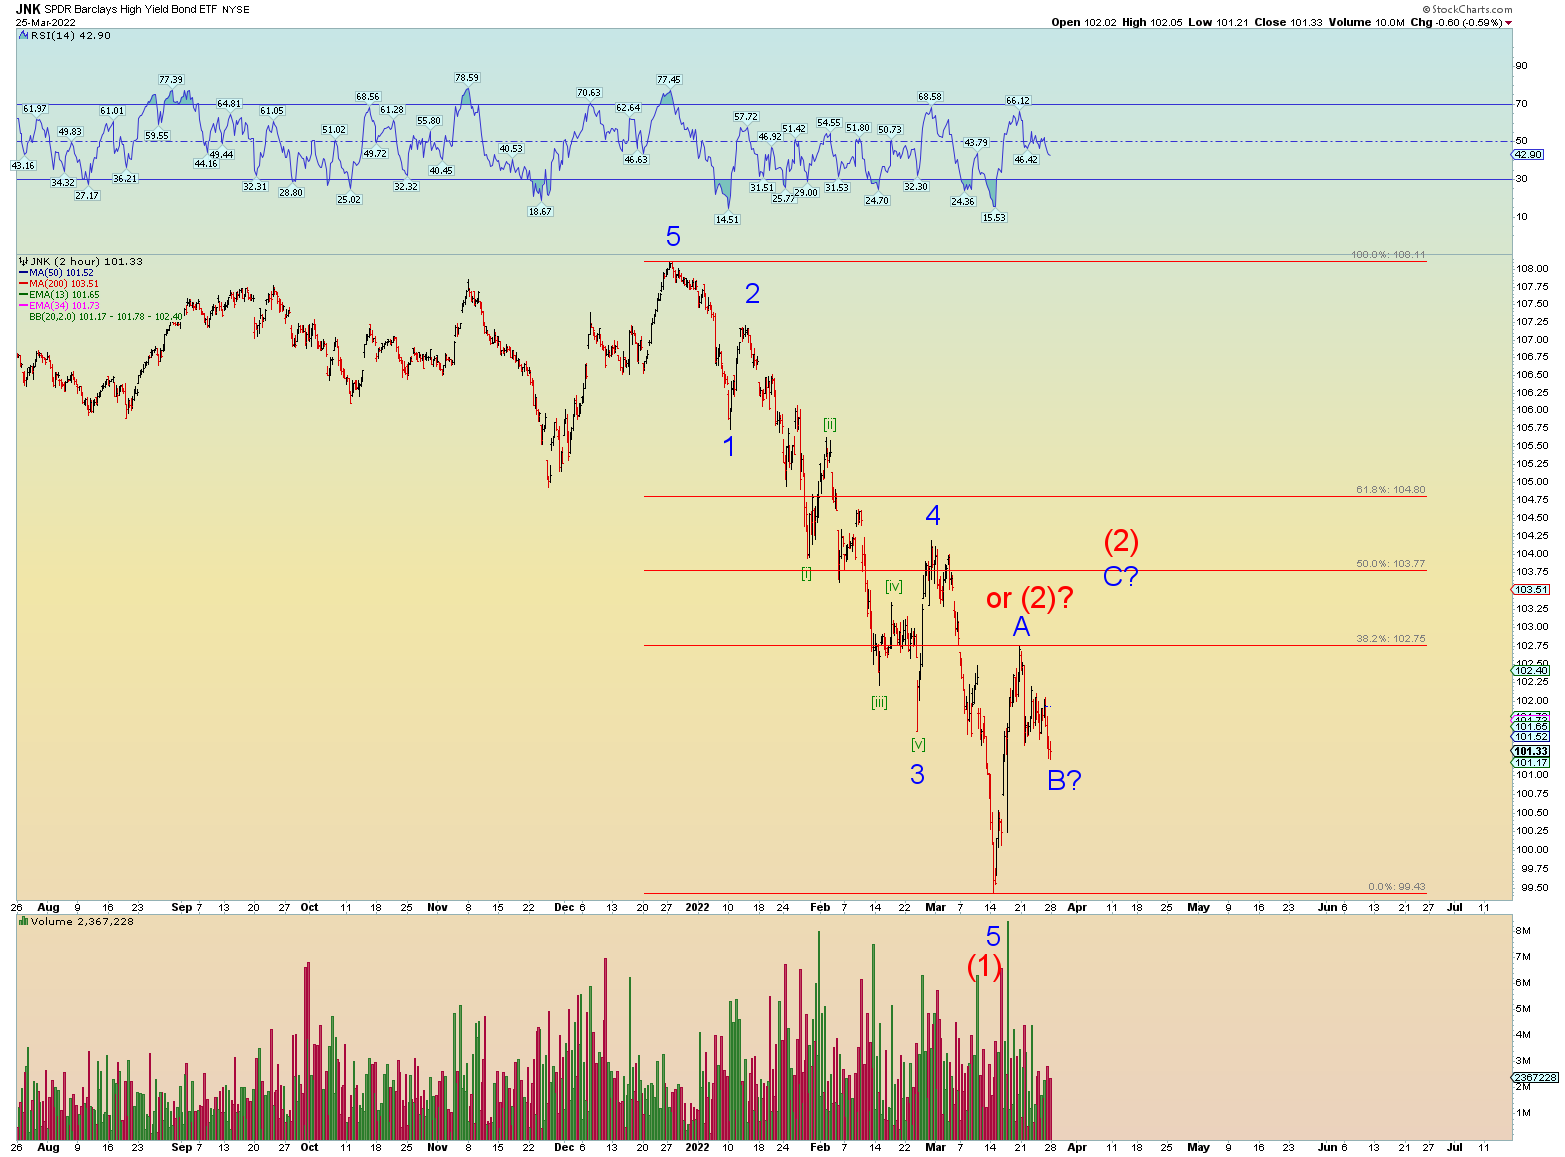
Junk touched on a Fibonacci 38.2% retrace but has pulled back in price. Junk should be leading the way down so this could be a something to watch. You can say it is already diverging.
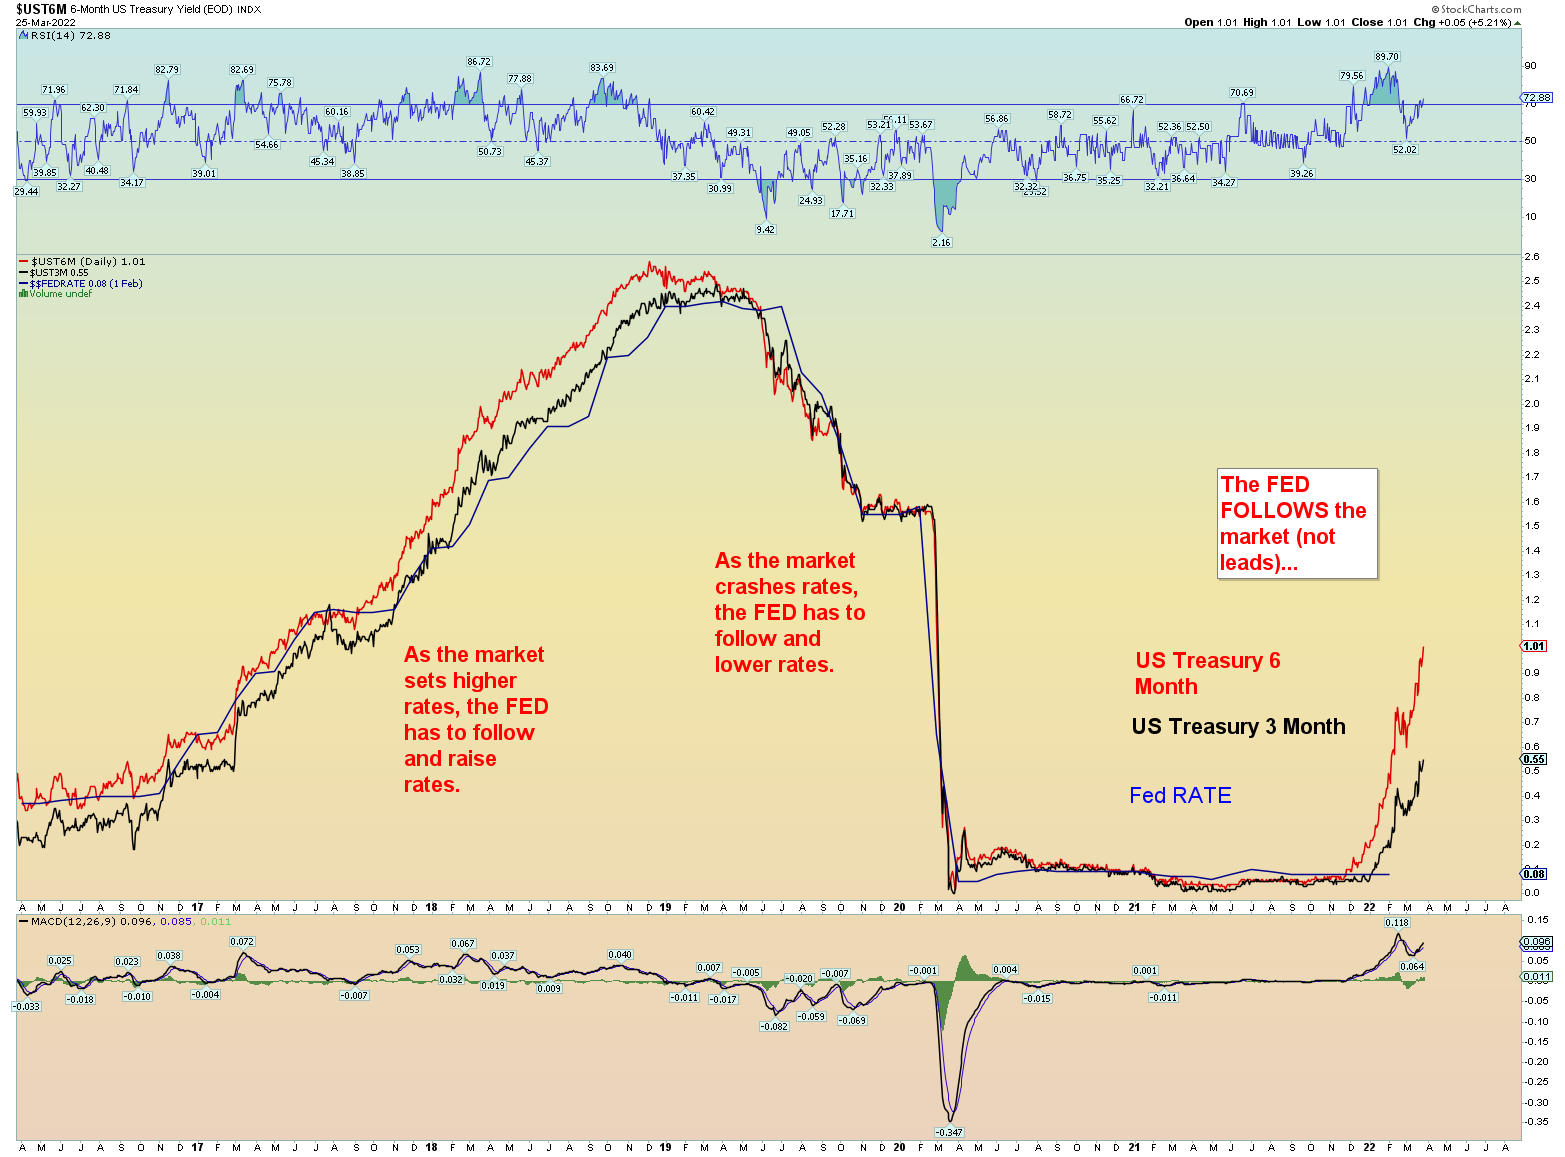
Surging yields. The Fed is already about a 1/4 point behind the market. An unannounced emergency rate hike is a possibility.
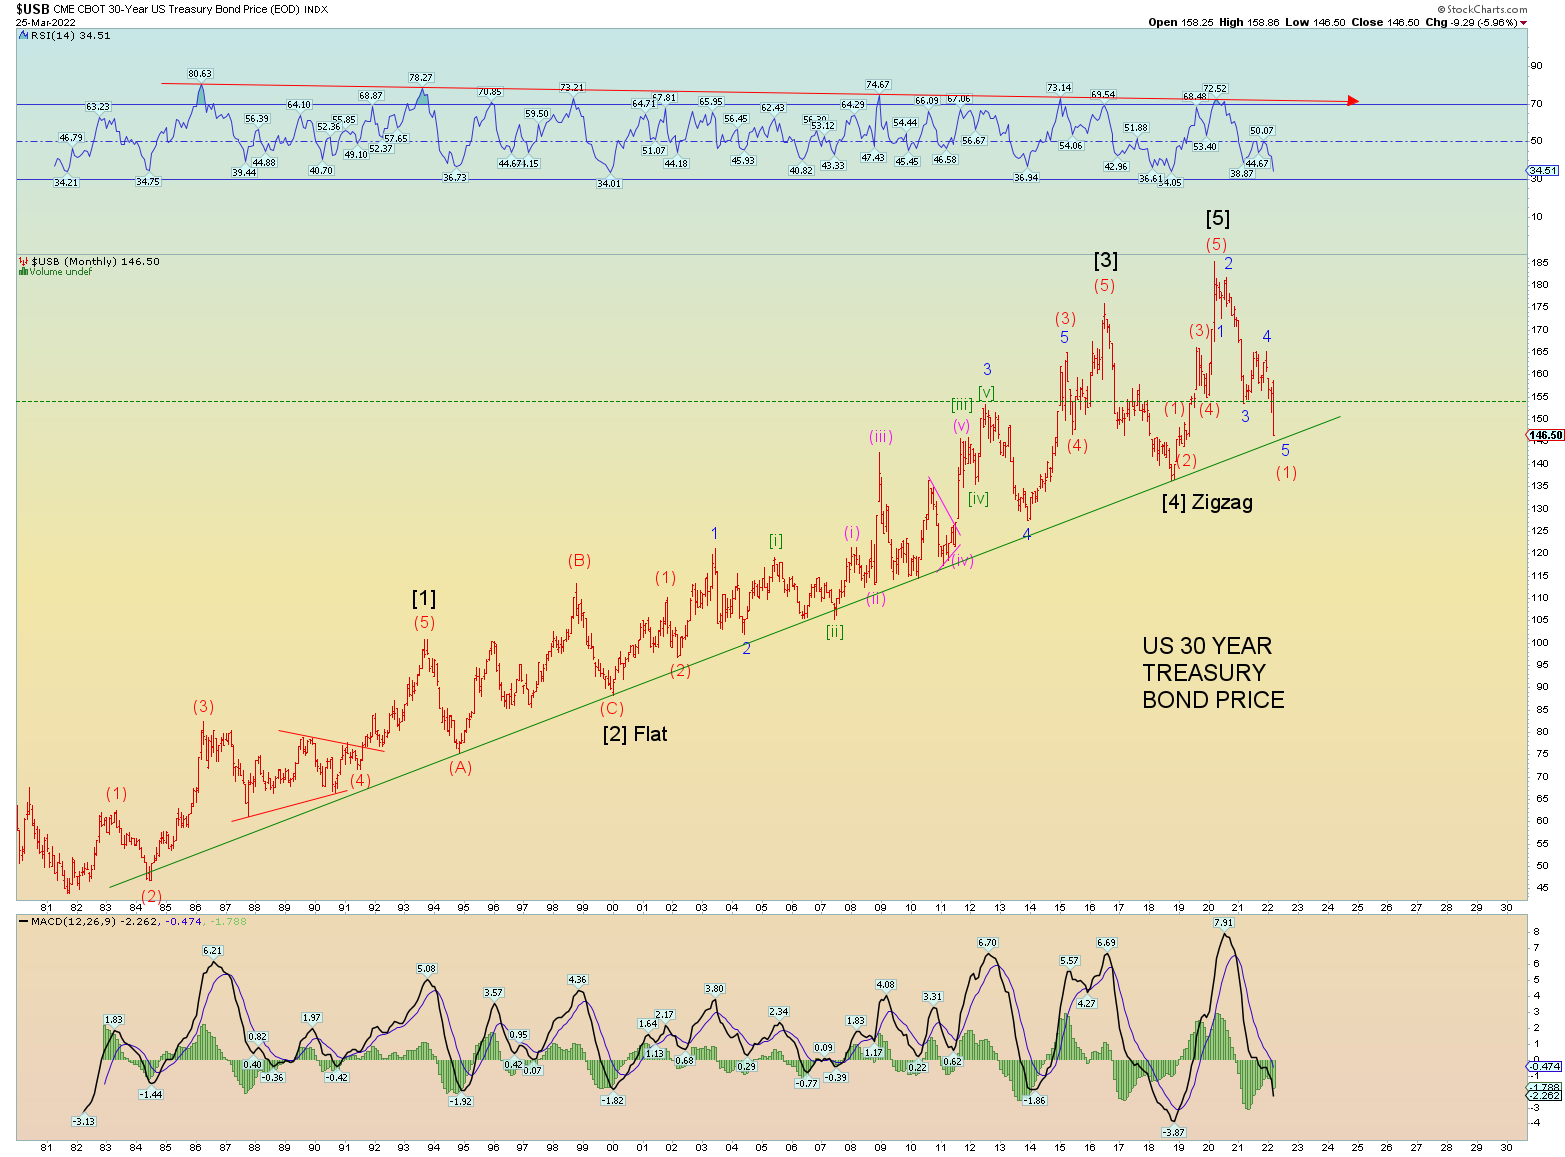
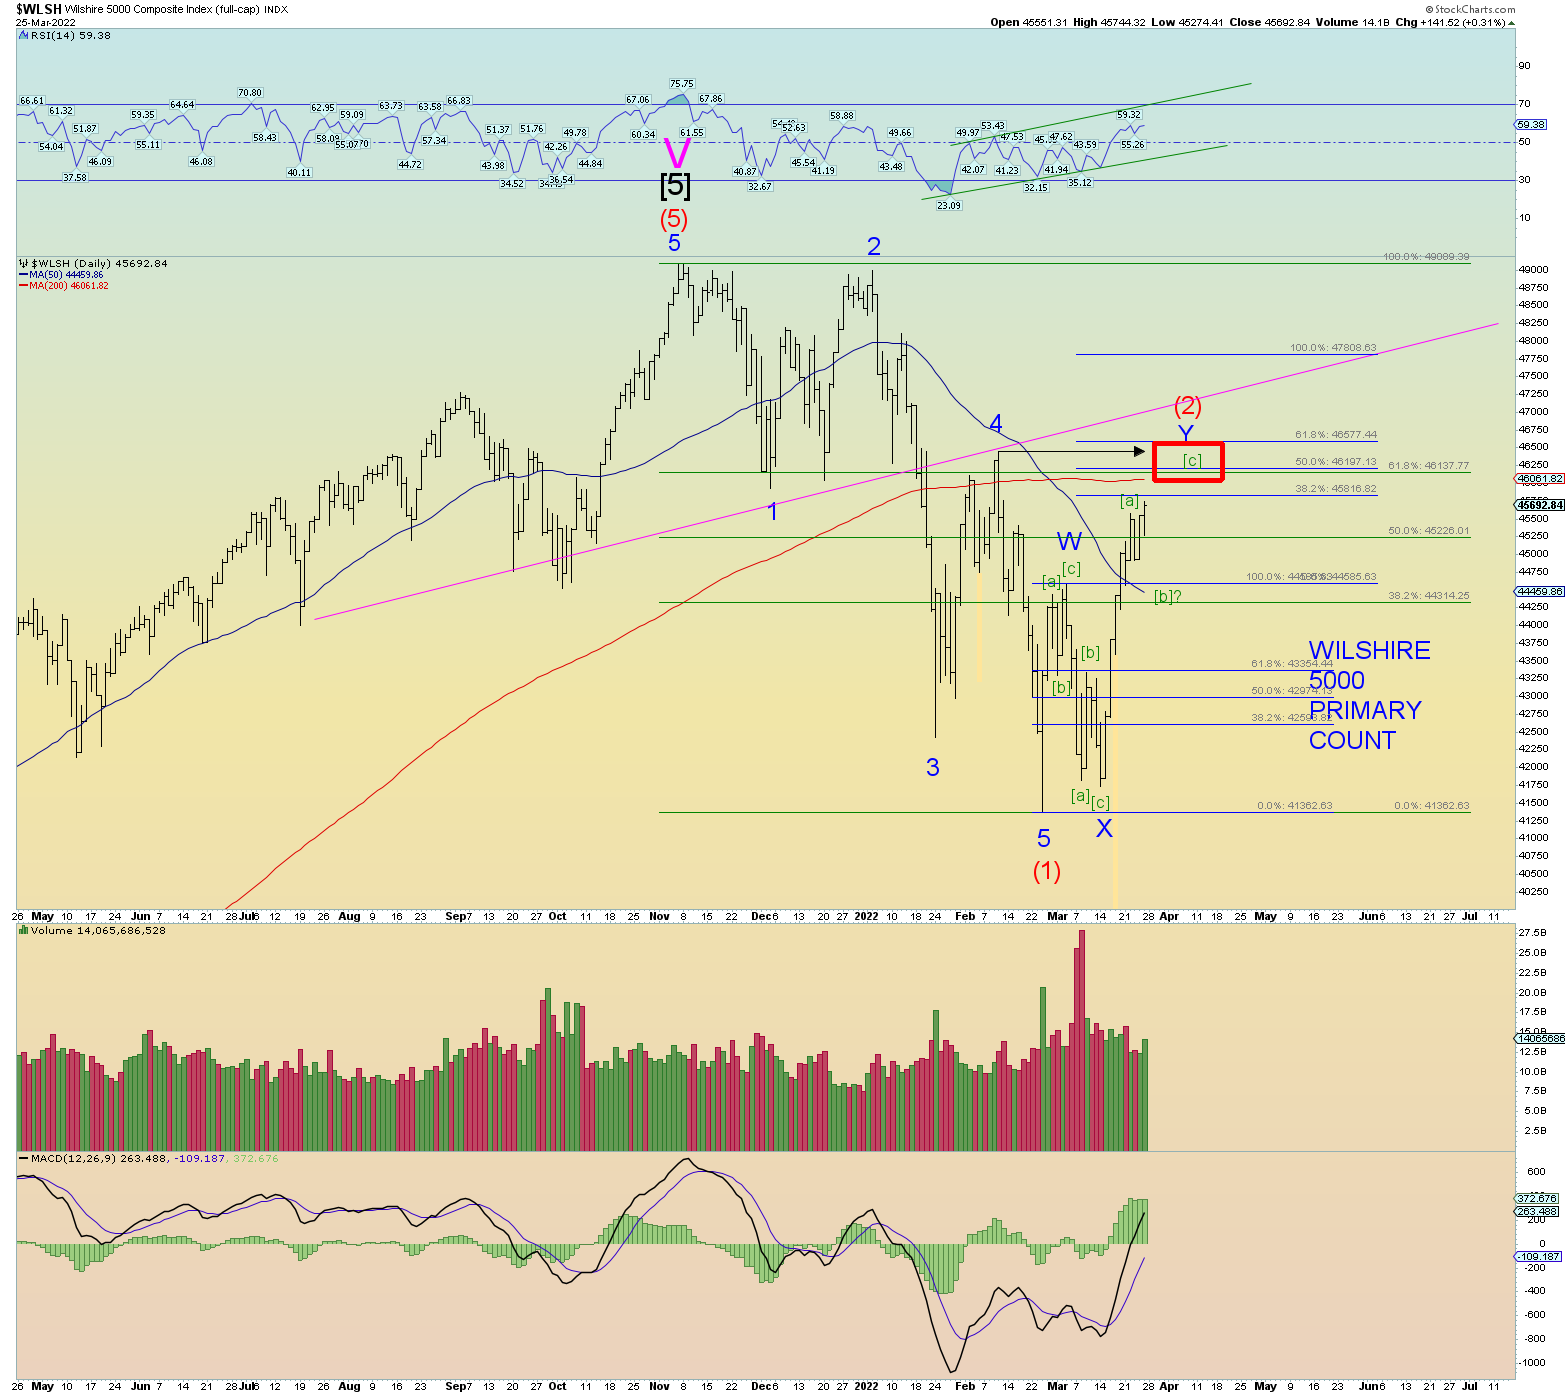
My target line is like a magic magnet. Sort of like the vaccine goo.
And finally, this chart still exists. It’s not the preferred count at the moment but we still have a lower high situation intact.