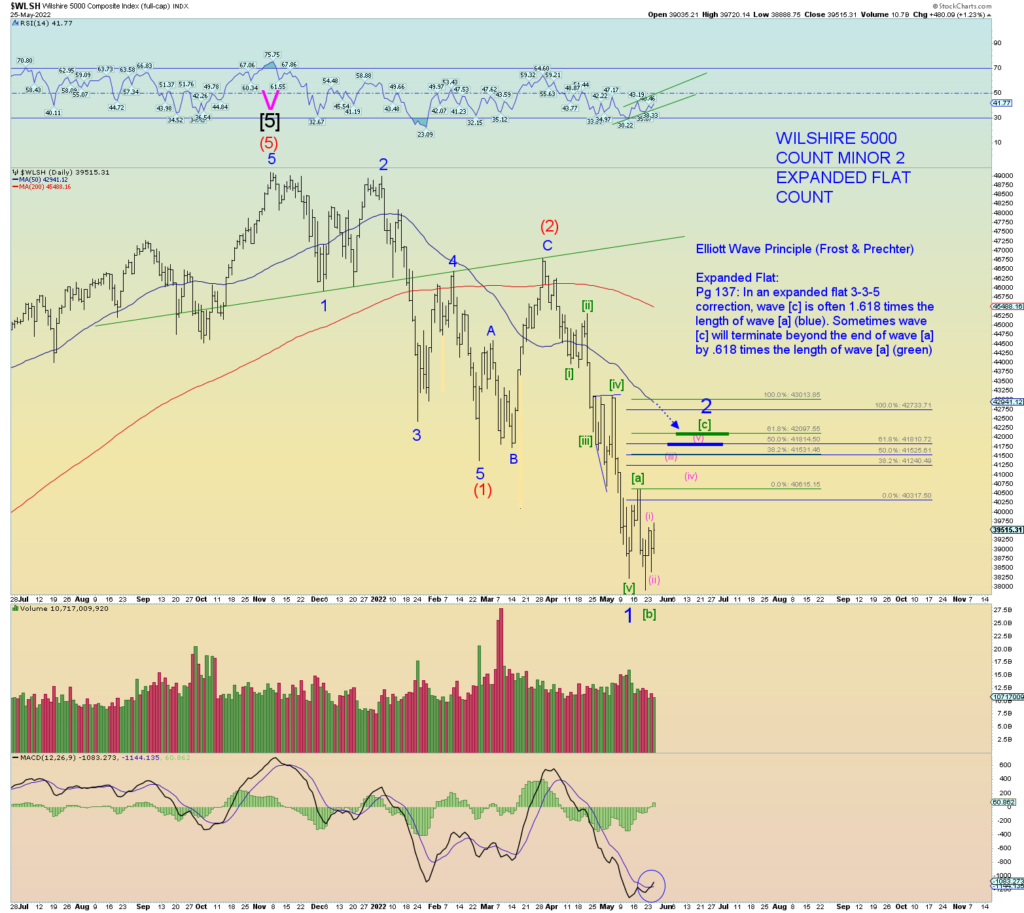
The preferred wave count is Minor 2 of Intermediate (3). This would take the form of an expanded flat count. I copied an explanatory note of typical expanded flat price targets as per Elliott Wave Principle (Frost/Prechter) on the daily chart. This price target coincides nicely with a meeting of the Wilshire 5000’s 50 Daily Moving Average.
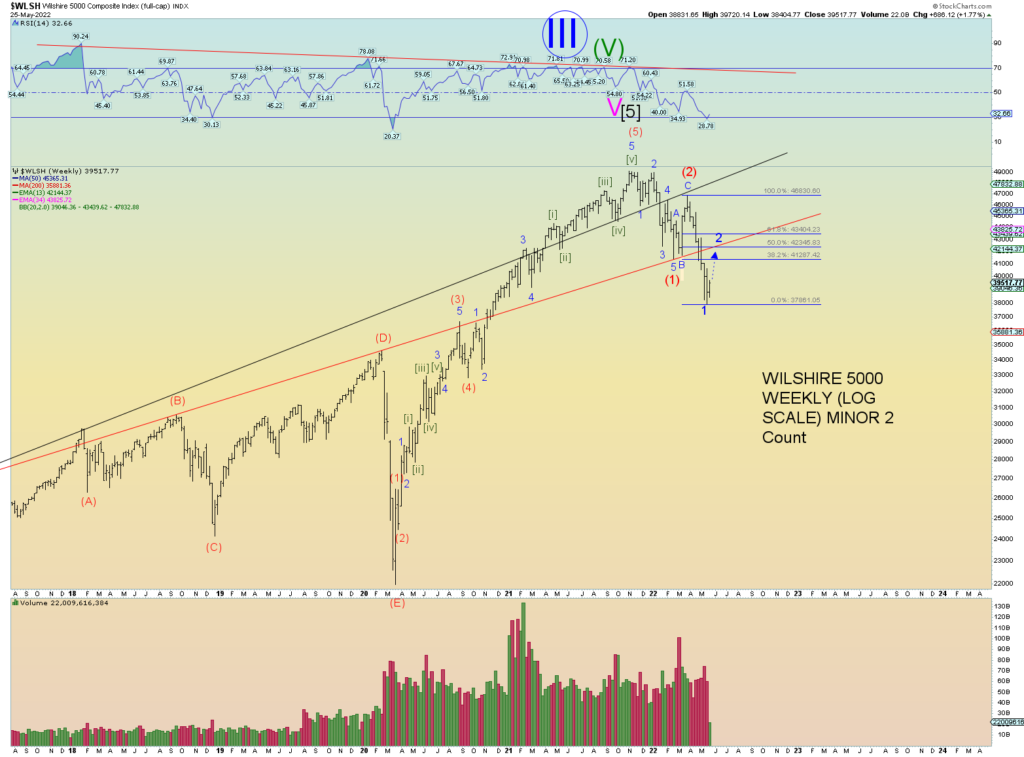
Additionally, it would likely take the form of a “backtest” of a significant channel line support as shown on the weekly.
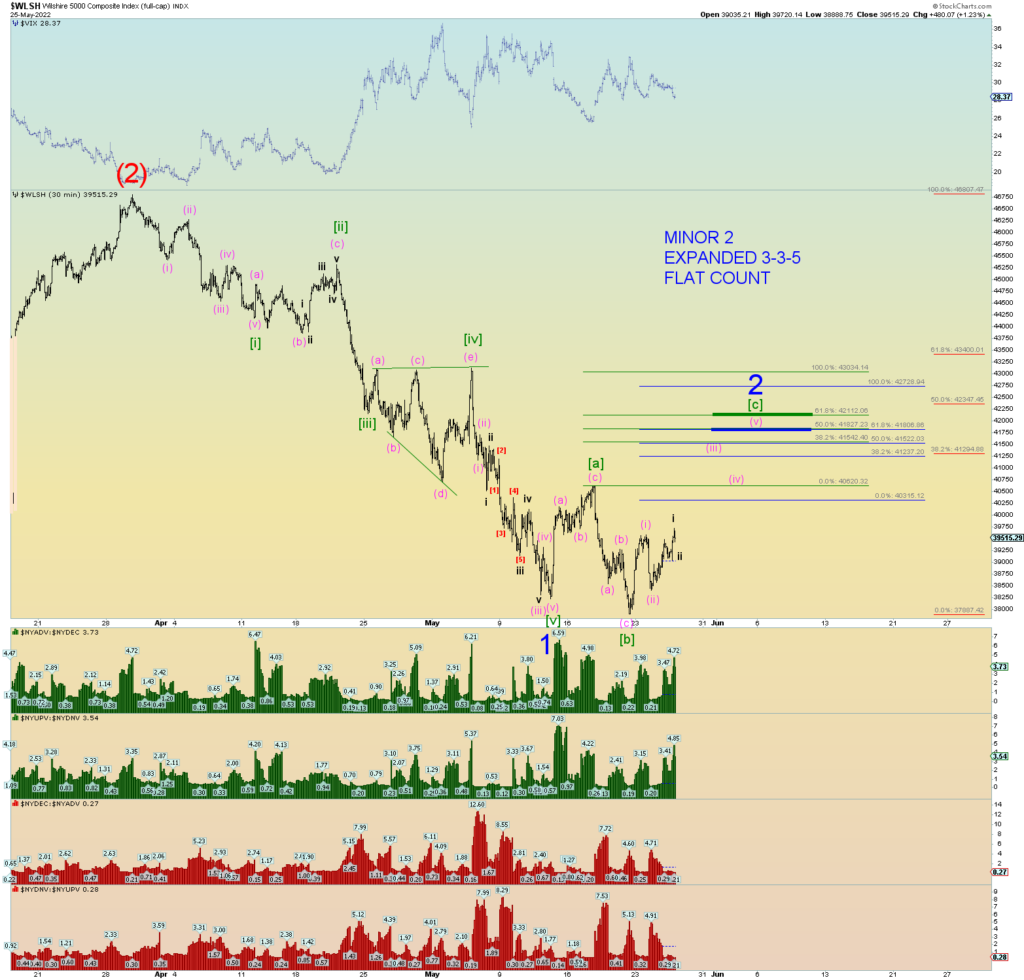
Market internals have been strongly positive, and we have not seen any follow through bearish readings. You can see this on the 30-minute (second chart below) Wilshire 5000 NYSE internal histograms provided at the bottom of the chart.
The daily chart has a positive diverging RSI which suggests prices will go above [a] of 2. This was a similar setup with Intermediate wave (2) going above 4 of (1) peak price. Additionally, the daily has just had an MACD crossover suggesting at least a short-term change of trend, at least until the positive diverging RSI plays out fully.
From a long-term perspective, this count is very satisfying as Minor 1 is longer in length than the next higher degree Intermediate (1). Of course, if the count is correct, this indicates a tremendous bear market in both size and time is coming after this Minor wave 2 correction plays out.
Typically, Minor 2 should overlap Intermediate (1) in price. The Minor 2 target lines satisfy this.
Note that total volume is subdued and supports the notion that prices are correcting the larger down trend, and not necessarily indicative of a market “bottom”.

The preferred squiggle count of the Wilshire 5000. This count at the moment meets as many Elliott Wave rules and guidelines as possible.


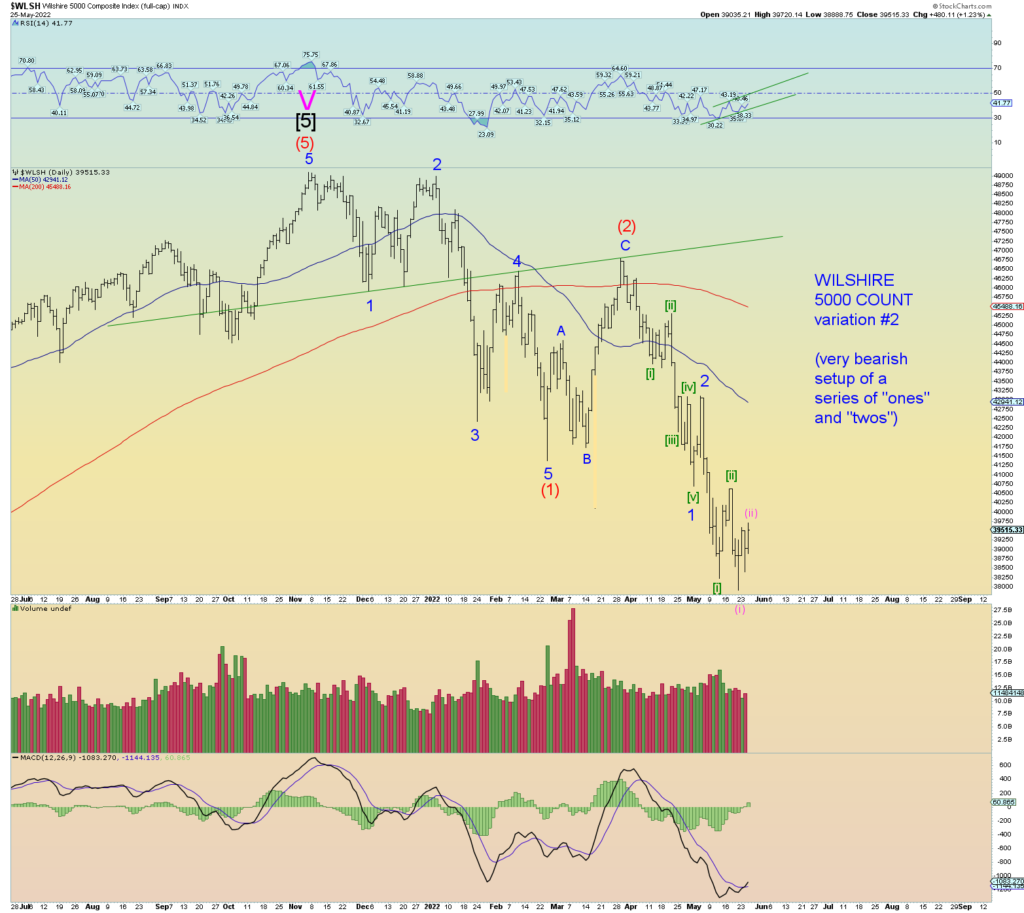
Ok, now let’s look at the flipside, the most bearish count. If we keep things simple, despite the rally today on weak overall volume, the general principle of a series of “ones and twos” stacking up to the downside has not been broken just yet.
Again, I think this is a very dangerous market. The world is on the verge of expanding global war, supply lines are crippled (on purpose), more lockdowns are coming, inflation is destroying wealth, social mood continues to deteriorate, and the global NWO Satanists are openly committed to conducting warfare in various forms on their own citizens. Just look at what is happening in China for instance. Or the baby formula shortage here in the U.S.
So sometimes it is just good to keep things simple. And until the simplicity of this chart is nullified outright, you keep it front and center.
It will not surprise me at all if I wake up one of these mornings and overnight futures are at limit down.
