Today was the strongest market internal up day in the last 10 days. Without yet seeing today’s NYSE “breadth thrust” data, the market had a very good follow through today. I’ll have the official data later tonight.
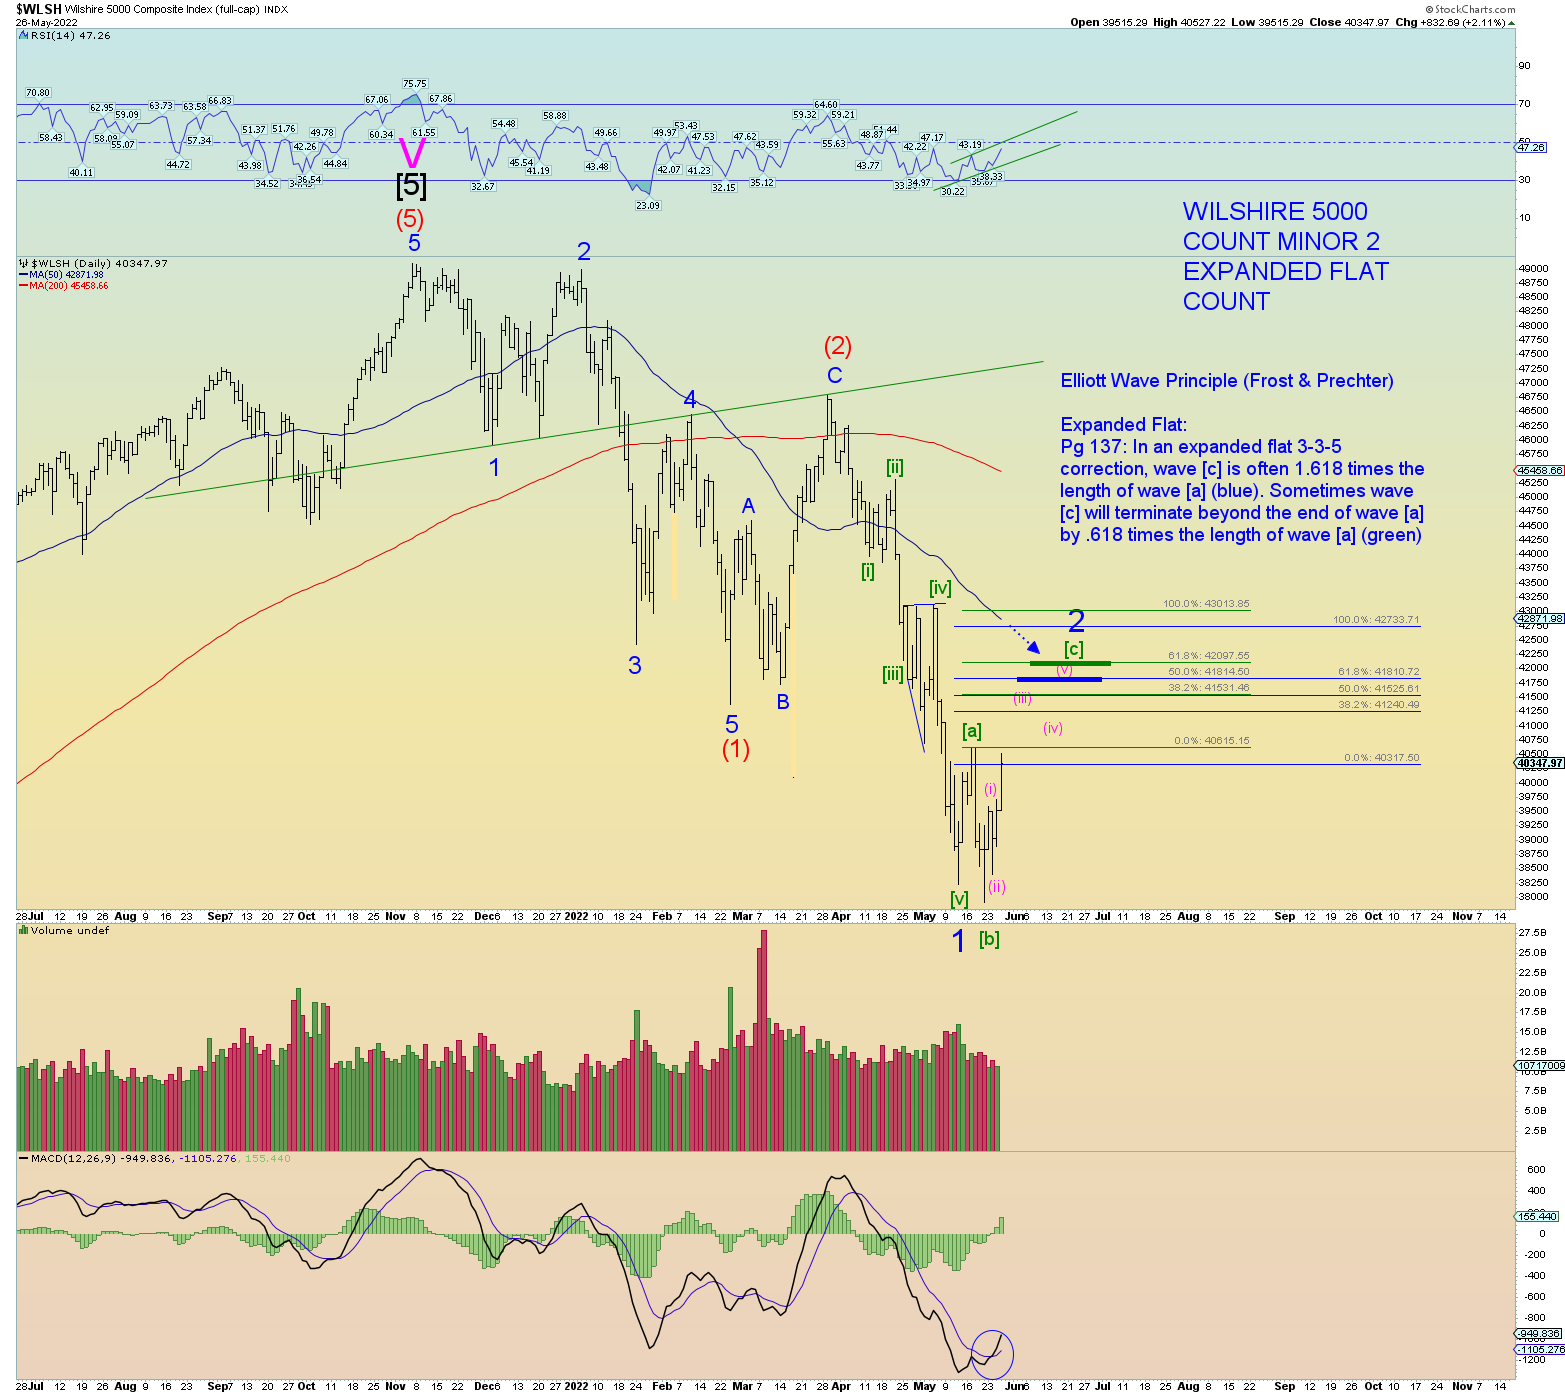
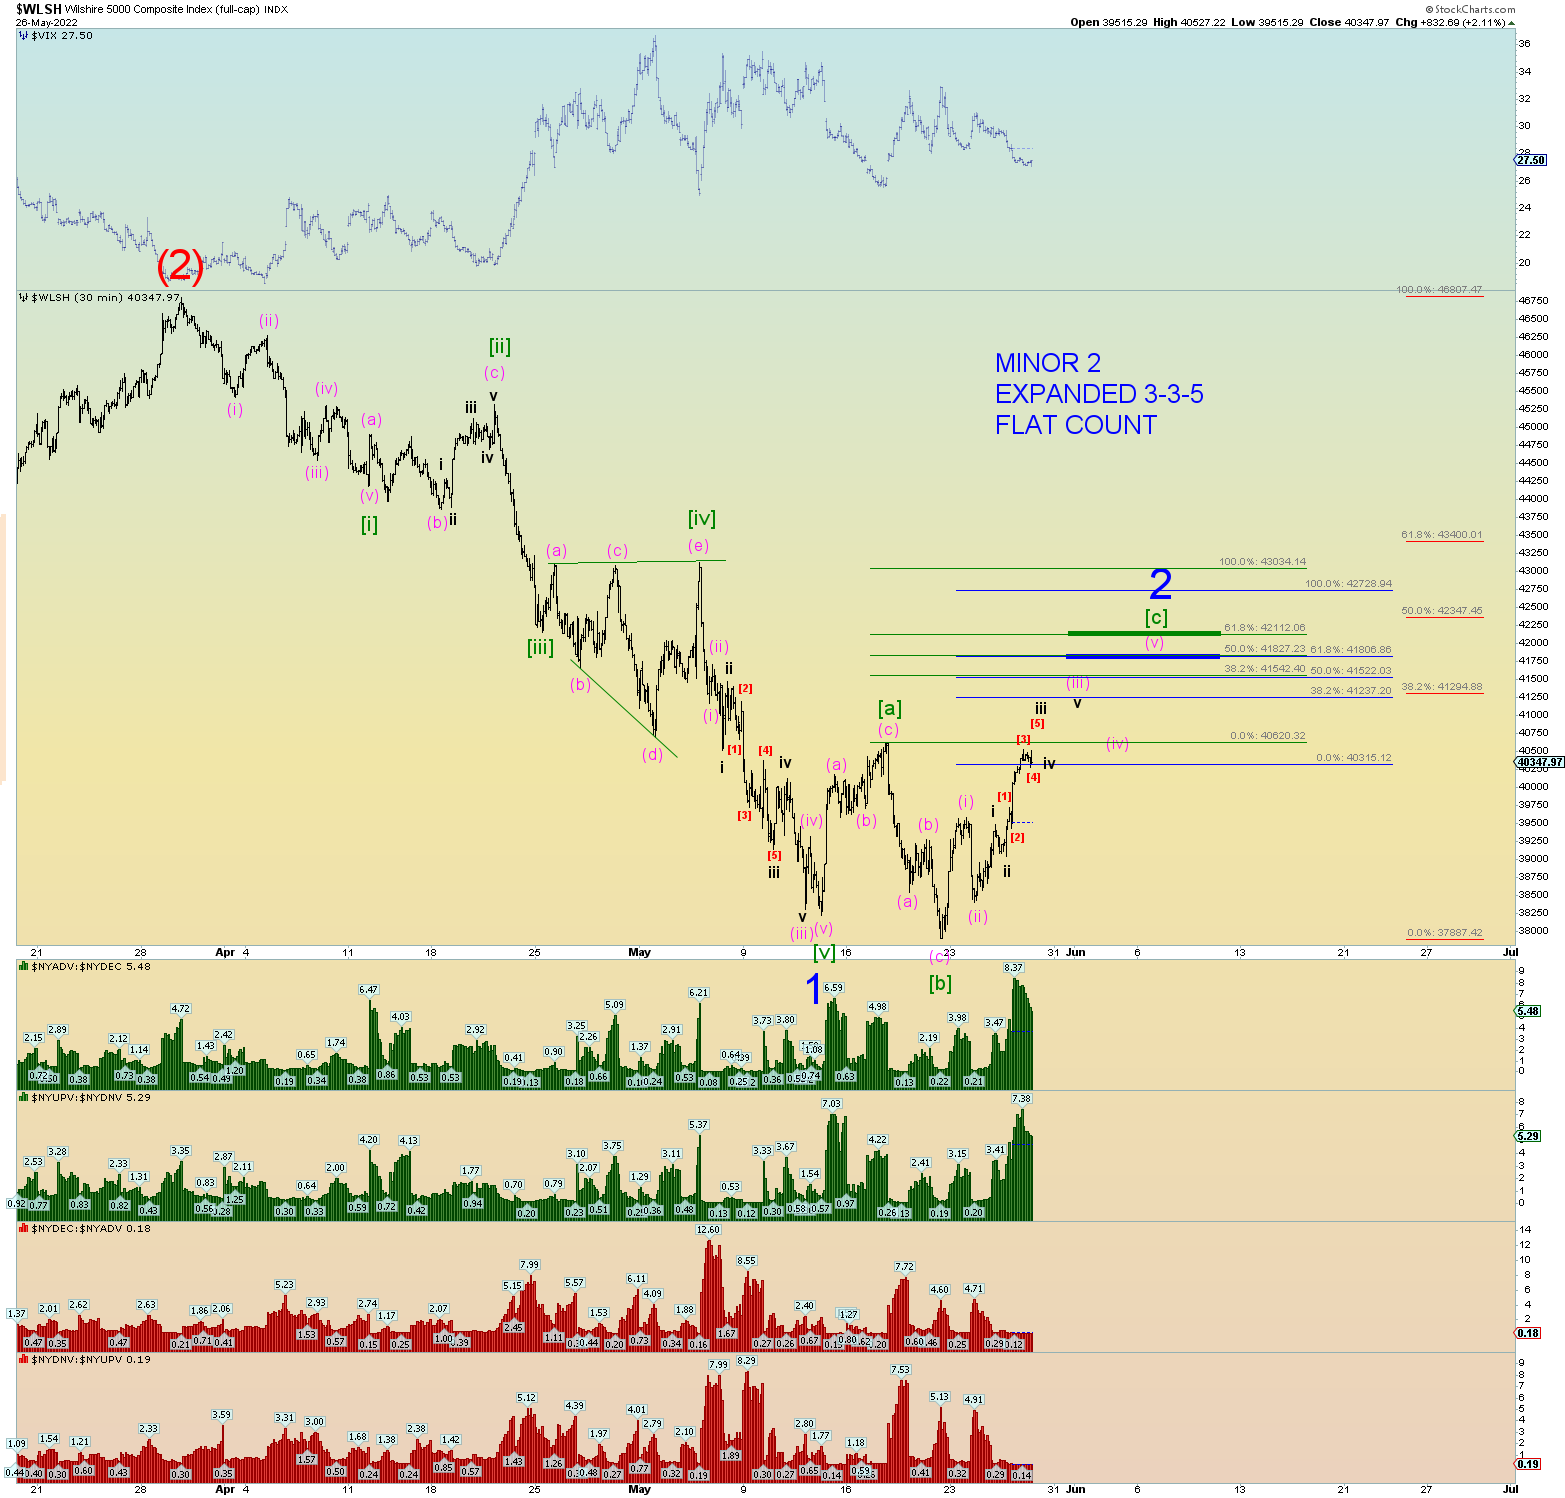
The preferred count remains intact: Minor 2 of Intermediate wave (3).
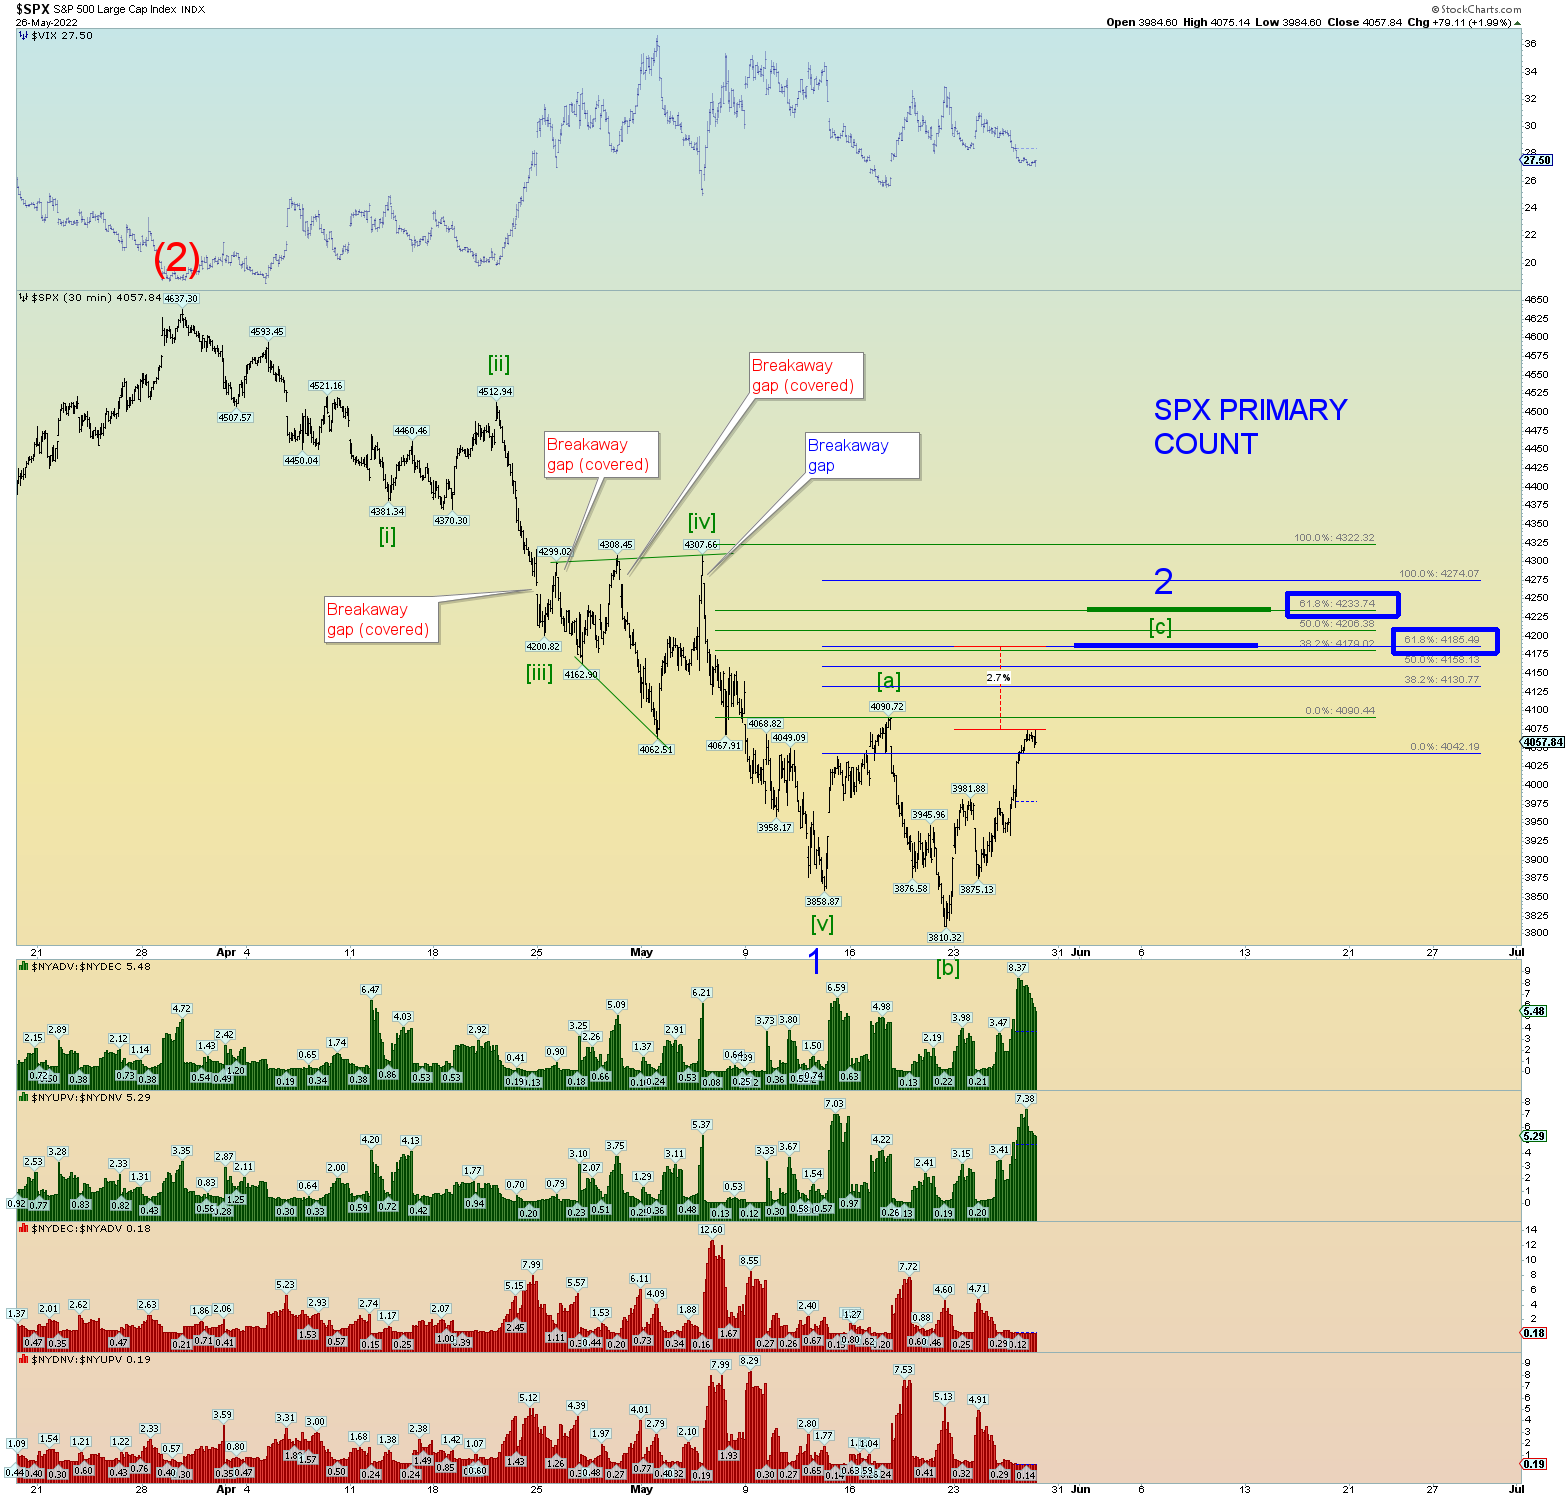
Here is an S&P 500 chart matching the same count as the Wilshire 5000 with the Minor 2 wave target range shown. The range is 4185 – 4233 SPX> The lower end of the range is some 2.7% + higher still.
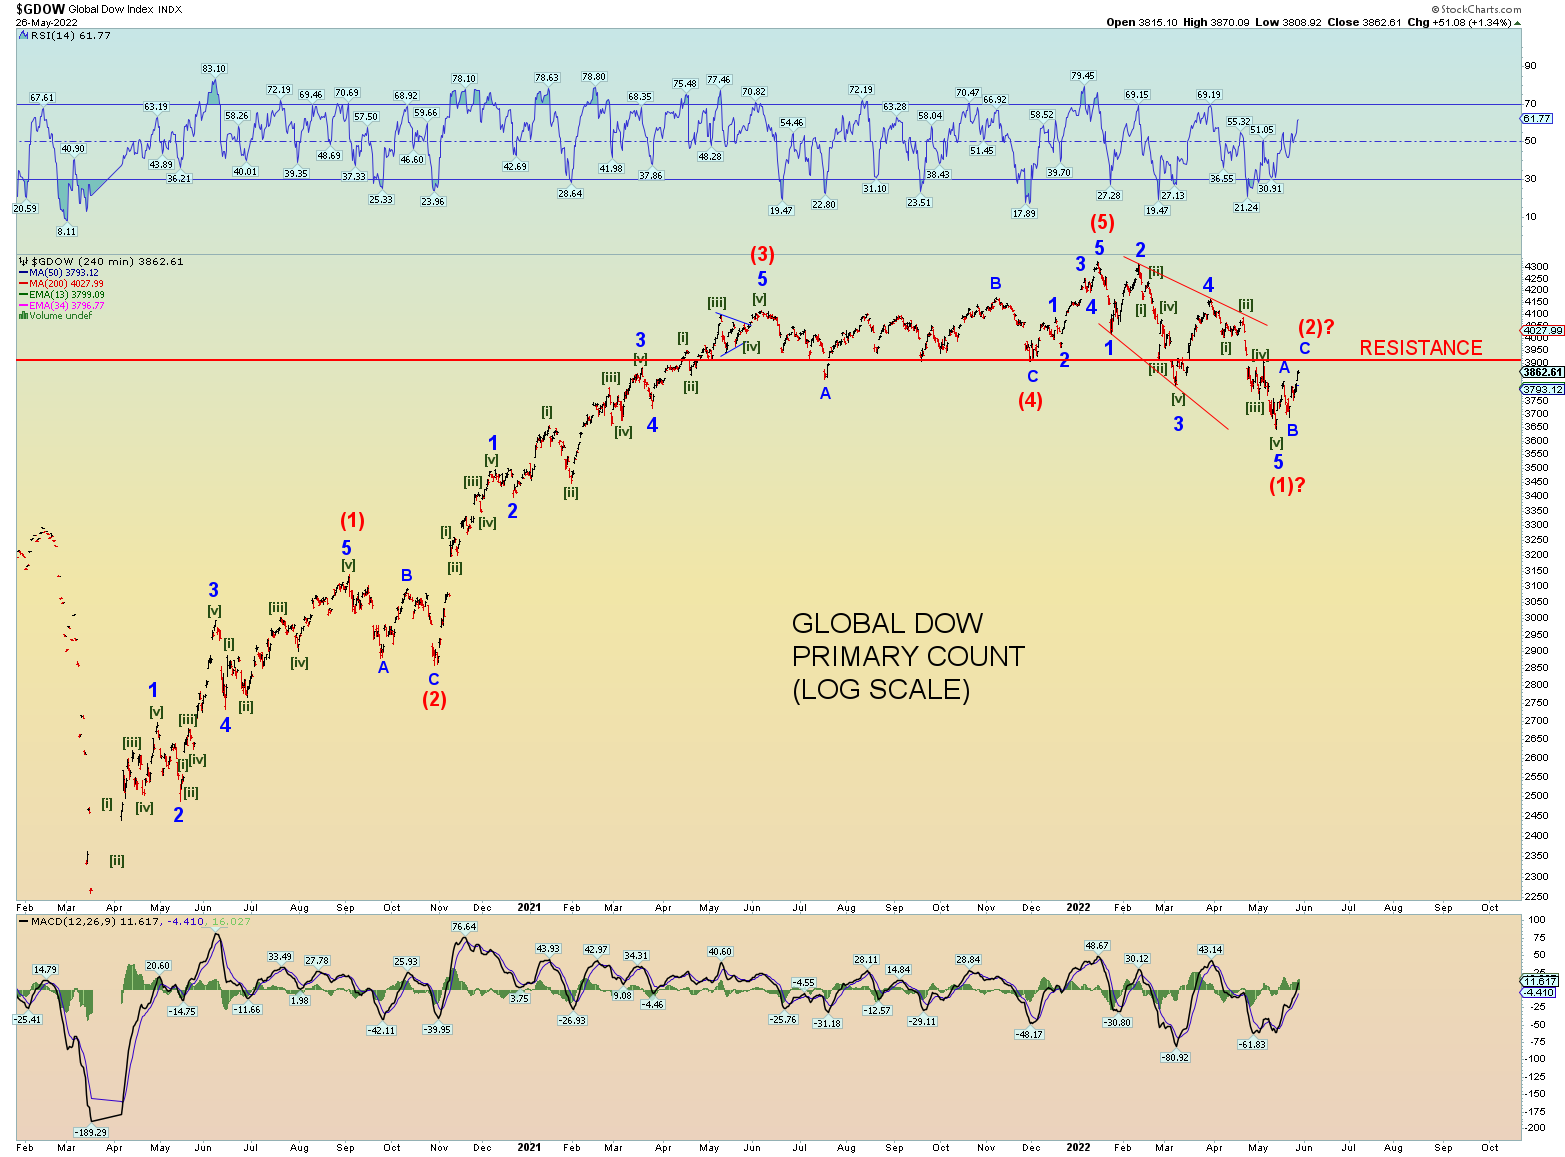
The GDOW is forming a nice A-B-C rally. Note the heavy horizontal resistance. This, in theory, should be difficult to overcome. And thus, the count in that it will not be overcome.
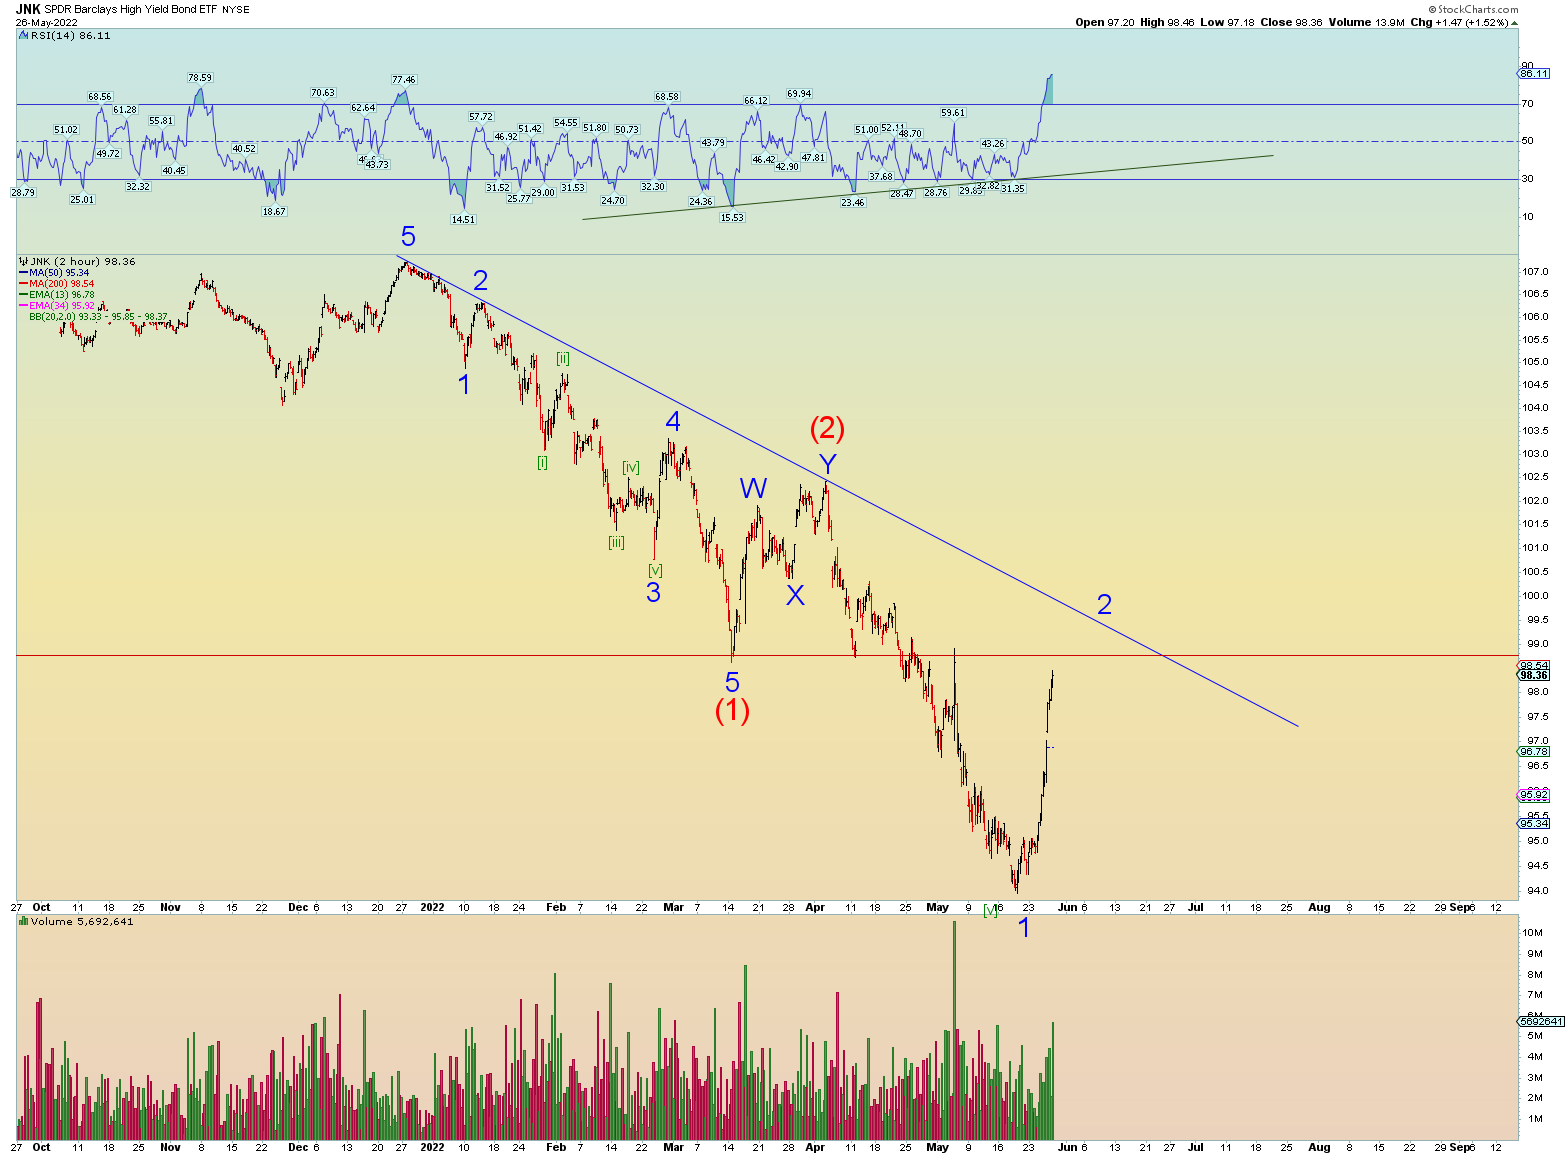
Big “risk – on” again. Junk is soaring. But it was due for a violent bounce.
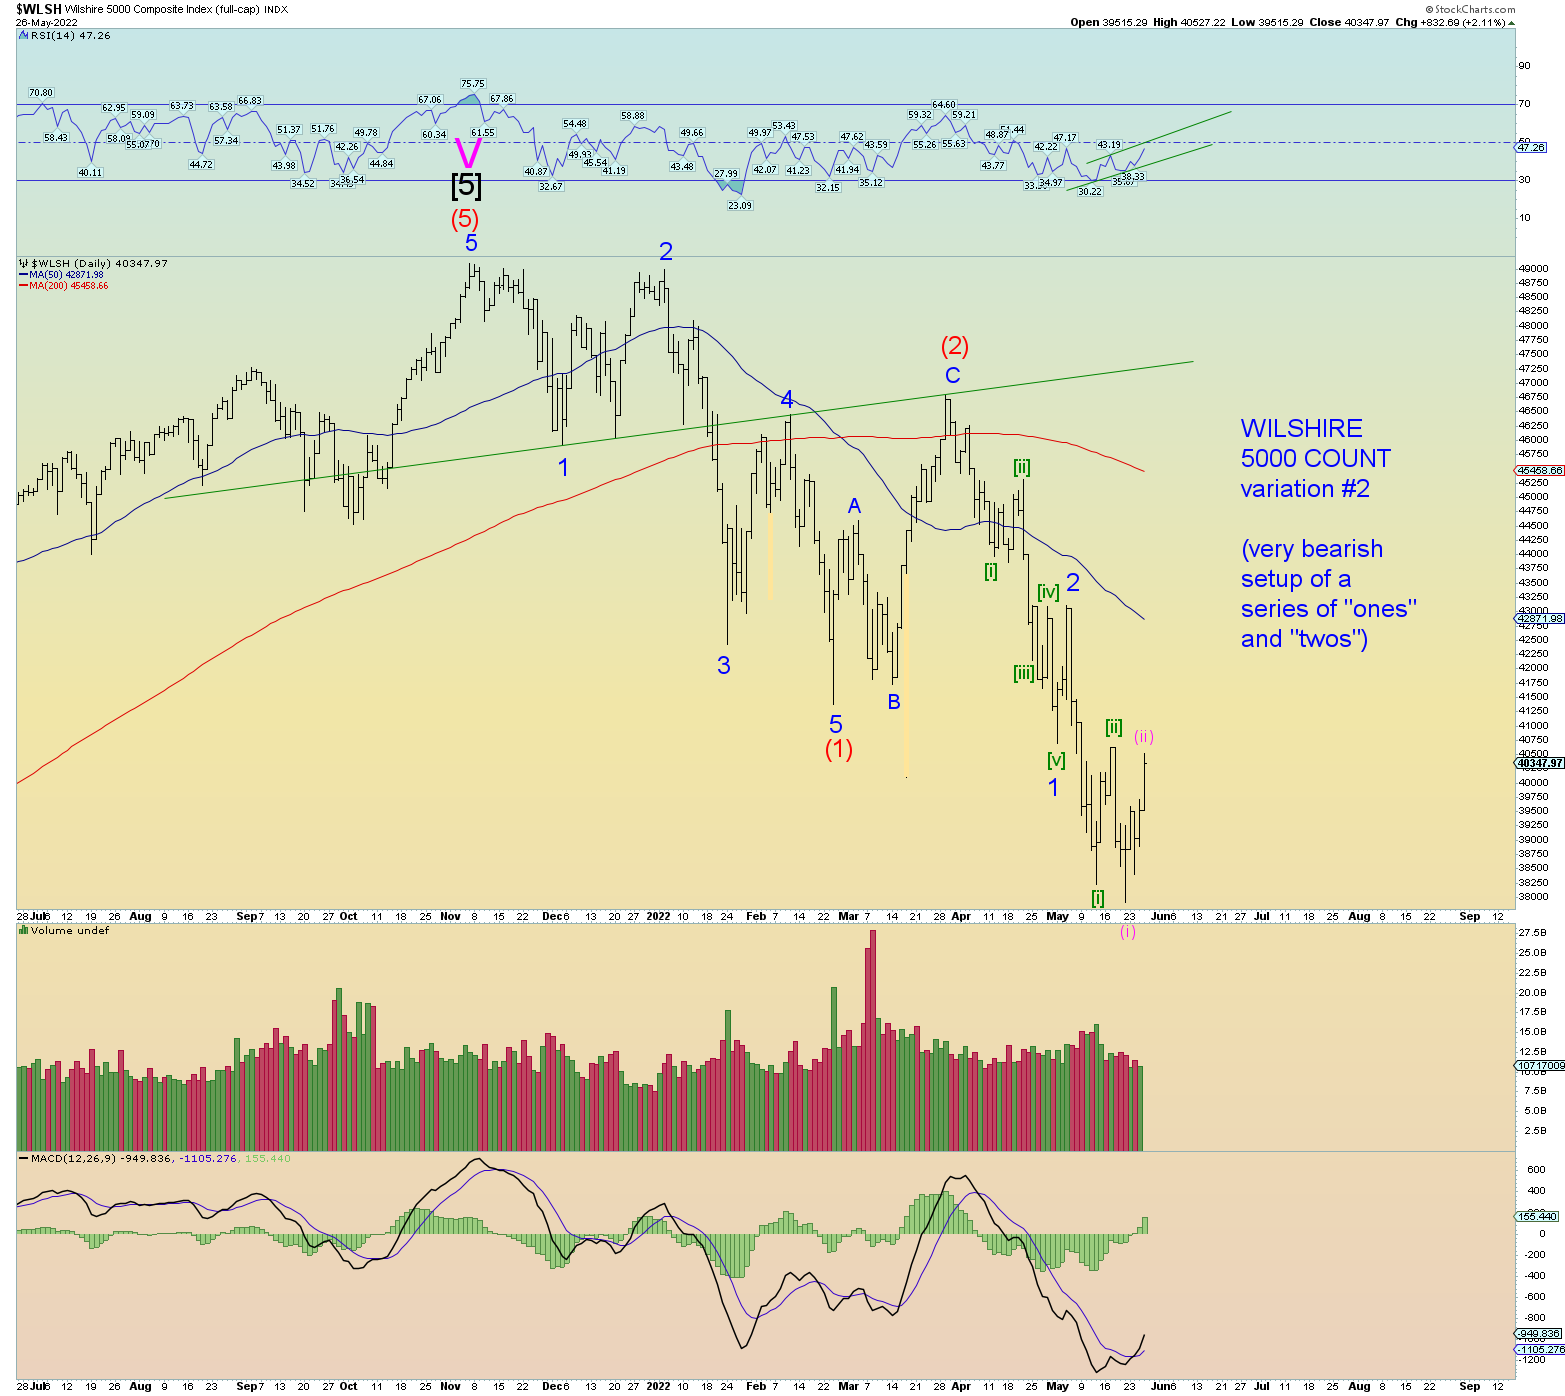
And finally, amazingly considering the market may have just experienced a significant “breadth thrust” event, the most bearish count is technically still not violated. It just goes to show you how deep the selloff has actually been so far overall.