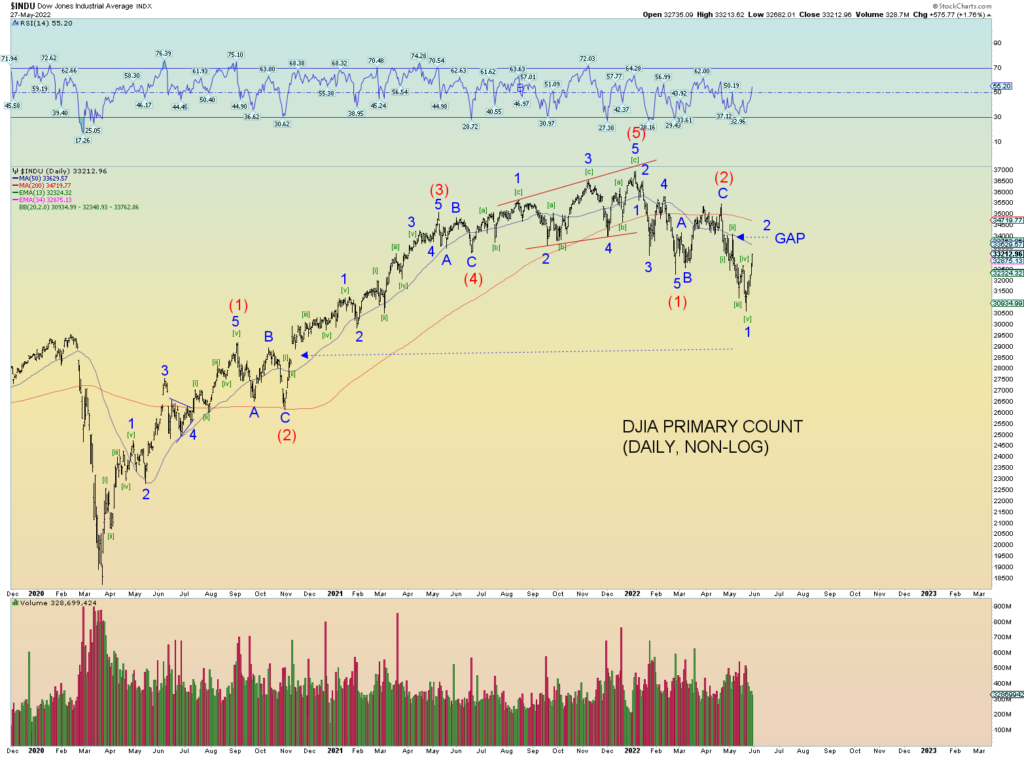
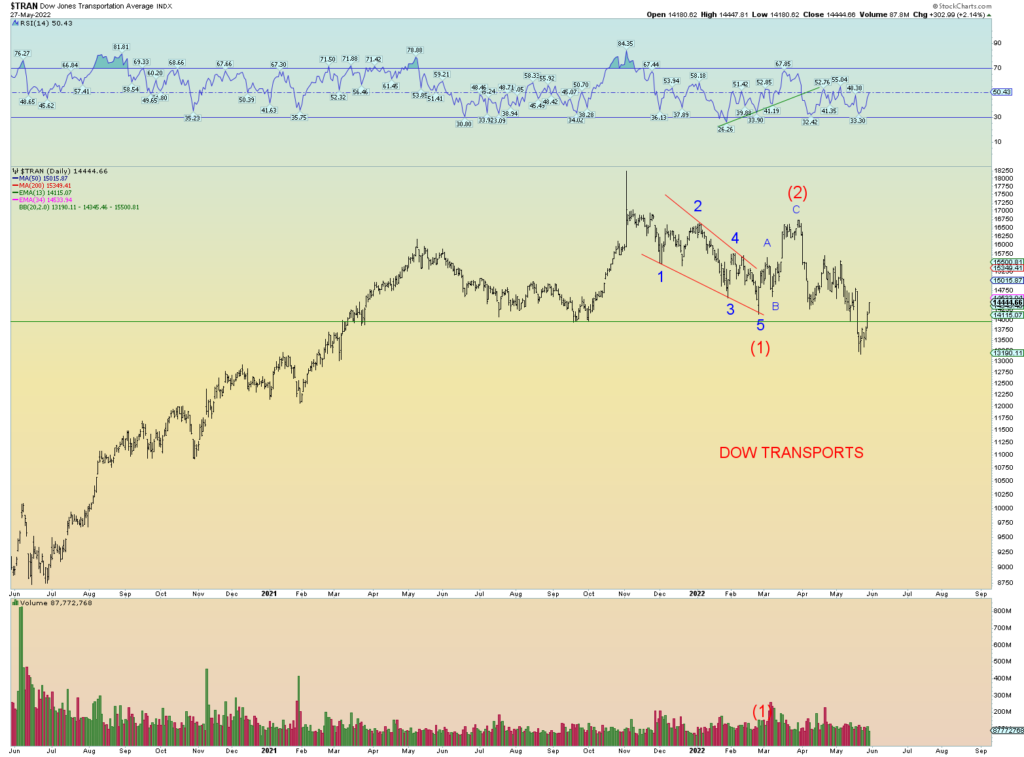
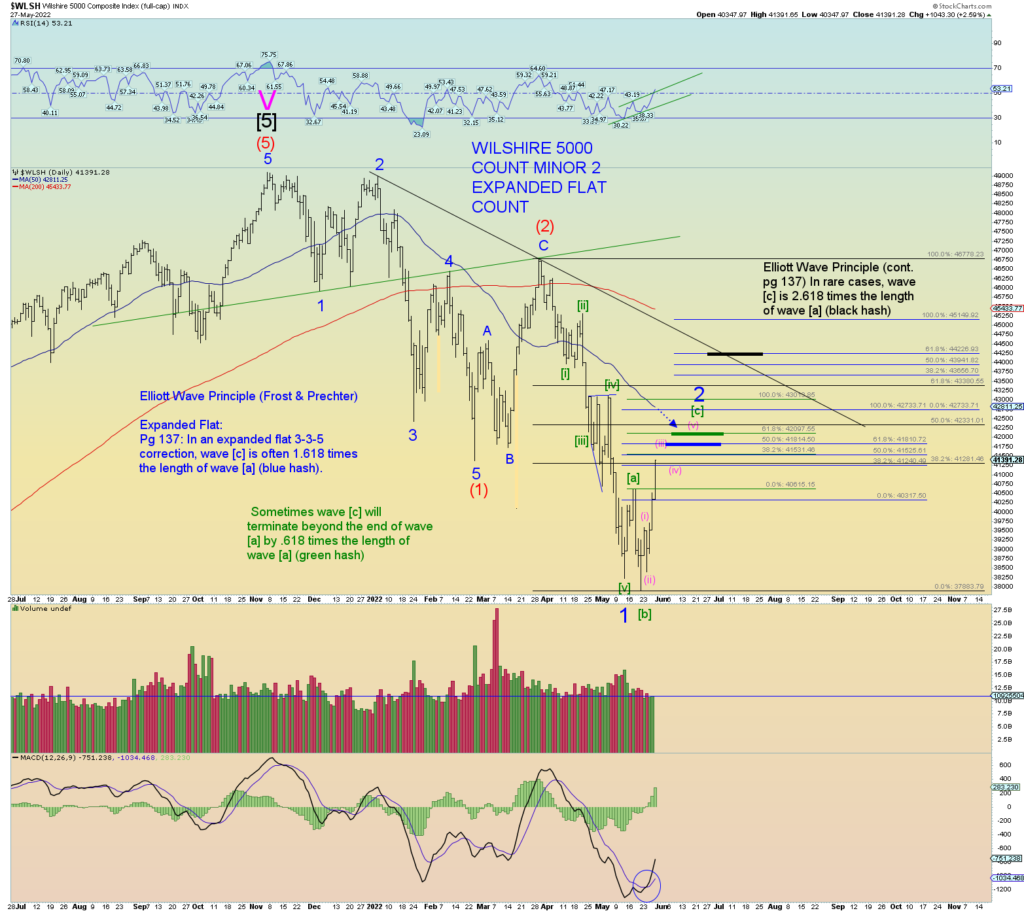
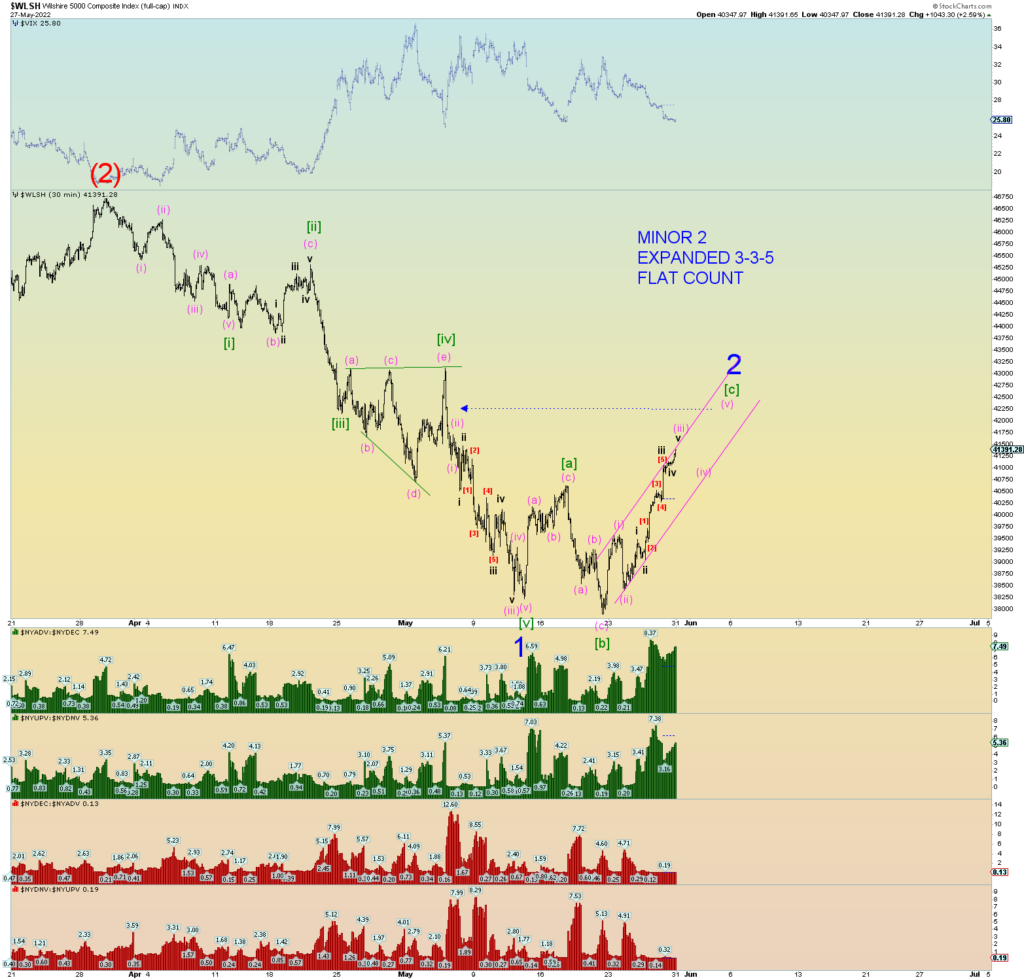
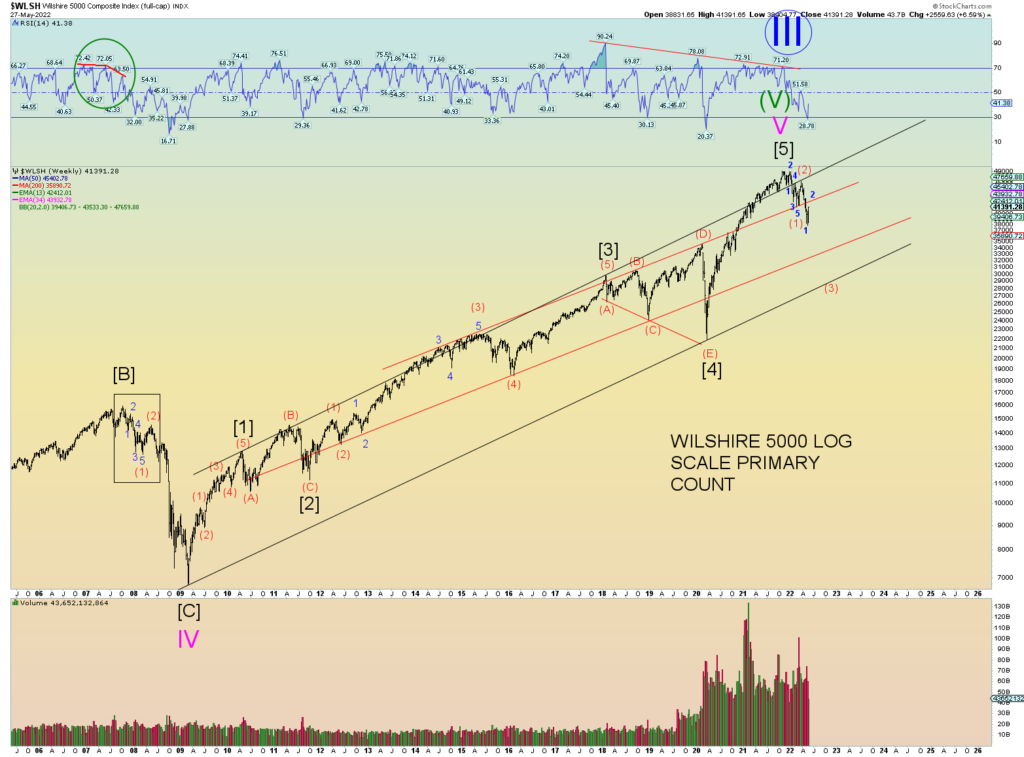
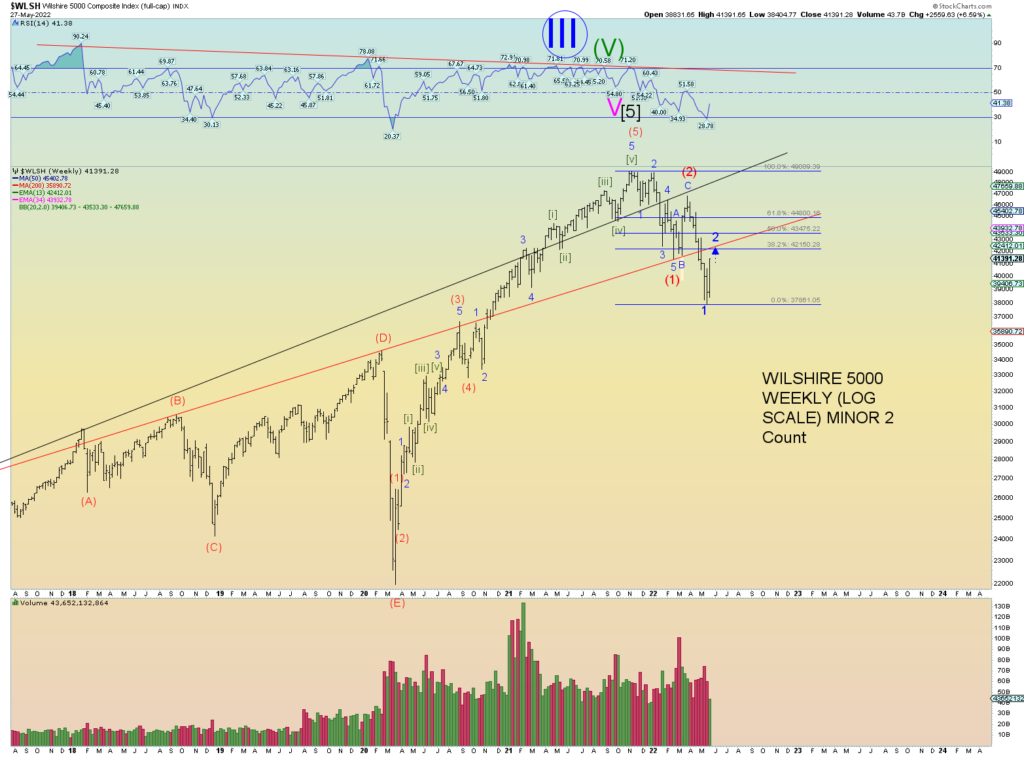
Lots of charts tonight. The primary wave count is Minor 2 of Intermediate (3). Minor 2 is taking the form of an aggressive expanded 3-3-5 wave count. This is where wave [a] and wave [b] consist of three waves and wave [c] is in the form of an impulse five wave move. So far that is panning out just as expected.
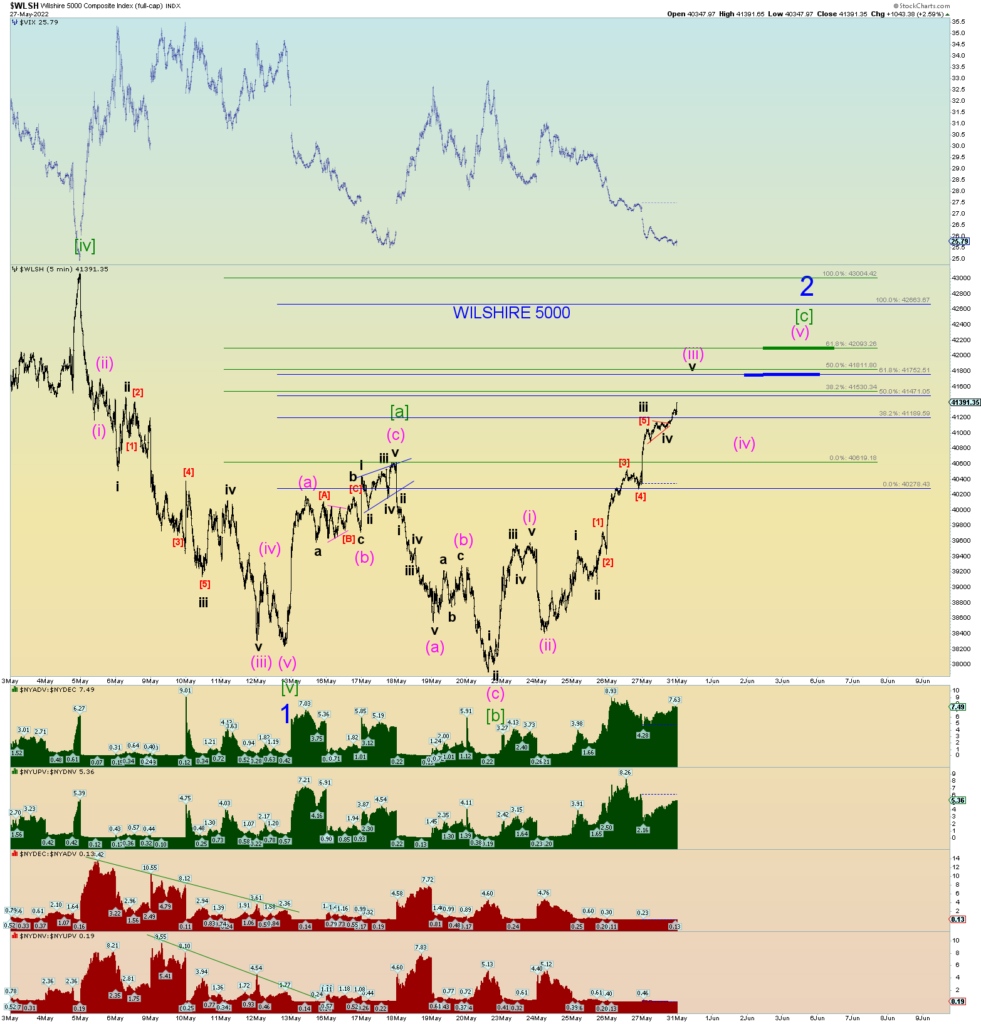
The overall situation is shown here on the Wilshire 5000 chart with 3 target ranges with explanatory notes for each:
Swiggle counts. Overnight Monday futures going into Tuesday’s trading will help determine whether or not wave (iii) has been reached or not.
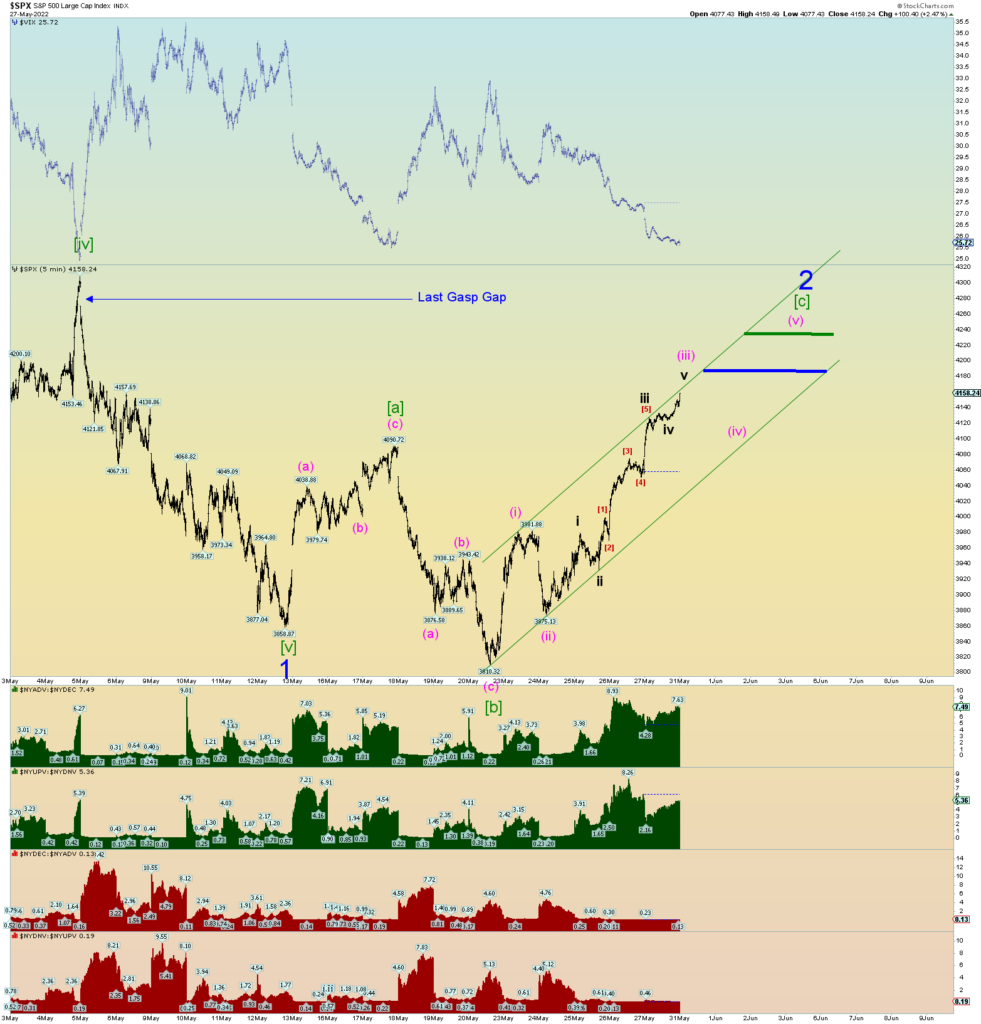
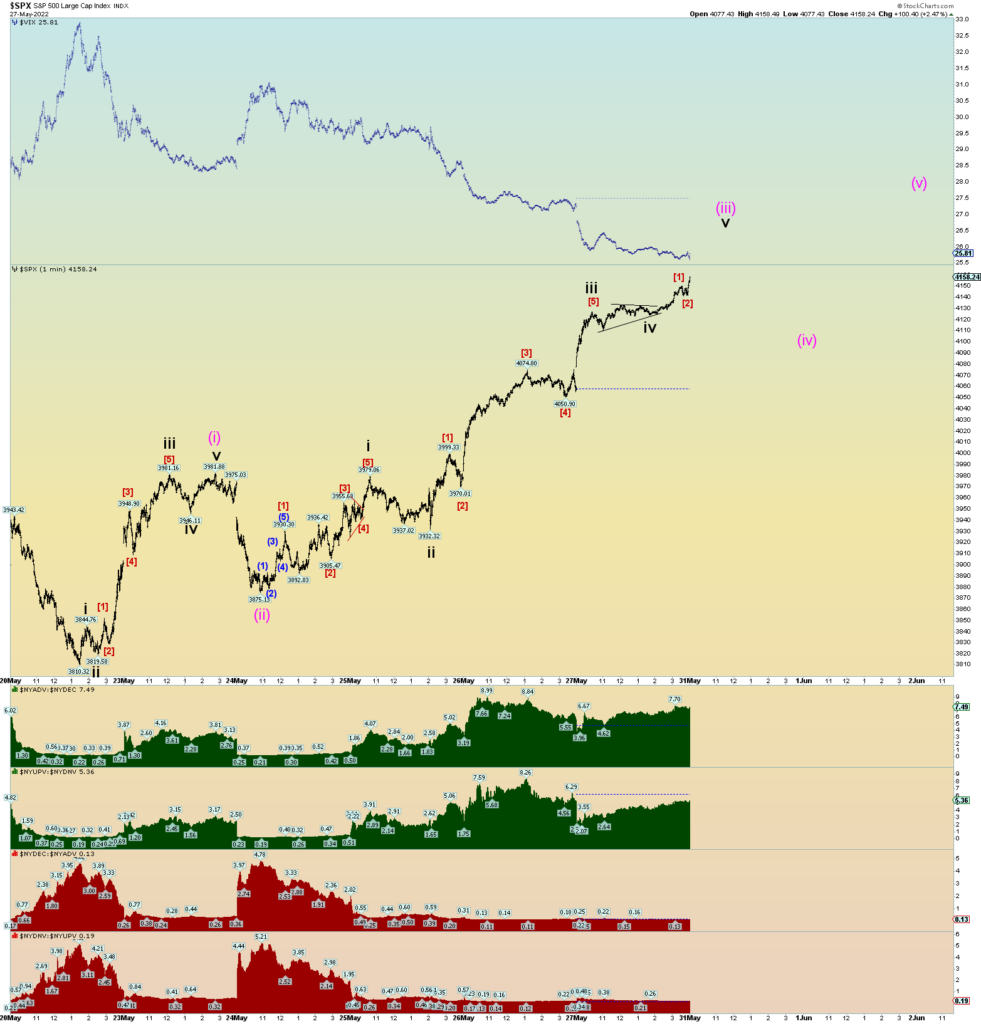
Again, a backtest seems correct.
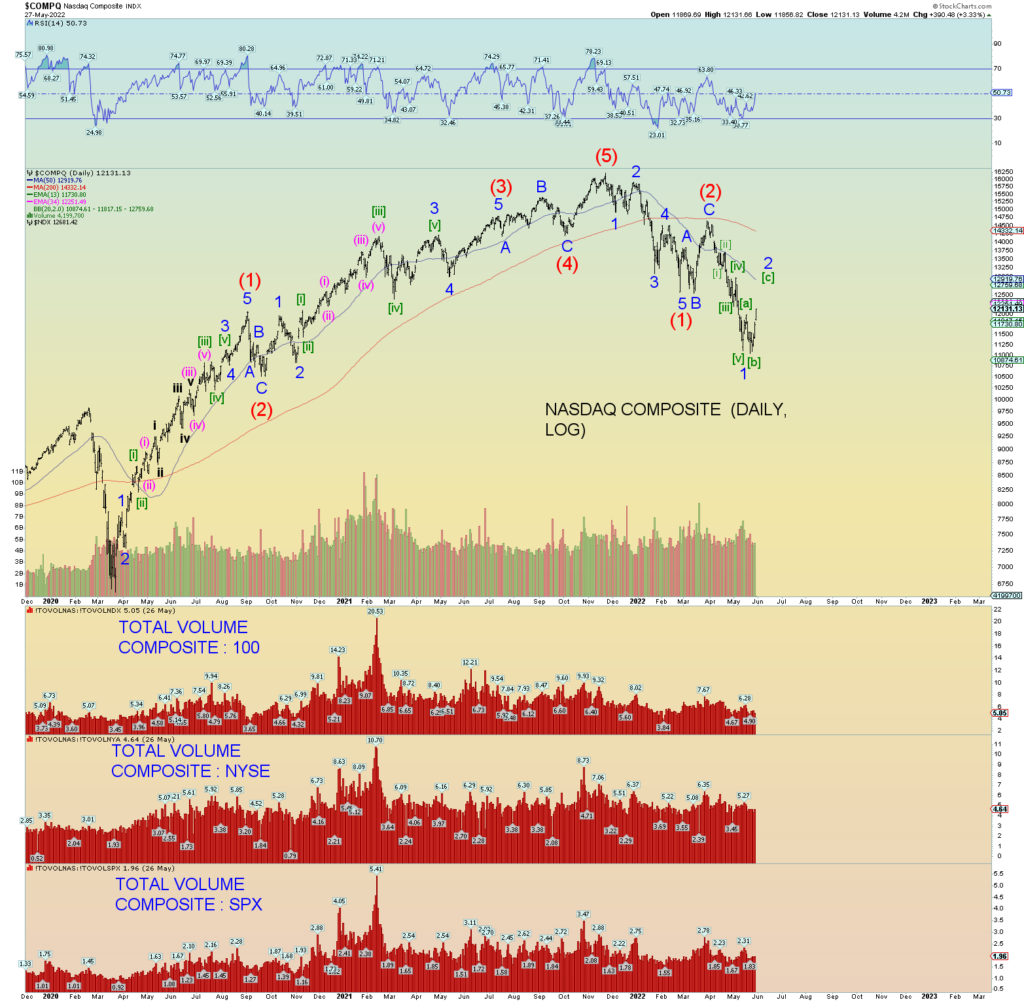
The Composite is still down 25% from peak and not yet even a Fibonacci 38.2% retrace from its wave (2) peak. So, despite the newfound bullishness, you can see just how far the market has fallen already and if people have visions of grandeur on a new bull market, well, it has a lot of work ahead of it.
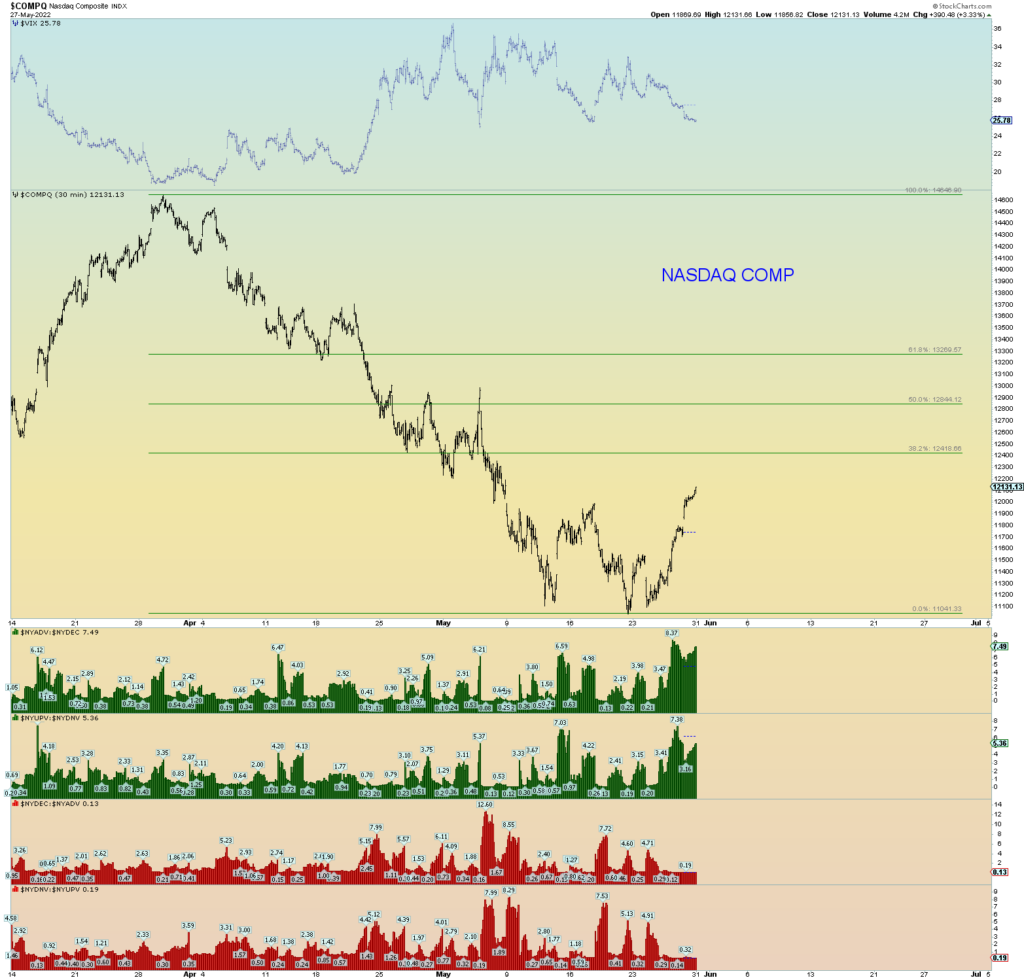
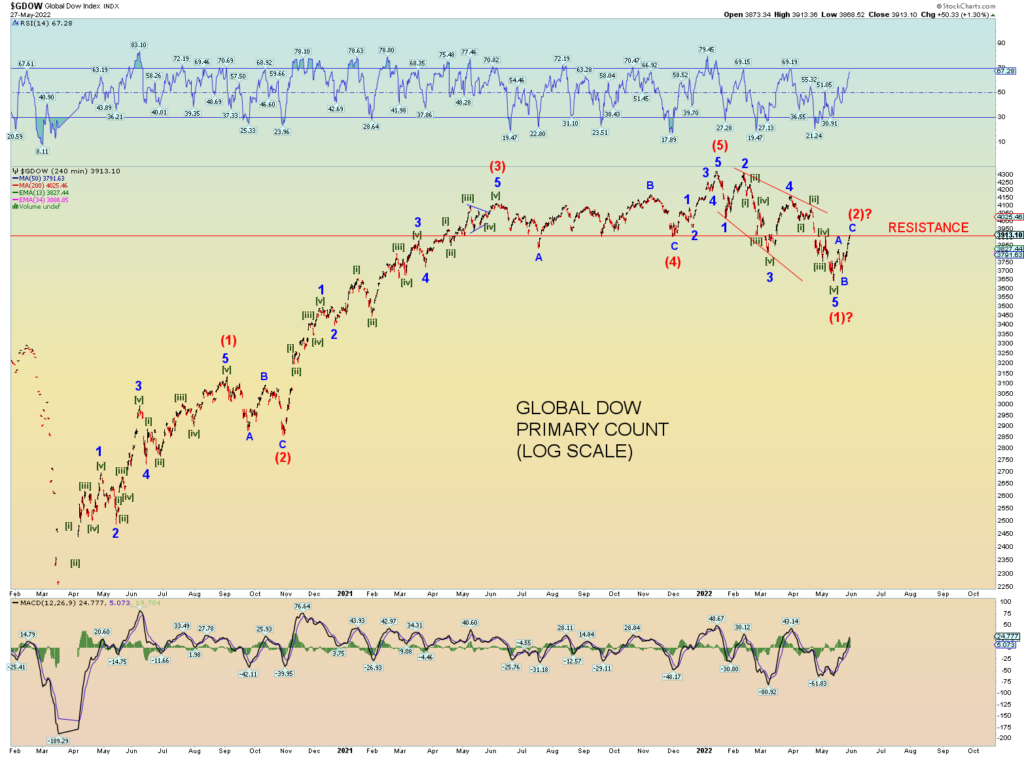
GDOW has met the resistance line.
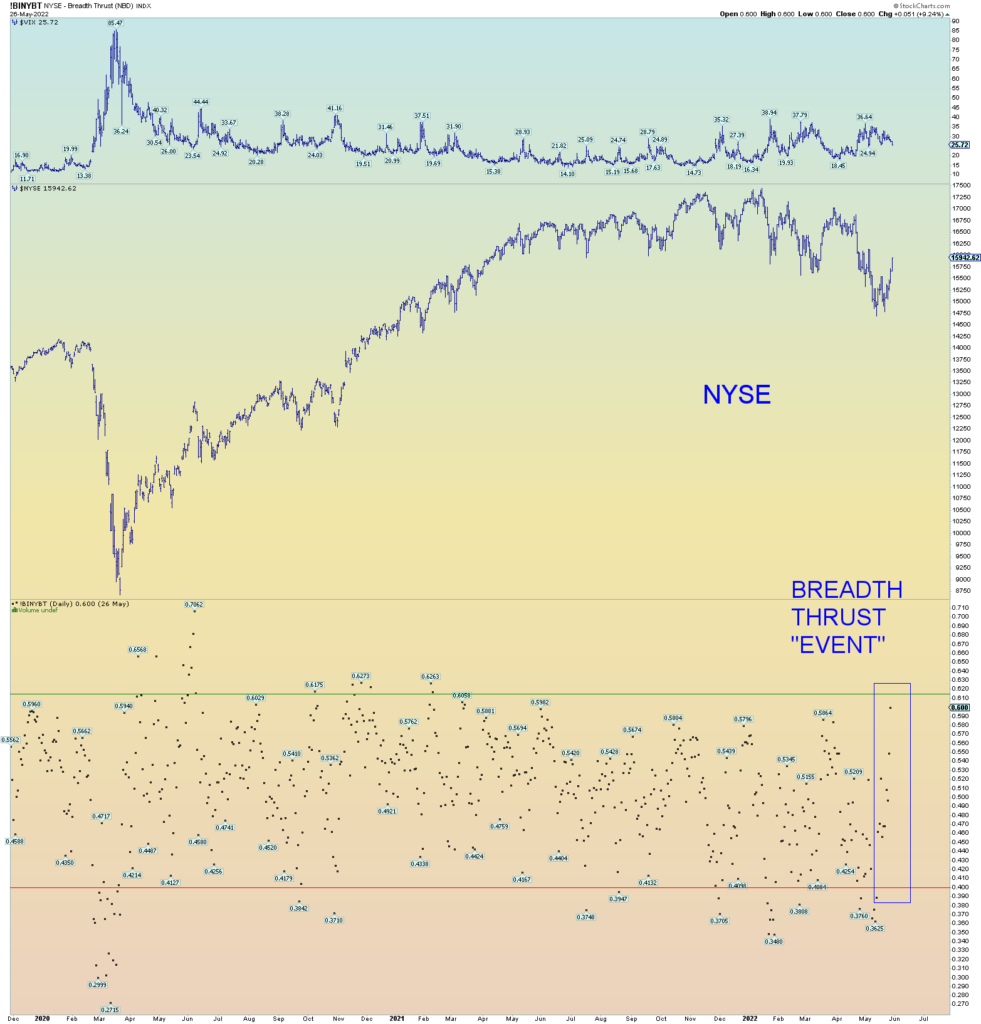
I won’t have the NYSE “breadth thrust” data tonight. But I am guessing a significant “breadth thrust” event has occurred. A close of the indicator above the .61 mark would be quite an event. 11 days from sub .40 to above .61 mark is just 1 day short of a “Zweig Breadth Thrust” event. But as I said, I won’t have that data just yet.
Is this a concern for bears? Sure it is. the remedy for a positive event is to follow it up with a negative event. A “thrusting down” event. The wave structure suggest this will happen. Basically, the “big big” money will ponder this weekend at the prospect of getting out of the market at good prices. “Selling the rip”. This week caught a lot of people off guard (not this blog) and they have 3 days to decide if they will take advantage of it.
Market internals are somewhat a result of how “mechanical” the market has become. Computers determining outcome.
