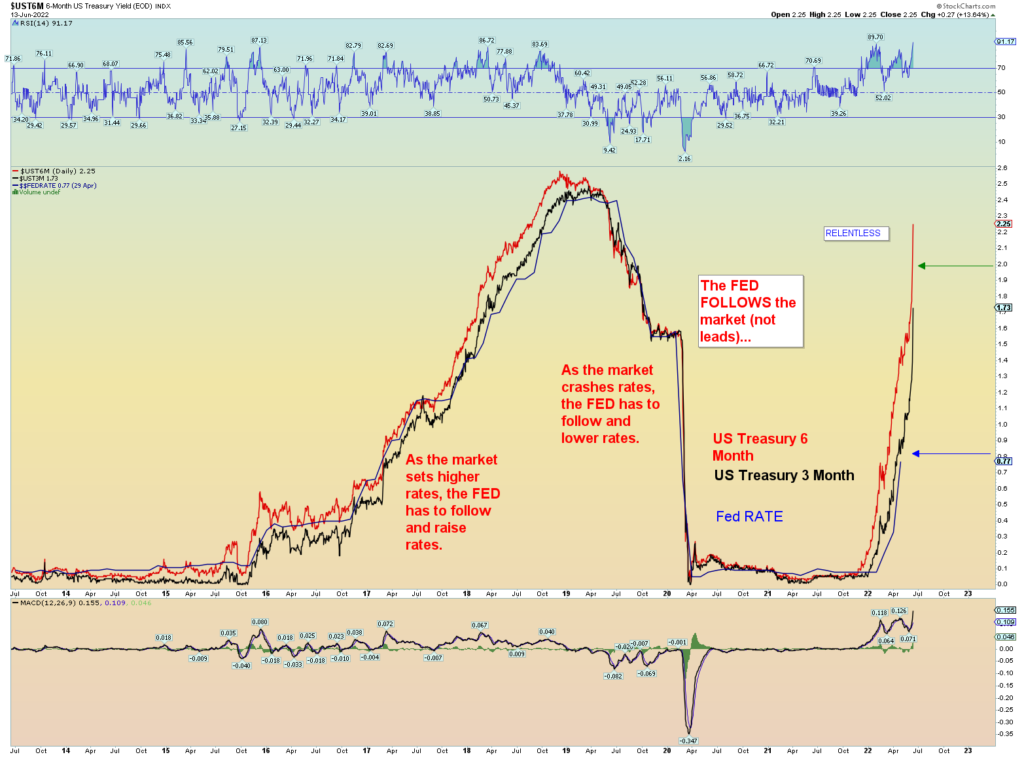
[UPDATE:] I added the 3/6-month yield spread chart. A .50 hike is not going to cut it, a .75 is surely coming at the very least. A full one-point hike would shock the markets, yet the charts support it.
Remember, many Fed and high-level bankers secretly attend Bohemian Grove and Jackson Hole demonic rituals. In the long run, their marching orders are to tear this market down. The long running “paradigm” of the Fed always rescuing a plunging market at the benefit of the rich is a perfect setup in their favor. Wiping out trillions and bankrupting the middle-class (many of them Christians) will still result, in the end, the uber elite owning billions $. Sure, maybe a $20 billion fortune goes to $5 billion but they own it all anyway so why would they care? Proportion-wise they will still be the uber 1% of the 1%.
The best overall count is that the market is looking for Minute [i] of Minor 3 of Intermediate (3) price pivot low.
So much to say! How does one do it in a concise, coherent and organized manner? Well let’s break things down in categories:
MARKET TECHNICALS
Today was the worst day in a long-time market-internal wise. Bearish market internals are increasing, not decreasing. Well above an across-the-board 90% down day overall market wise. This very bearish down day is consistent with a concerted “kickoff” of a Minor wave 3 of (3) down. Every major index finished beneath the previous pivot spike price low of the past few months (except the Russell 2000). In that regard the market seems to be in a long-term agreement.
Another technical situation is that today’s low reached a down trending trendline. If tomorrow was to open smash mouth gap down through this trendline, then probably a full-blown market crash is under way. Some more commentary beneath the charts.
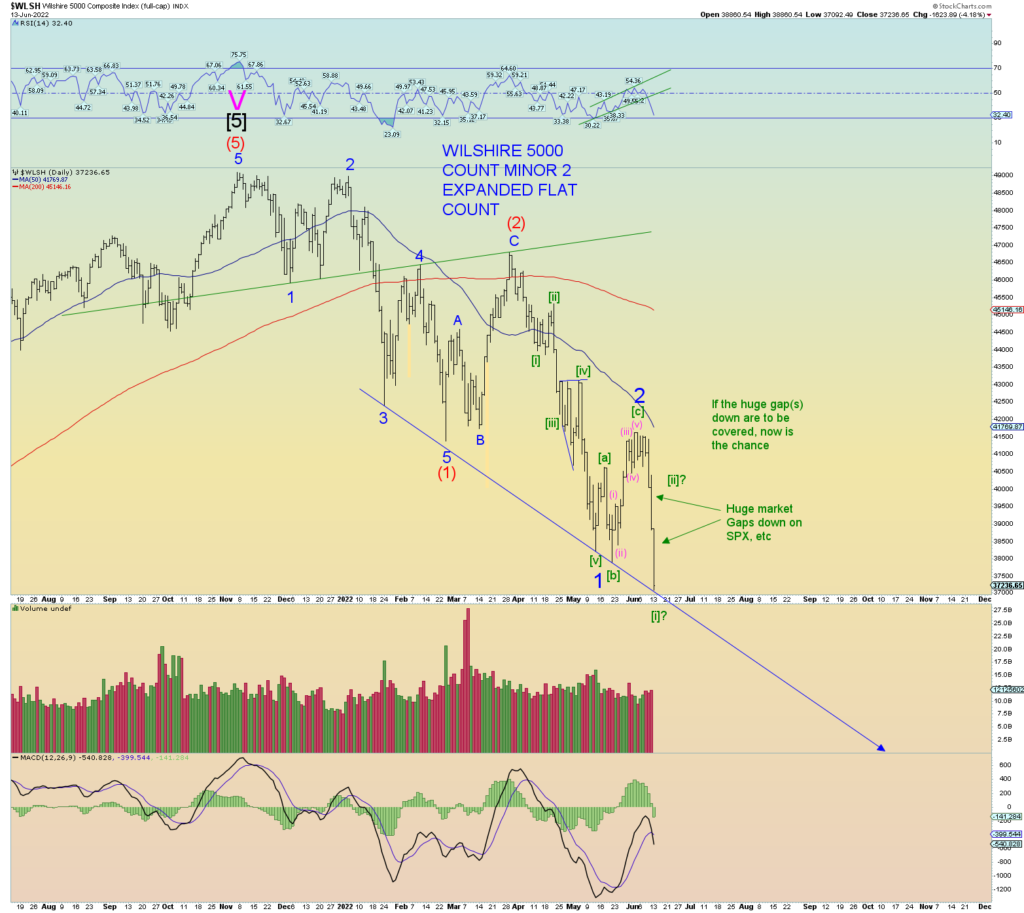
Again, the markets are at the mercy of overnight futures, so we shan’t waste too much time on things tonight. Technical-wise, the VIX is NOT yet at a new pivot high since November and the medium-term moving averages of the CPCE is far from a panic oversold situation. As is the simple mechanics of RSI and MACD of any daily chart you look at. In other words, there is plenty of technical bearish room to run on not only the daily charts but the weekly and monthly. So, this supports the overall bearish long term wave counts. But we knew that.
Finally, we can see that huge gap(s) down in the market indices (such as in the SPX) exists and we can make a certain logical wave statement as such: IF these gaps are to be covered THEN now is the best time to do so concerning a wave count interpretation.
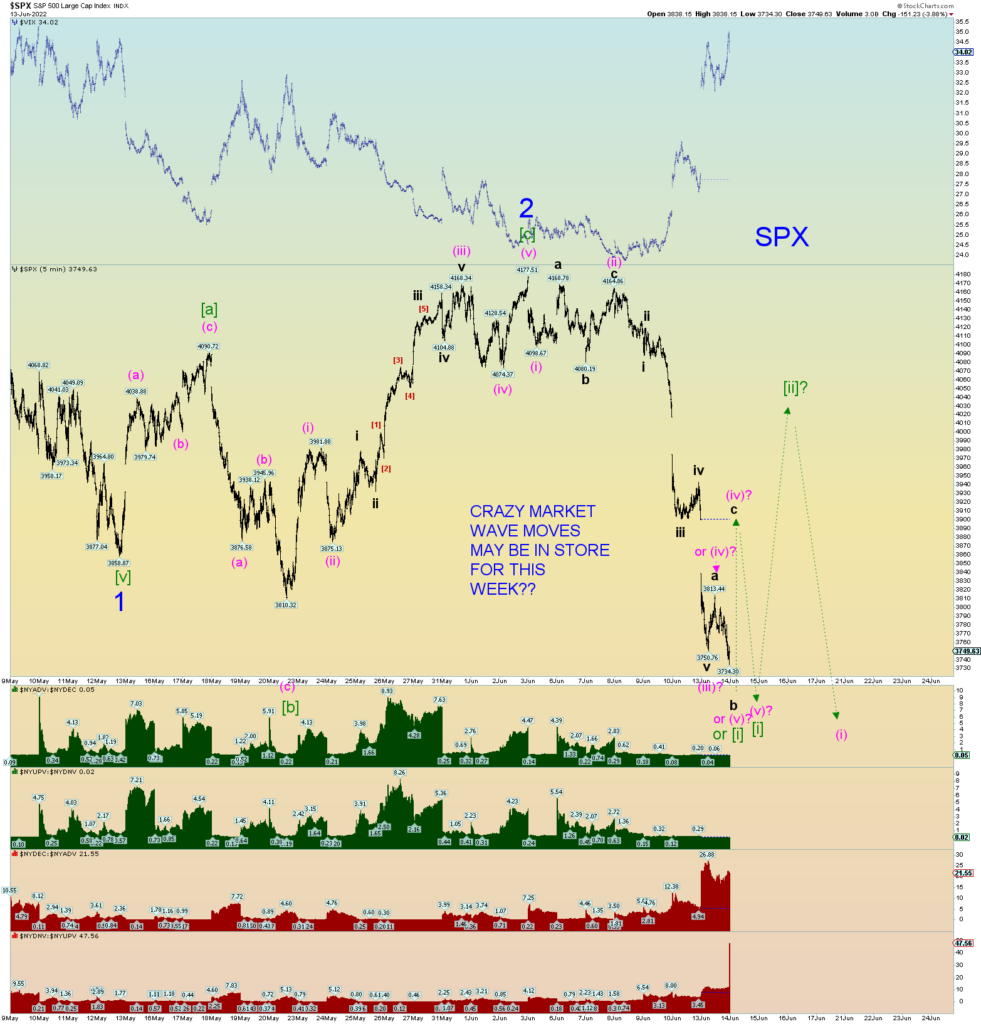
The SPX wave chart below presents a potential extreme volatility view of the waves centered around the Fed meeting this week. I expect very wild swings and the count presented below supports such wild swings.
Today may have been the price low of Minute [i]. Note all the alternate possibilities. How would one trade this mess? LOL.
BEST SQUIGGLE WAVE COUNT INTERPETATION
The best overall count is that the market is looking for Minute [i] price low of Minor 3 of Intermediate (3) down. We can compare this to the 2008 selloff, the Minute [i] low coincides with a downtrend line. A very sharp bear covering rally ensued resulting in a short-lived Minute [ii]. Recall though, this was when the banks were forbid to be “shorted”. This situation doesn’t exist today yet any “news” could spark a violent final rally if the 2008 model is to be followed in form.
The “breaking” of this downtrend line was the heart of the panic selloff and was the steep “acceleration” downward of the overall wave structure. Look for something similar in 2022 to occur. Minute [iii] of 3 of (3) down. The market is in a very similar setup except the times are shortened and the down sloping trendline is much steeper. (See first chart of this post)

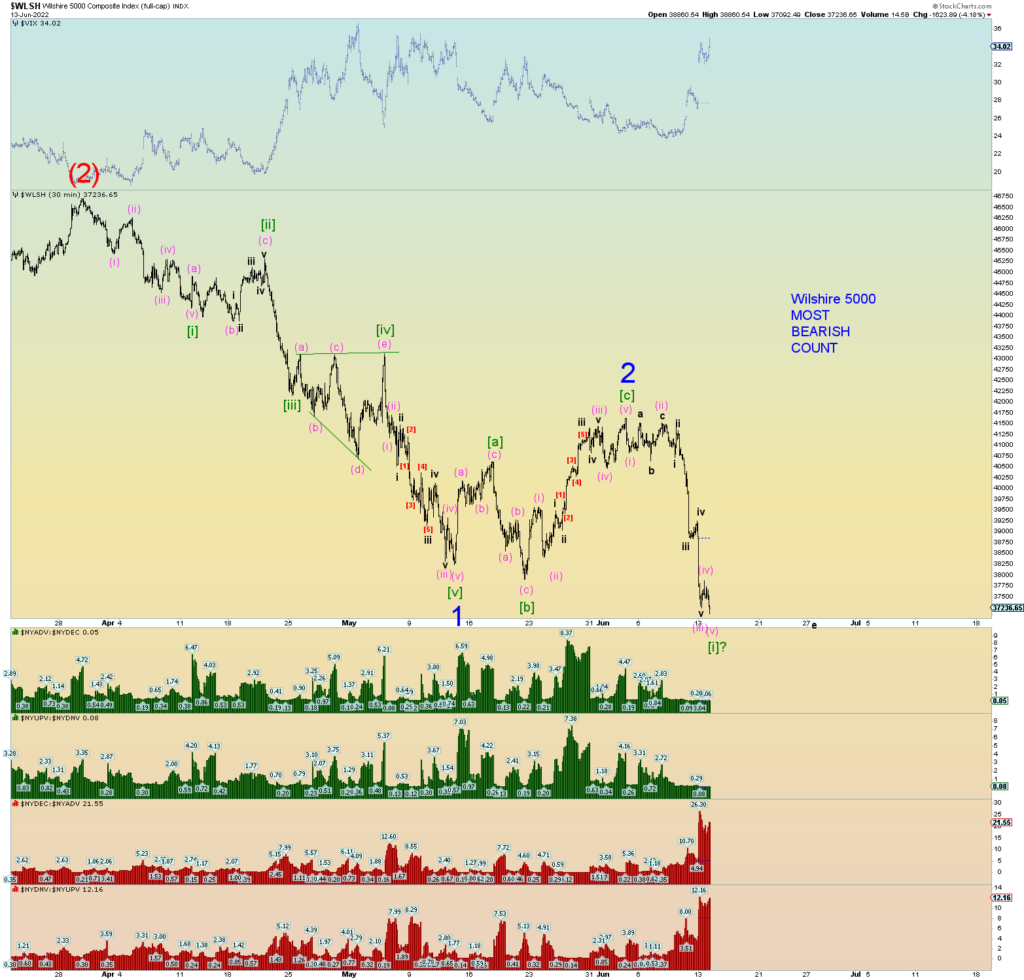
The Wilshire potential count. Perhaps Minute [i] low is in.
Followup on yesterday’s post on the “reverse” Zweig Breadth Thrust. It has been confirmed. A reader was kind enough to send a link showing I was not the only one who noticed. A Rare “Inverse Zweig Breadth Collapse” Triggers | Quantifiable Edges
(Note: I do not have the today’s BT data point until tomorrow. But do note the very bearish NYSE histogram red bars at the bottom of the chart. Worst day in 2 years.

The junk credit situation is not good. A Ponzi scheme can unravel very quickly.
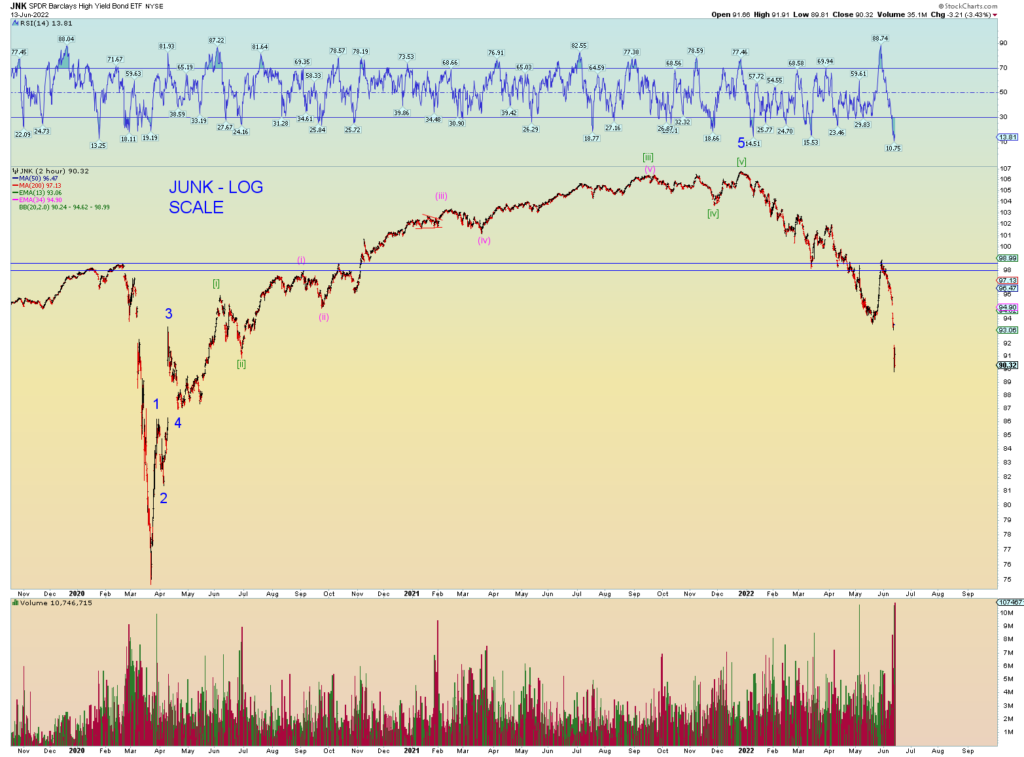

What is the big difference between the market collapse occurring now versus 2020 and prior? Interest rates are exploding is the obvious difference. In 2020 interest rates plunged, in 2022 they are surging upwards! Markets under duress.