There is a lot of variation between indexes. Negative divergences existed between the top(s) in Nov 2021 and early January 2022. The main reason I track primarily the Wilshire 5000 is because it lies the least. It is the total U.S. market which, in the scheme of things, is the only thing that matters.
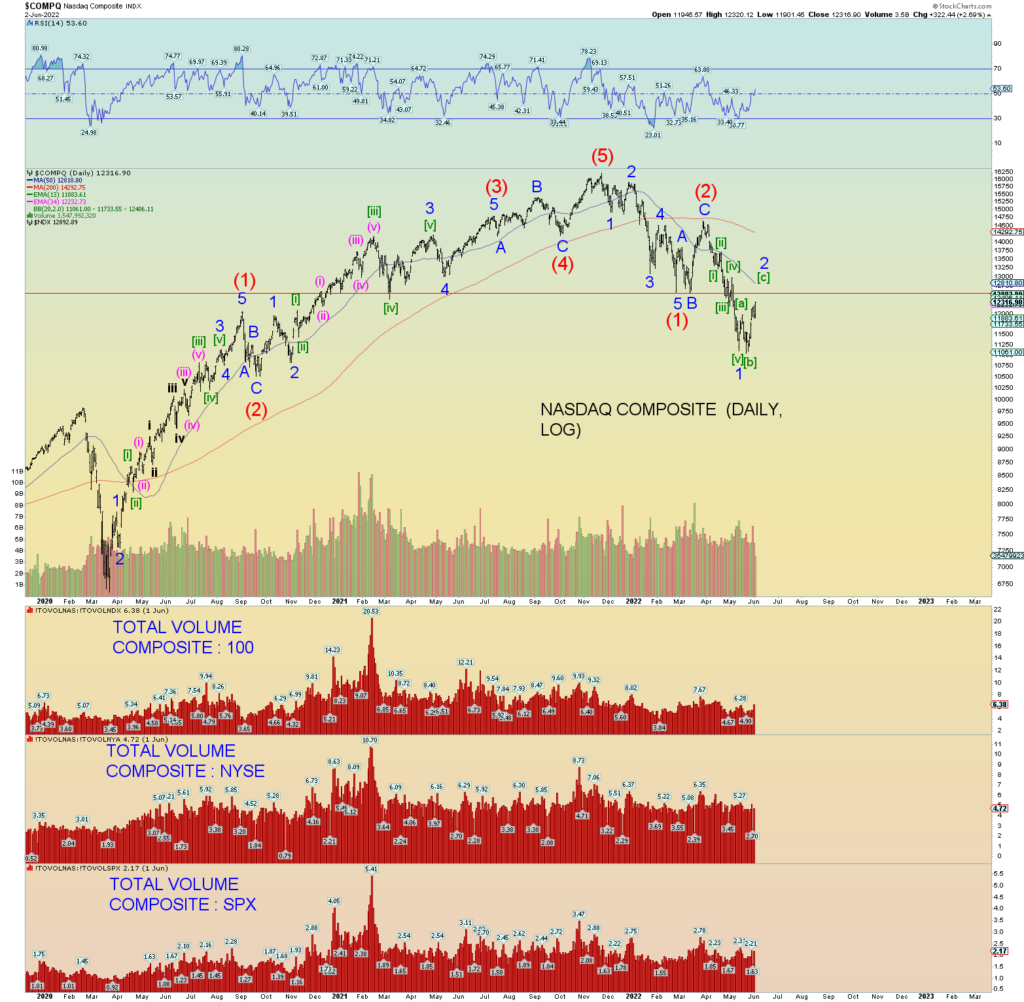
Once in a while I’ll throw in an SPX chart here and there, but the algorithms of today’s highly watched, and computer traded indices become somewhat self-fulfilling in a sense. The DJIA, the SPX (SPY), e-minis futures, the COMP, the NDX, even the Russell 2000, these are all highly watched and traded markets via algorithms and have, as a result, become the least predictive Elliott Wave structure overall. For example, how many algorithms have given hefty weight and programmed with “gap trading” in mind?
But no one really trades the “total market”.
My point is thus: If the Wilshire 5000 had been the “key” market index to trade, the “pros” would have done it decades ago, made a highly traded index to exploit it, and based technical analysis around it. There is something tempered about trying to manipulate the entire (for the sake or arguing) tradable index of the United States. If it had been “manipulative” they would have done it by now. But of course, they break the market into “segments”; and abuse these gyrations and programmed the computer algorithms to react or not react based on a myriad of micro information passing over the “news ticker” at every waning moment. Chop up the market, and it can be manipulated all the easier.
But the thieves of Wall Street generally shun the “total market” because it cannot be manipulated as the sub-segments are. Therefore, they shun and bury the Wilshire 5000.
But I postulate that they have actually done the opposite in secret. That they actually use the Wilshire 5000 (or some other such total market measure) in the algorithm programming and adhere perfectly to predicted wave patterns, channel and trendlines of all various sorts. I of course cannot prove this, but the result of market moves manifest in the output of the Wilshire 5000 chart. The Wilshire 5000 adheres the best to Elliott Wave structures.
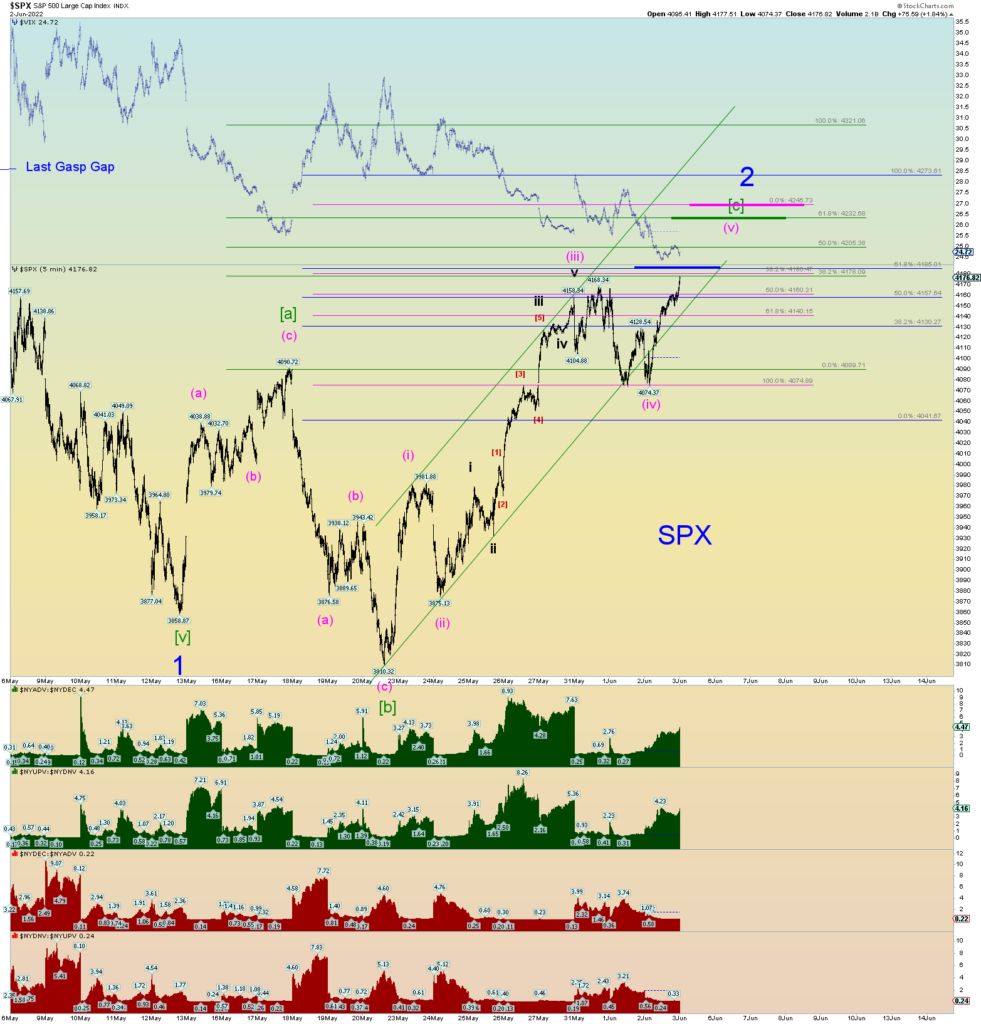
For instance, the SPX made a new all-time high in January and the Wilshire 5000 (its closet cousin) did not. This was a major negative divergence over a span of 2 months, and it mattered. The aftermath resulting total market breakdown followed.
So, what is my point? One point is this: pay attention to the total market moves as expressed in the Wilshire 5000 and its overall pattern, its channel lines, its trendlines. At this extremely volatile junction, it tells the least lies. It makes the best channels, trendlines, and other finely tuned price targets and pivots.
Remember, Elliott Wave theory is based on somewhat absolutes. For instance, wave two cannot go beneath in price the start points of a wave one. It is the hardest of rules and forbidden. And when one views these small variations between two “cousin” indexes, you can glean some useful information perhaps.
But I digress and you get the point.
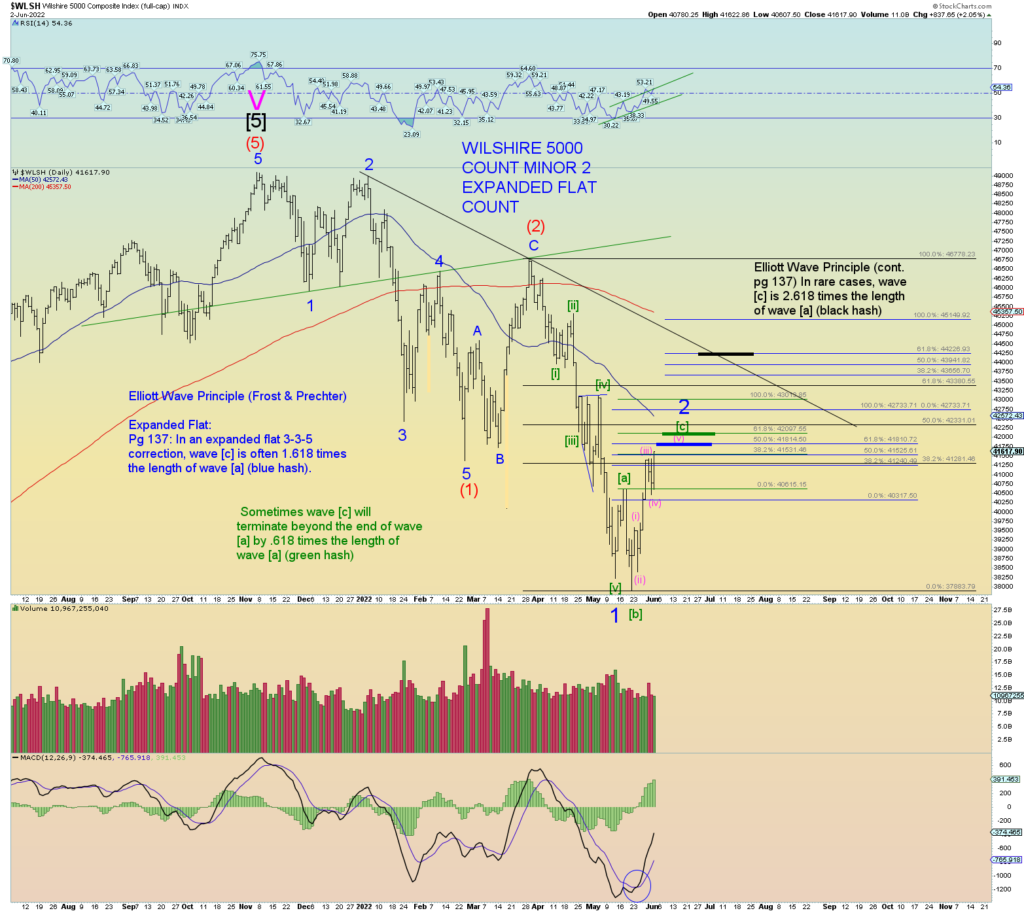
The best count has the total market approaching its ideal Minor 2 target range. I added a third target range based on the short-term structure of wave [c] of 2.

Here is a small example of how the SPX differs slightly with the Wilshire 5000 and perhaps is telling a diverging story. Today’s SPX low surpassed yesterday’s low yet the Wilshire did not. These are subtle clues. (Of exactly what is why we count squiggles)


Still would like that backtest of the Wilshire weekly. Coming closer.

I don’t count the DJIA because it can go through great nuisance stretches just like the NYSE count or any other subindex.


No new high on Junk today.


And finally, allow me to show you a chart that differs not very much from the Wilshire daily chart (shown above) that accounts for a Fibonacci 2.618 wave [c] times [a] for a Minor 2 price target.
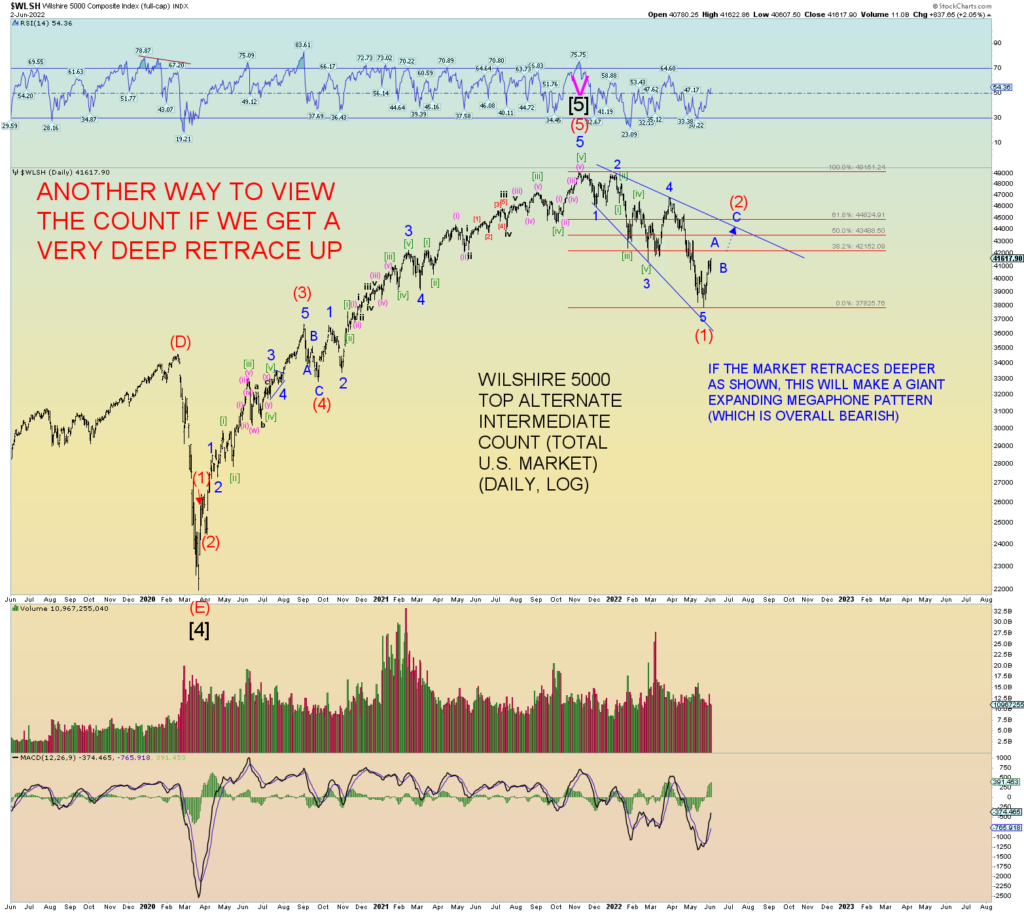
And what if that 2.618 Fib target was reached, what would the overall pattern look like on the total market?
It would look like this:

CONCLUSION:
The bottom line is this: Even if a much deeper overall market retrace occurs, even if done in a swift and “take no prisoners” manner, it would produce the most overbought, overhyped, overthought, overtraded market in history and result in a historic collapse no matter how one tries to “rescue” it.
That much I am confident in. So, if the market needs to rip some more face to the upside, I say bring it on!