Elliott Wave Update ~ 13 June 2022 [Update]

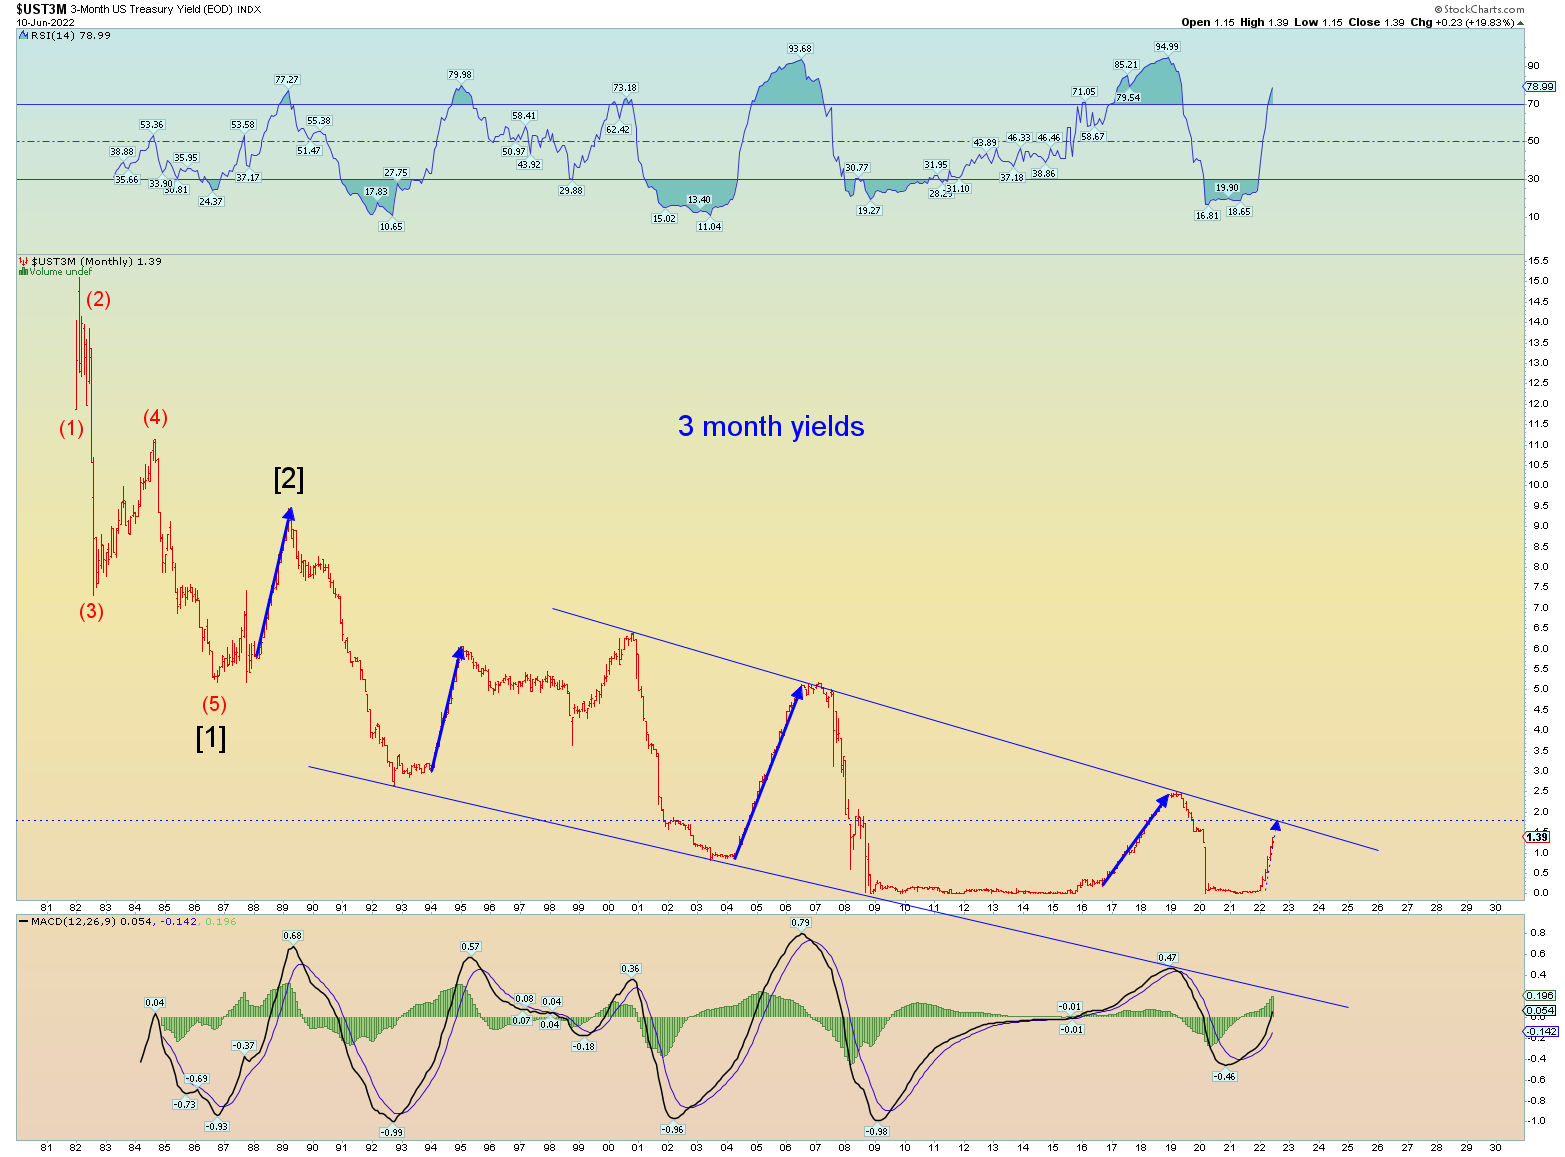
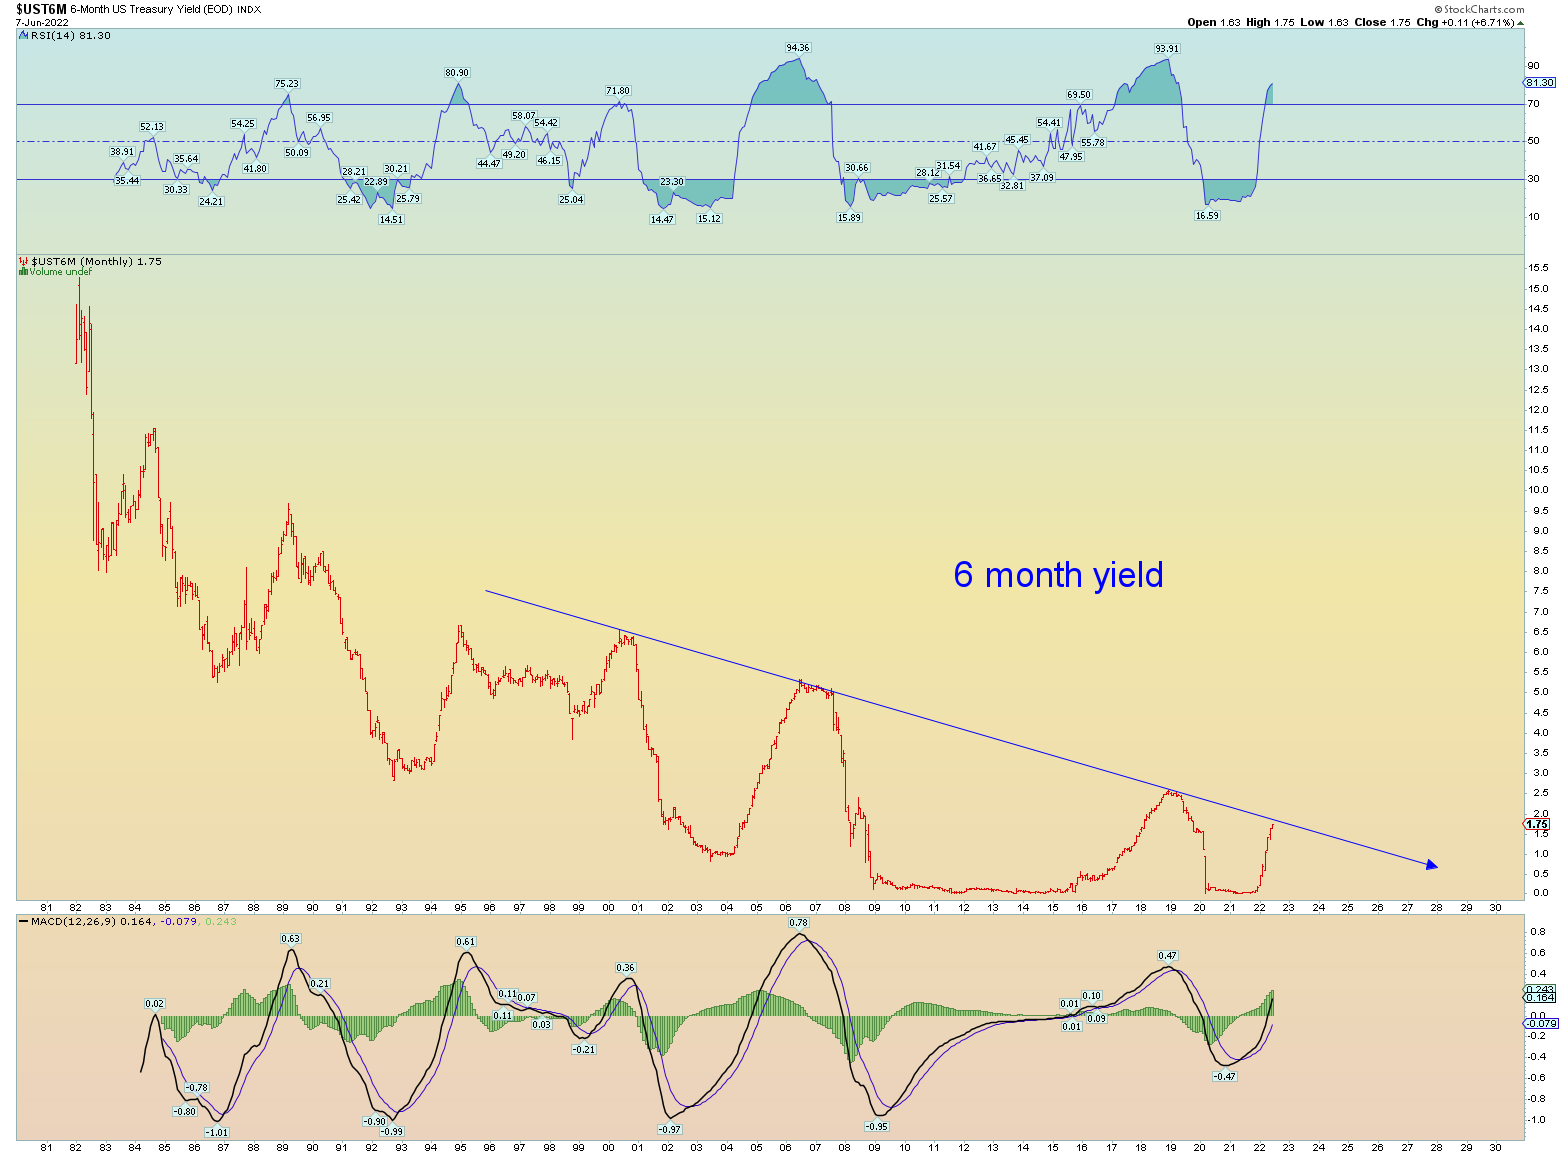
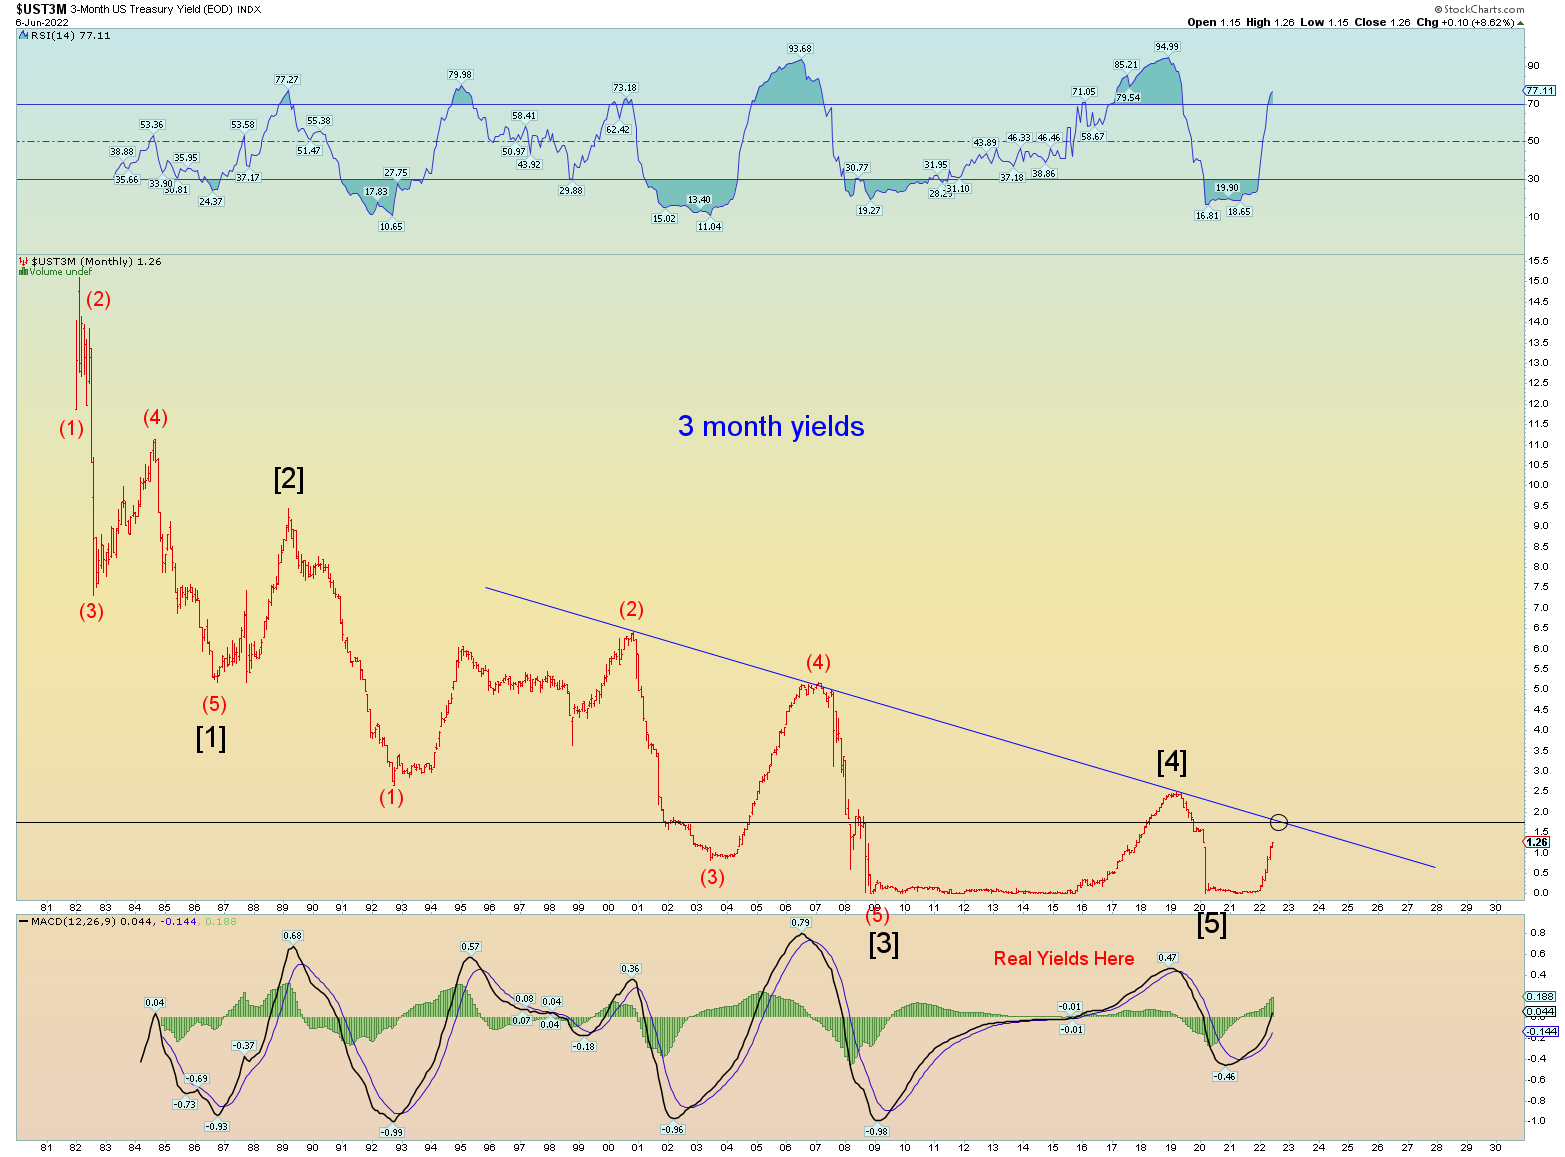
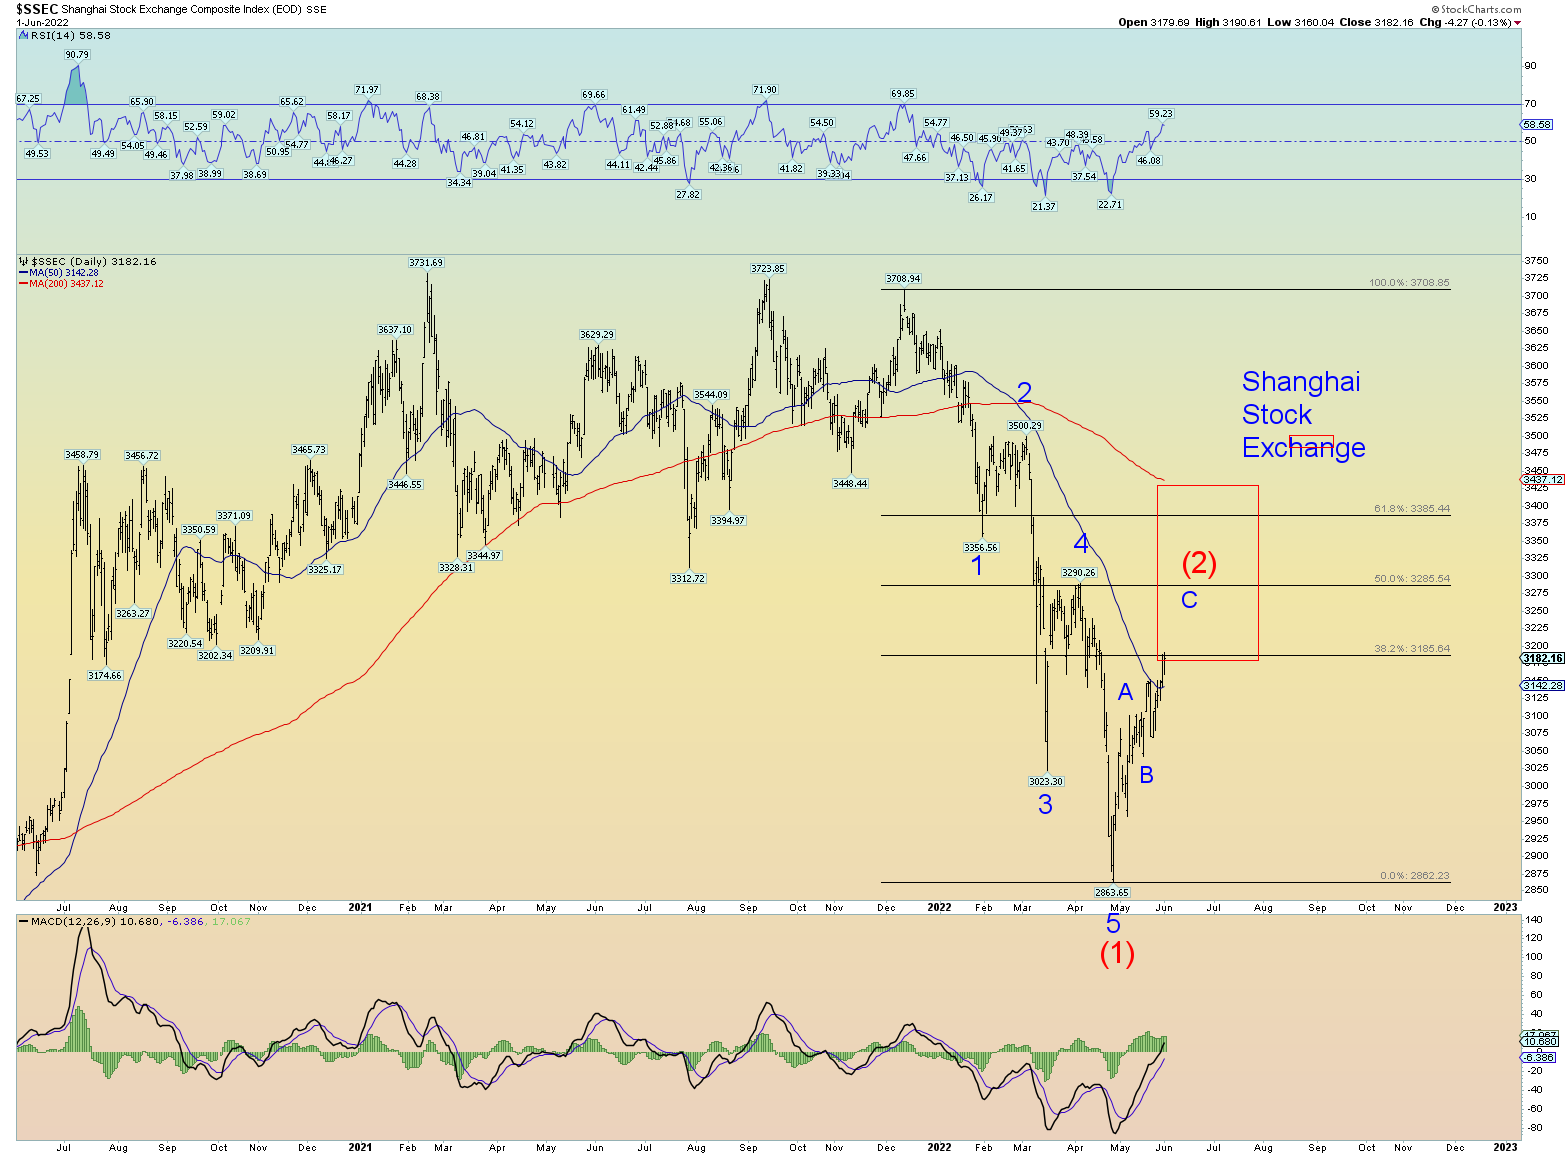
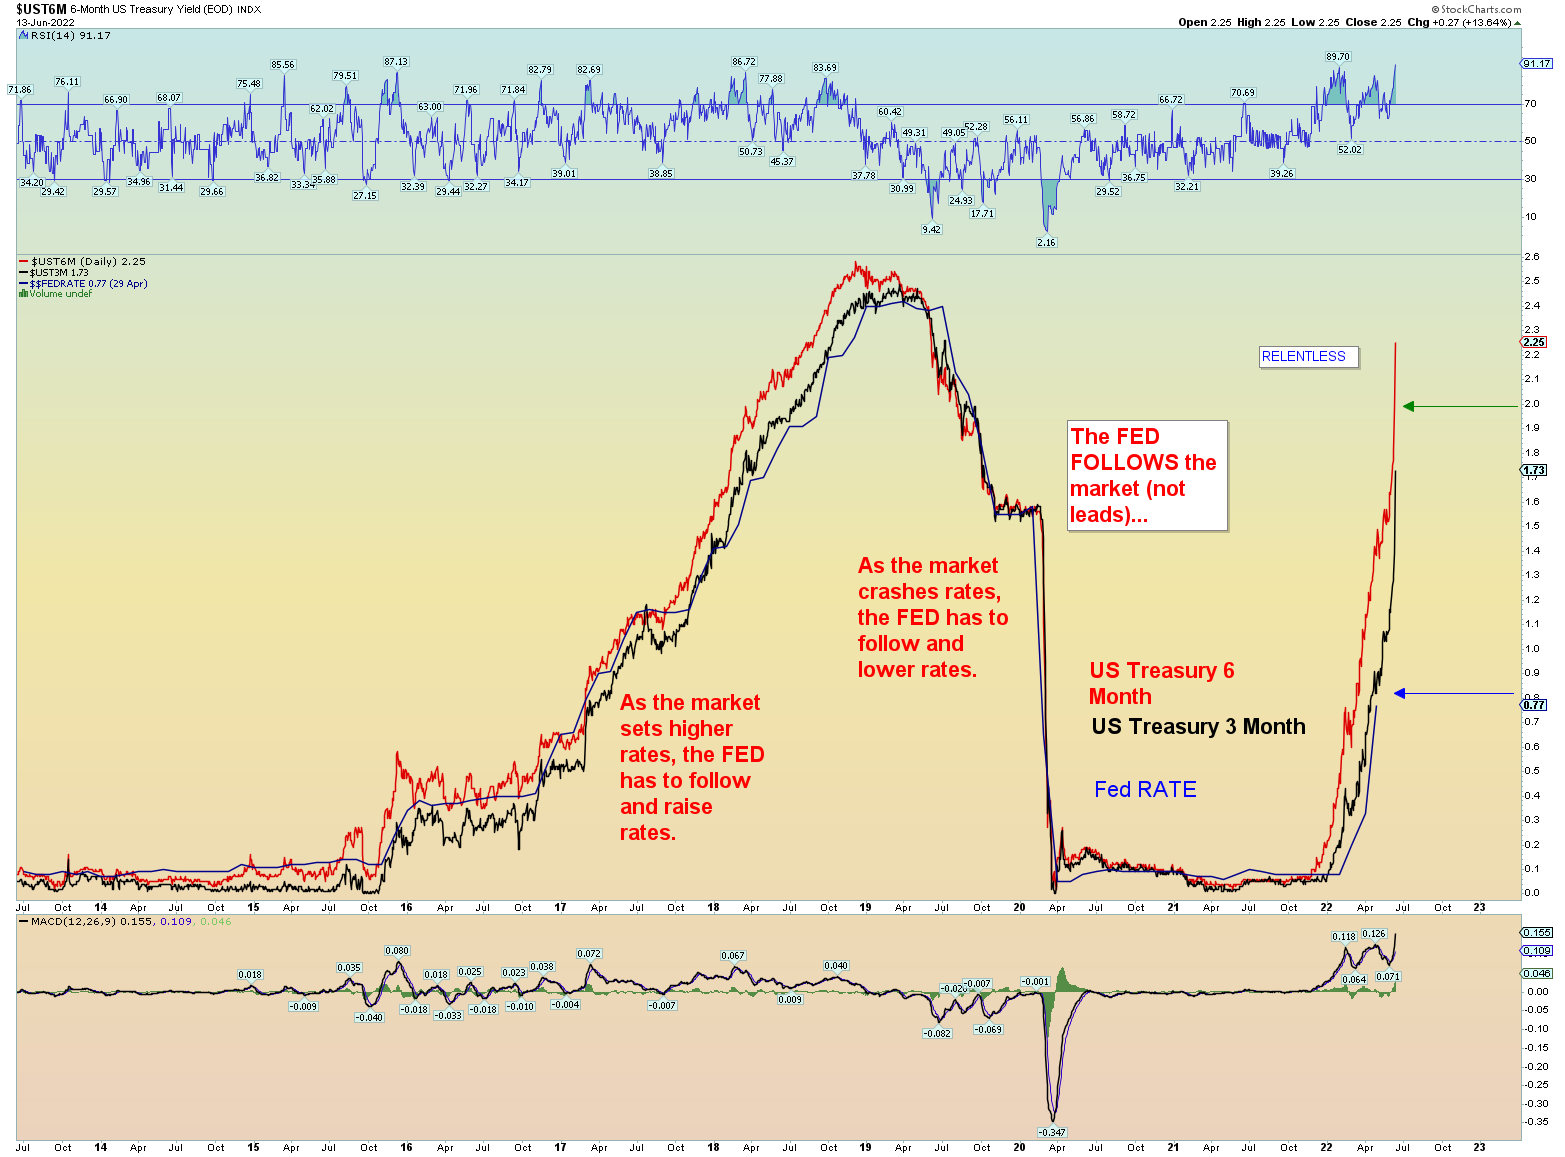
[UPDATE:] I added the 3/6-month yield spread chart. A .50 hike is not going to cut it, a .75 is surely coming at the very least. A full one-point hike would shock the markets, yet the charts support it.

Remember, many Fed and high-level bankers secretly attend Bohemian Grove and Jackson Hole demonic rituals. In the long run, their marching orders are to tear this market down. The long running “paradigm” of the Fed always rescuing a plunging market at the benefit of the rich is a perfect setup in their favor. Wiping out trillions and bankrupting the middle-class (many of them Christians) will still result, in the end, the uber elite owning billions $. Sure, maybe a $20 billion fortune goes to $5 billion but they own it all anyway so why would they care? Proportion-wise they will still be the uber 1% of the 1%.

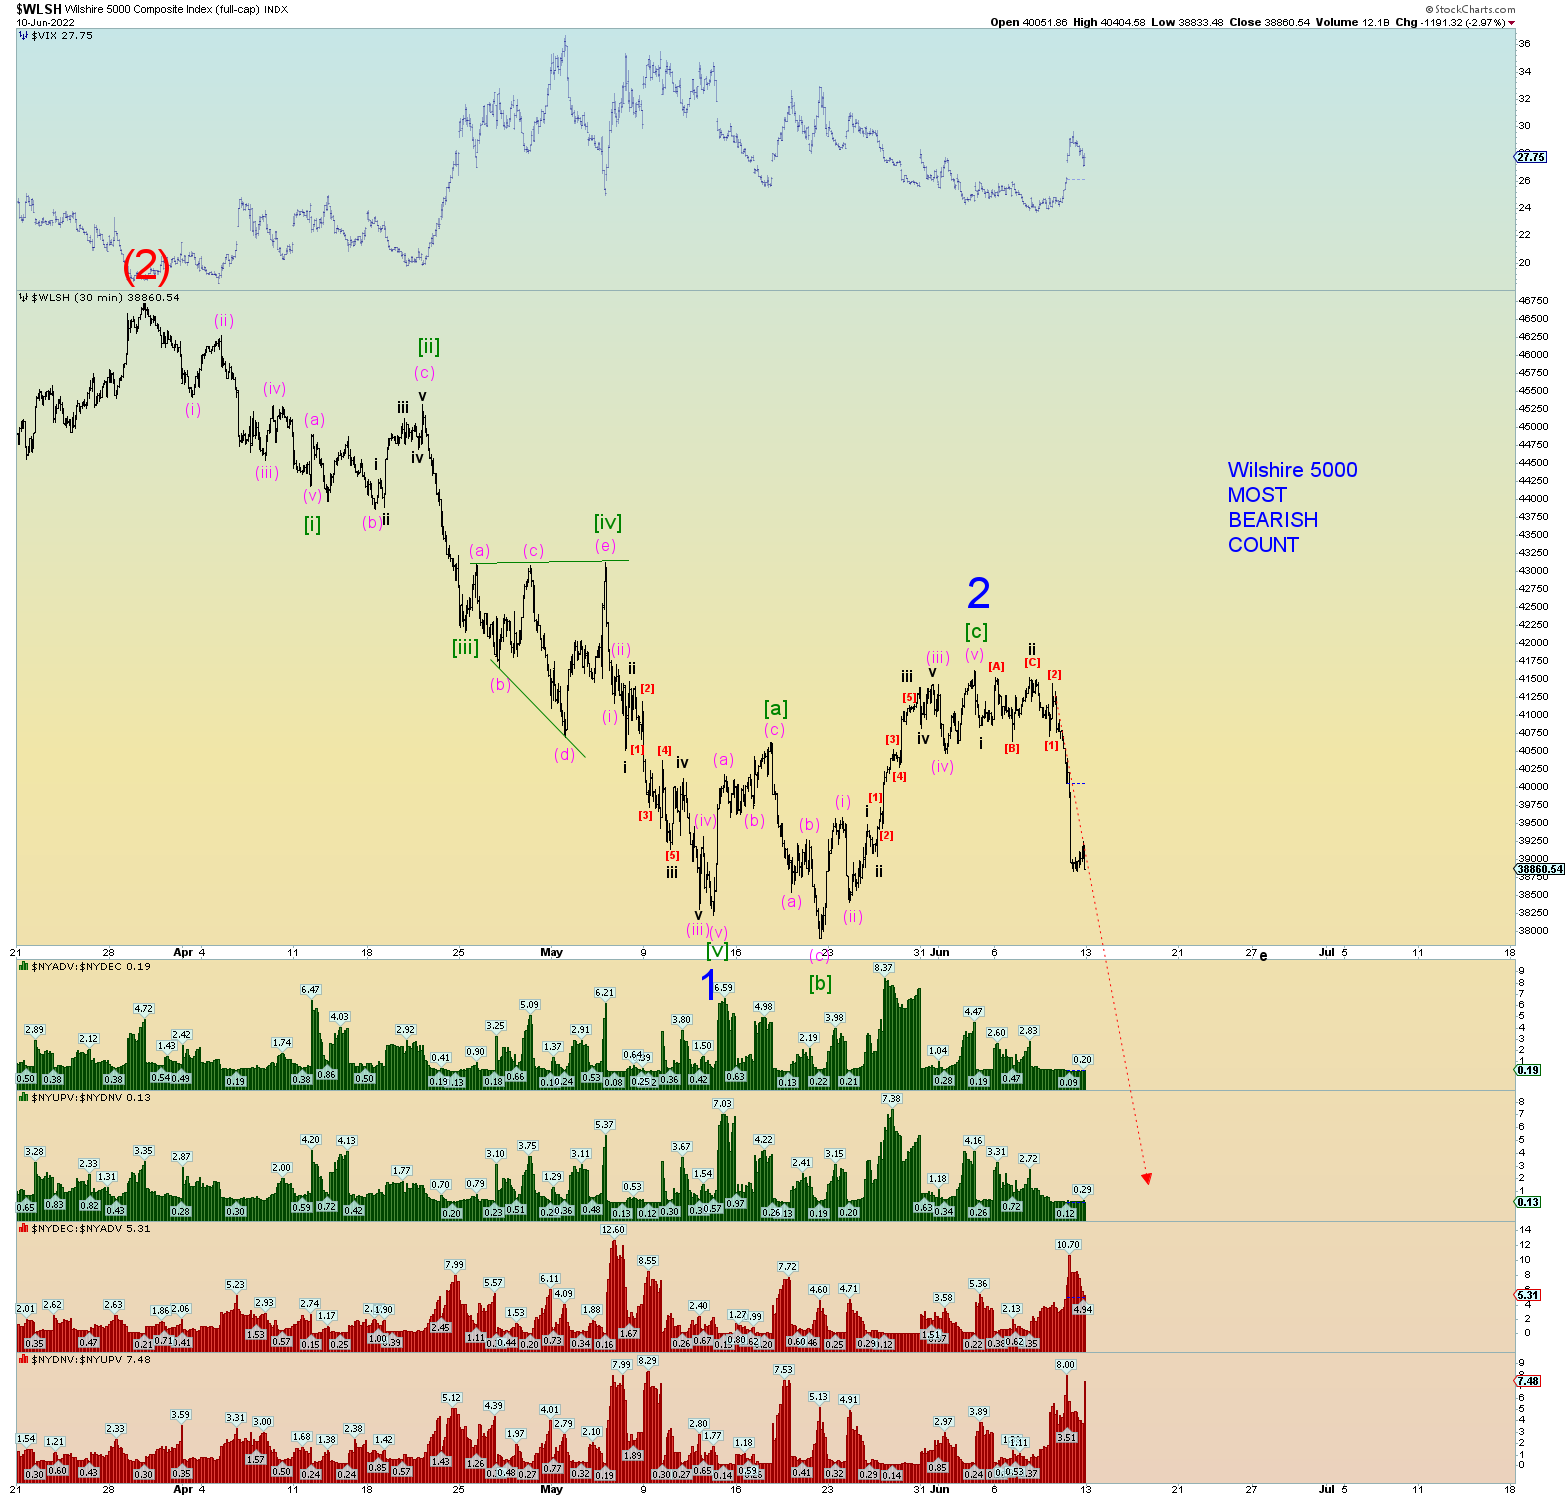
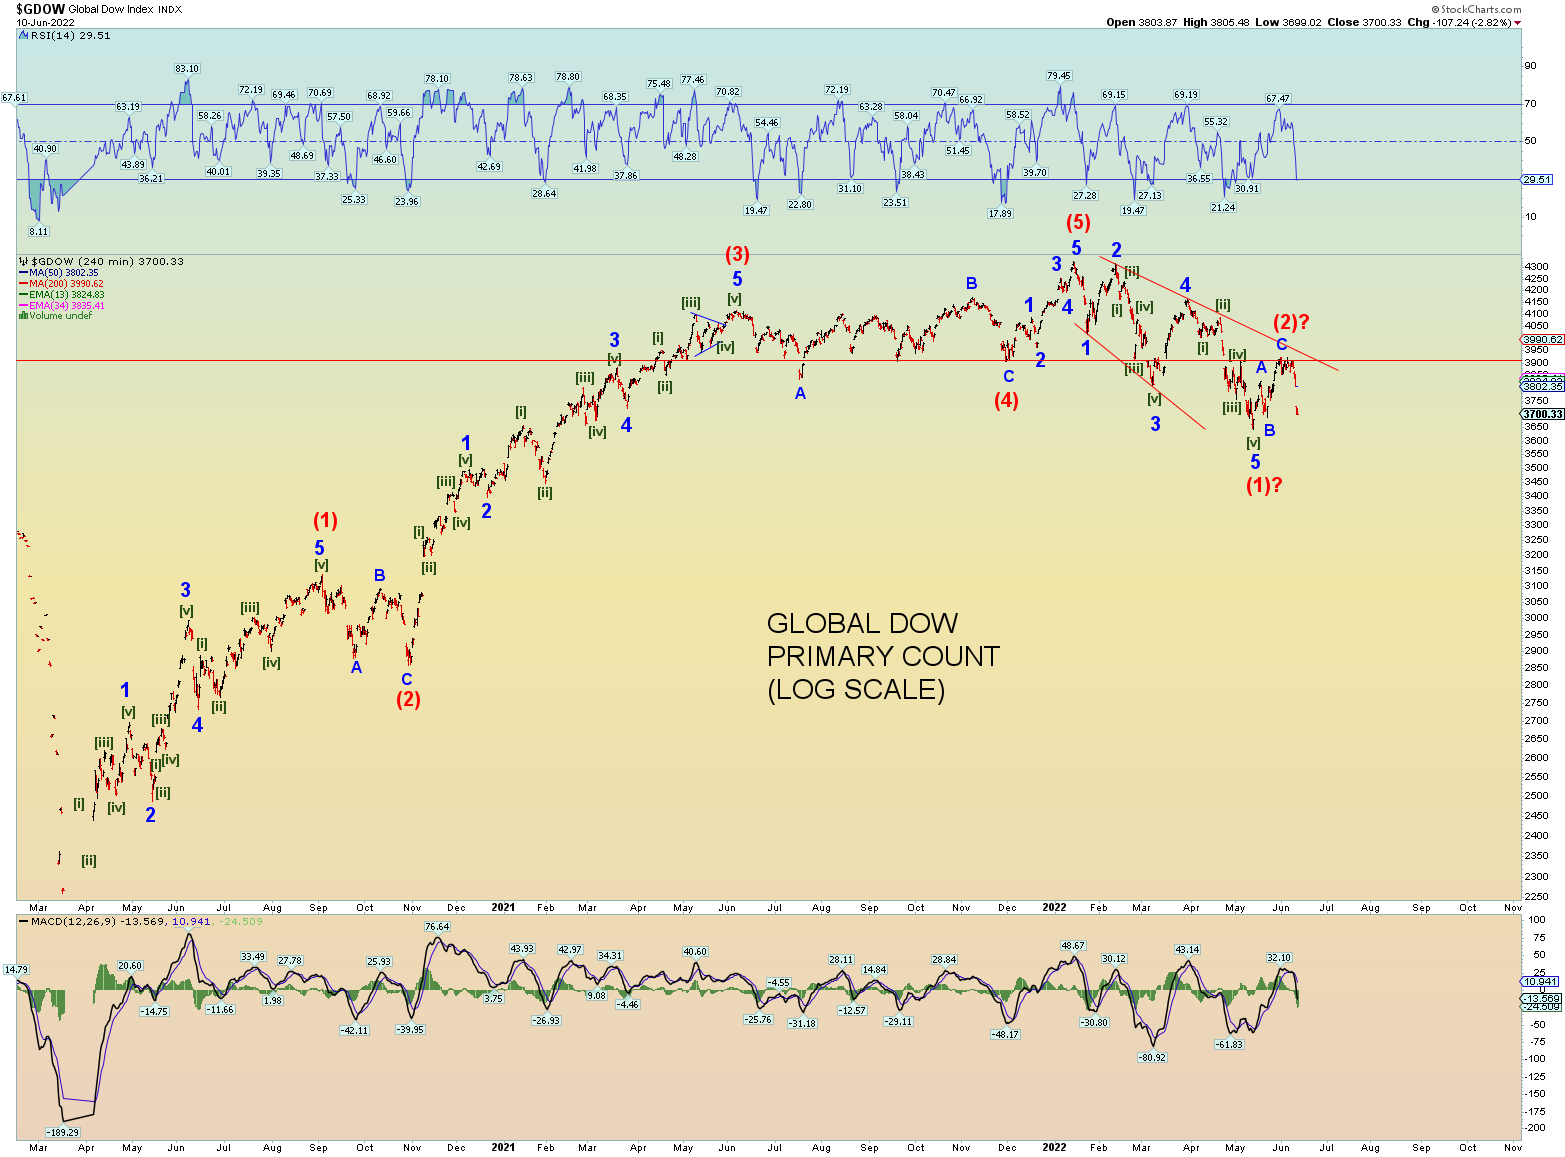
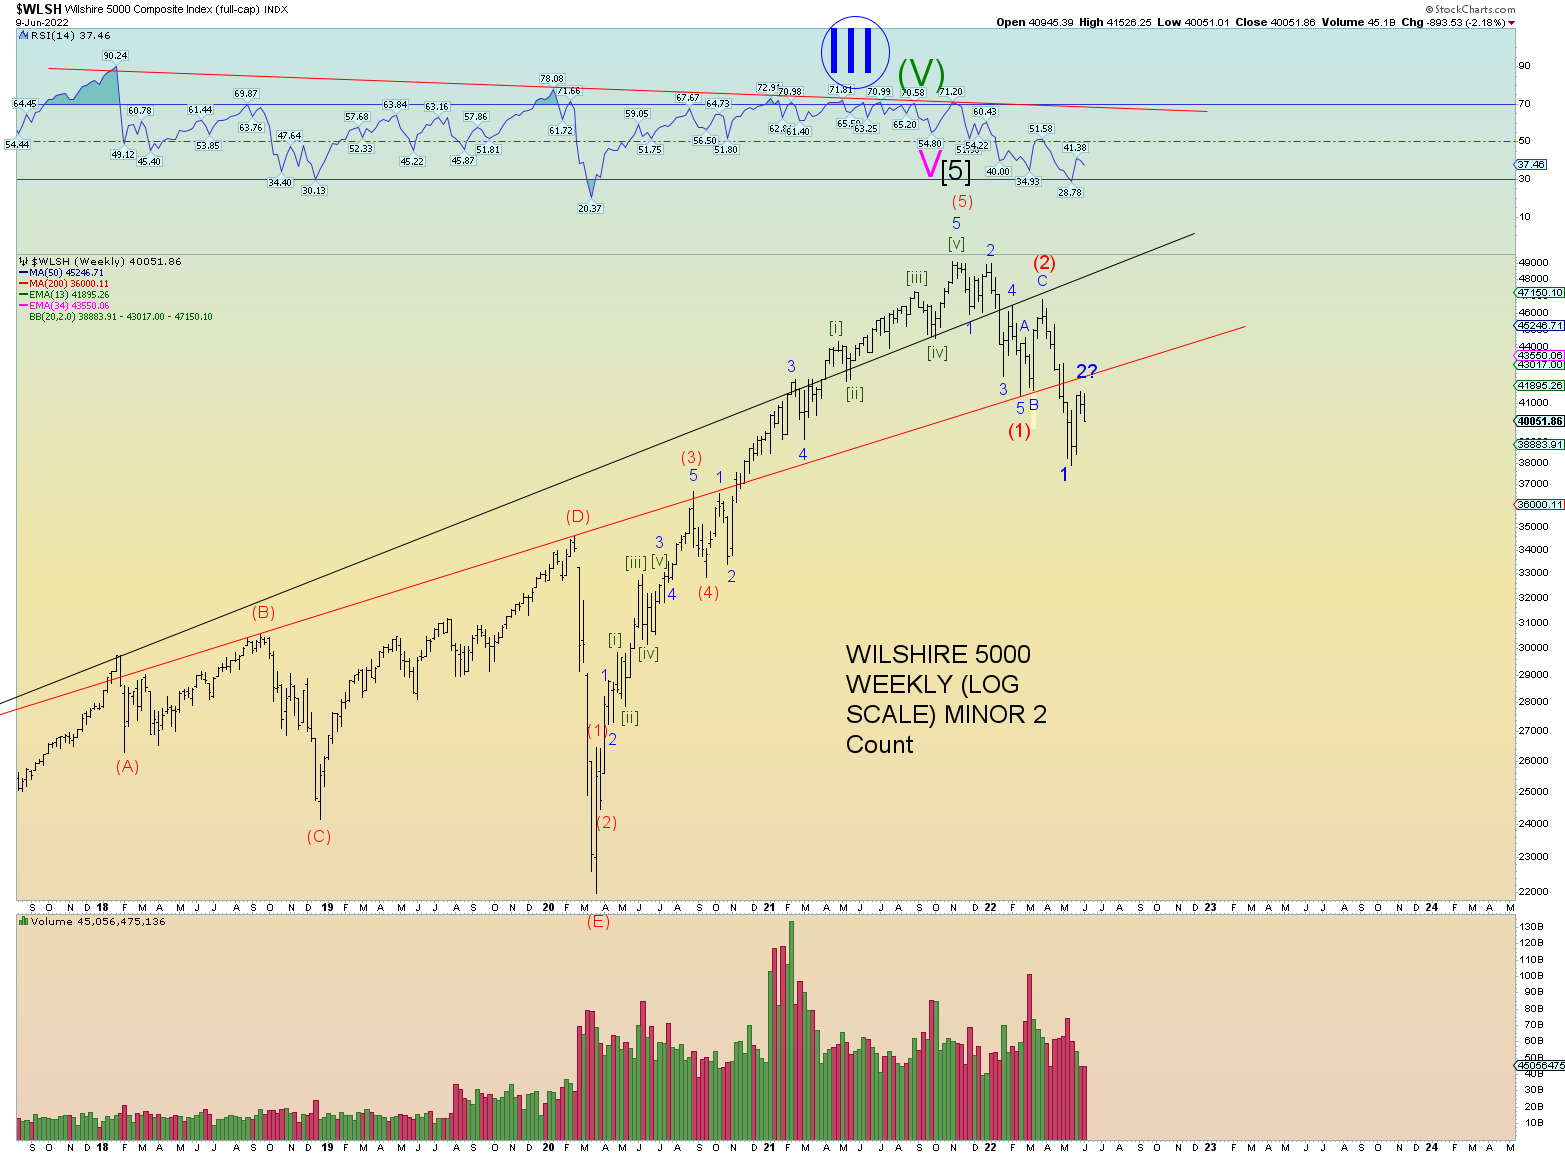
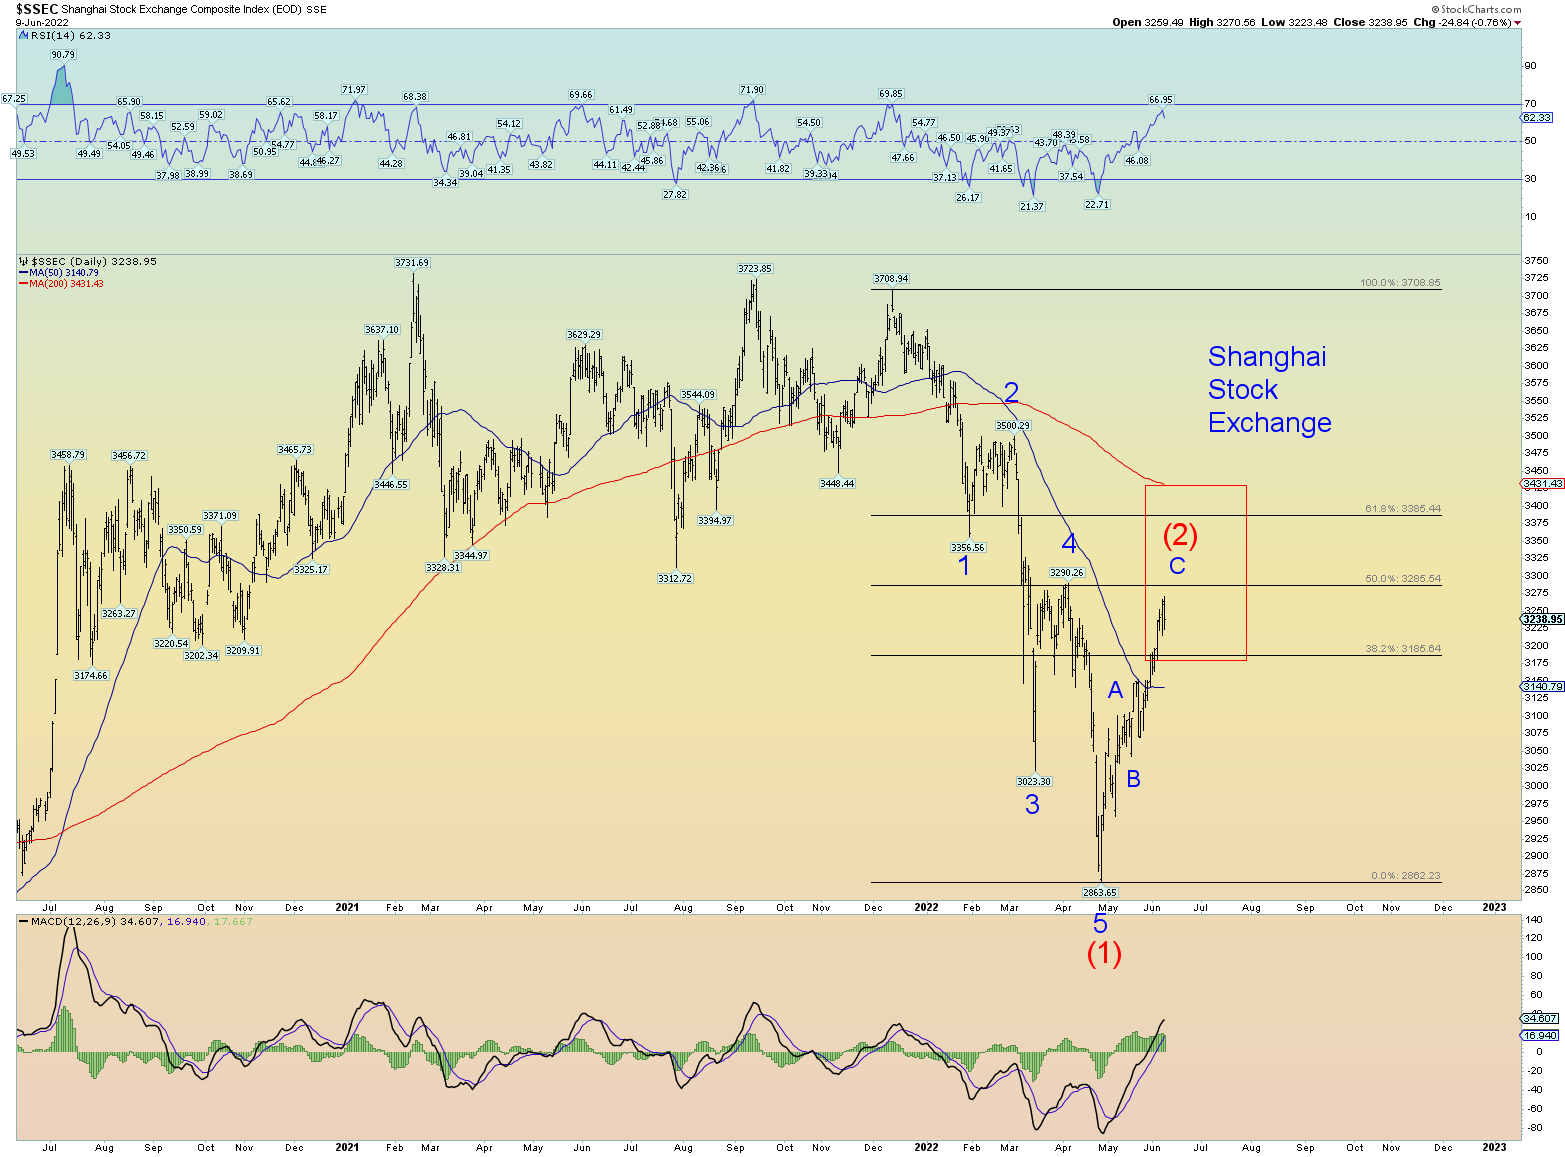
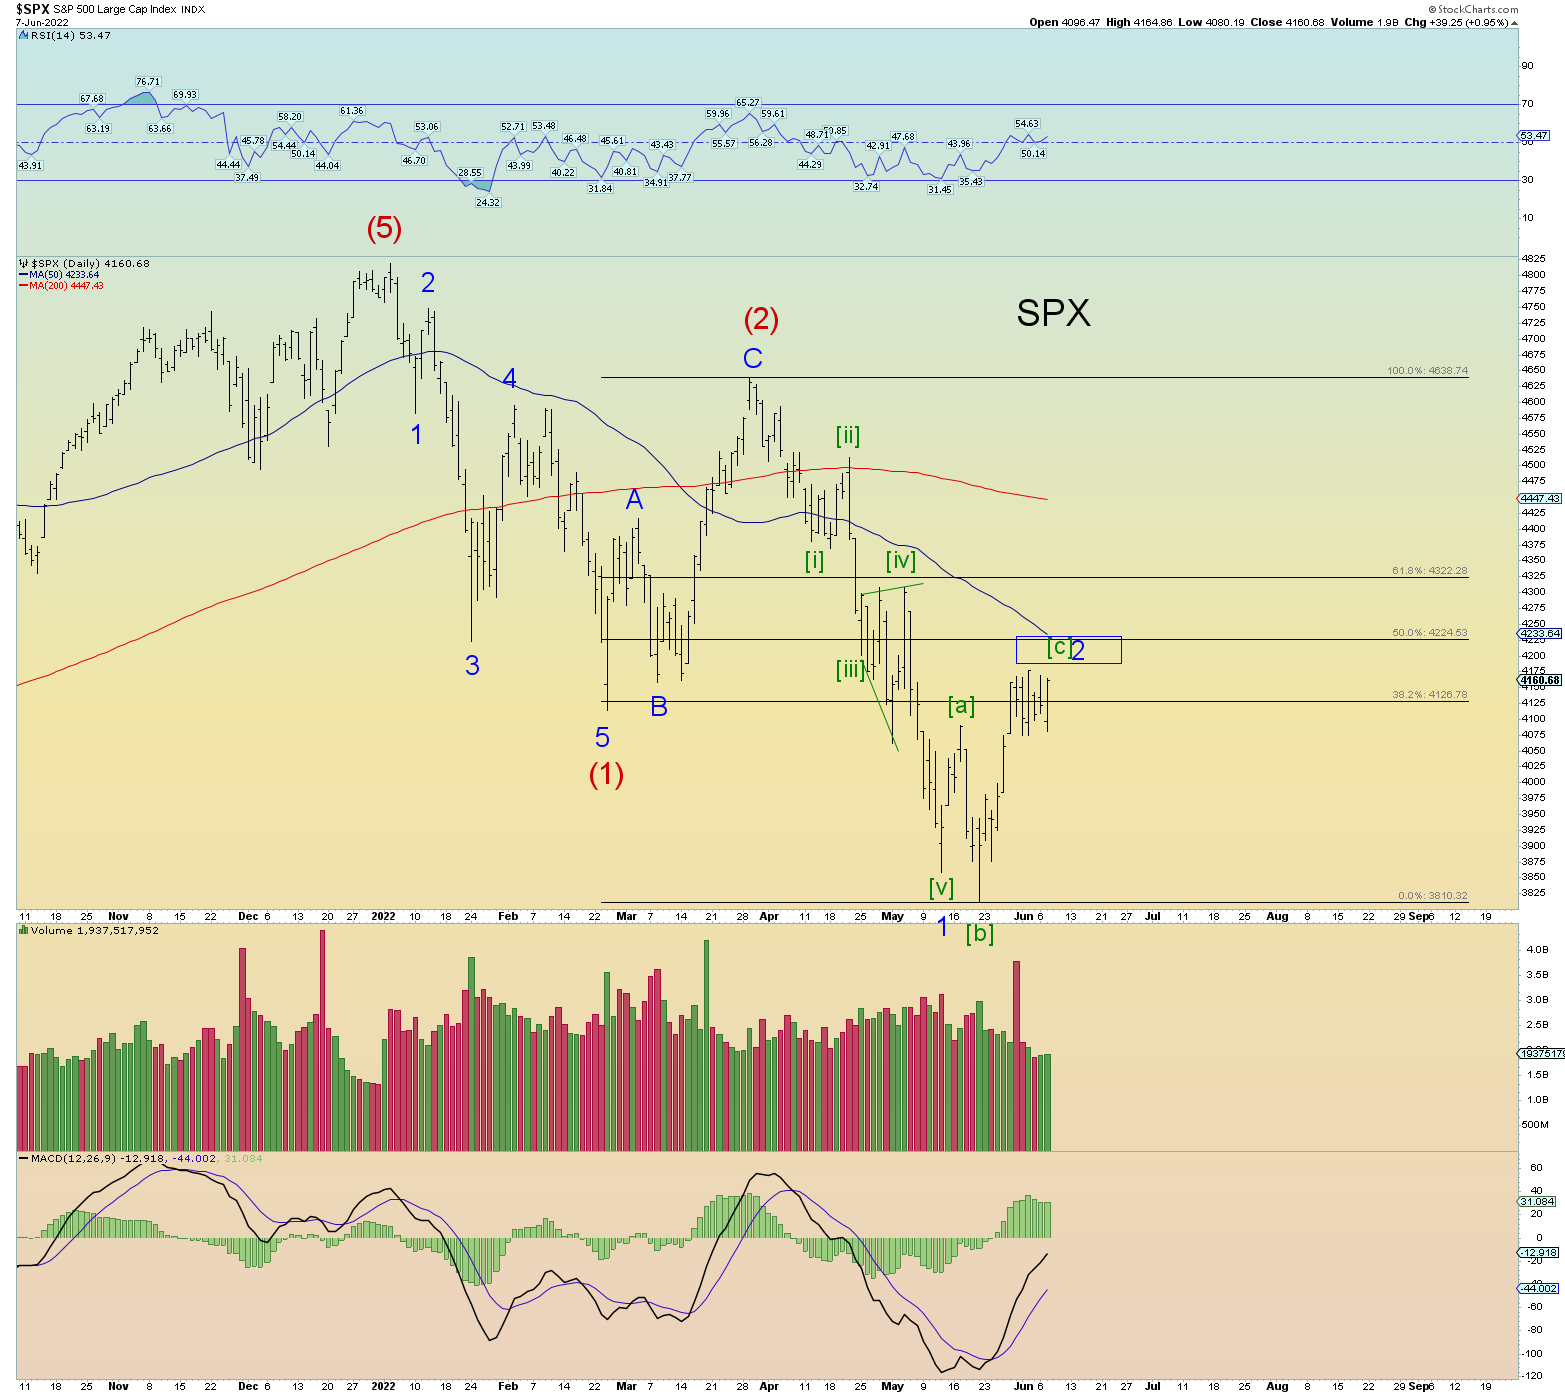
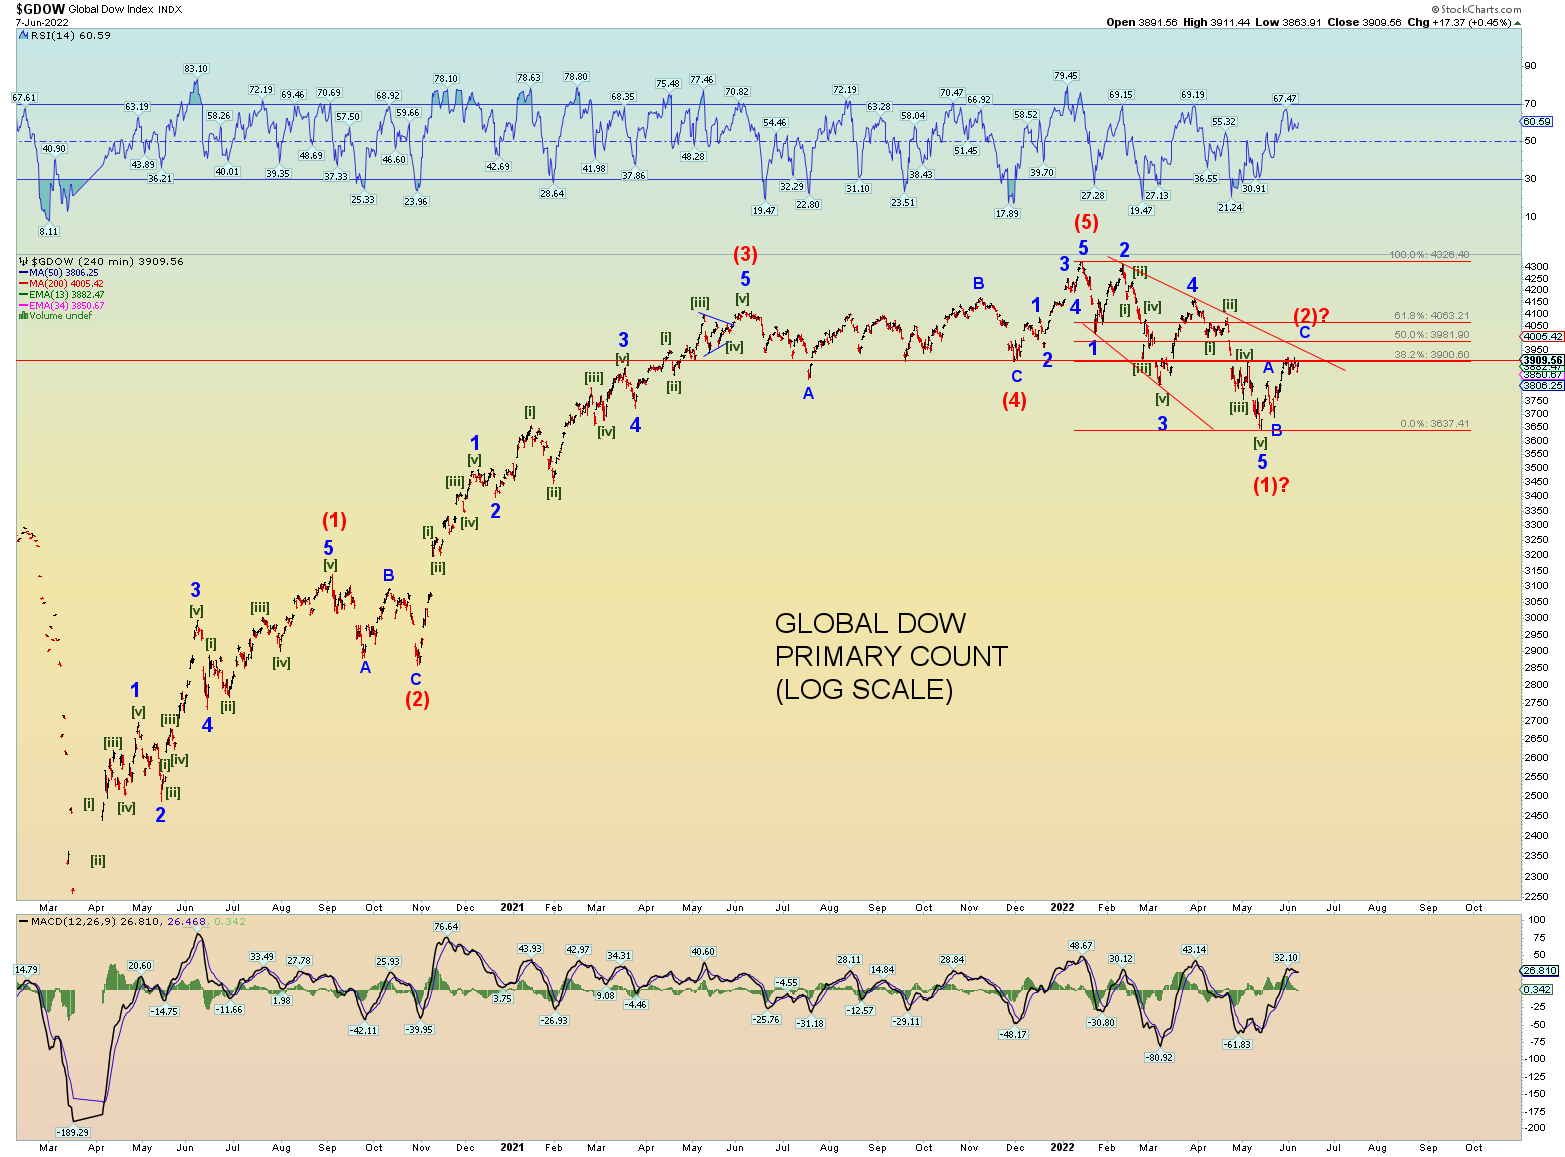
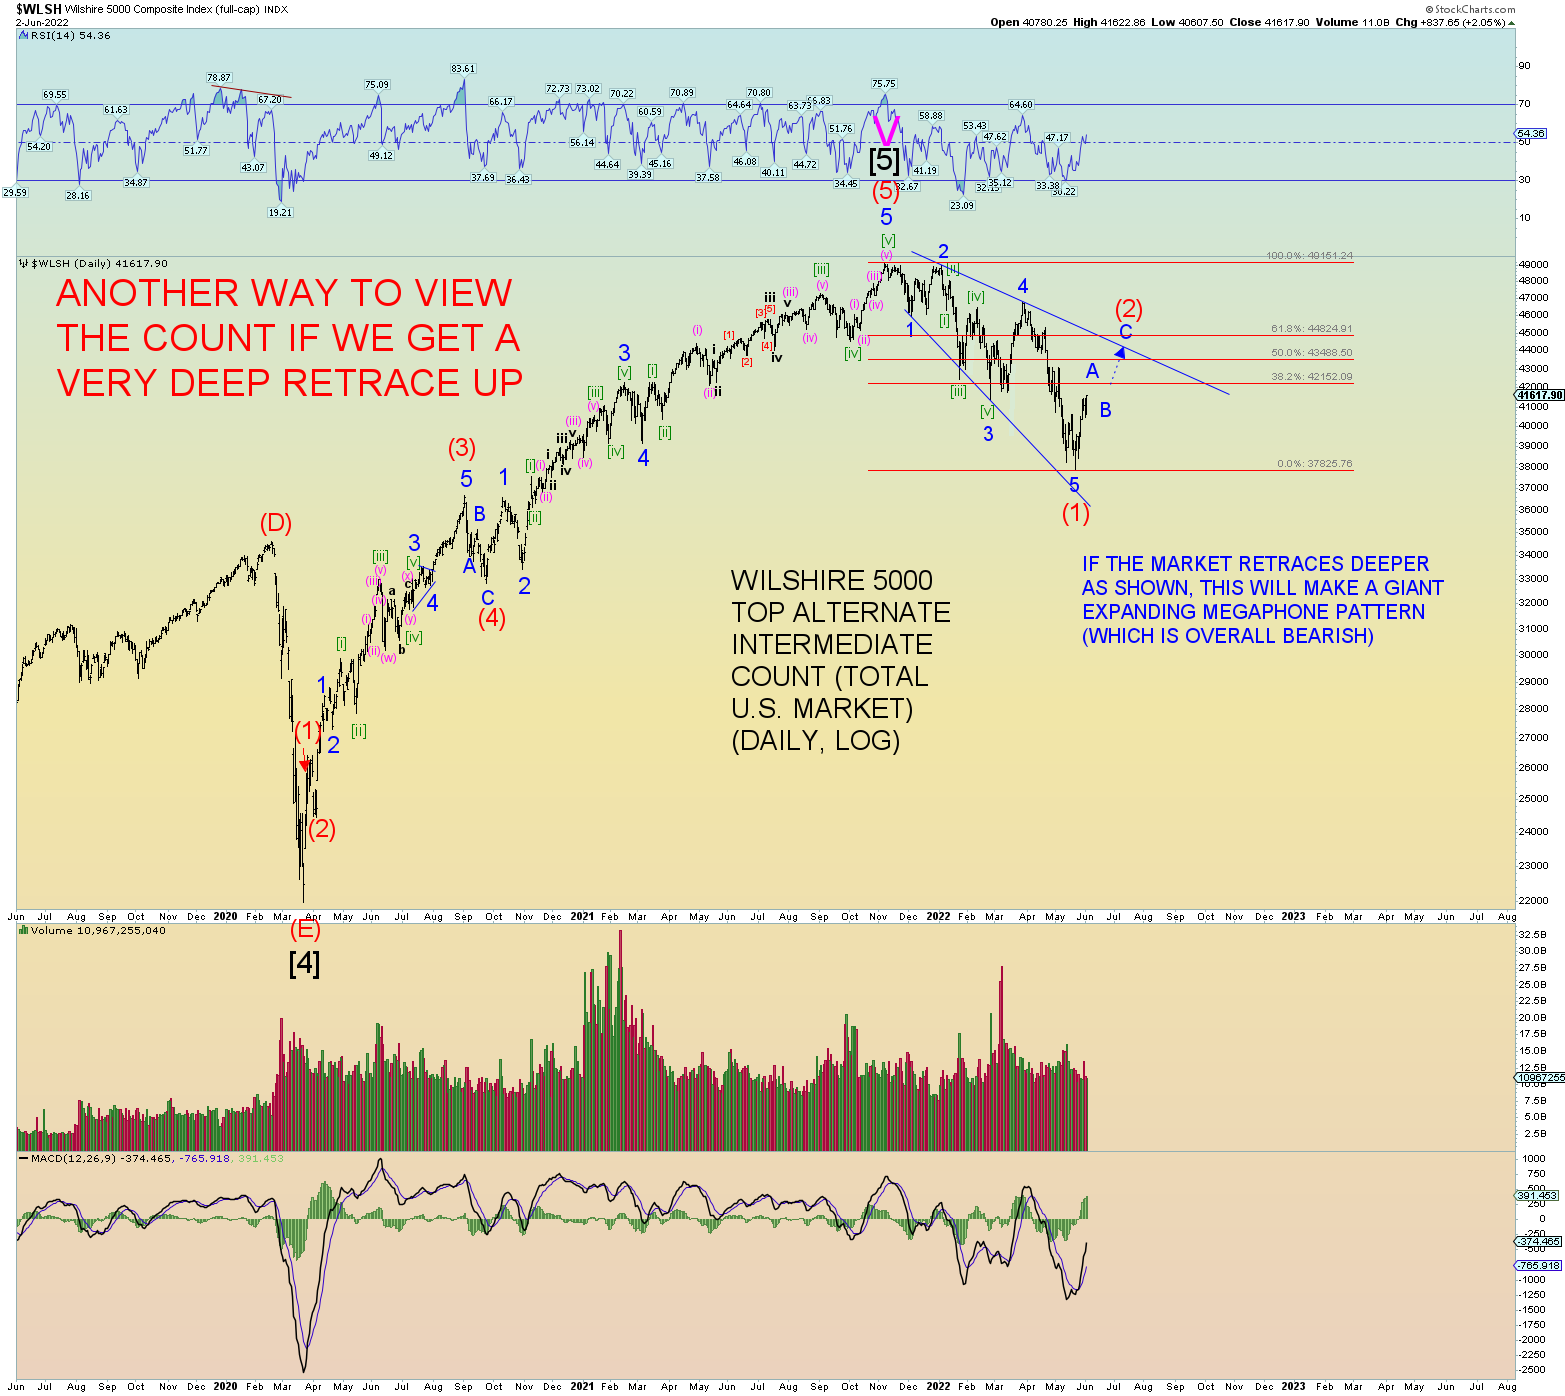
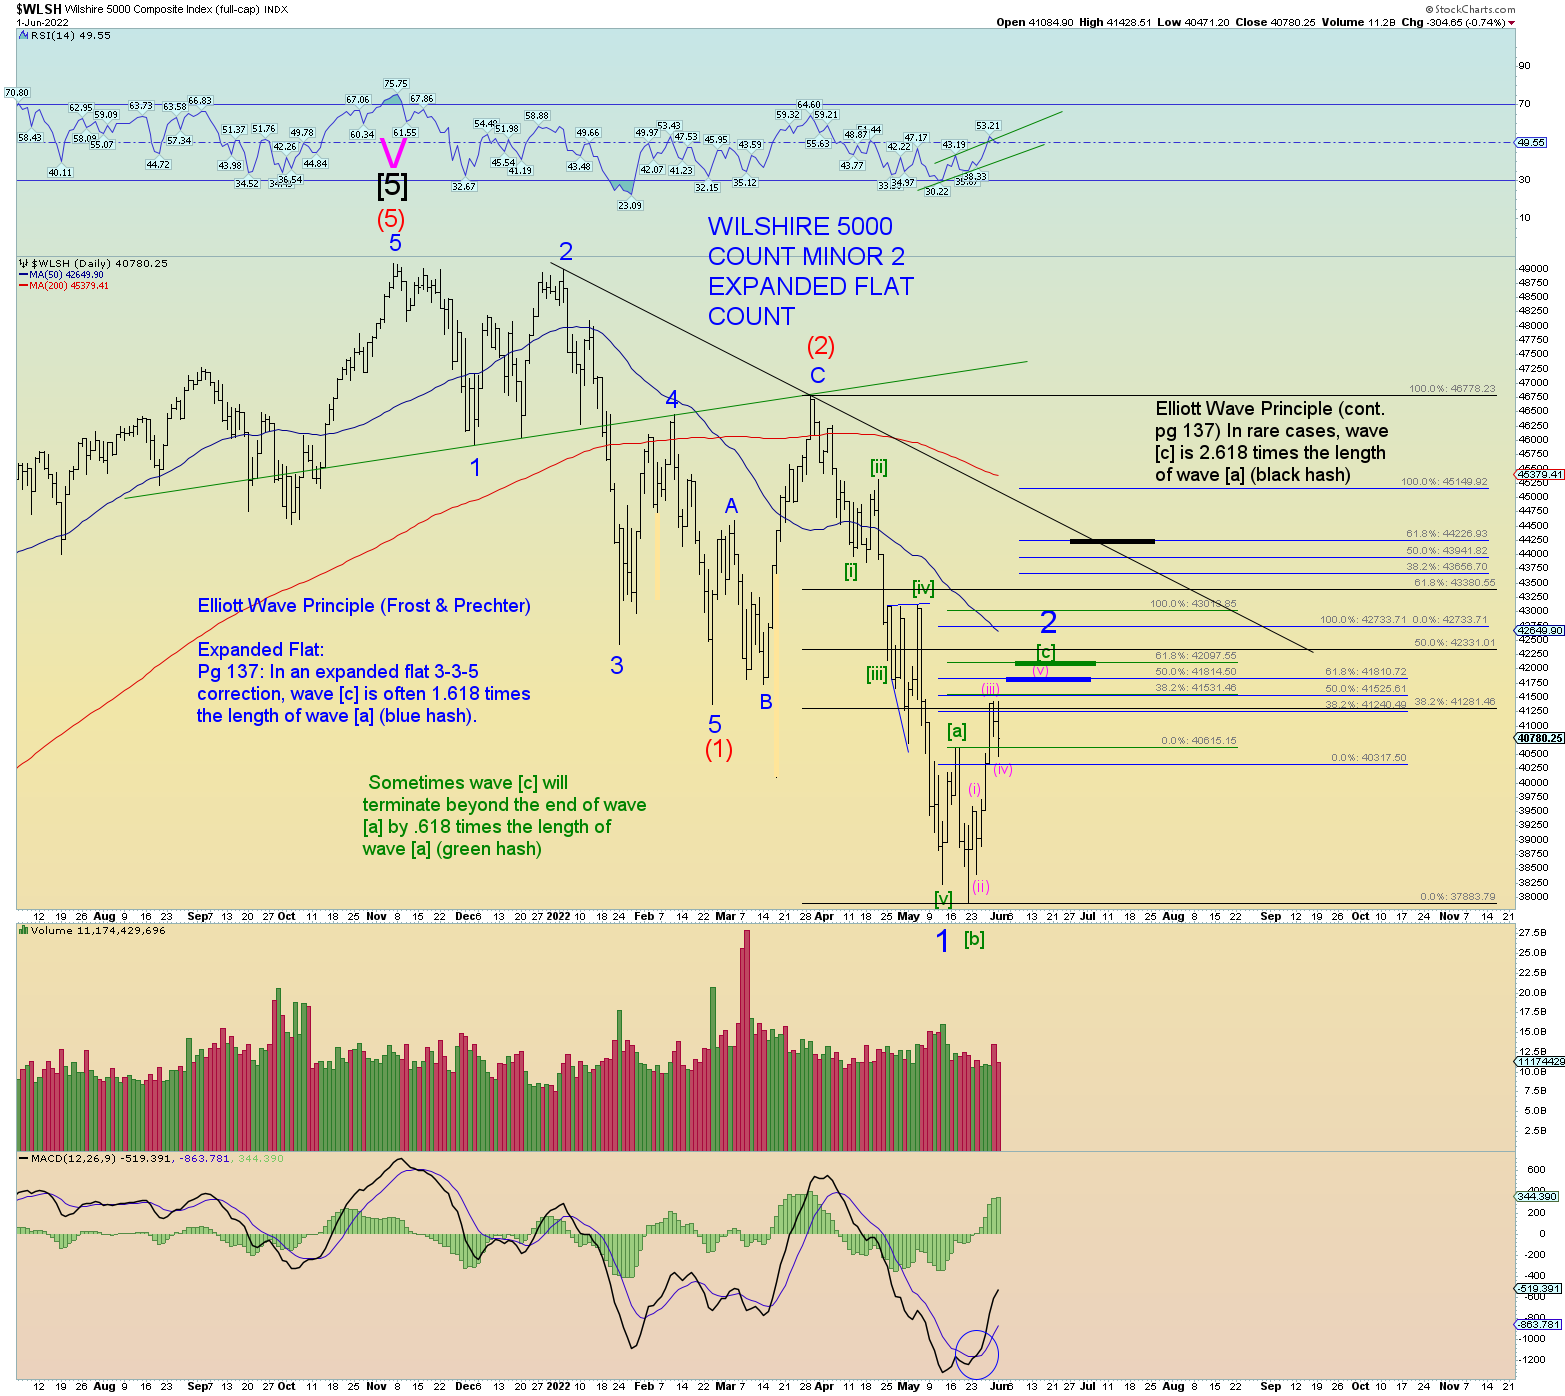
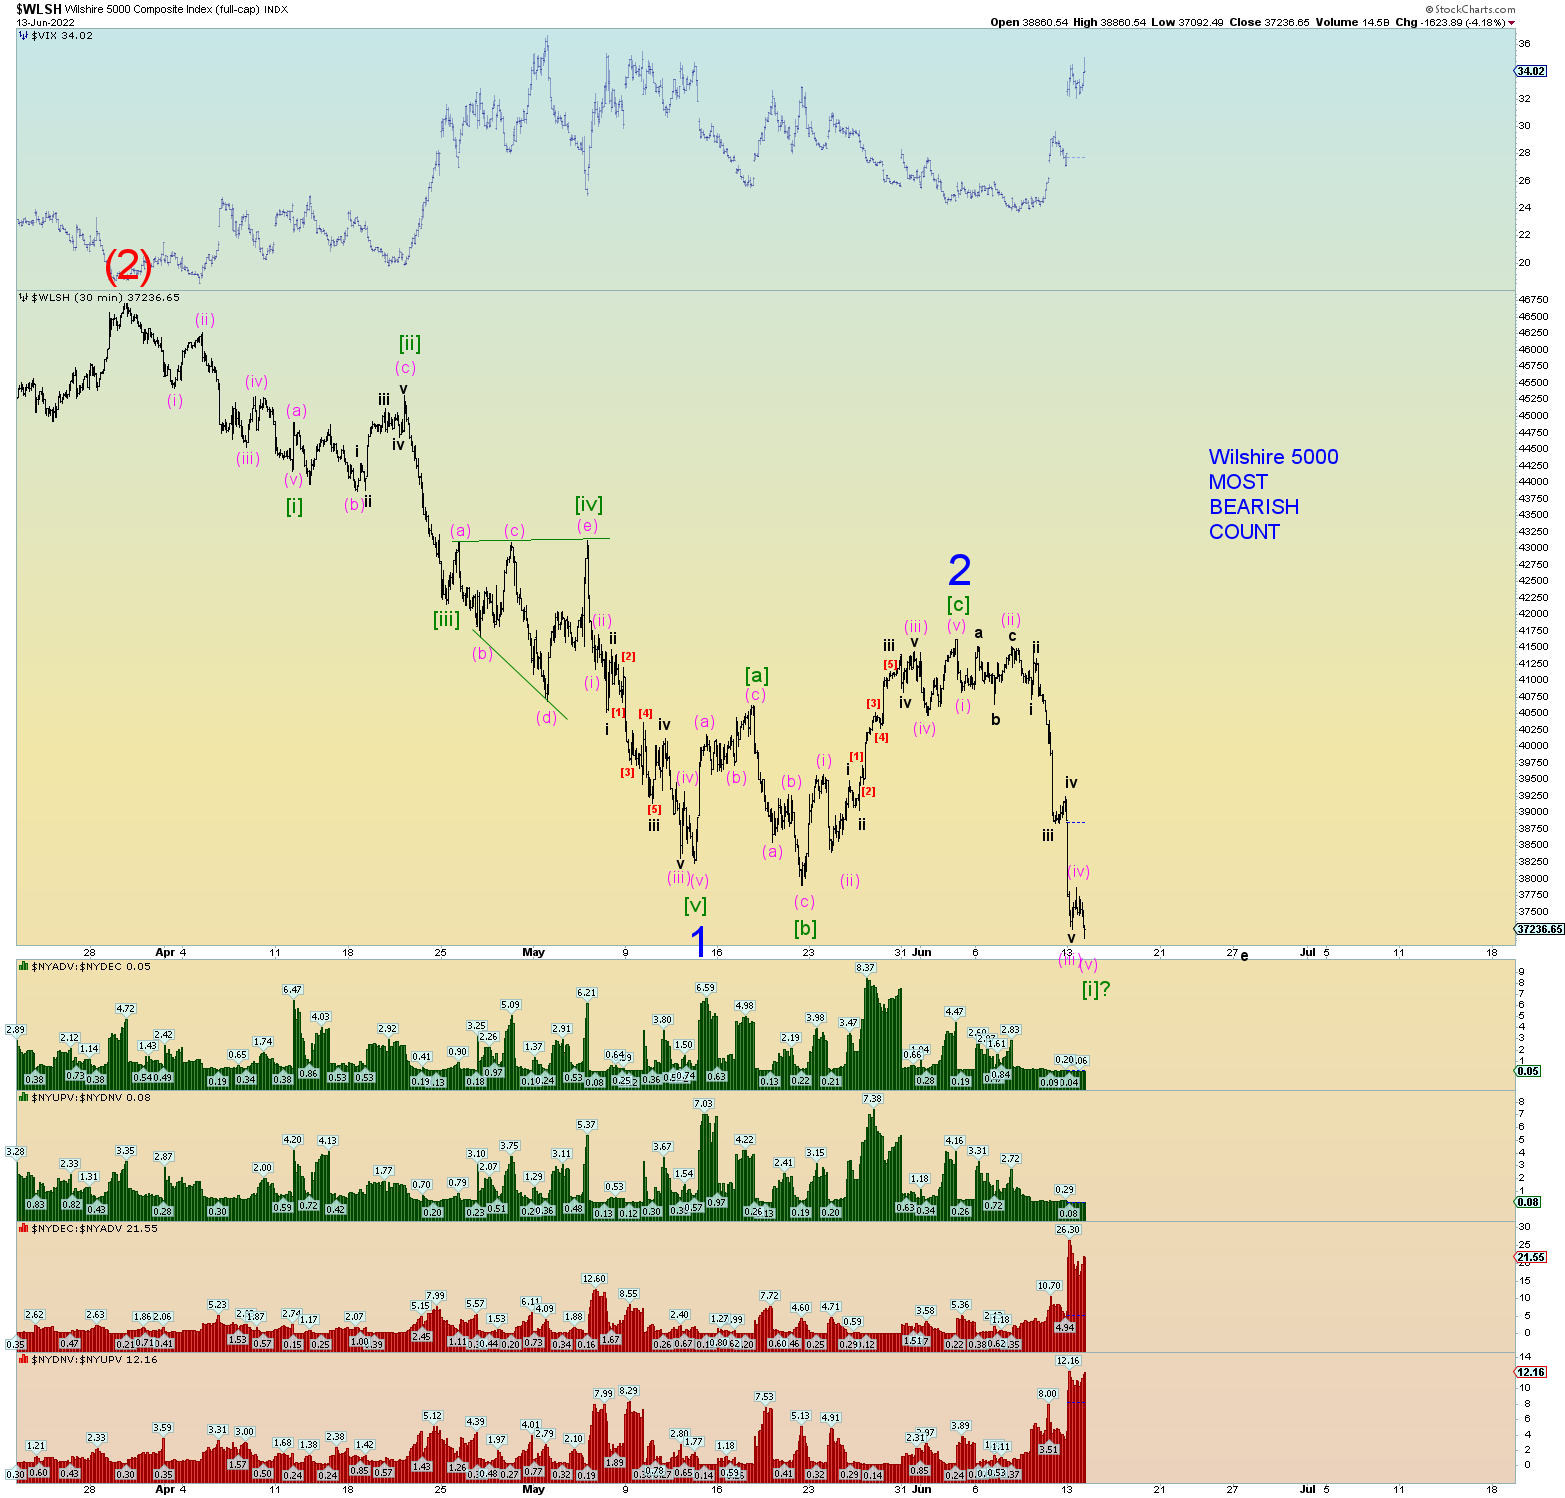
The best overall count is that the market is looking for Minute [i] of Minor 3 of Intermediate (3) price pivot low.

So much to say! How does one do it in a concise, coherent and organized manner? Well let’s break things down in categories:

MARKET TECHNICALS

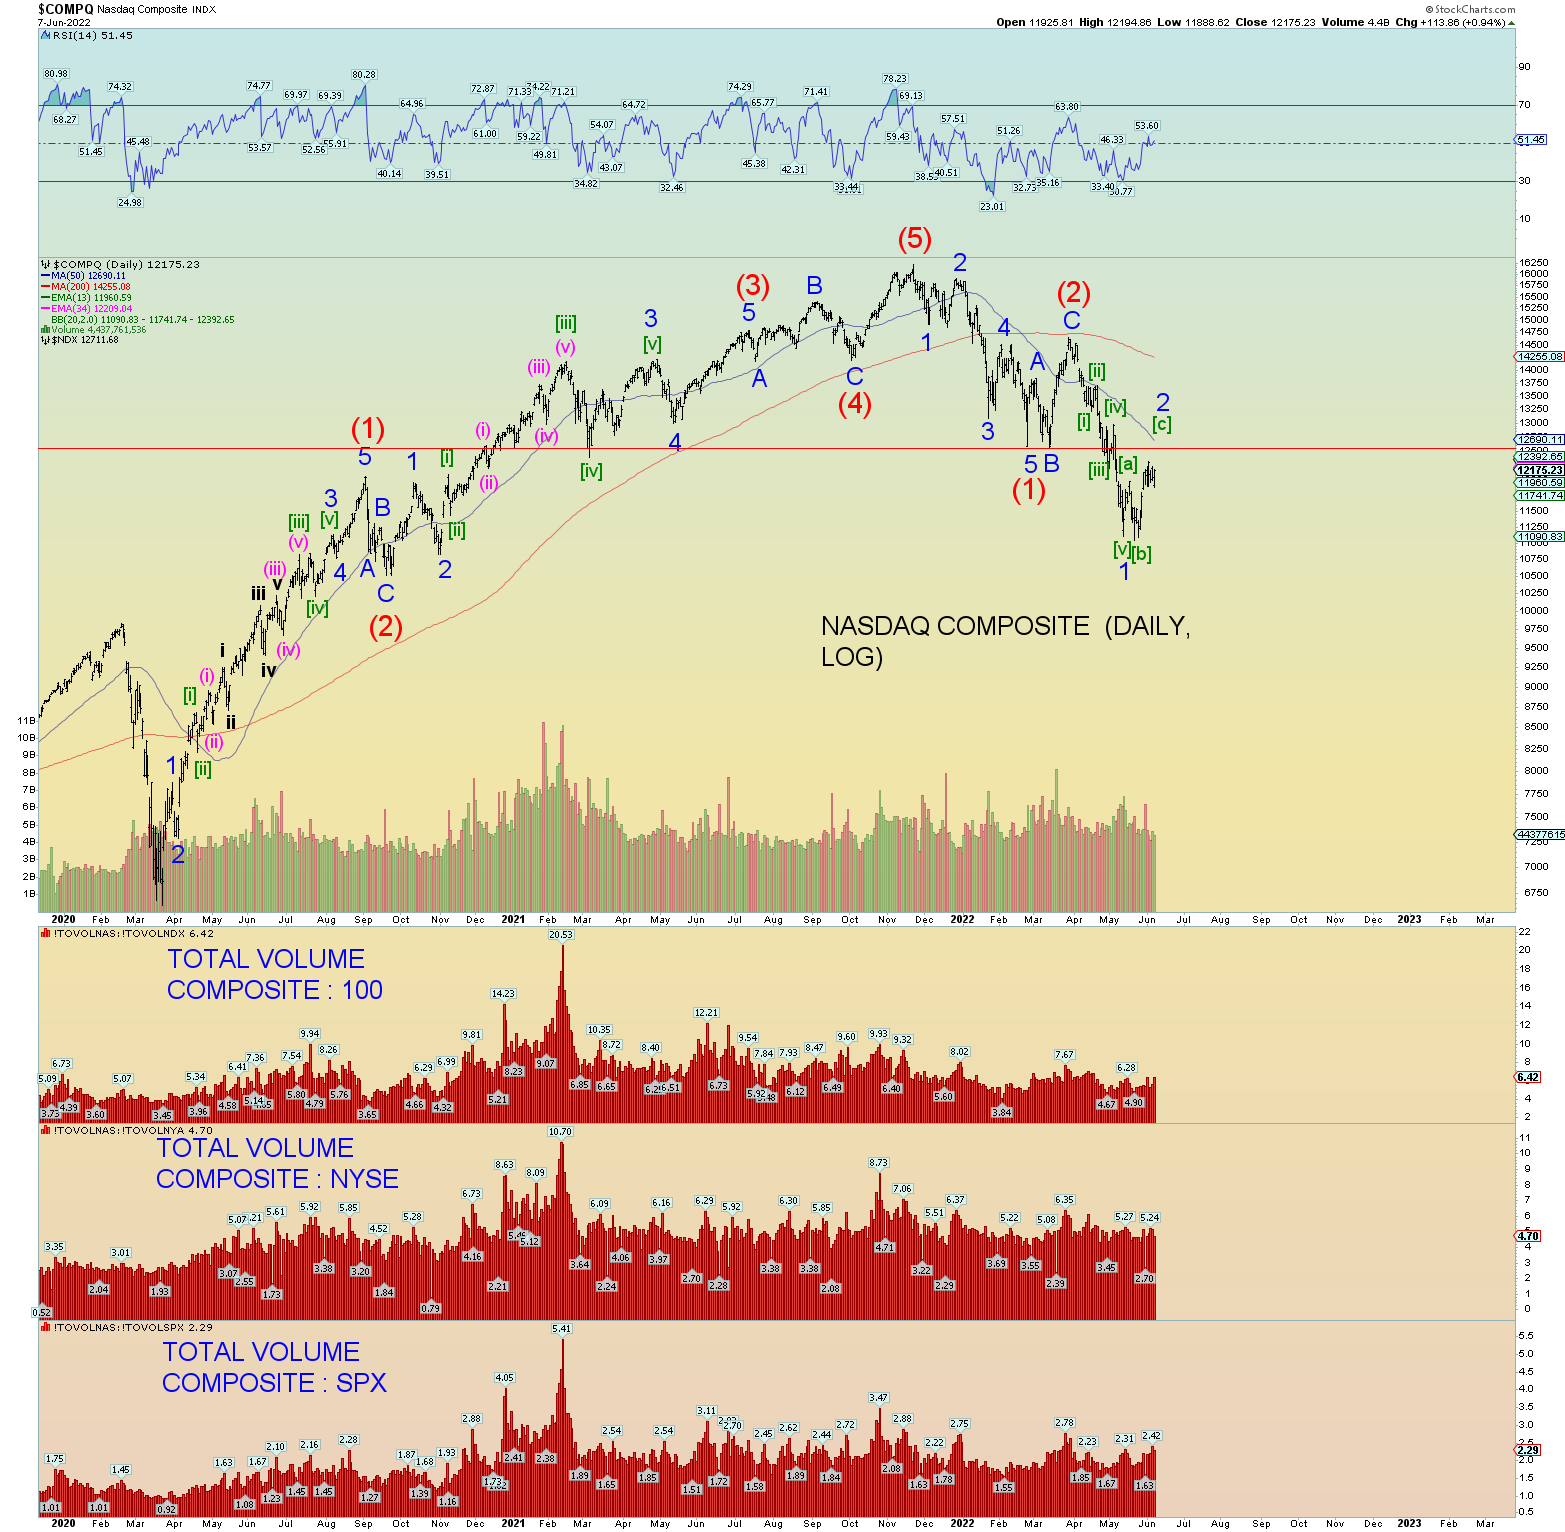
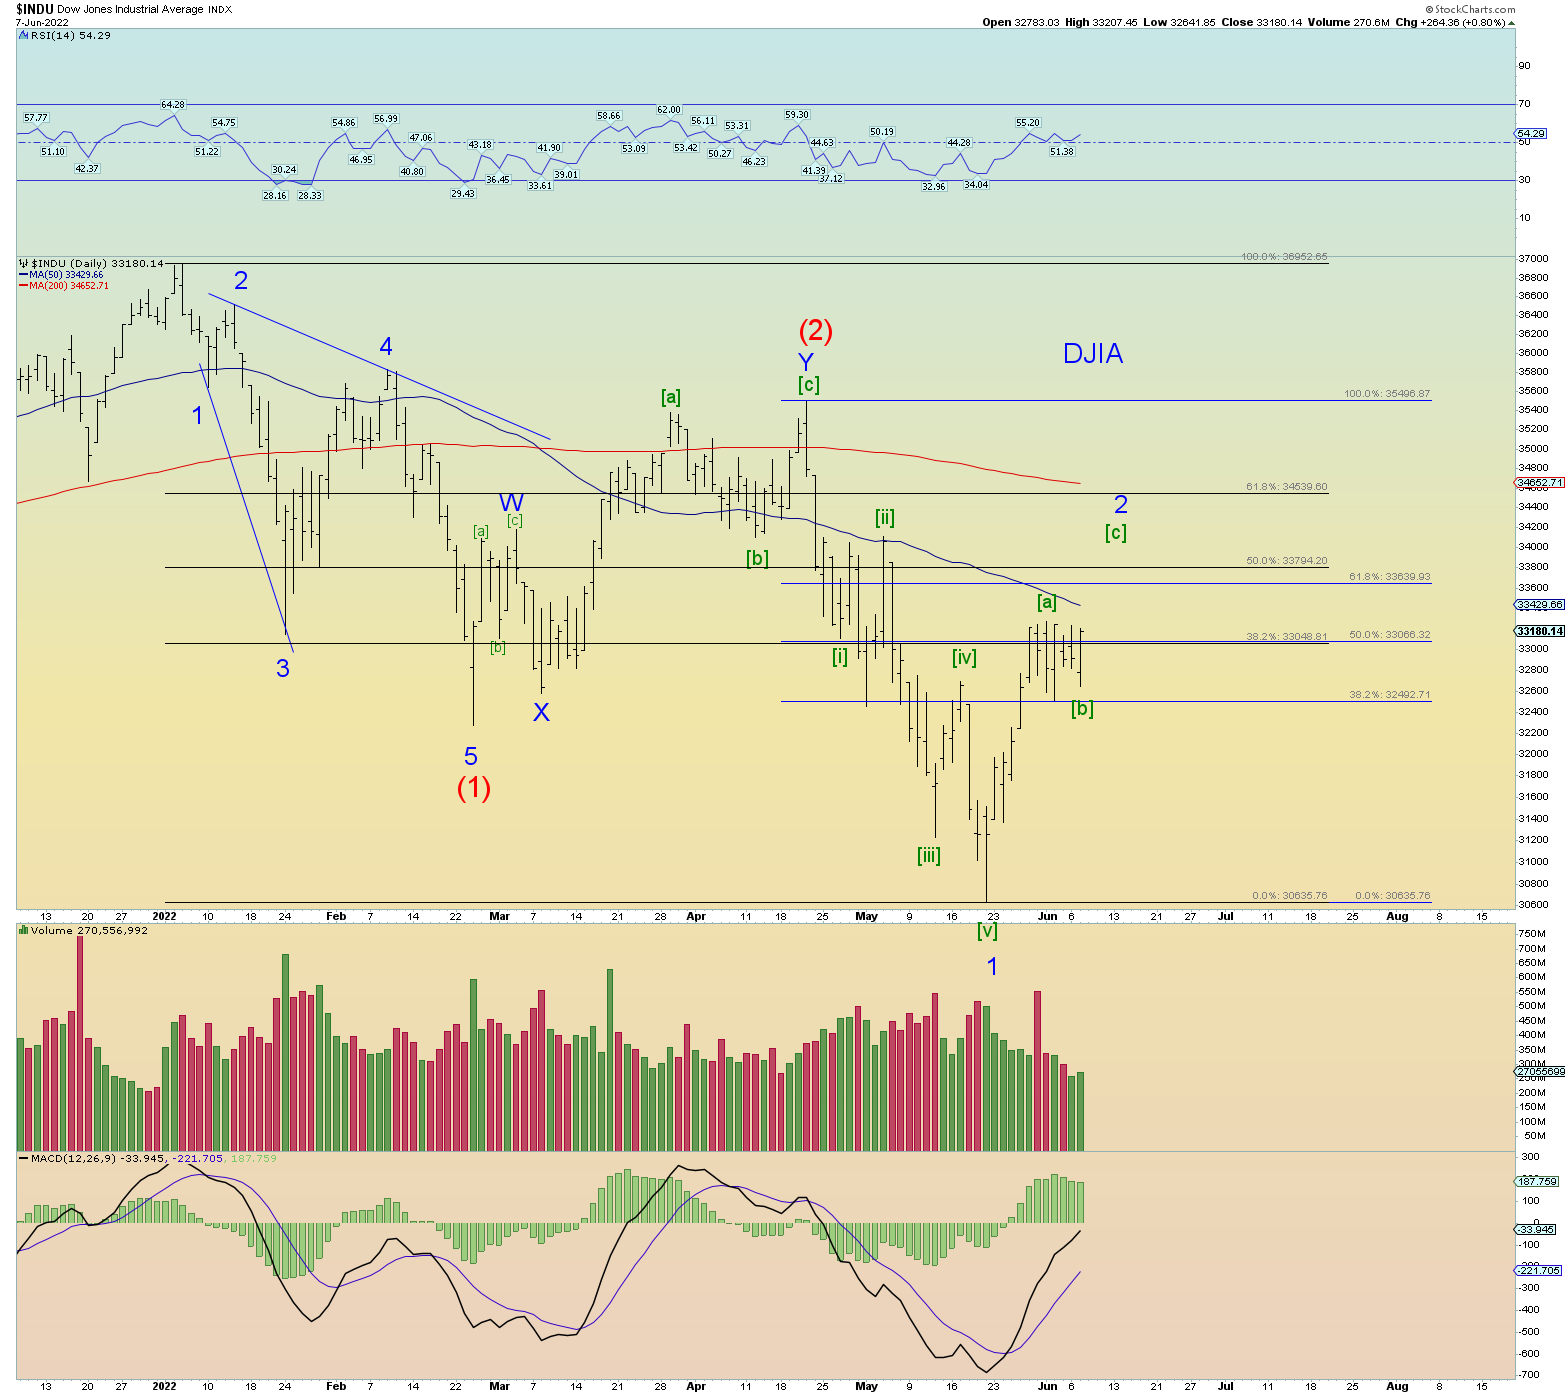
Today was the worst day in a long-time market-internal wise. Bearish market internals are increasing, not decreasing. Well above an across-the-board 90% down day overall market wise. This very bearish down day is consistent with a concerted “kickoff” of a Minor wave 3 of (3) down. Every major index finished beneath the previous pivot spike price low of the past few months (except the Russell 2000). In that regard the market seems to be in a long-term agreement.

Another technical situation is that today’s low reached a down trending trendline. If tomorrow was to open smash mouth gap down through this trendline, then probably a full-blown market crash is under way. Some more commentary beneath the charts.

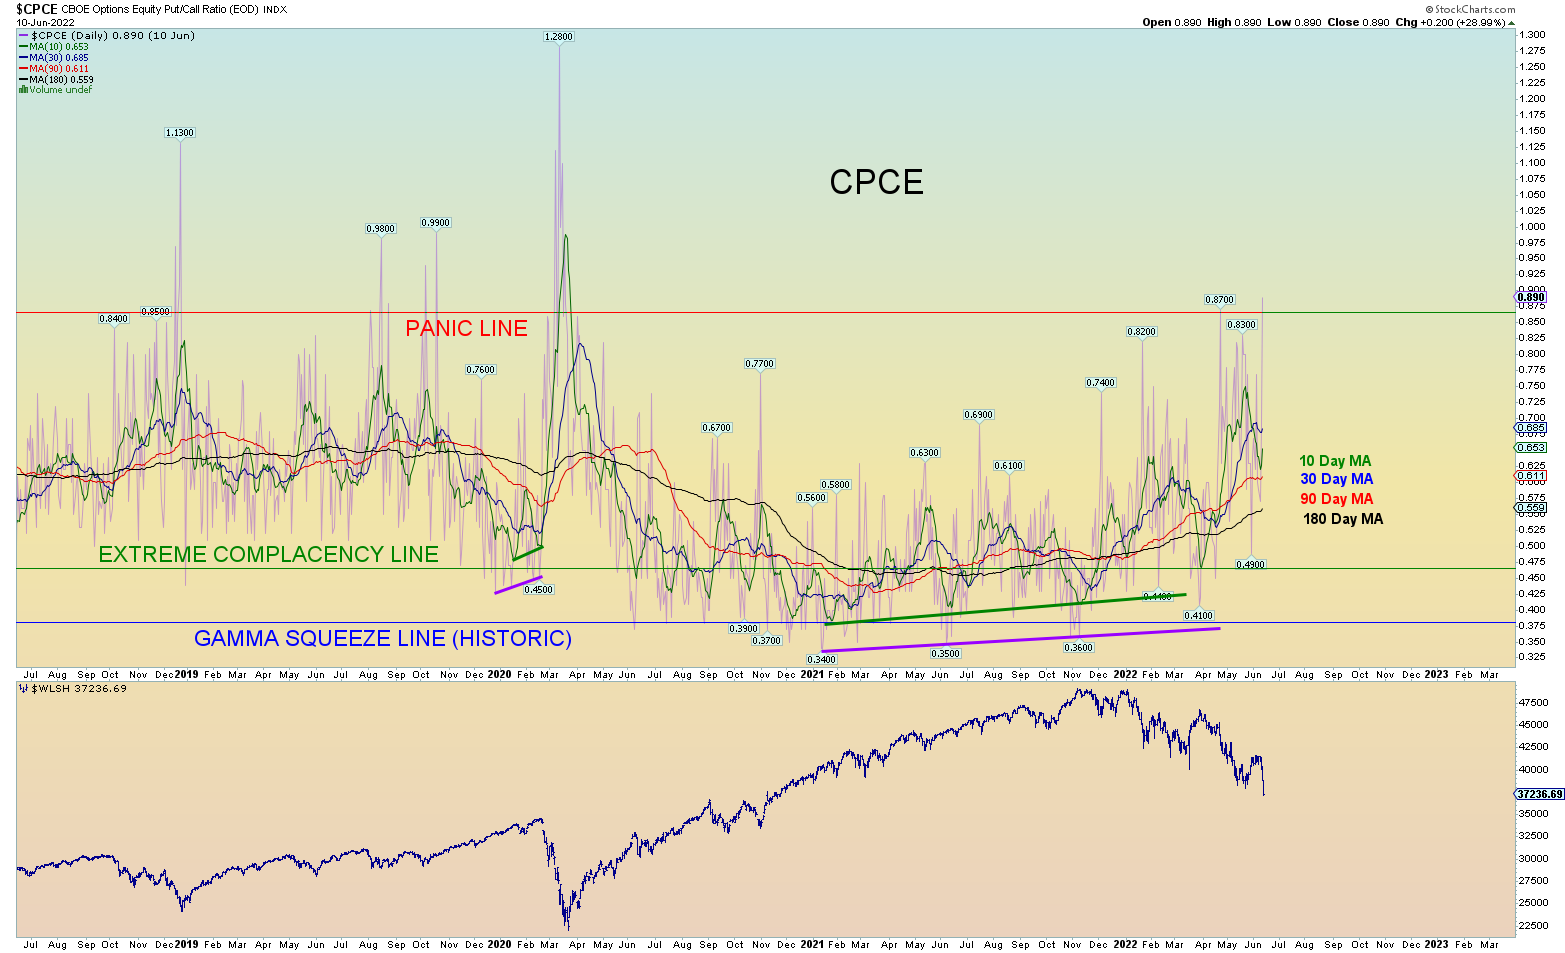
Again, the markets are at the mercy of overnight futures, so we shan’t waste too much time on things tonight. Technical-wise, the VIX is NOT yet at a new pivot high since November and the medium-term moving averages of the CPCE is far from a panic oversold situation. As is the simple mechanics of RSI and MACD of any daily chart you look at. In other words, there is plenty of technical bearish room to run on not only the daily charts but the weekly and monthly. So, this supports the overall bearish long term wave counts. But we knew that.

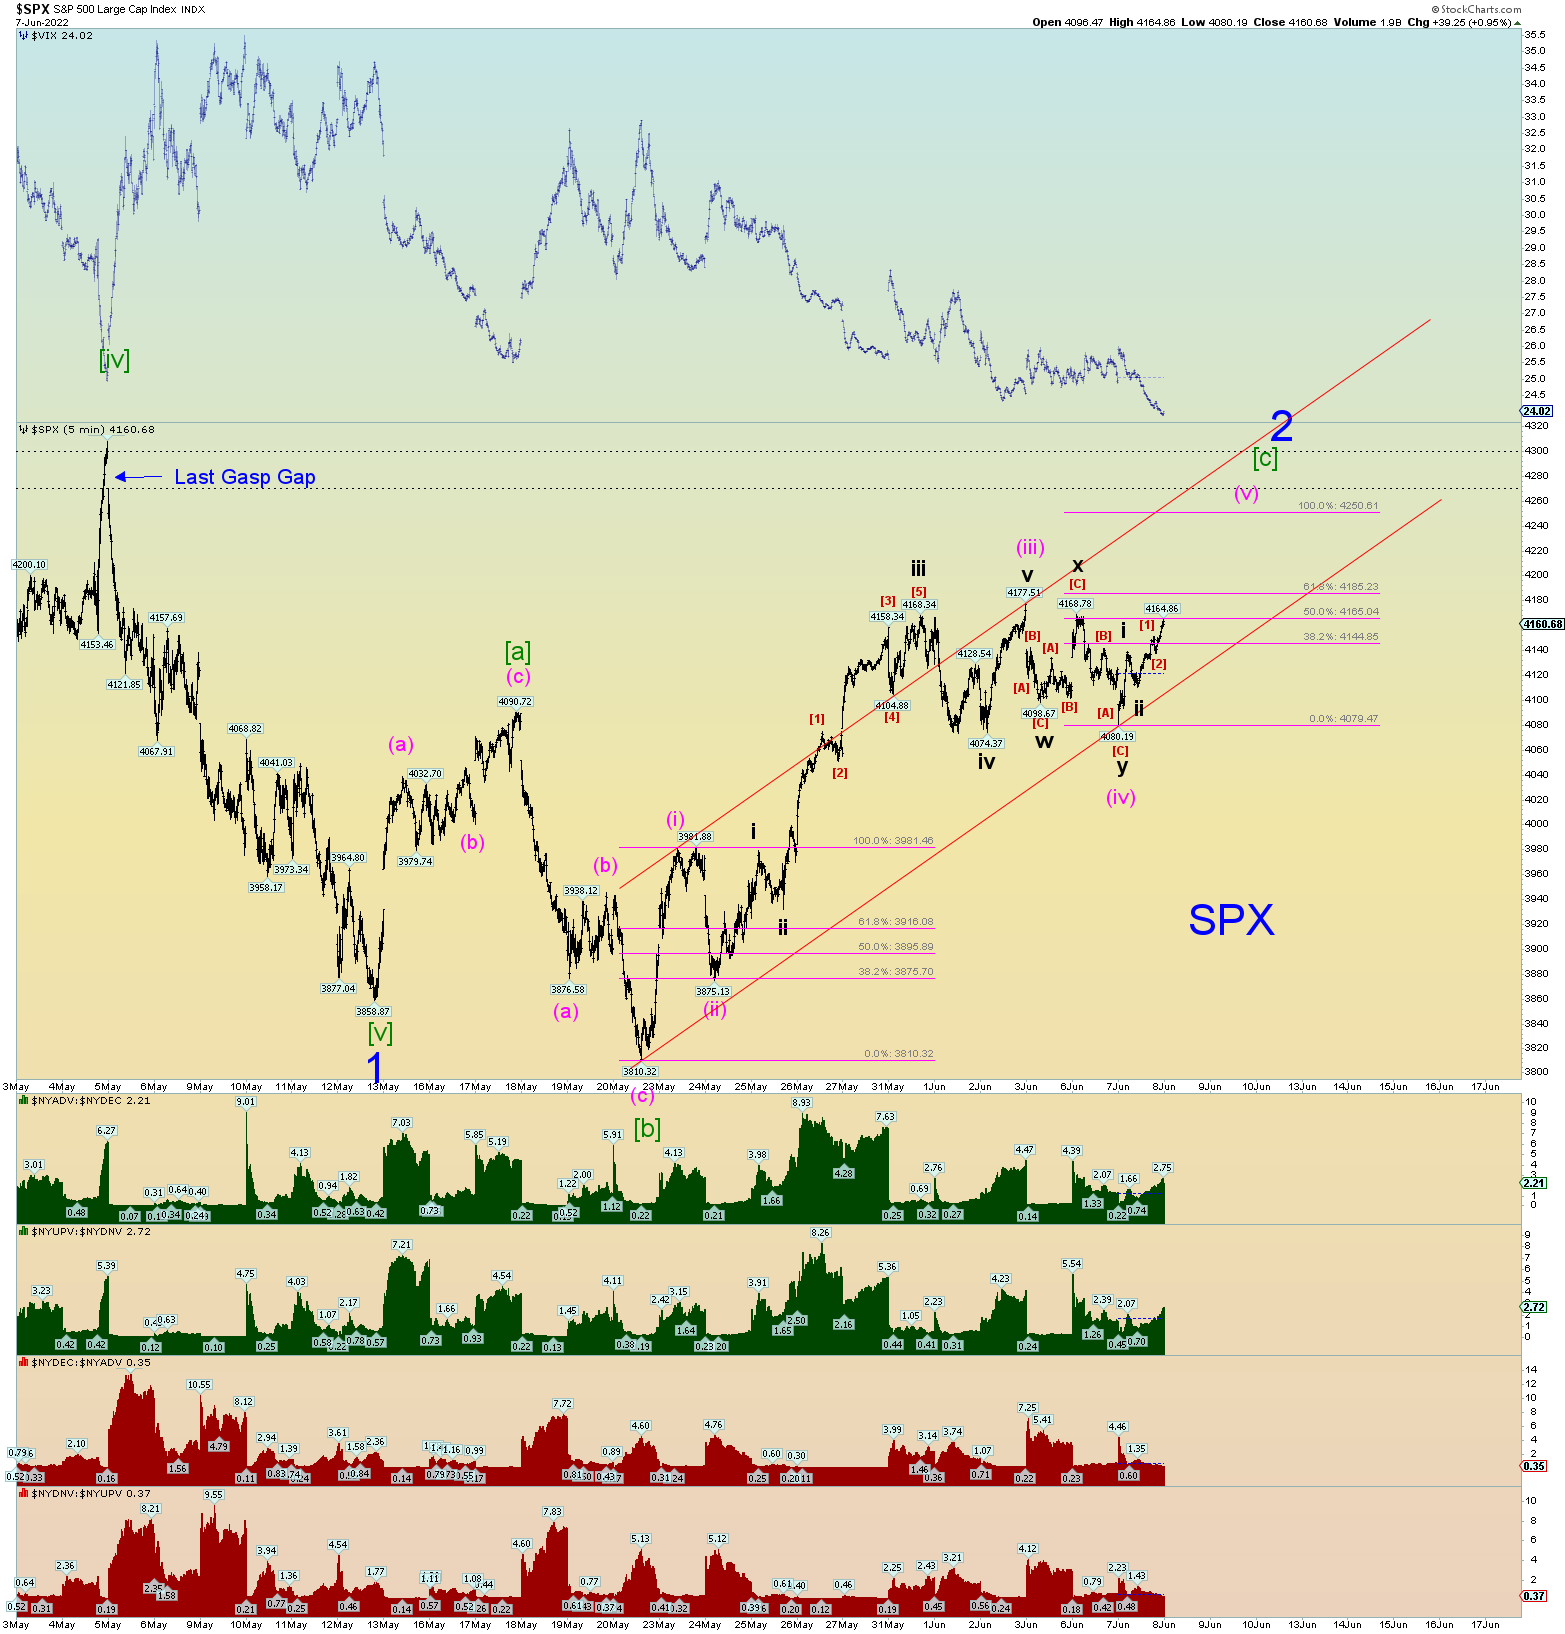
Finally, we can see that huge gap(s) down in the market indices (such as in the SPX) exists and we can make a certain logical wave statement as such: IF these gaps are to be covered THEN now is the best time to do so concerning a wave count interpretation.

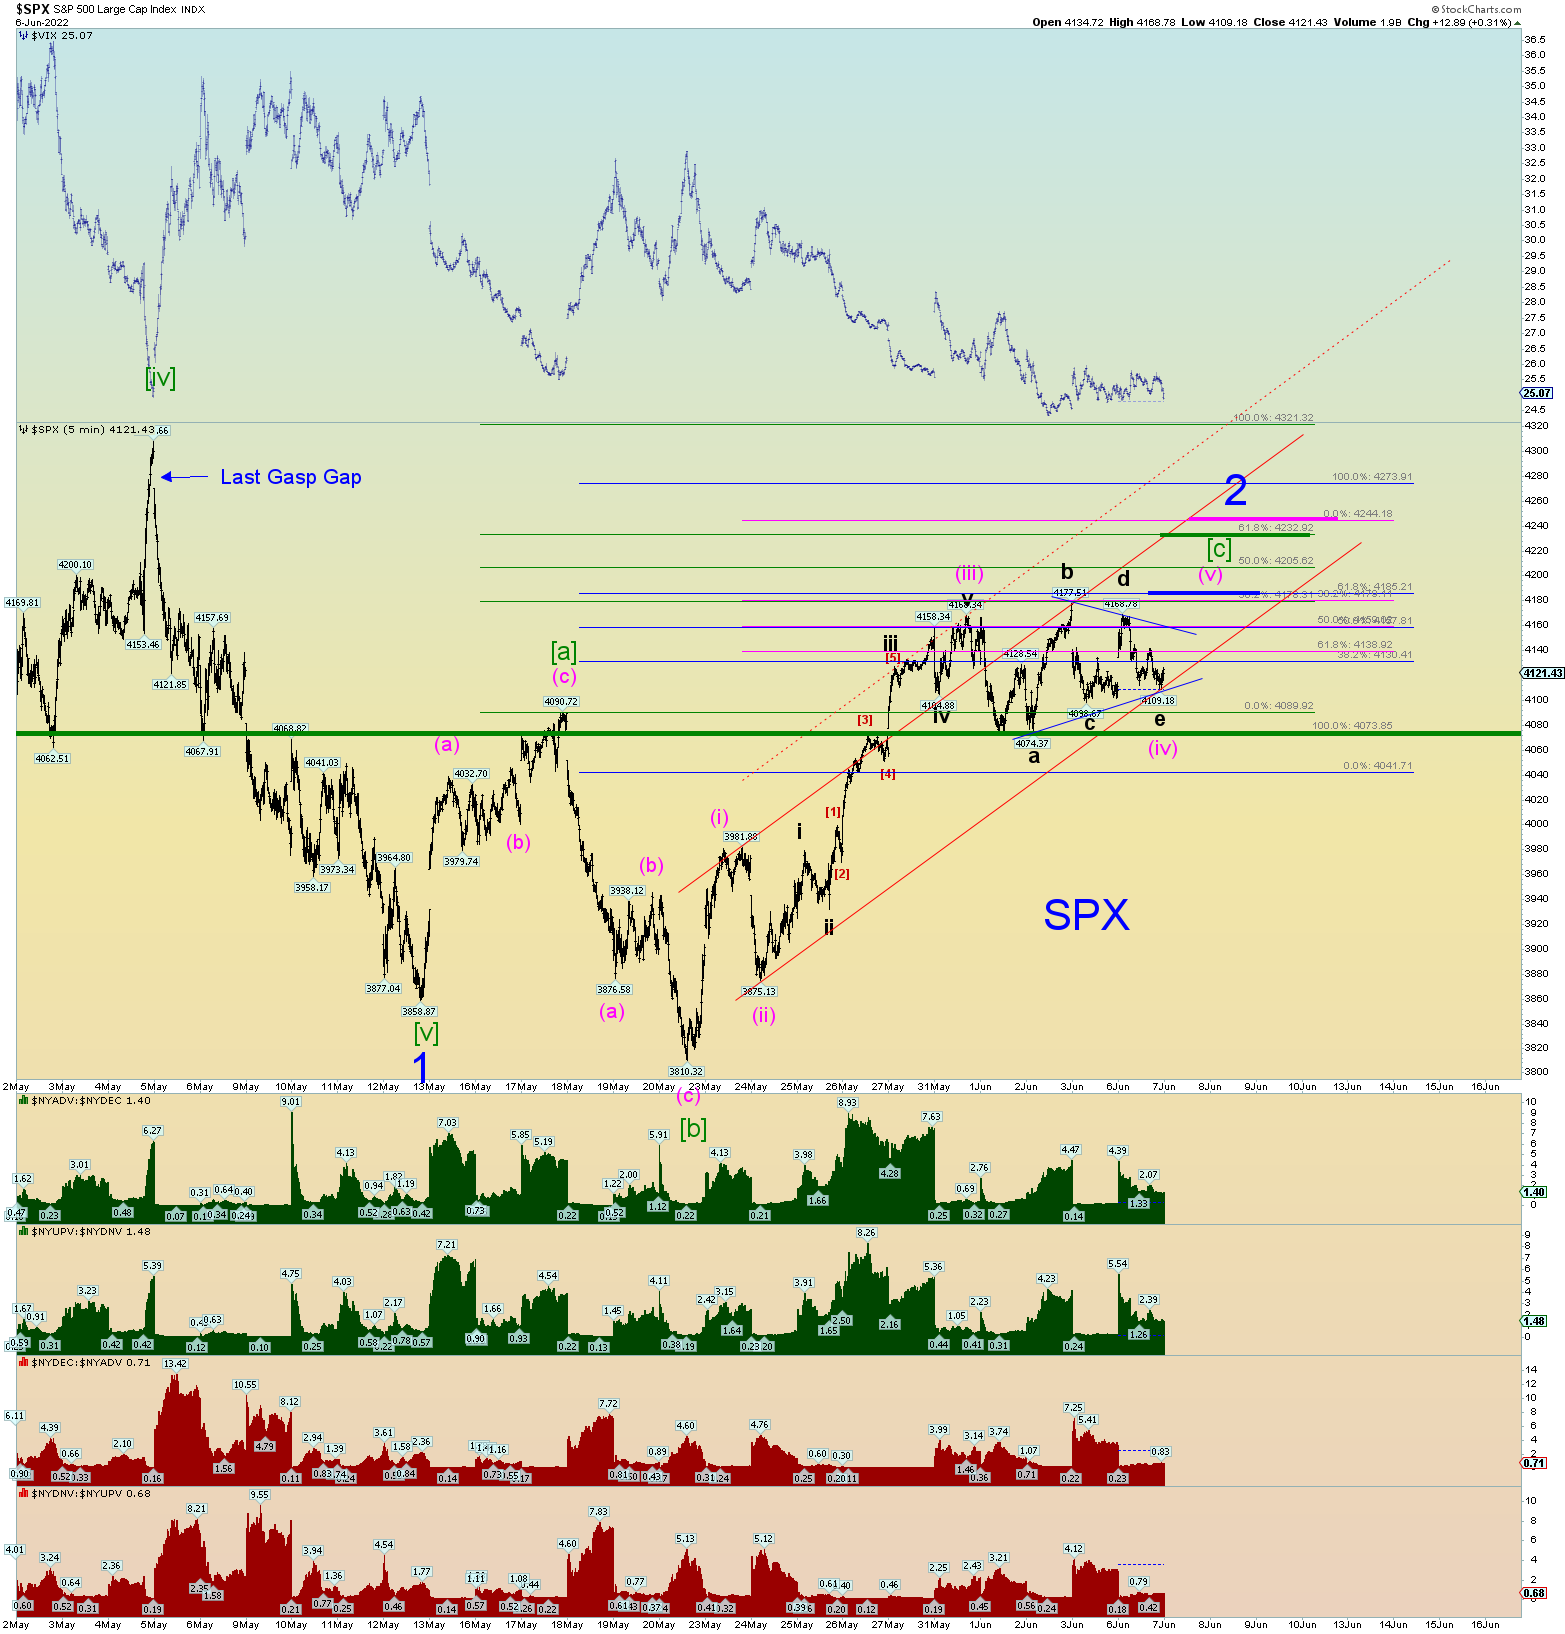
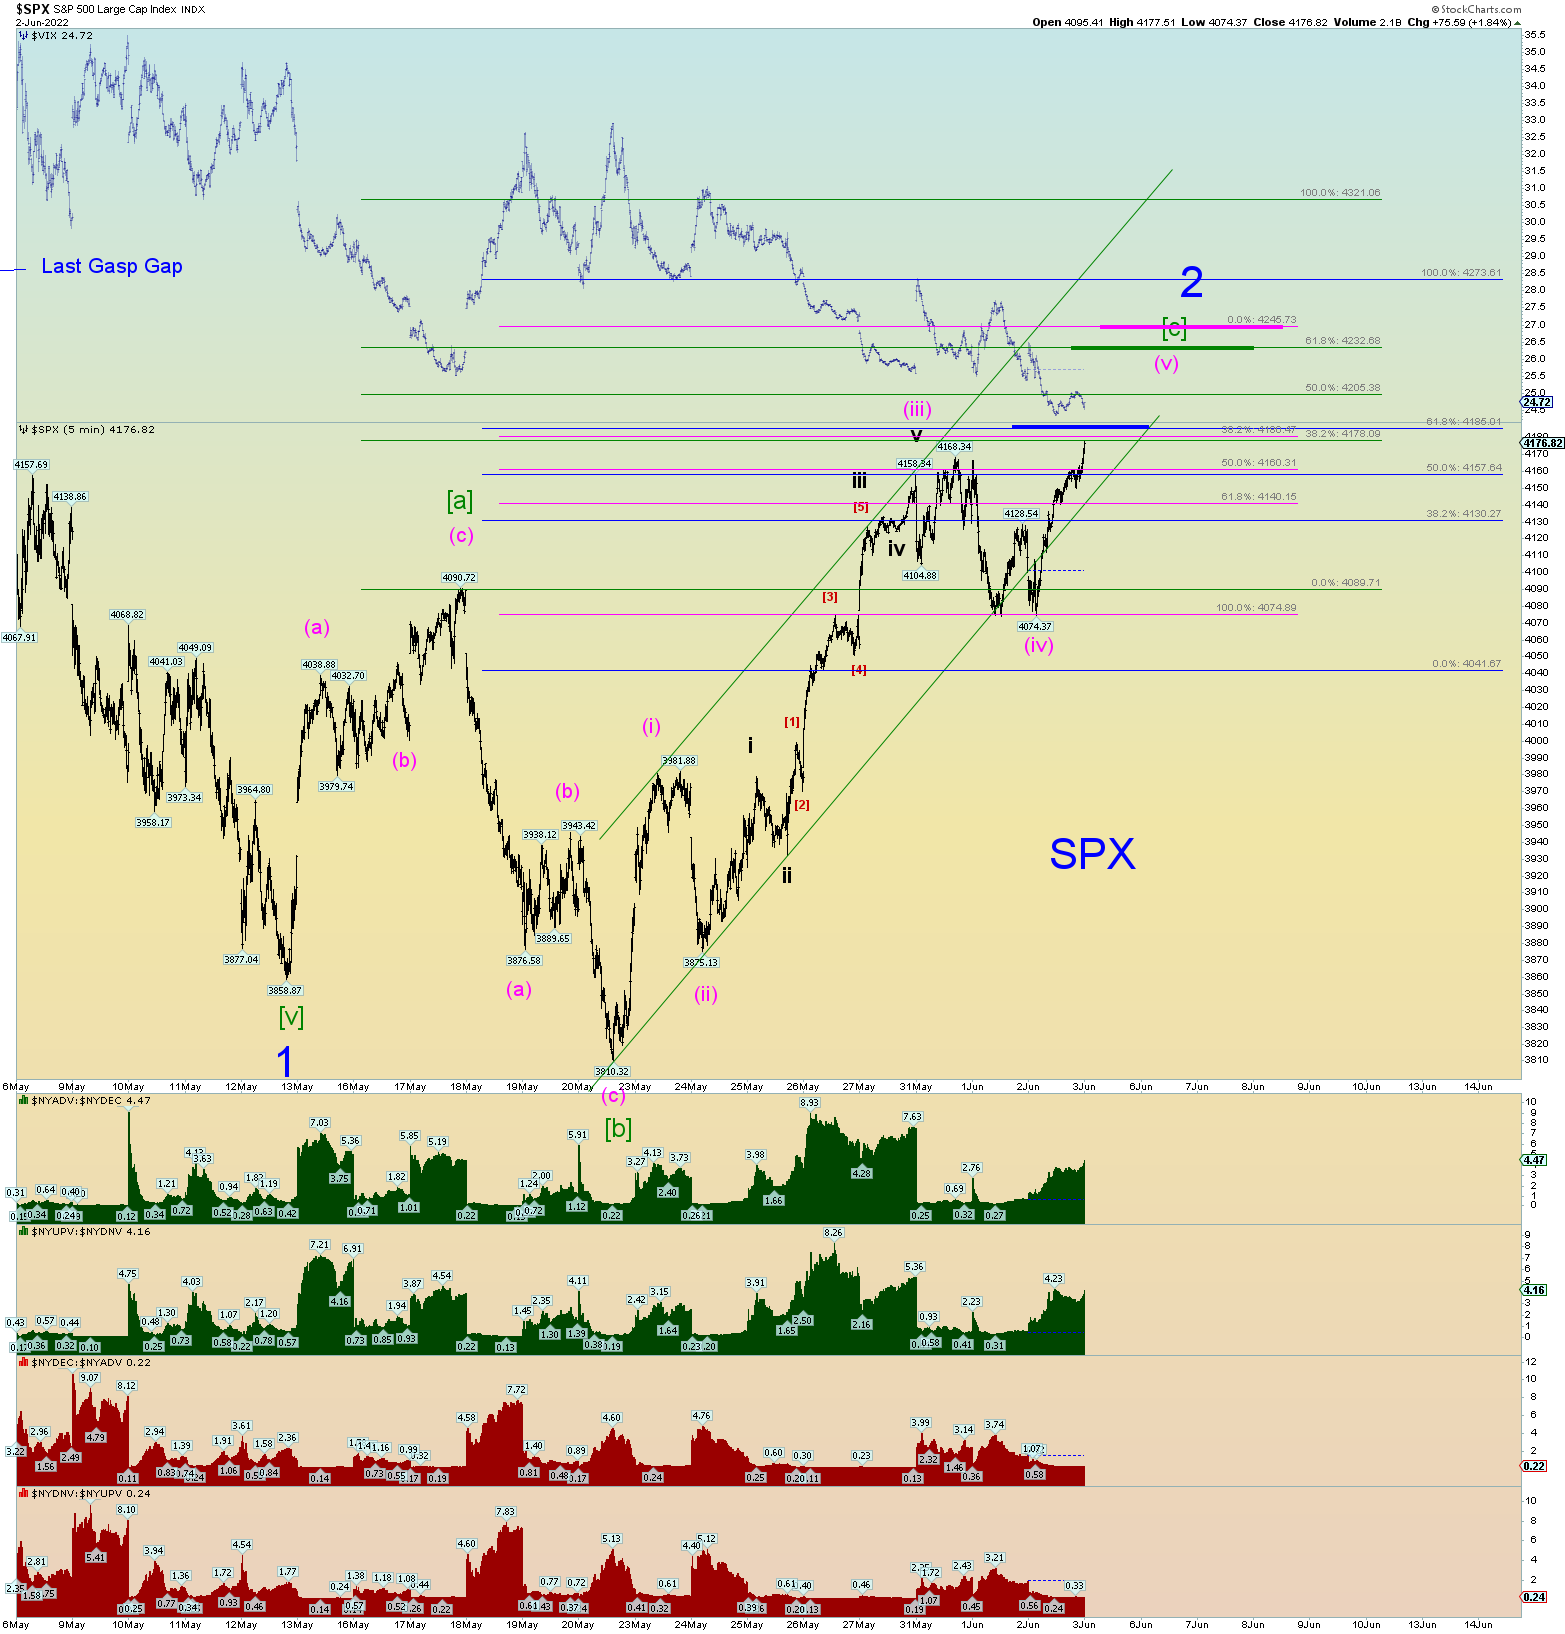
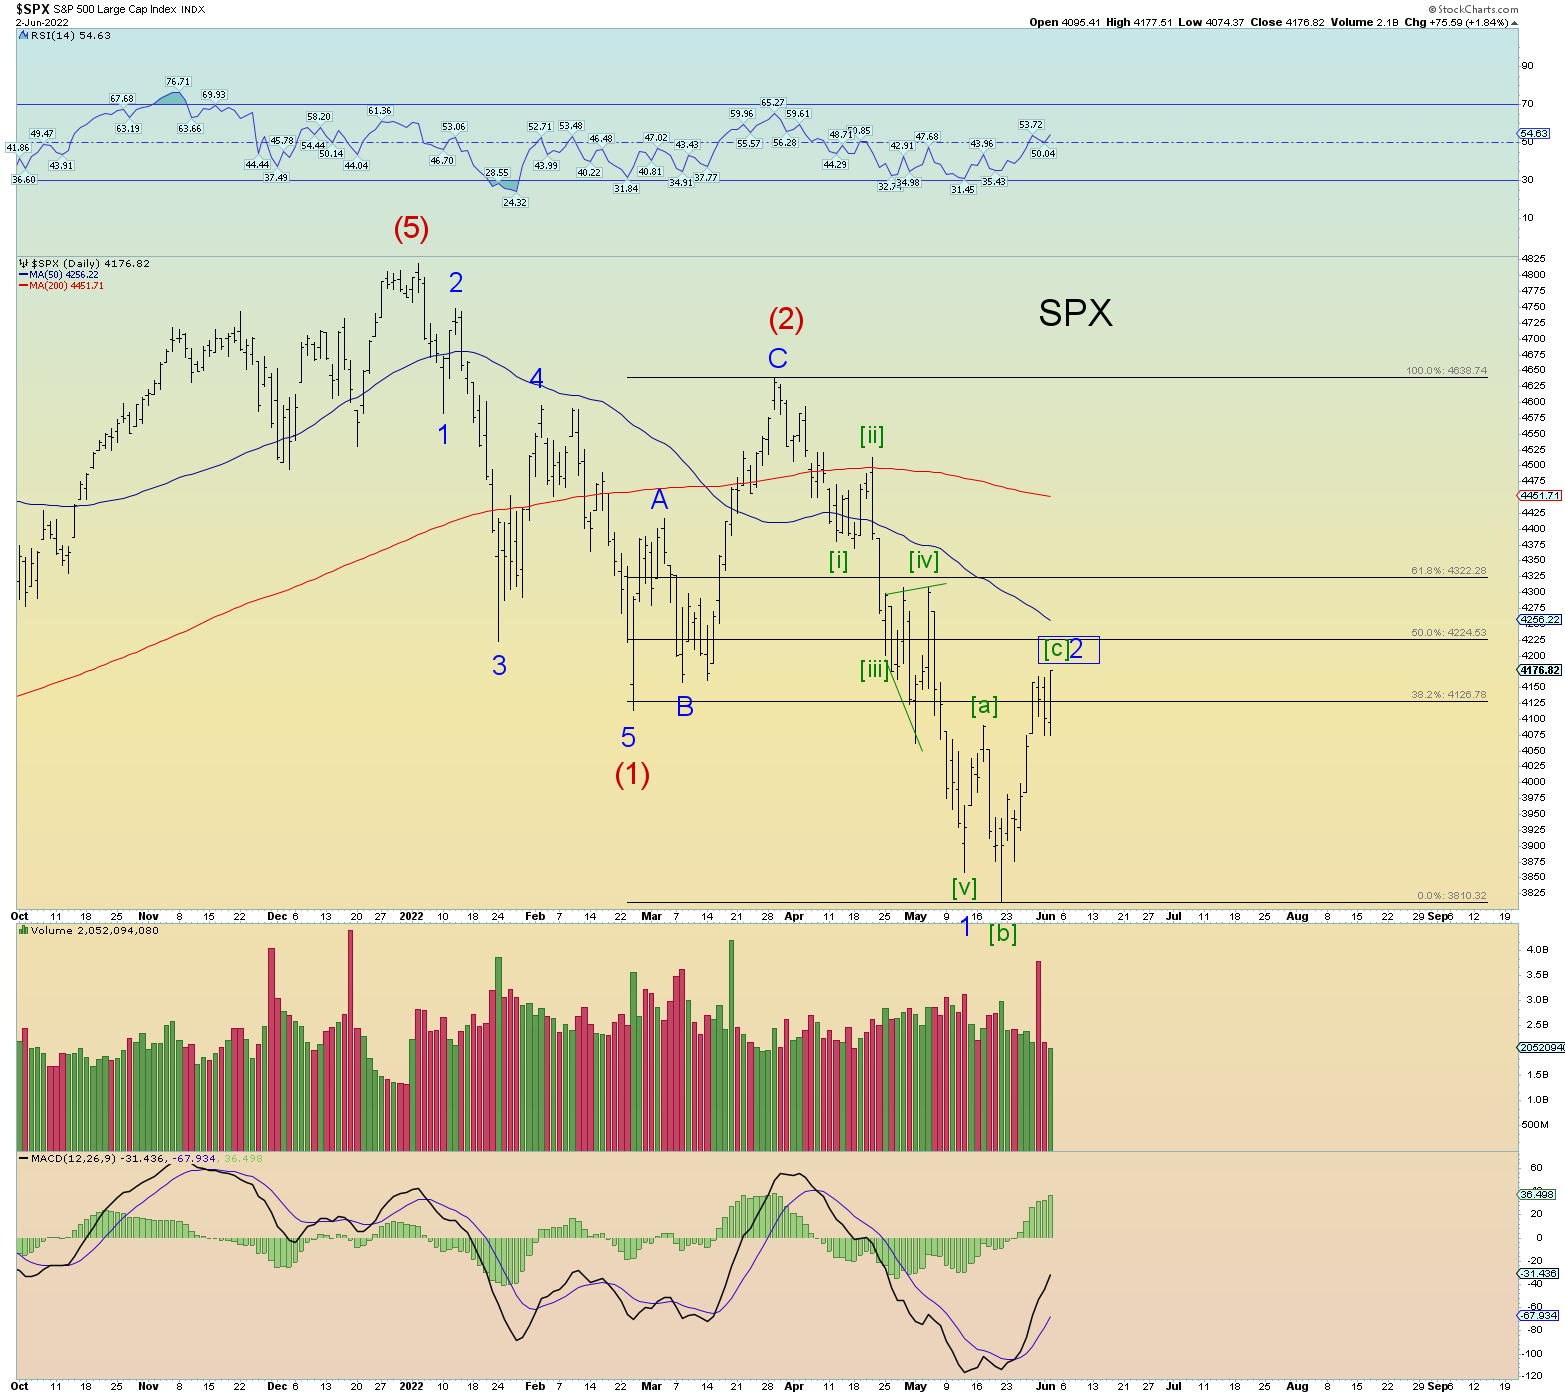
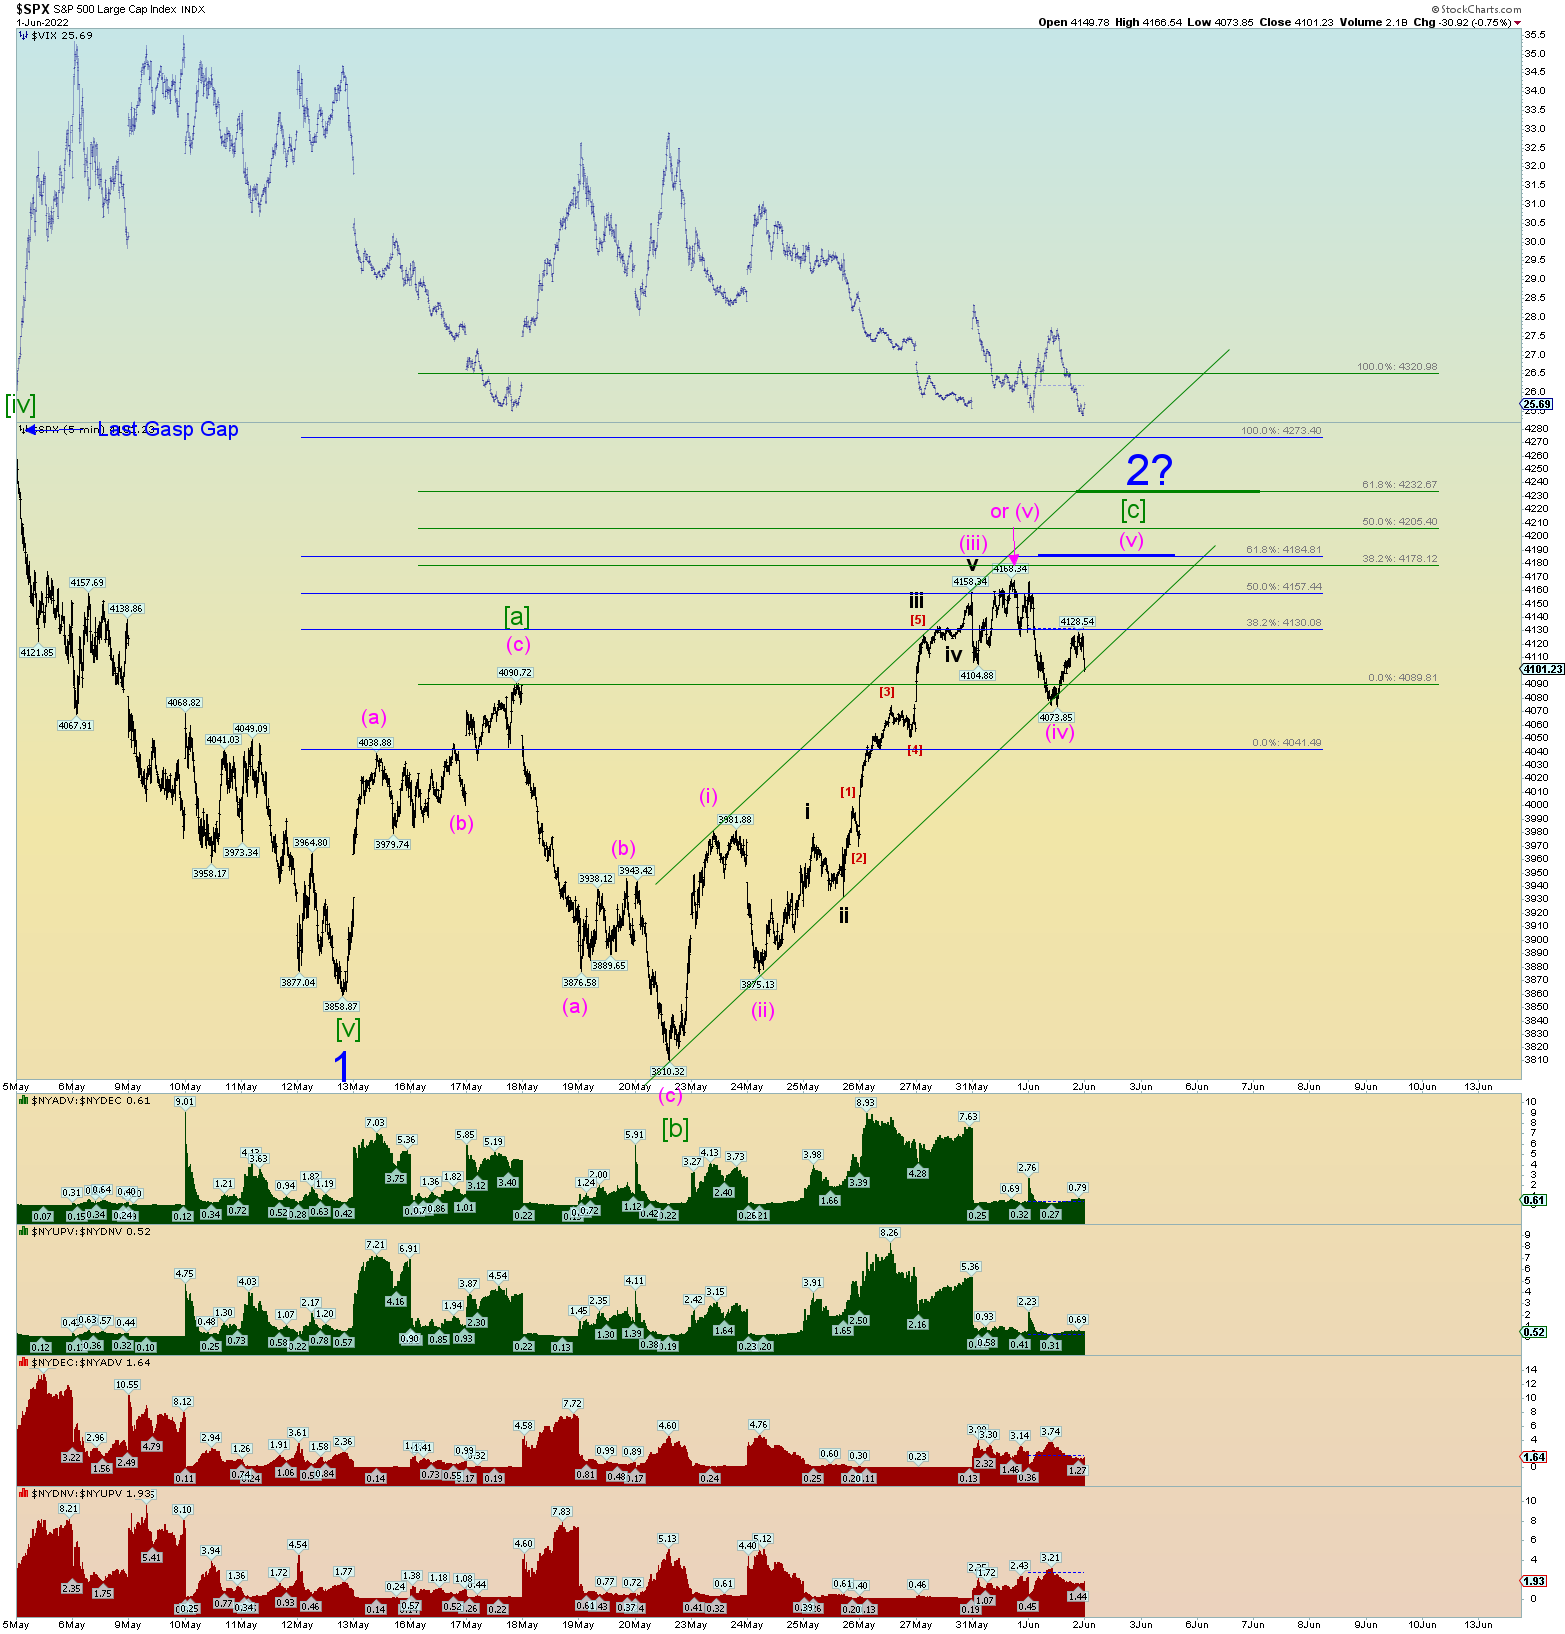
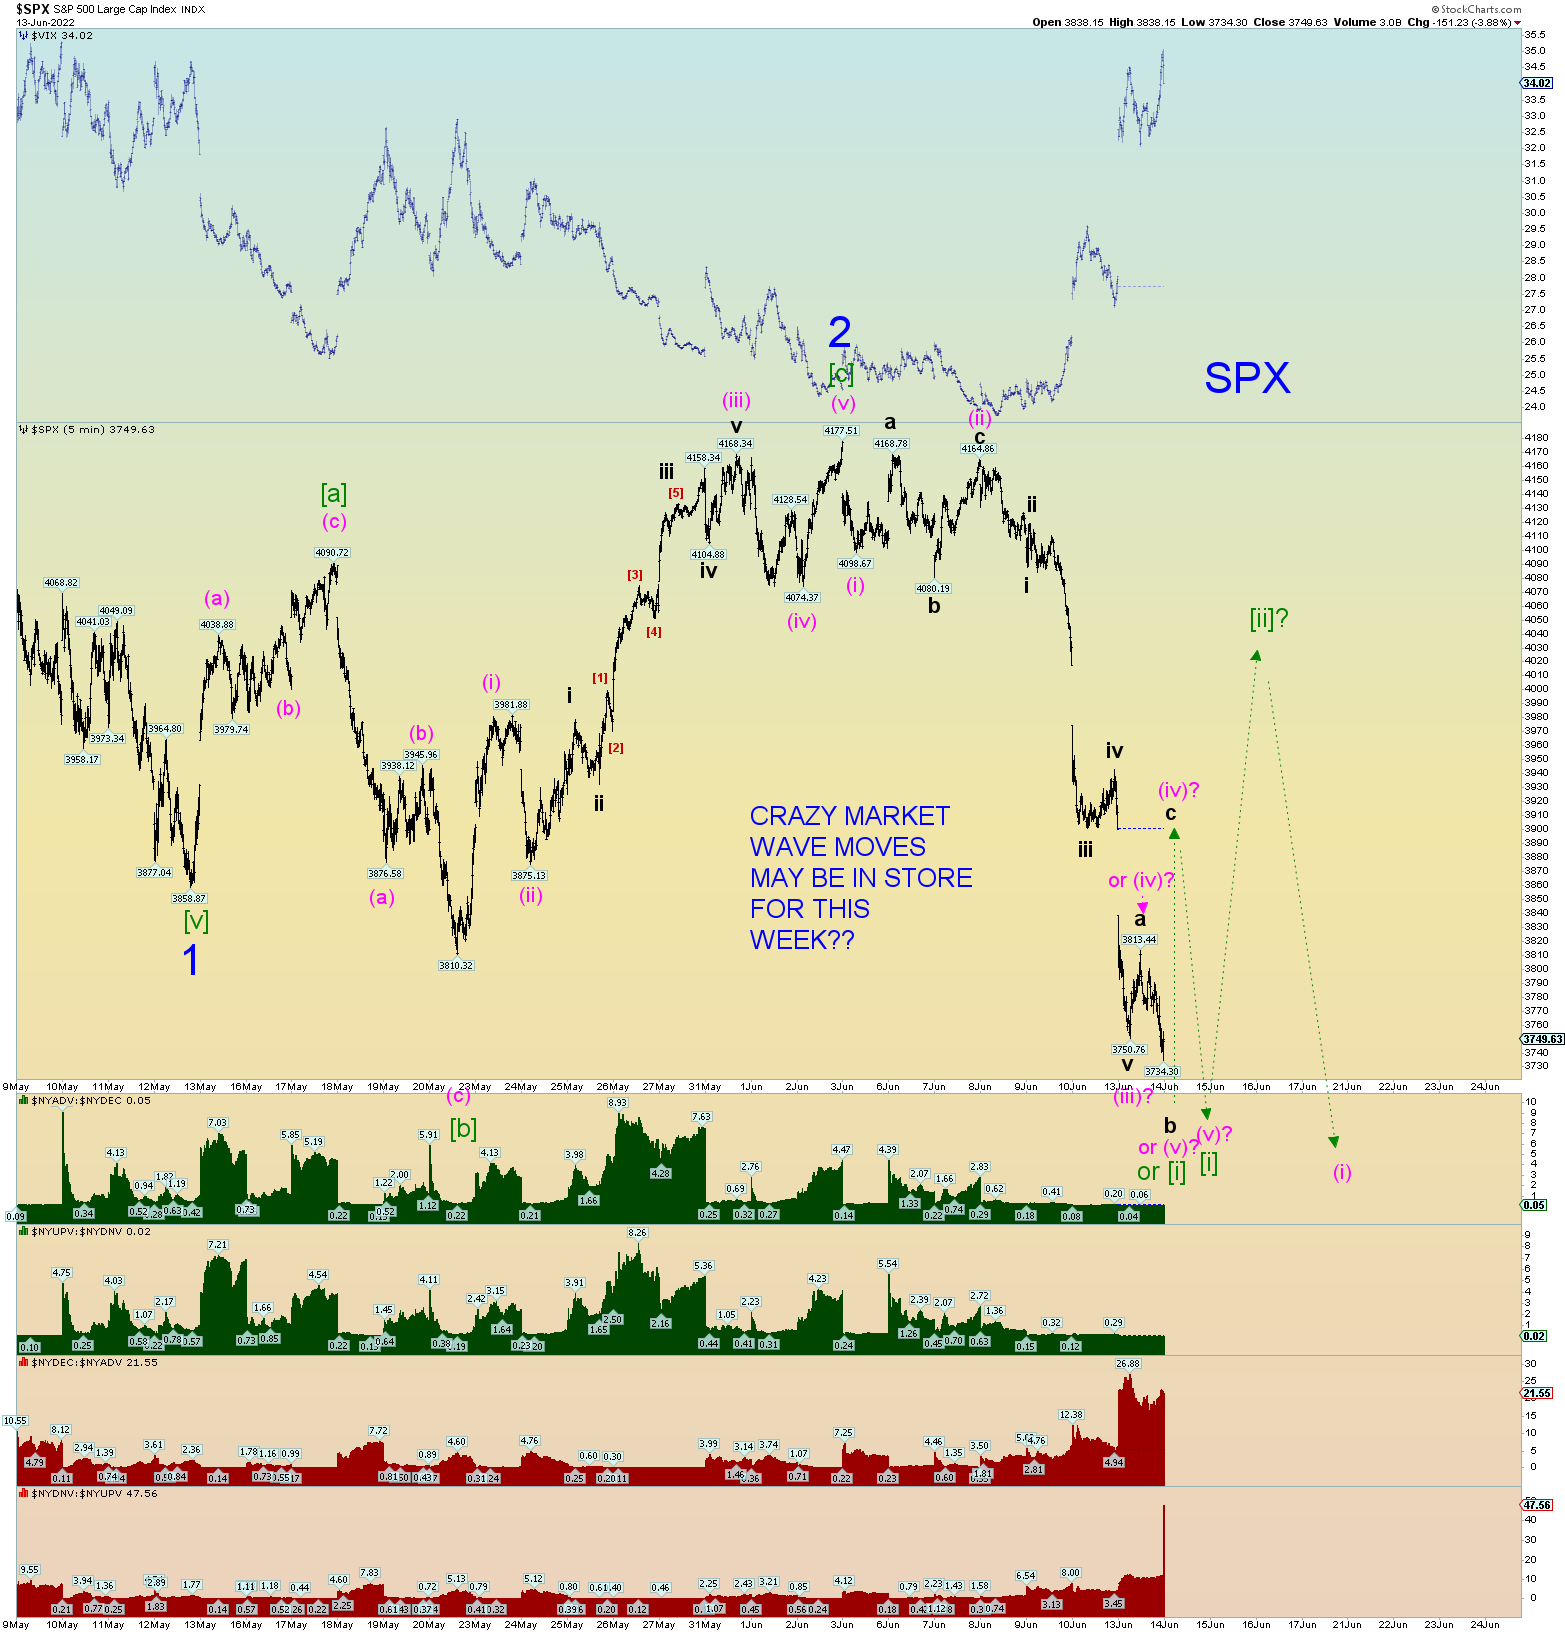
The SPX wave chart below presents a potential extreme volatility view of the waves centered around the Fed meeting this week. I expect very wild swings and the count presented below supports such wild swings.

Today may have been the price low of Minute [i]. Note all the alternate possibilities. How would one trade this mess? LOL.

BEST SQUIGGLE WAVE COUNT INTERPETATION

The best overall count is that the market is looking for Minute [i] price low of Minor 3 of Intermediate (3) down. We can compare this to the 2008 selloff, the Minute [i] low coincides with a downtrend line. A very sharp bear covering rally ensued resulting in a short-lived Minute [ii]. Recall though, this was when the banks were forbid to be “shorted”. This situation doesn’t exist today yet any “news” could spark a violent final rally if the 2008 model is to be followed in form.

The “breaking” of this downtrend line was the heart of the panic selloff and was the steep “acceleration” downward of the overall wave structure. Look for something similar in 2022 to occur. Minute [iii] of 3 of (3) down. The market is in a very similar setup except the times are shortened and the down sloping trendline is much steeper. (See first chart of this post)

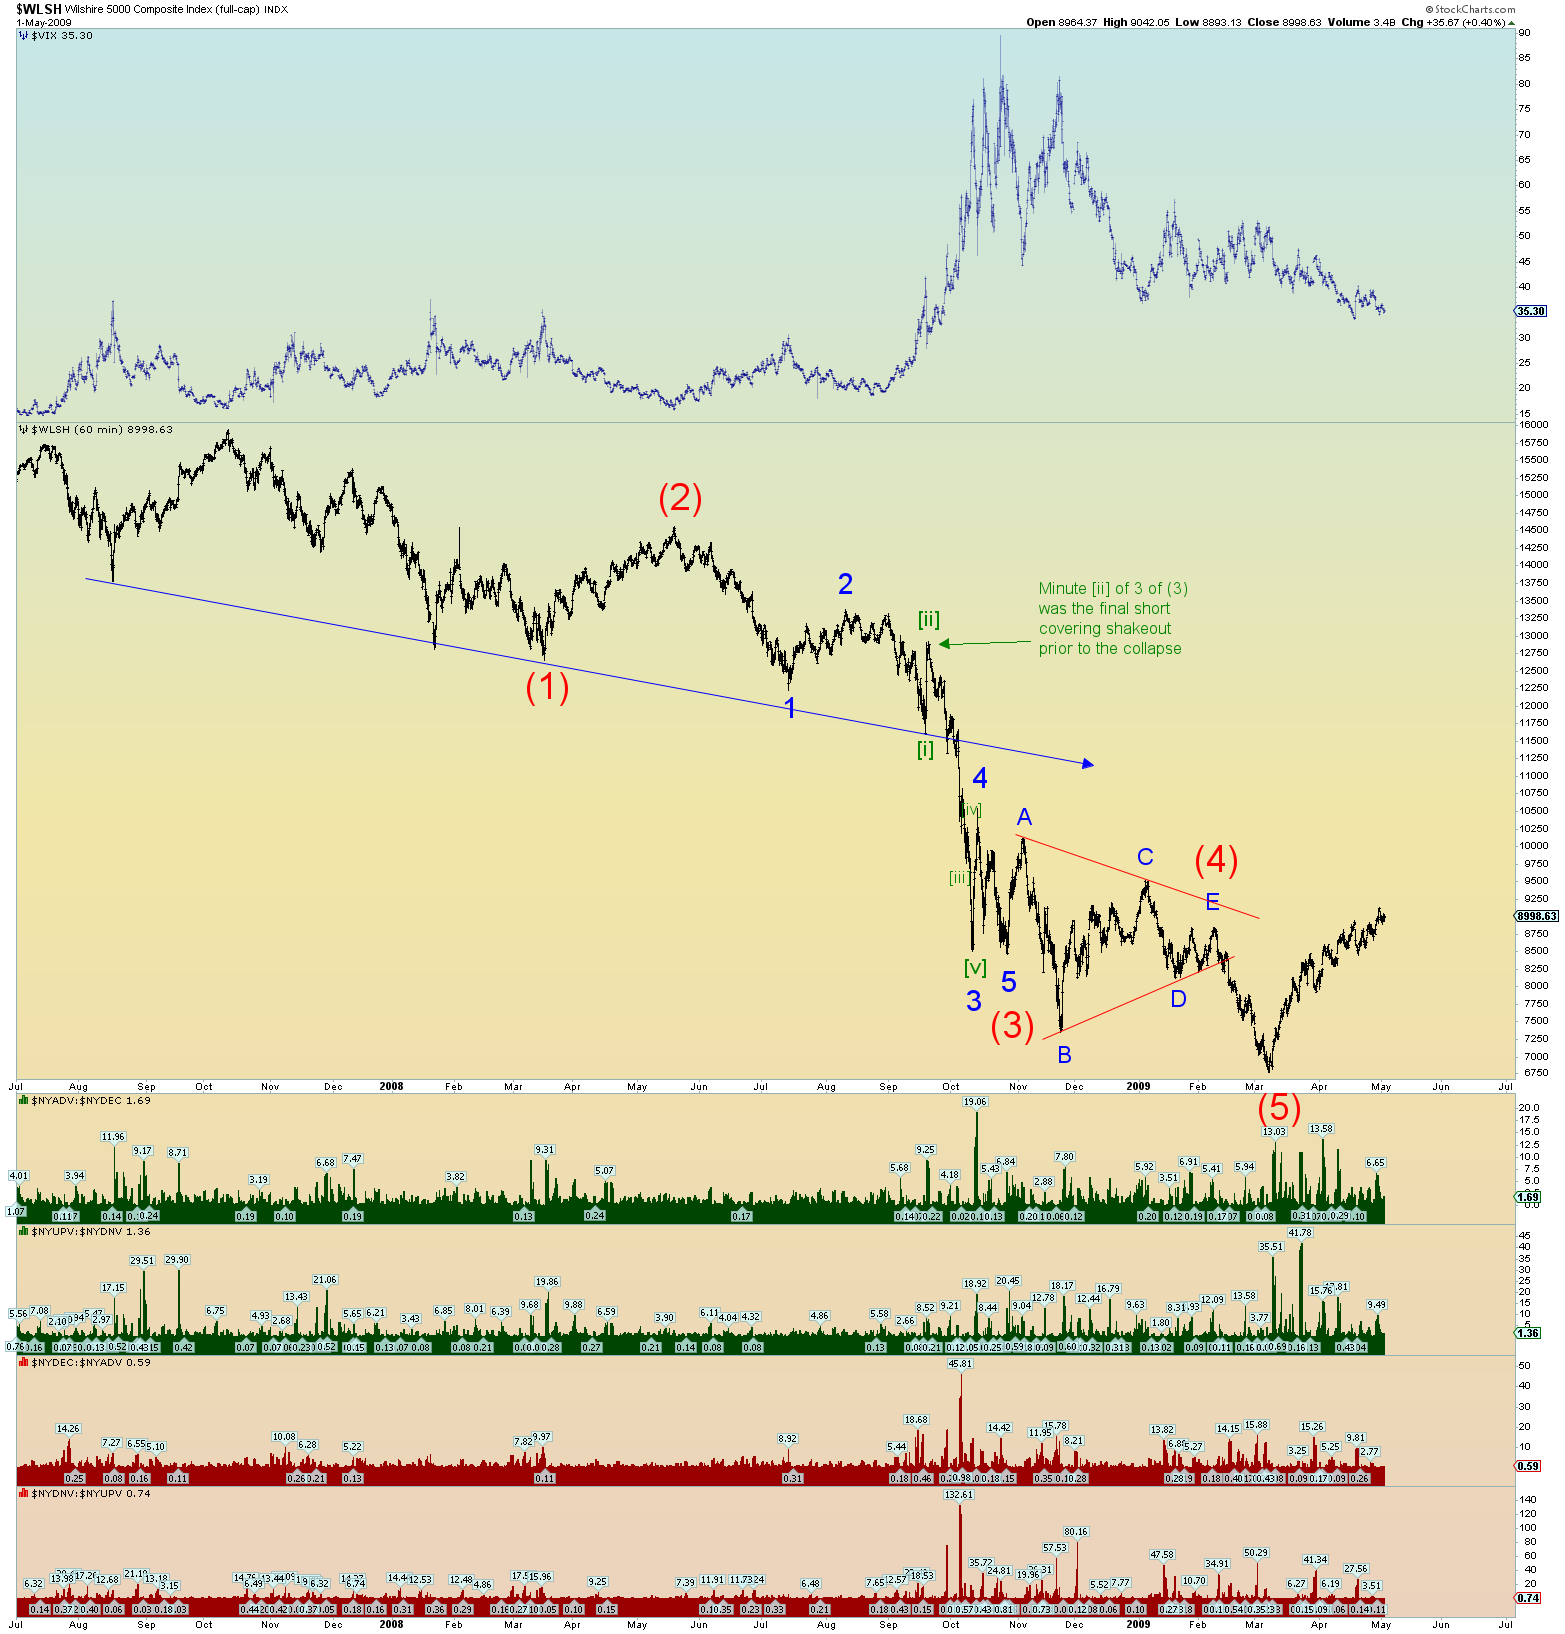
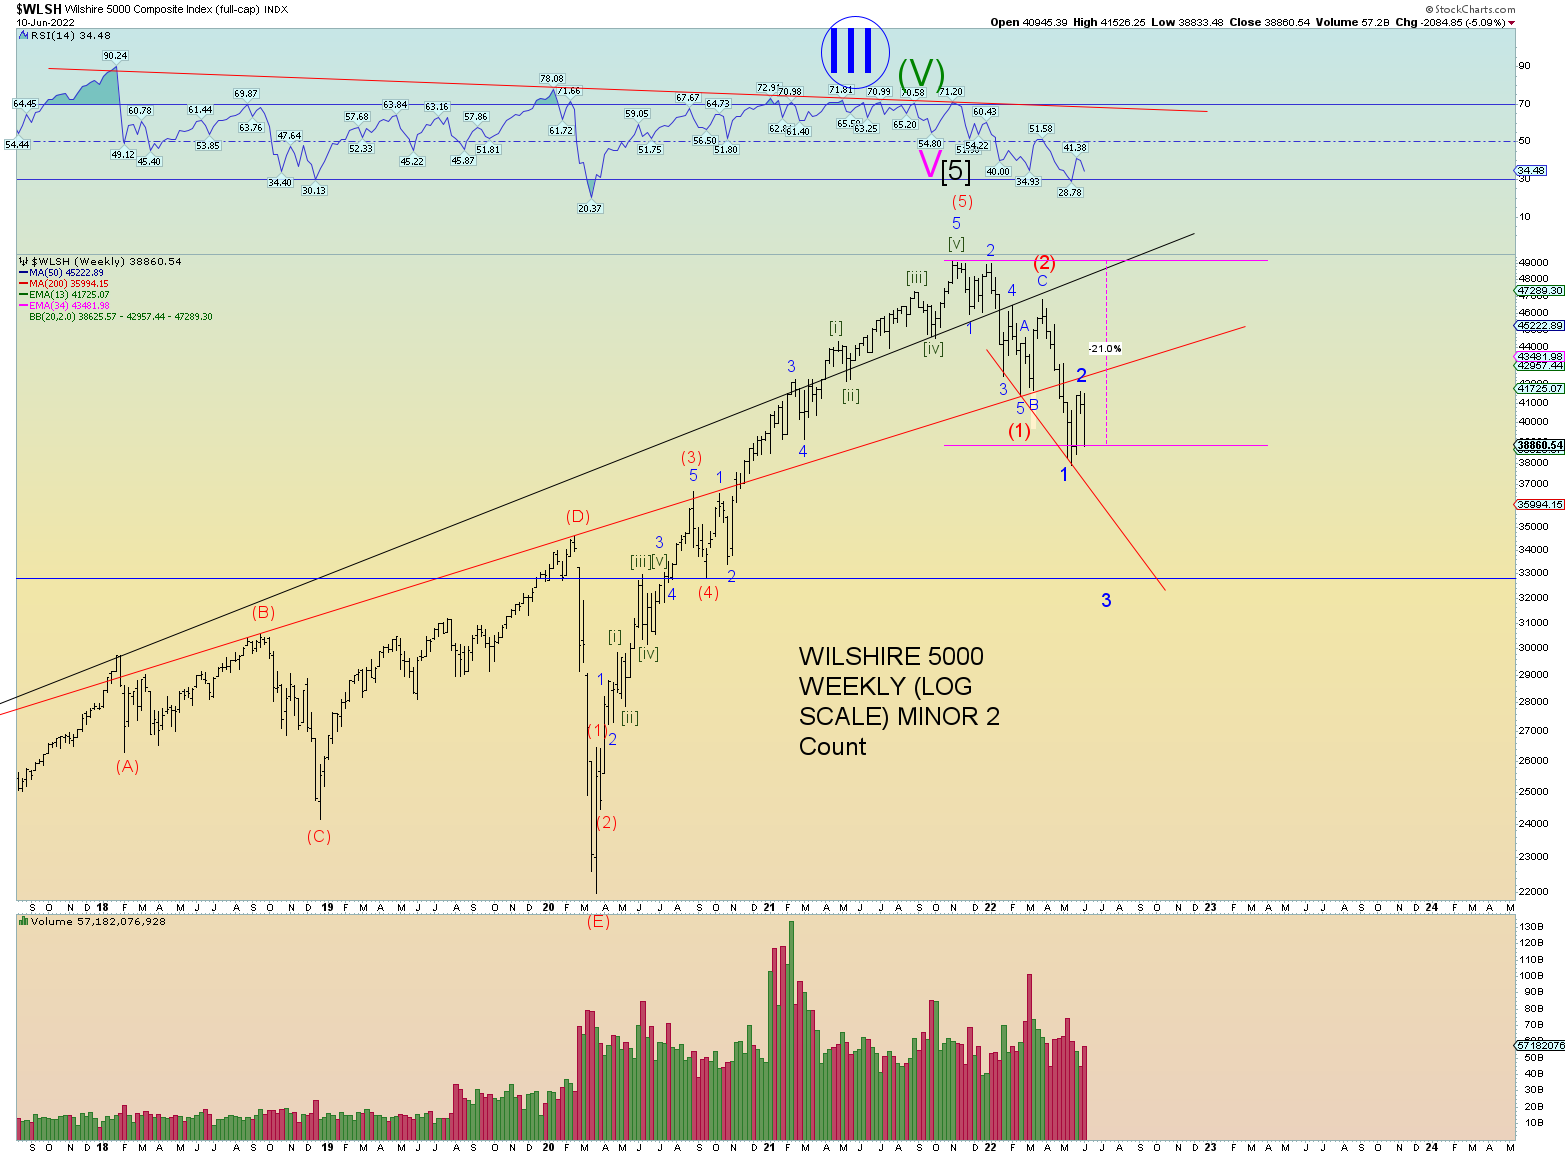
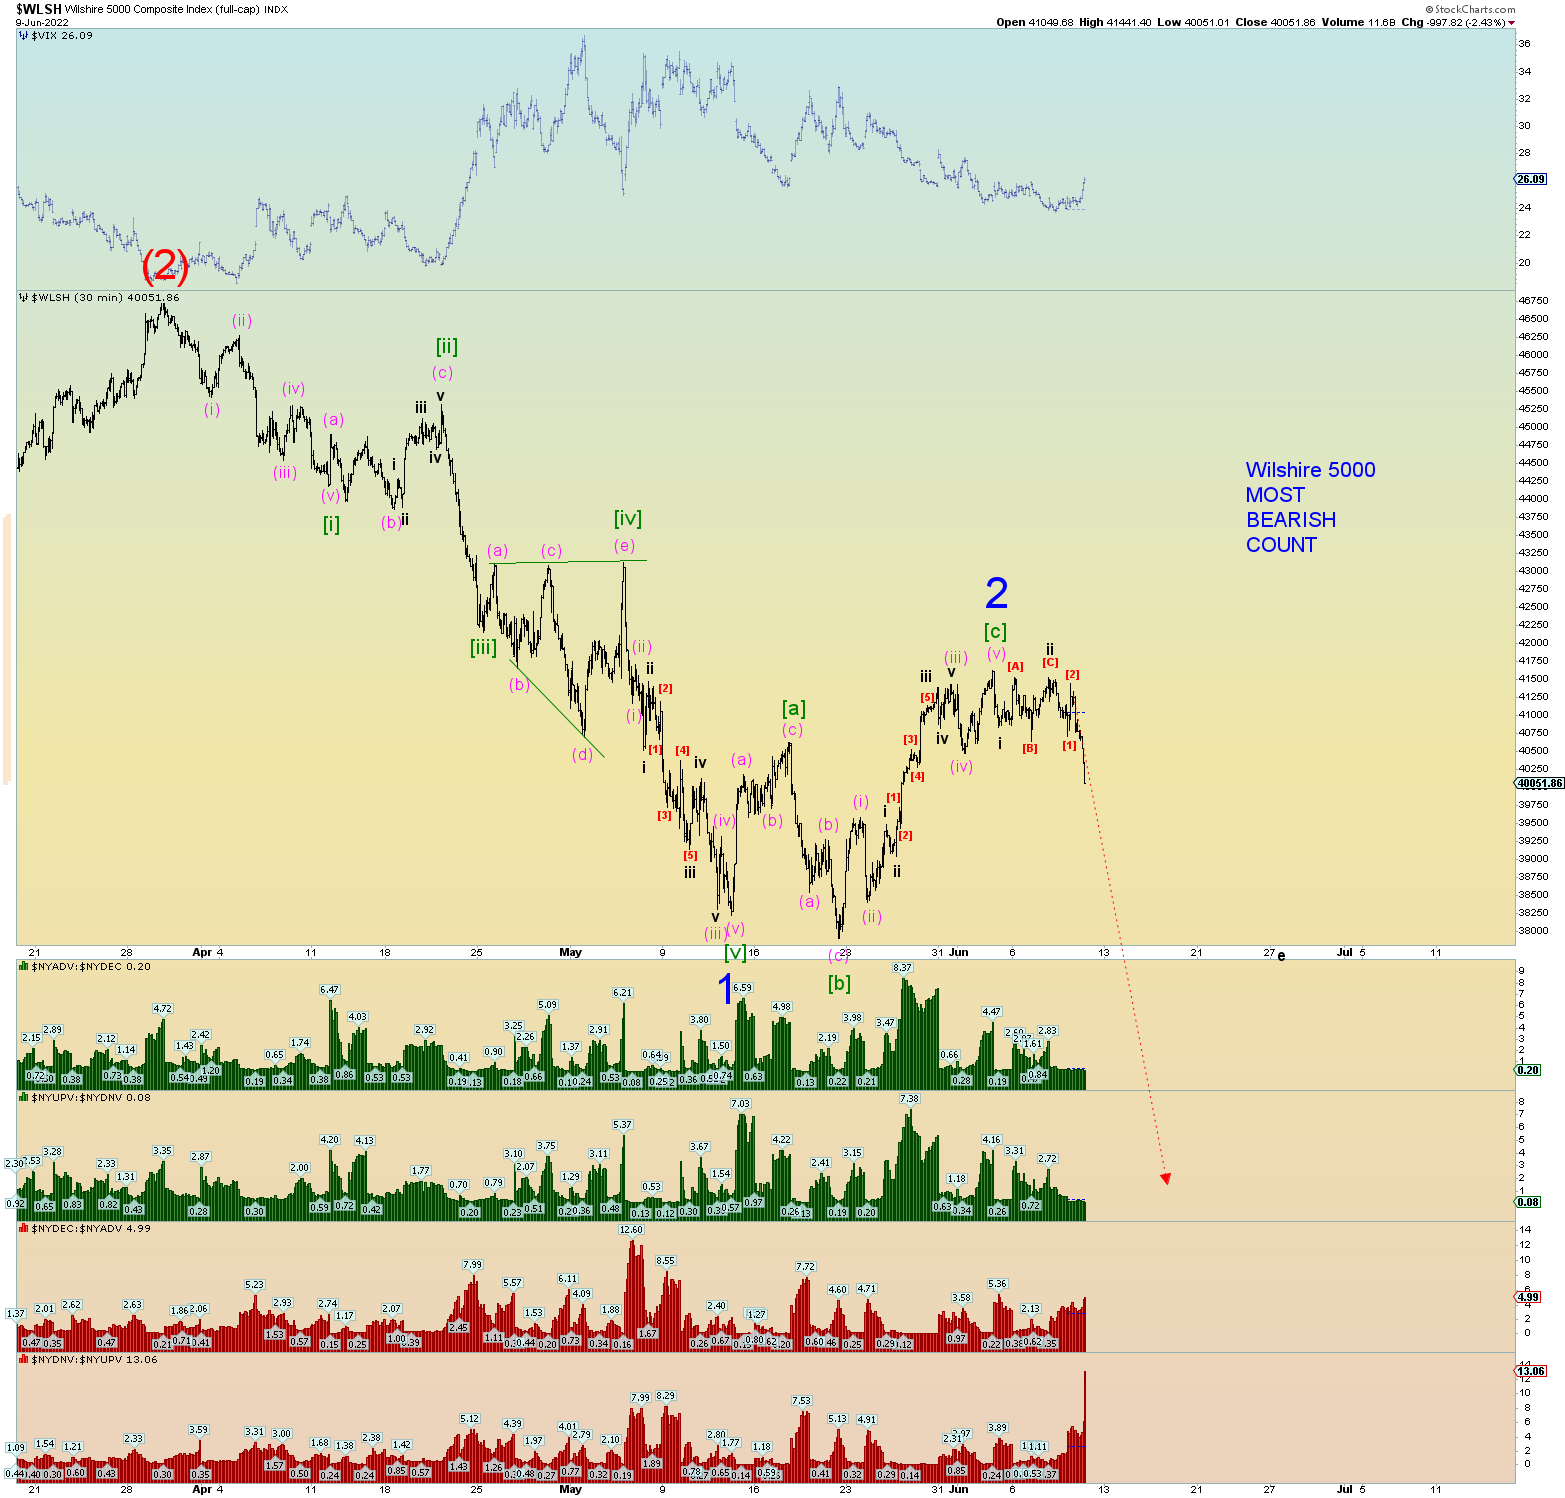
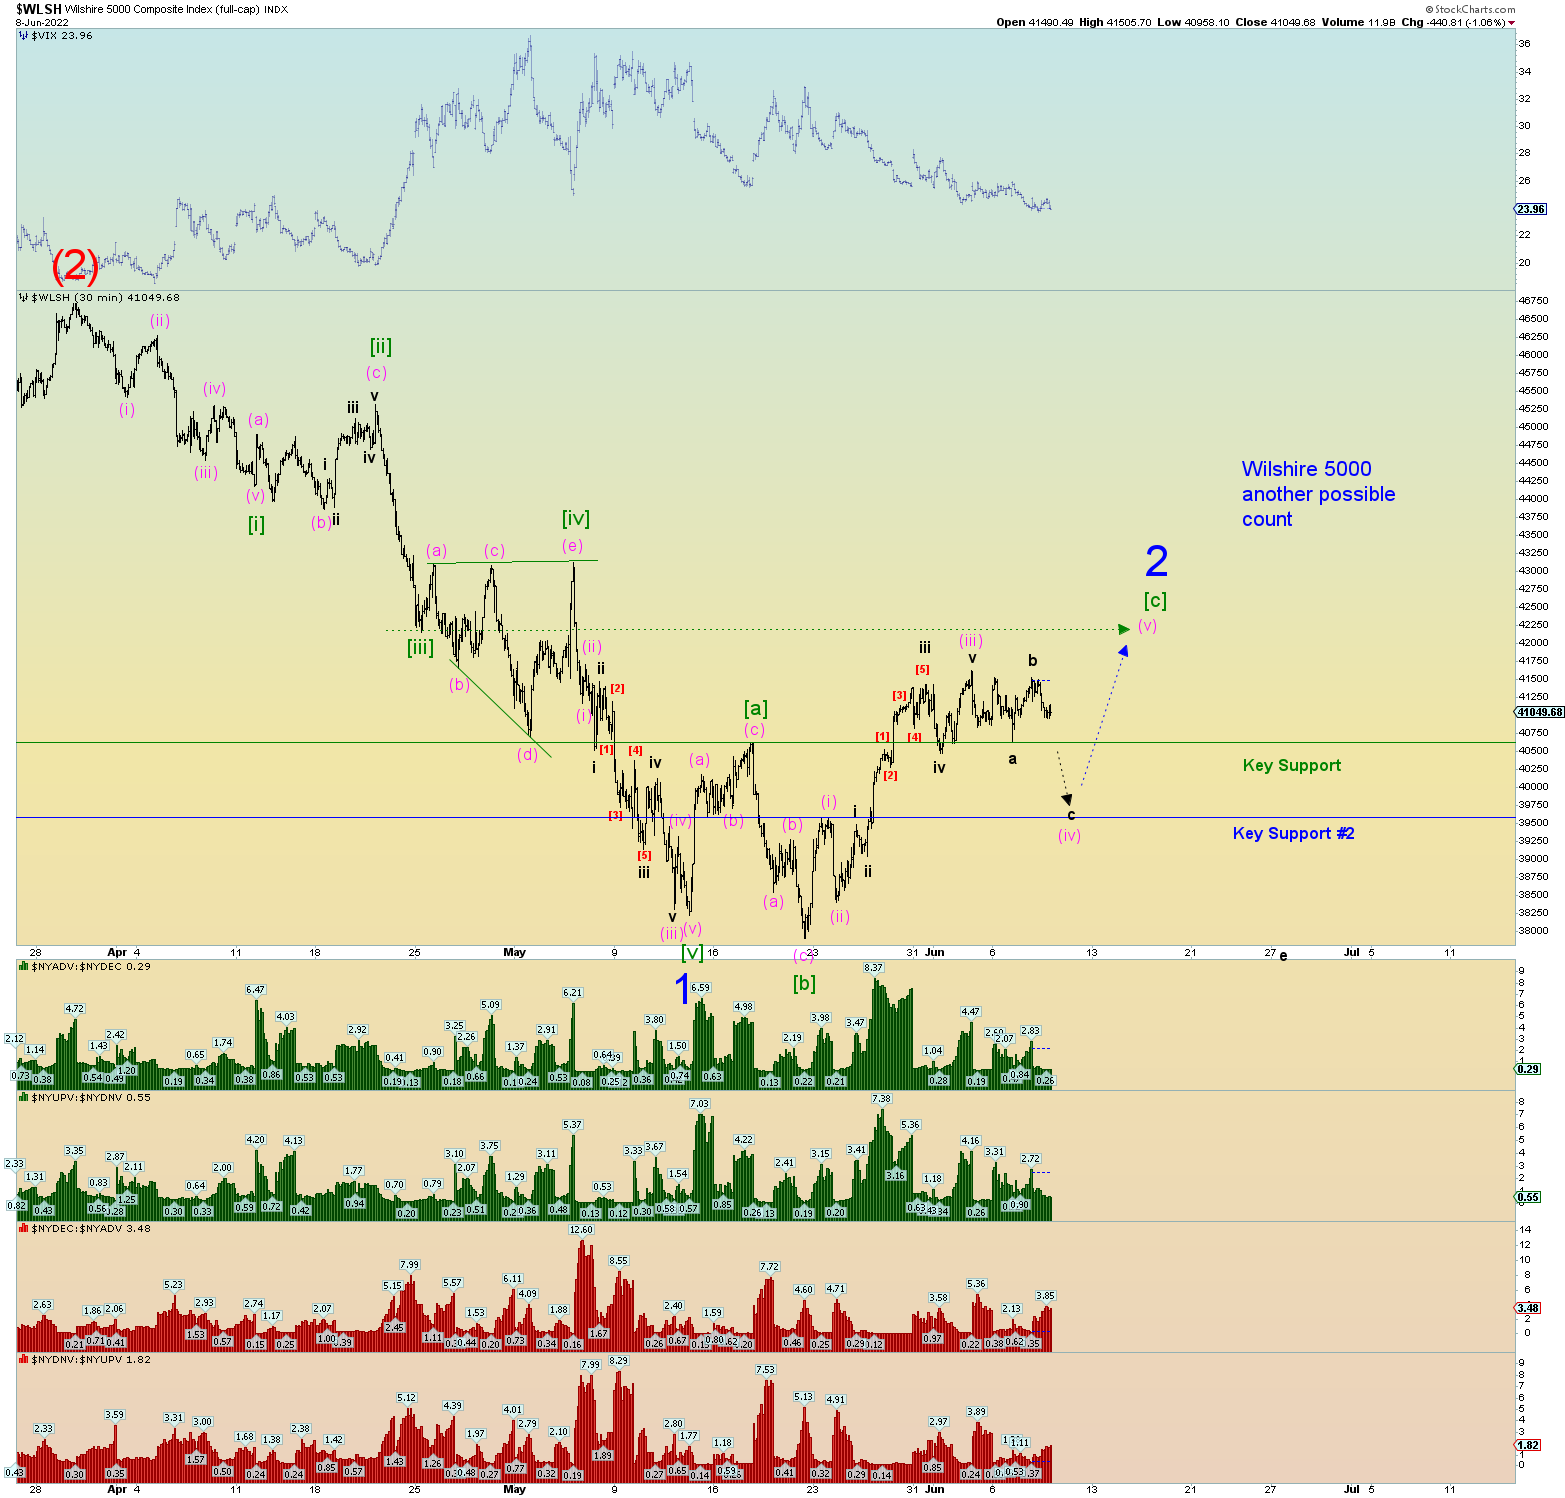
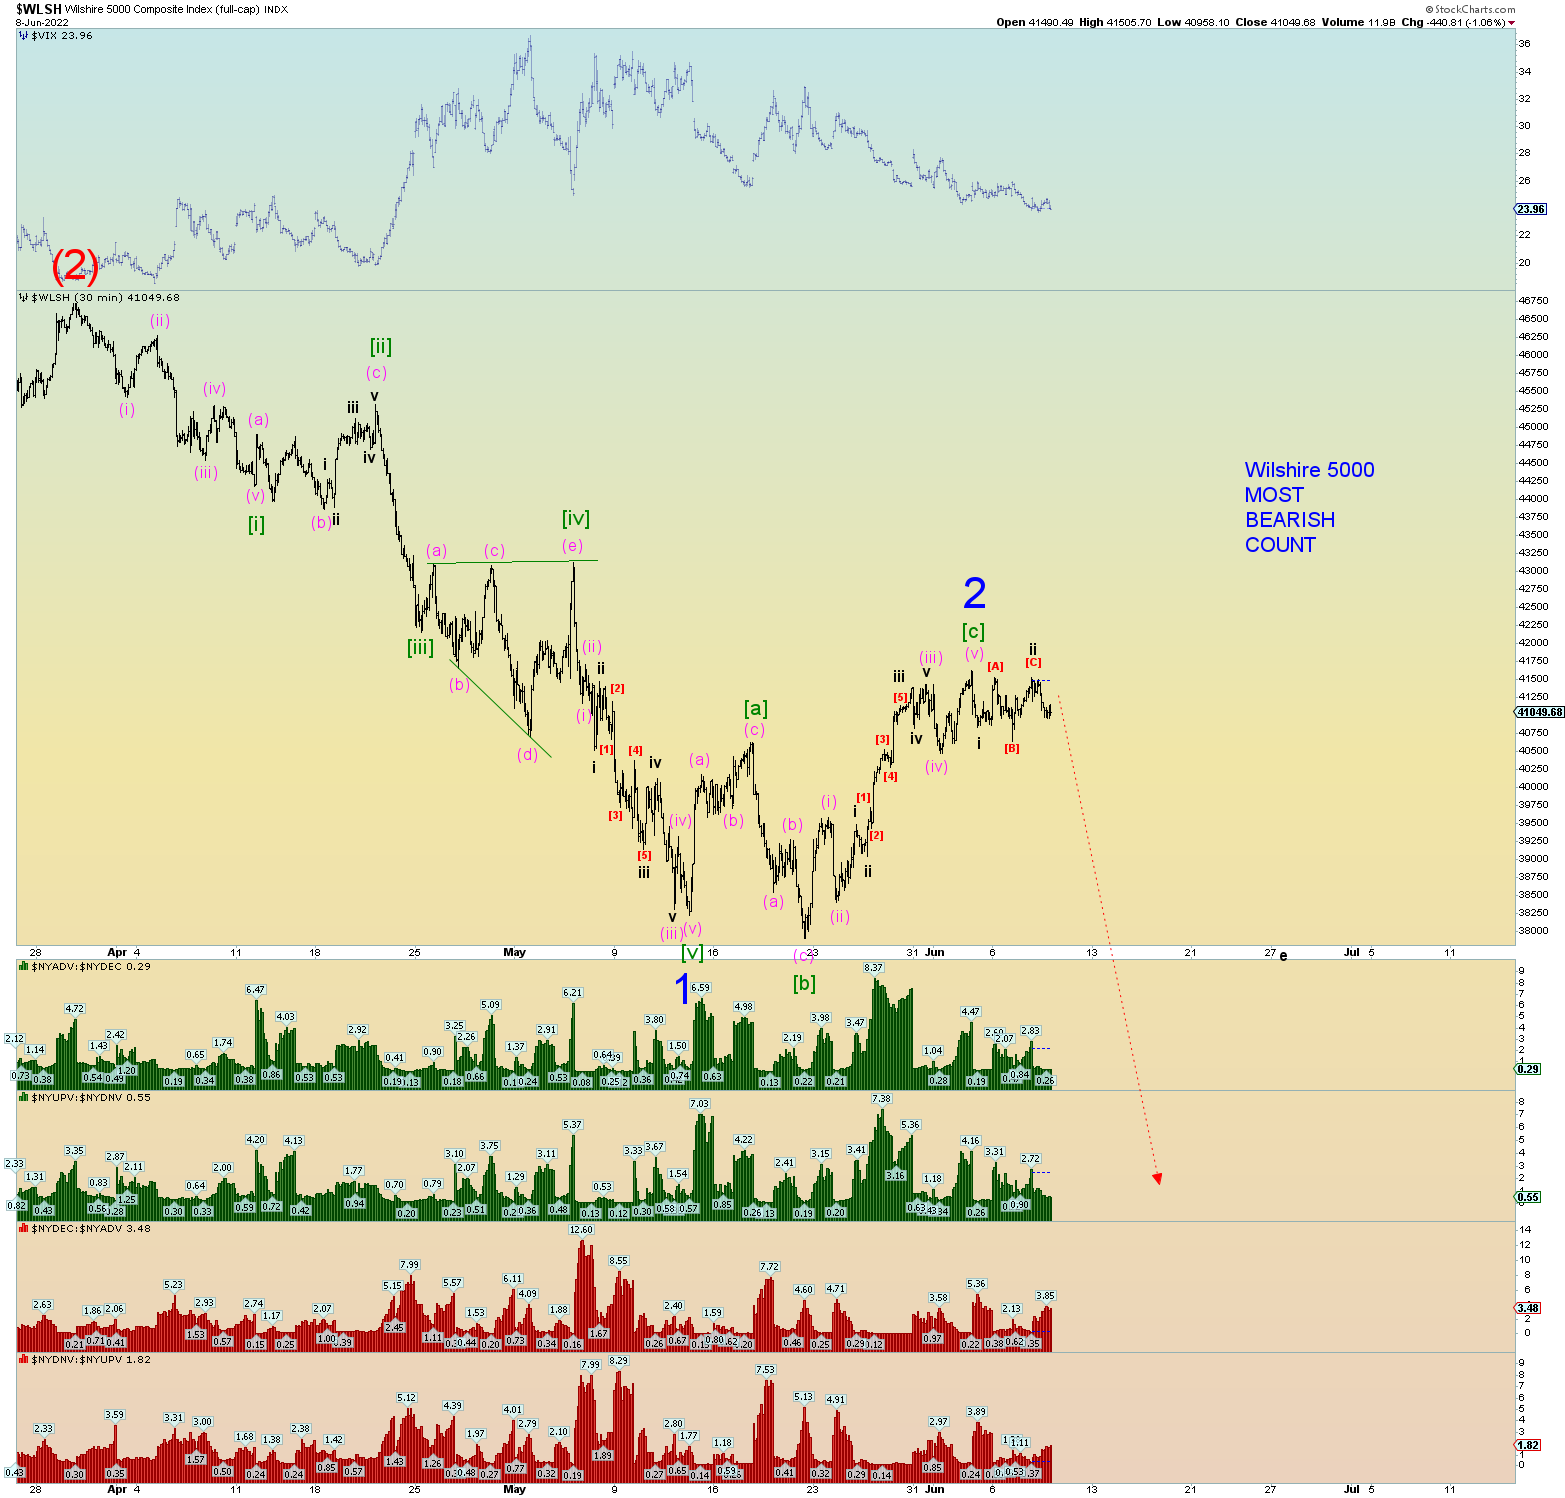
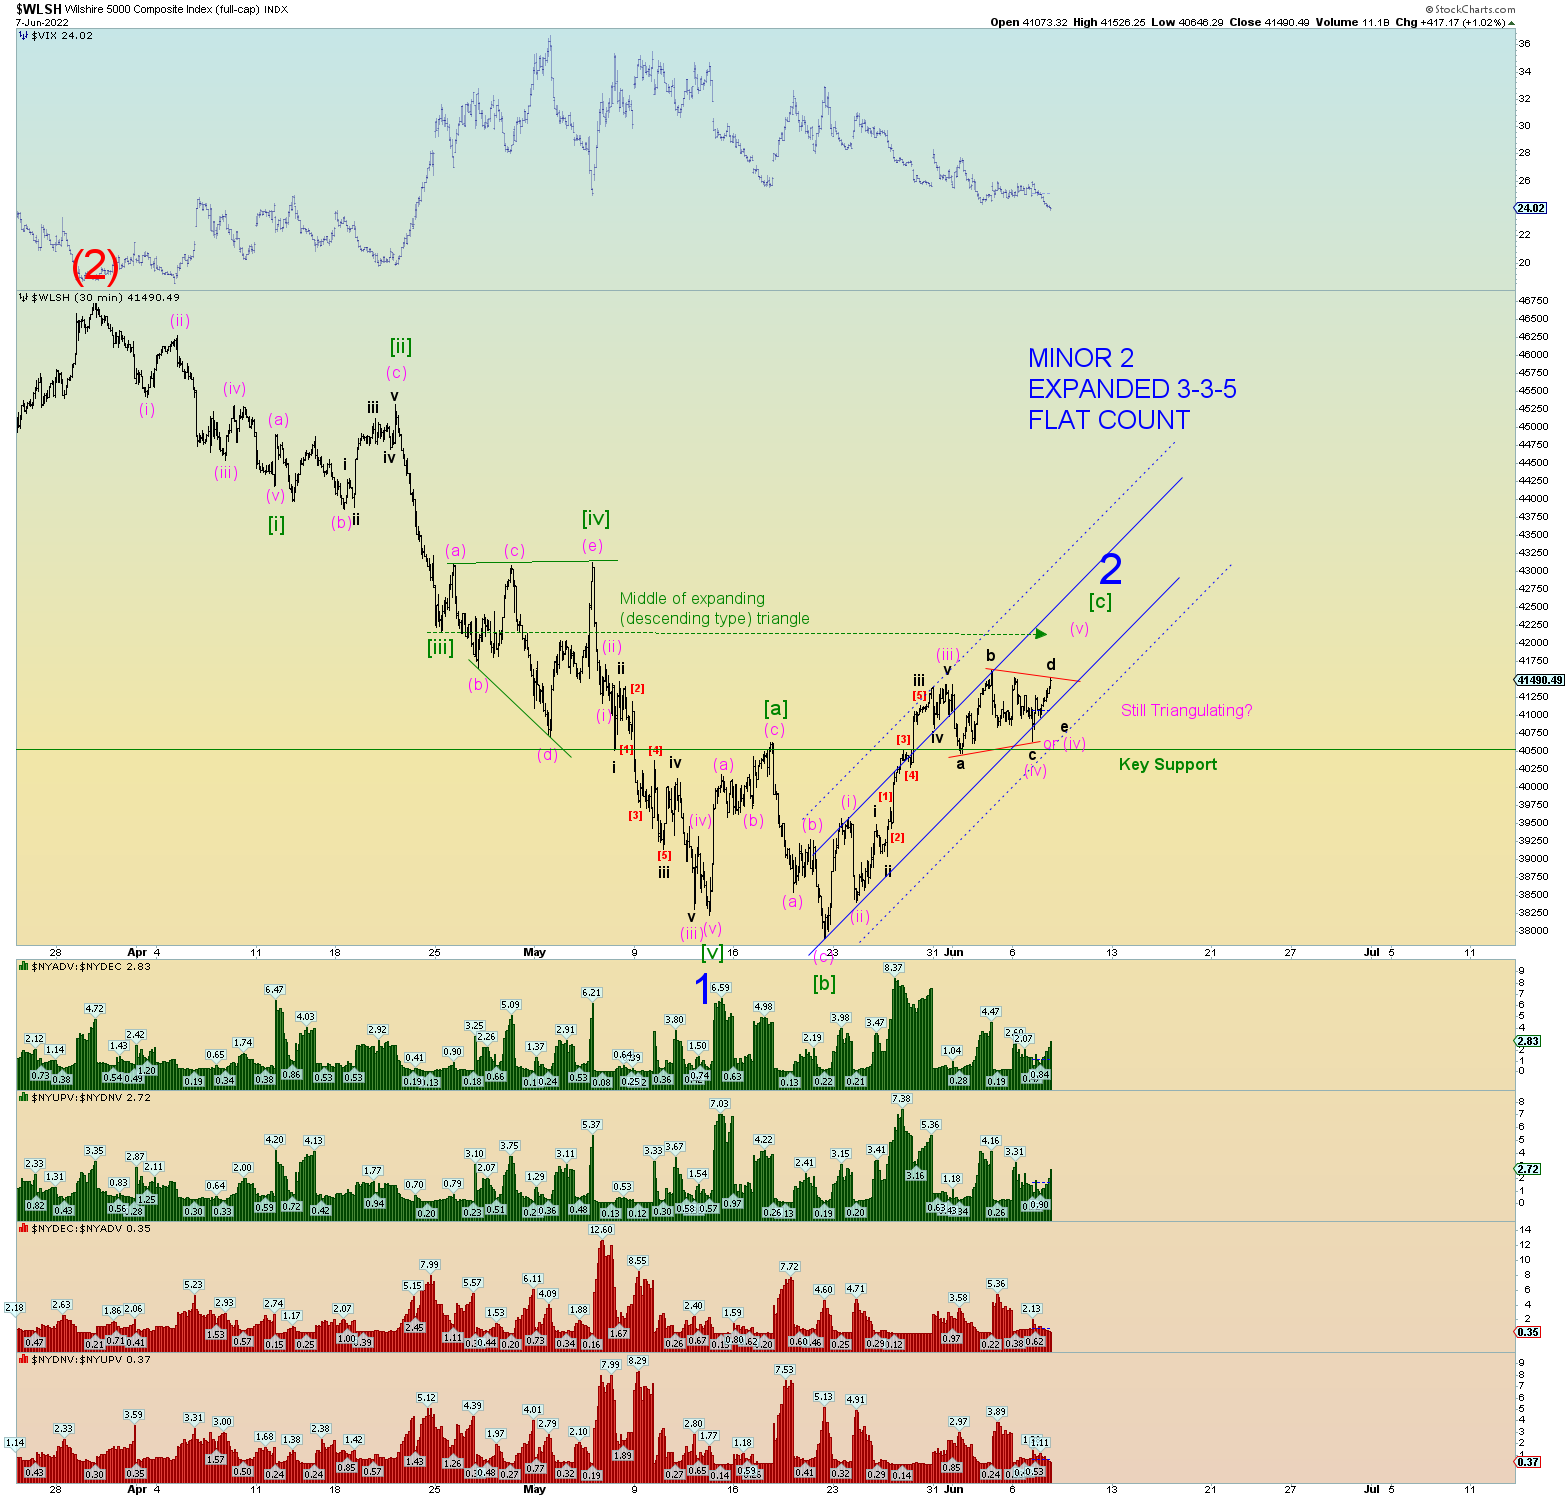
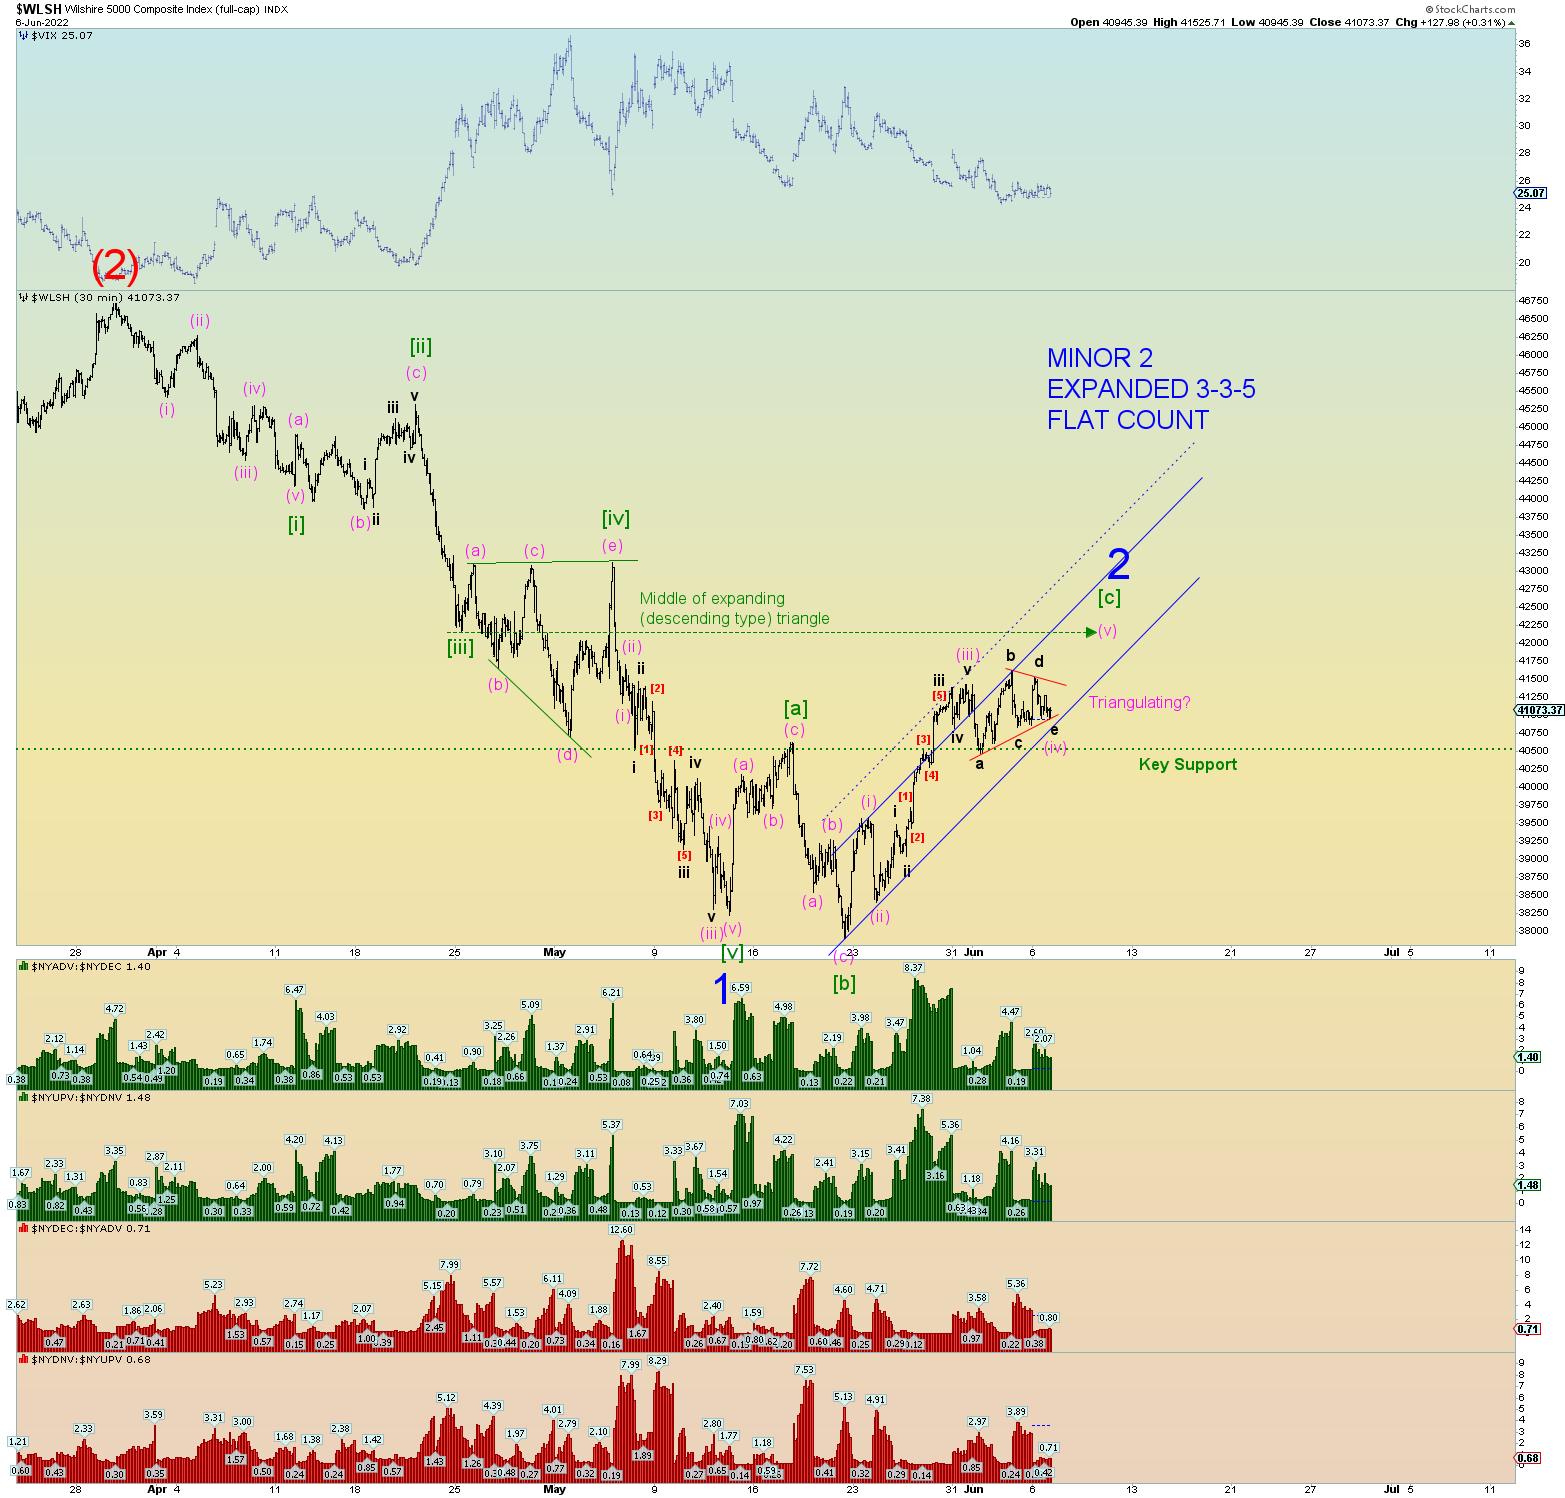
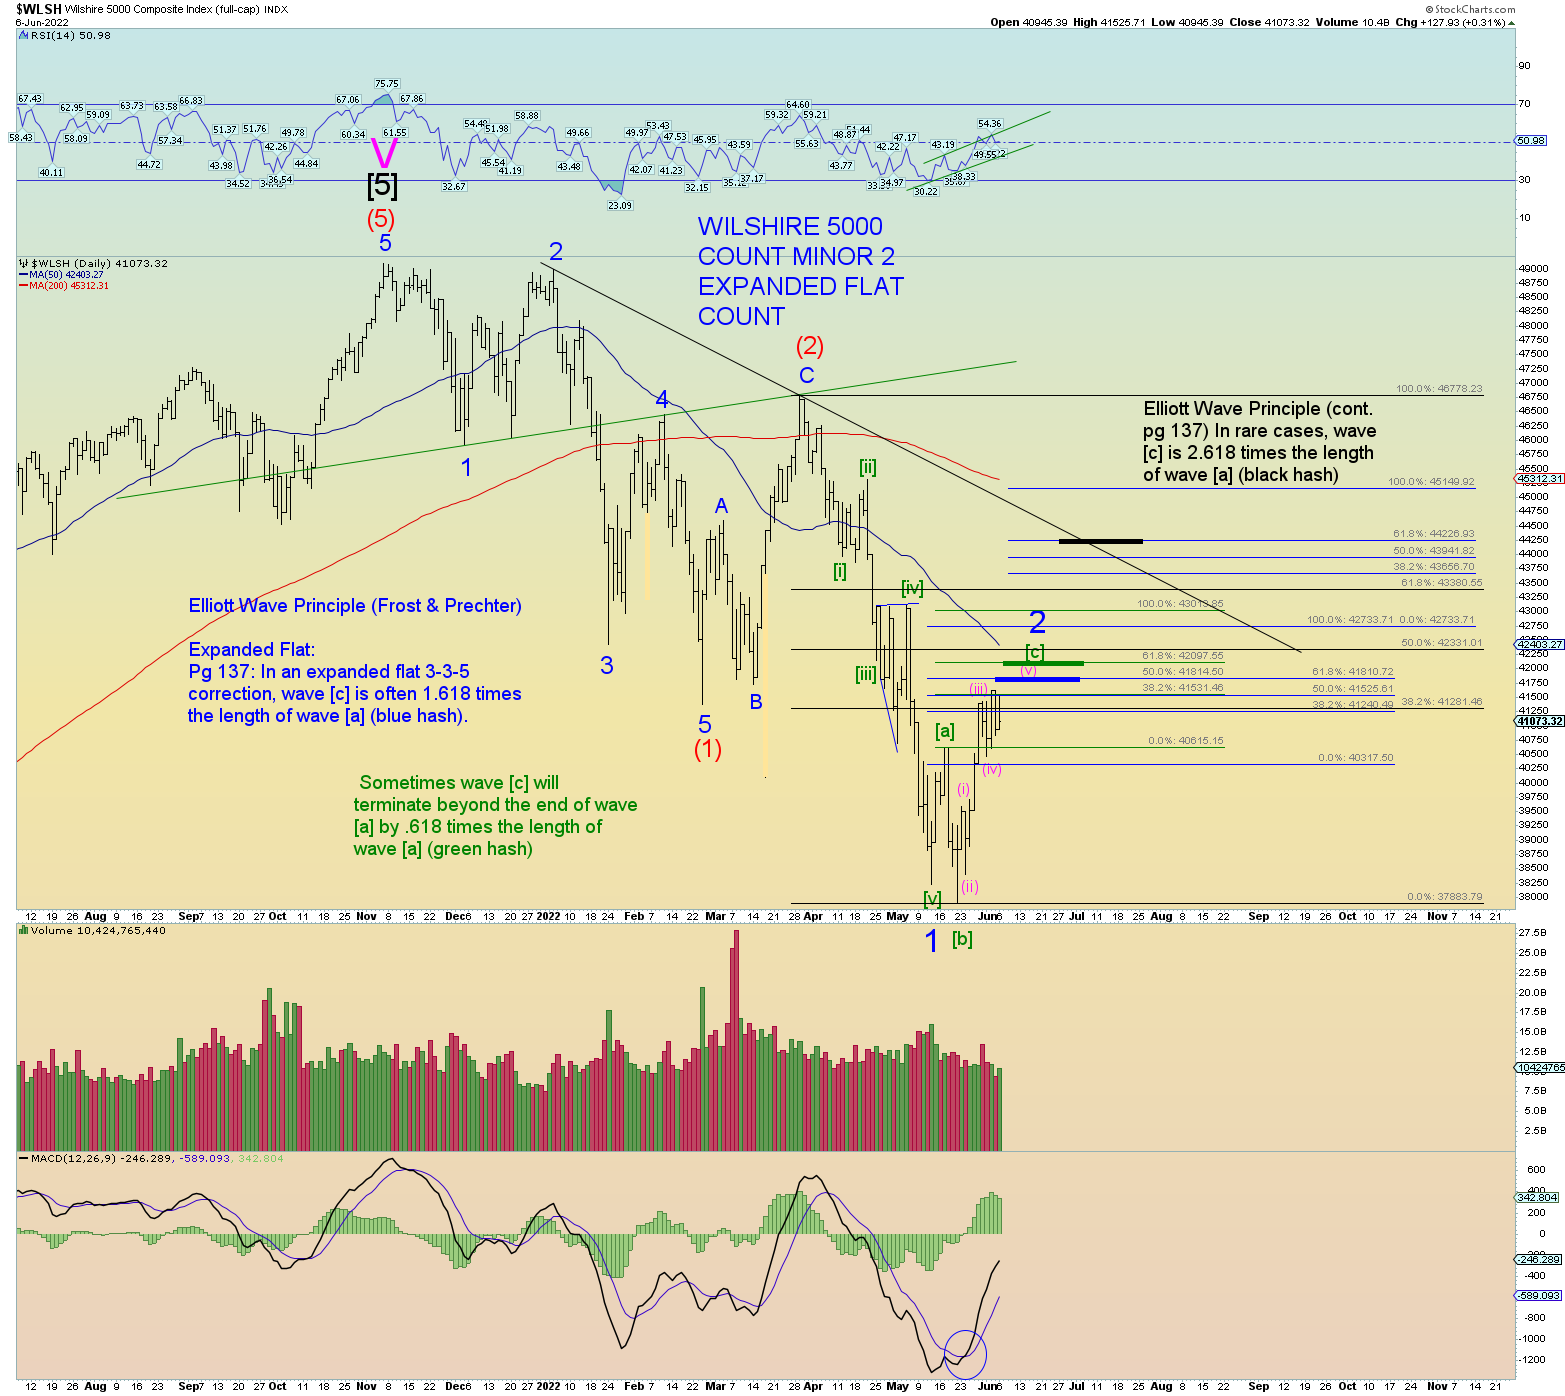
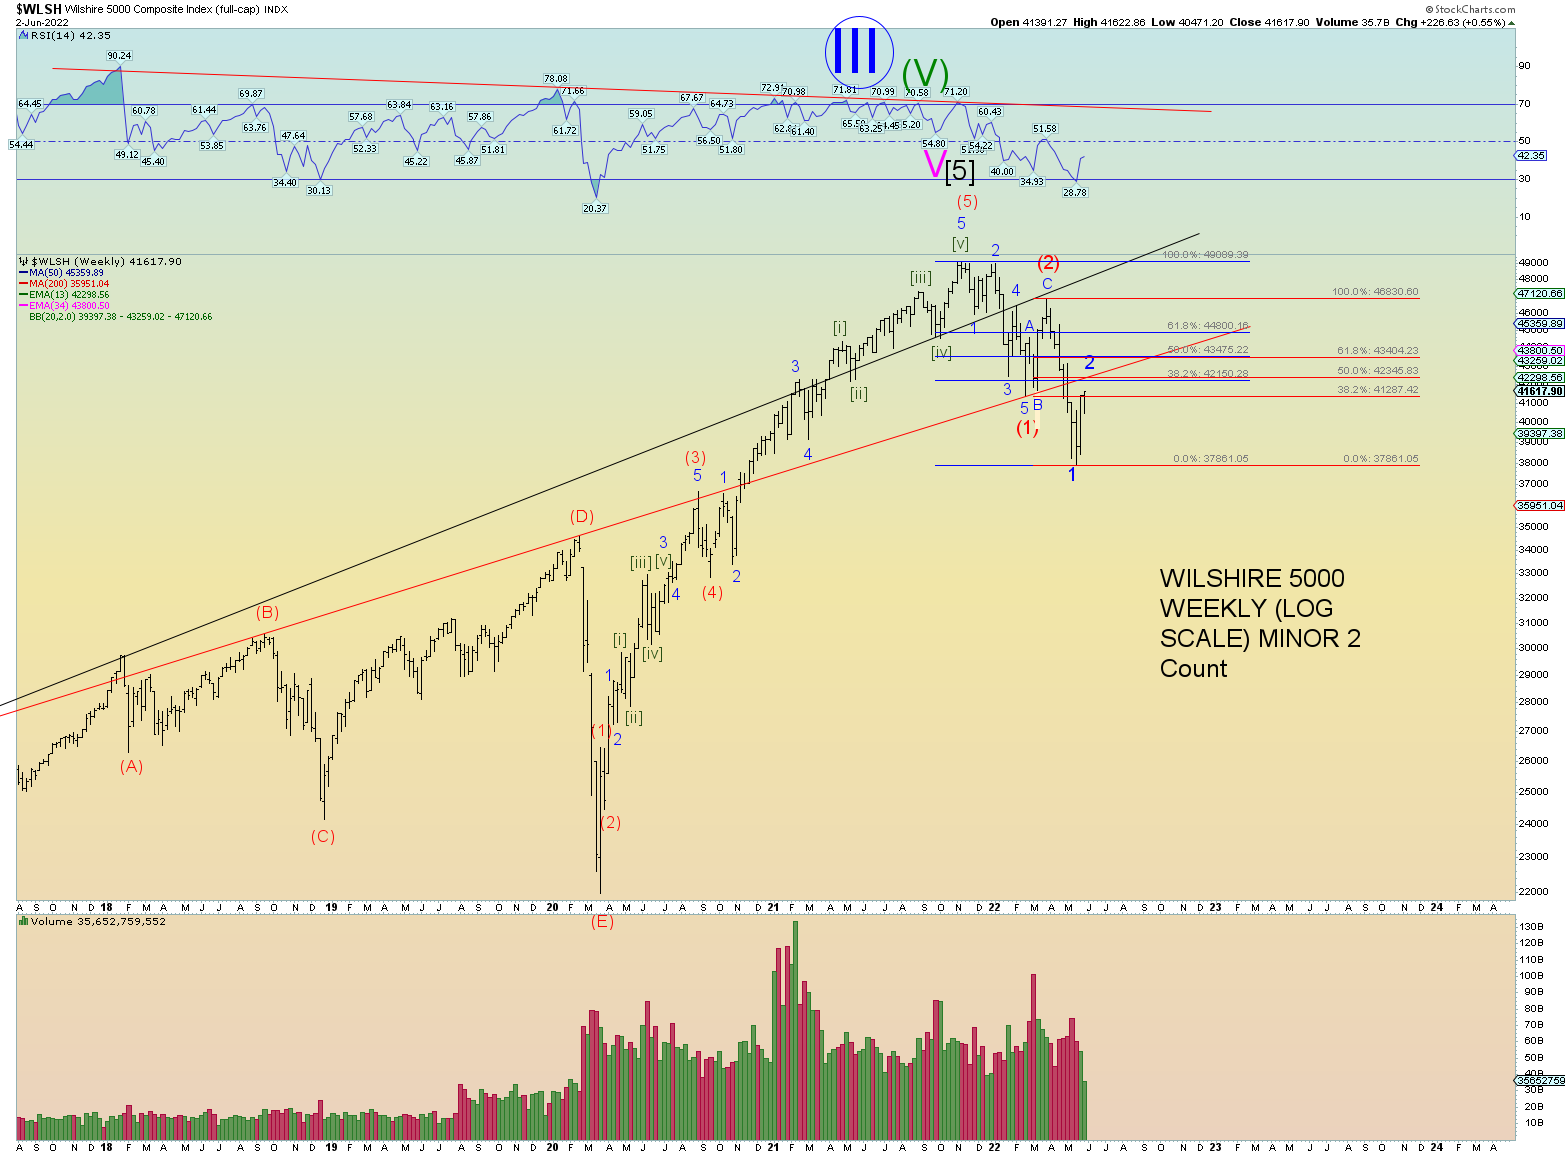
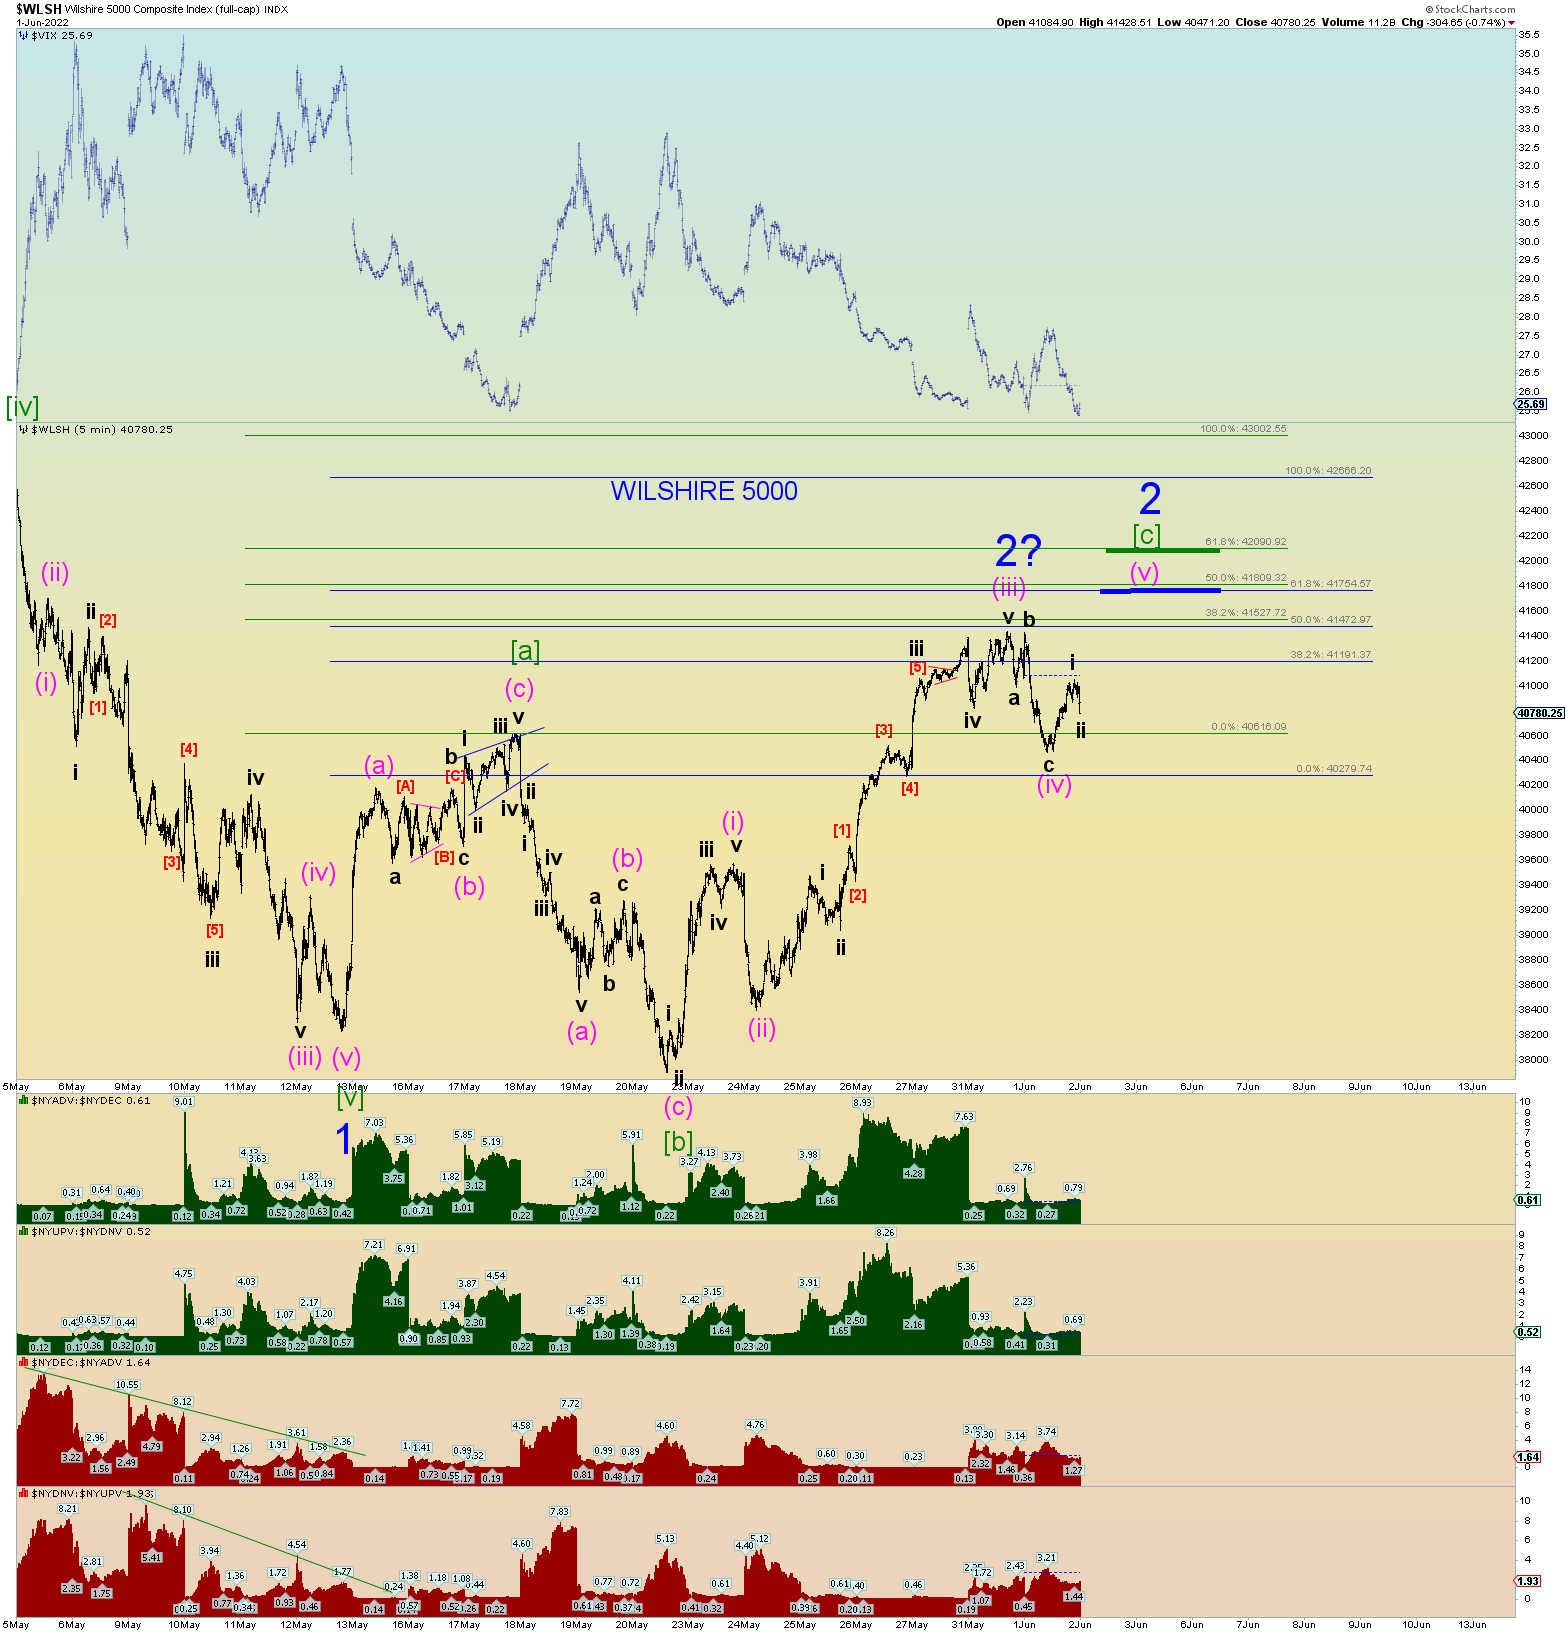
The Wilshire potential count. Perhaps Minute [i] low is in.

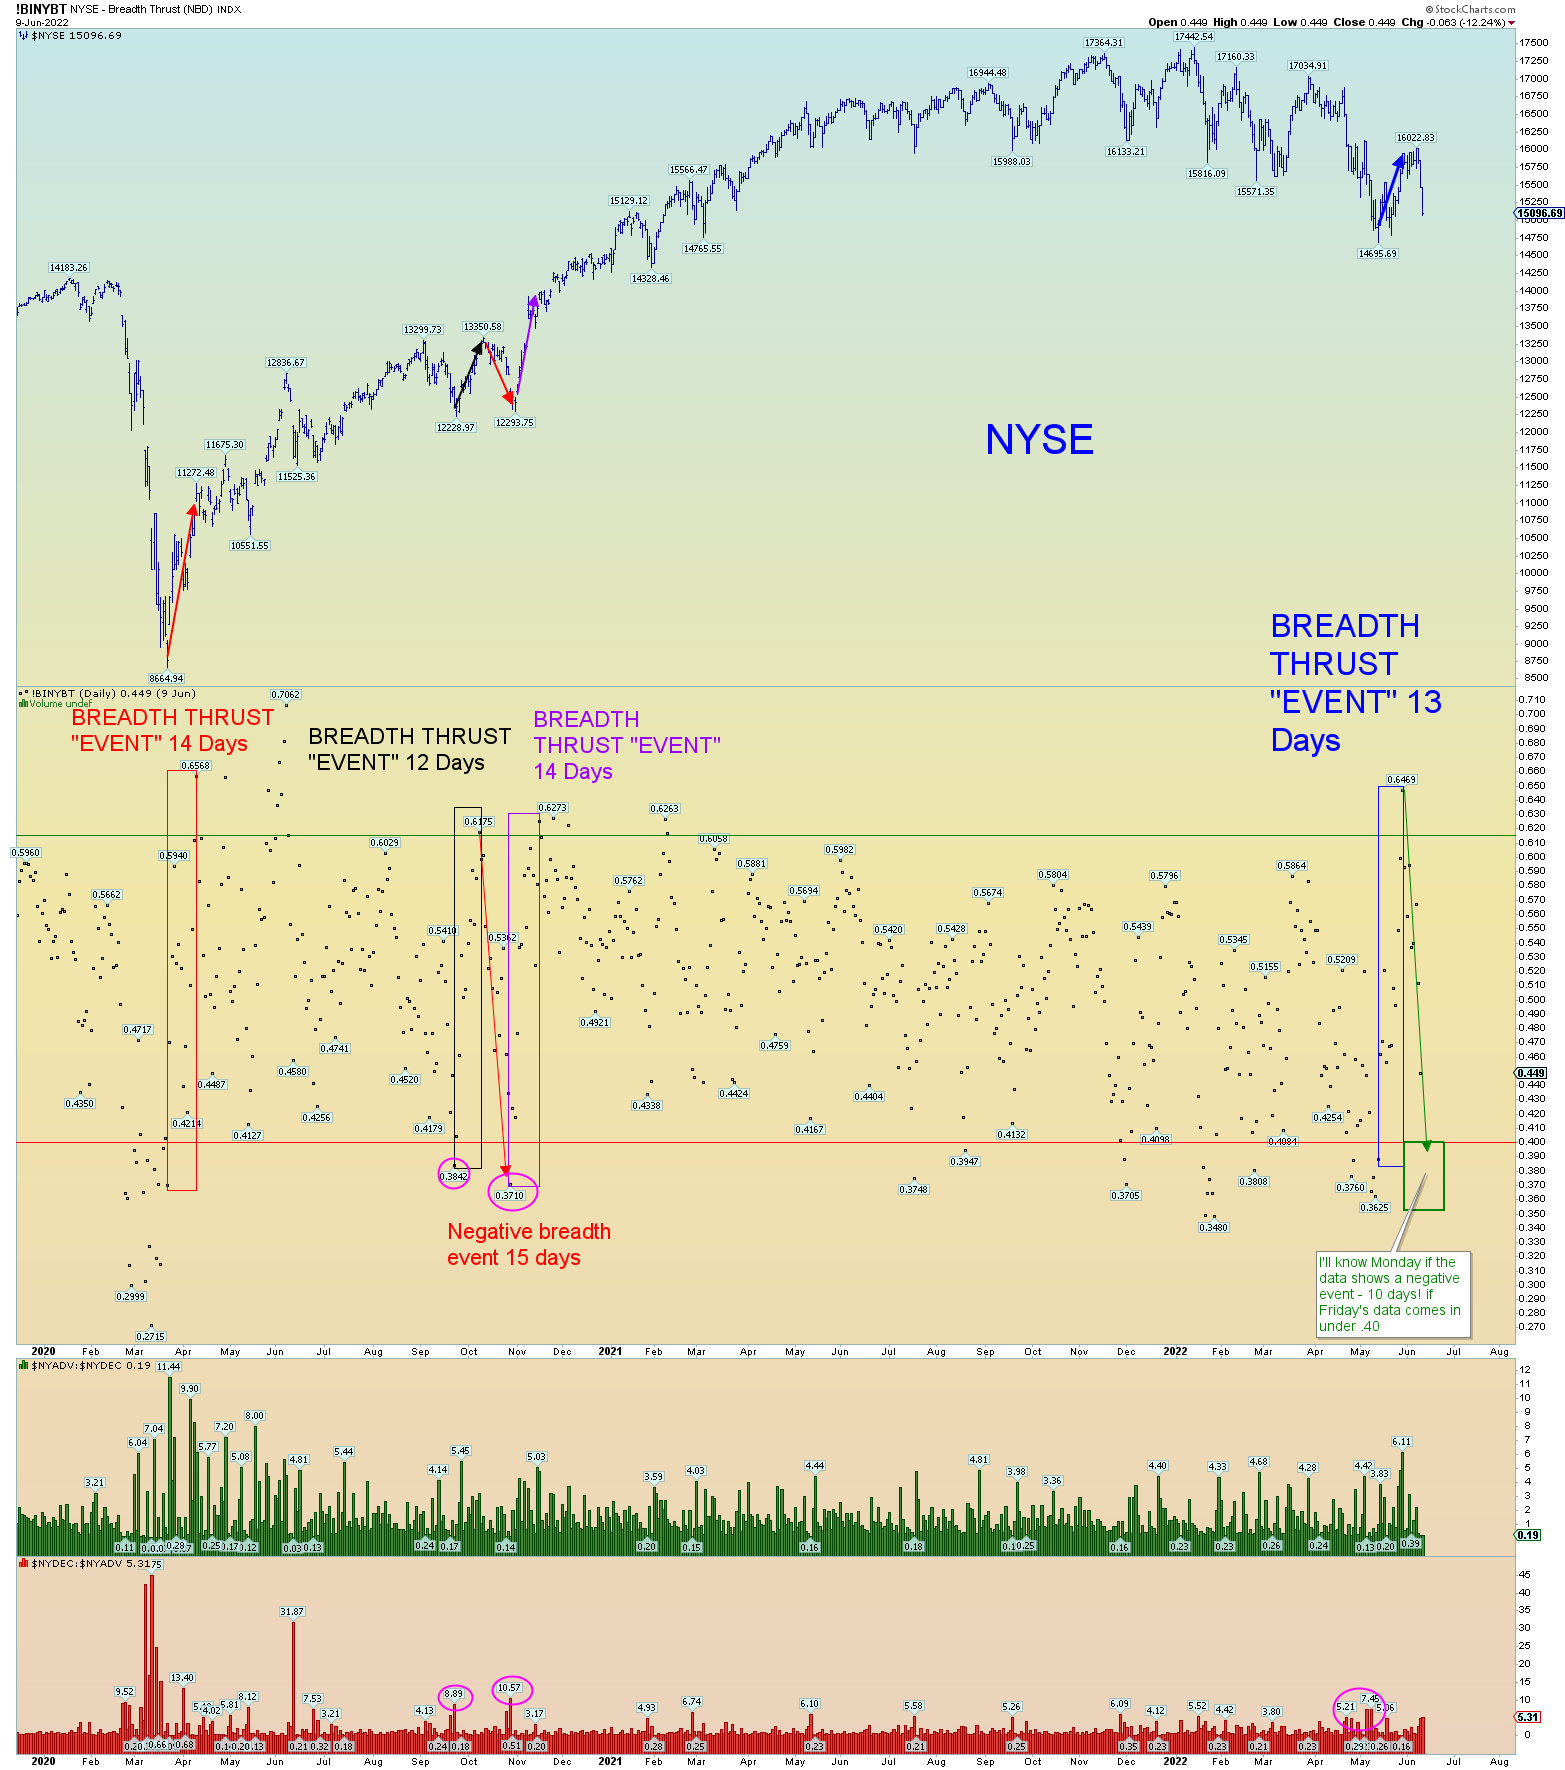
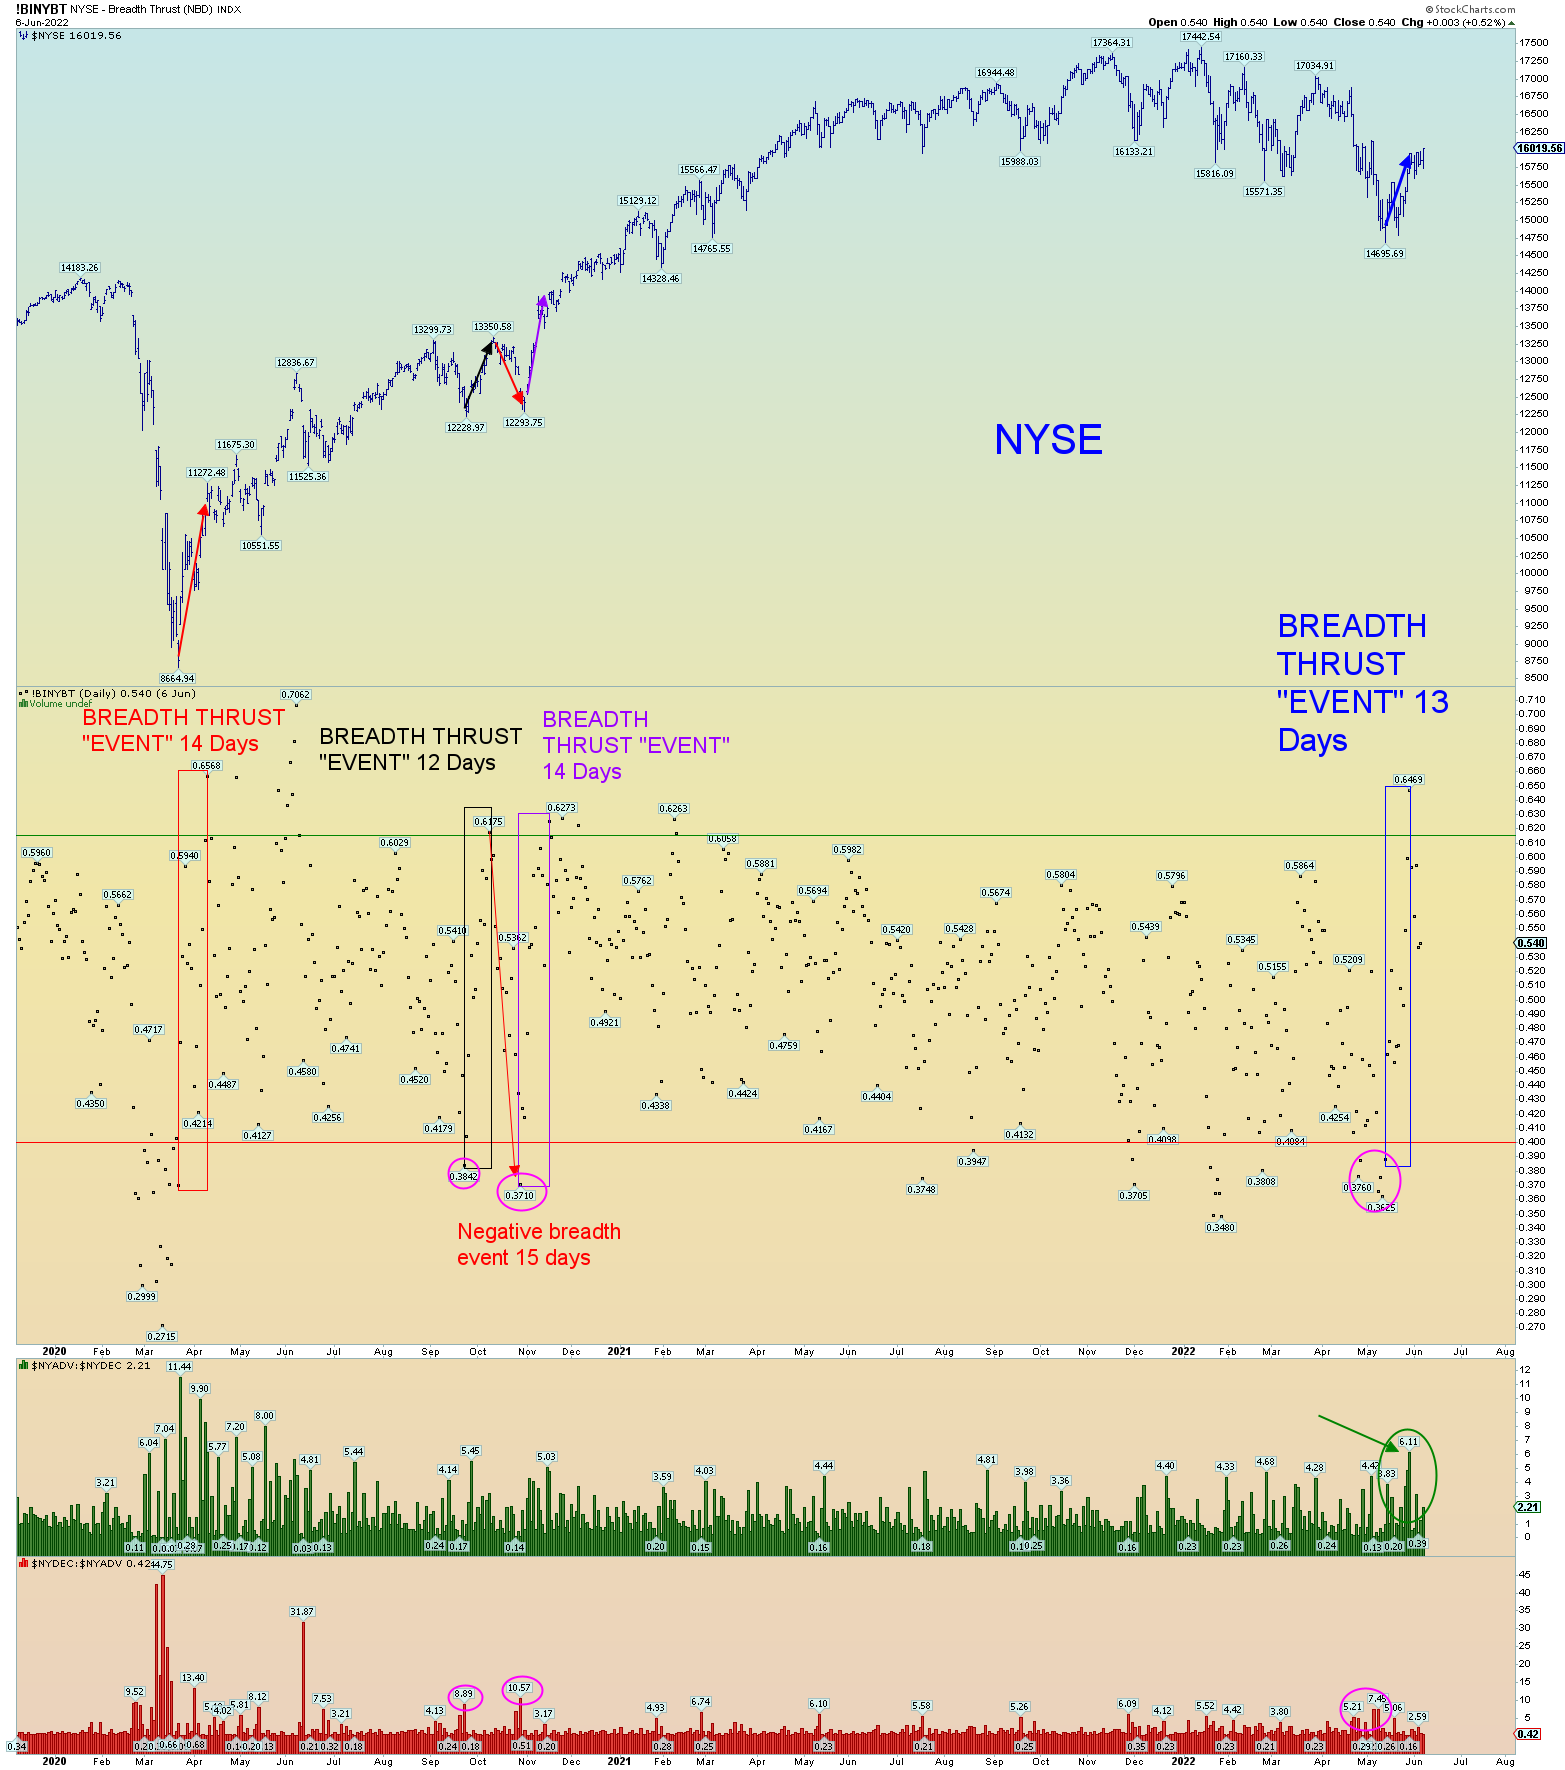
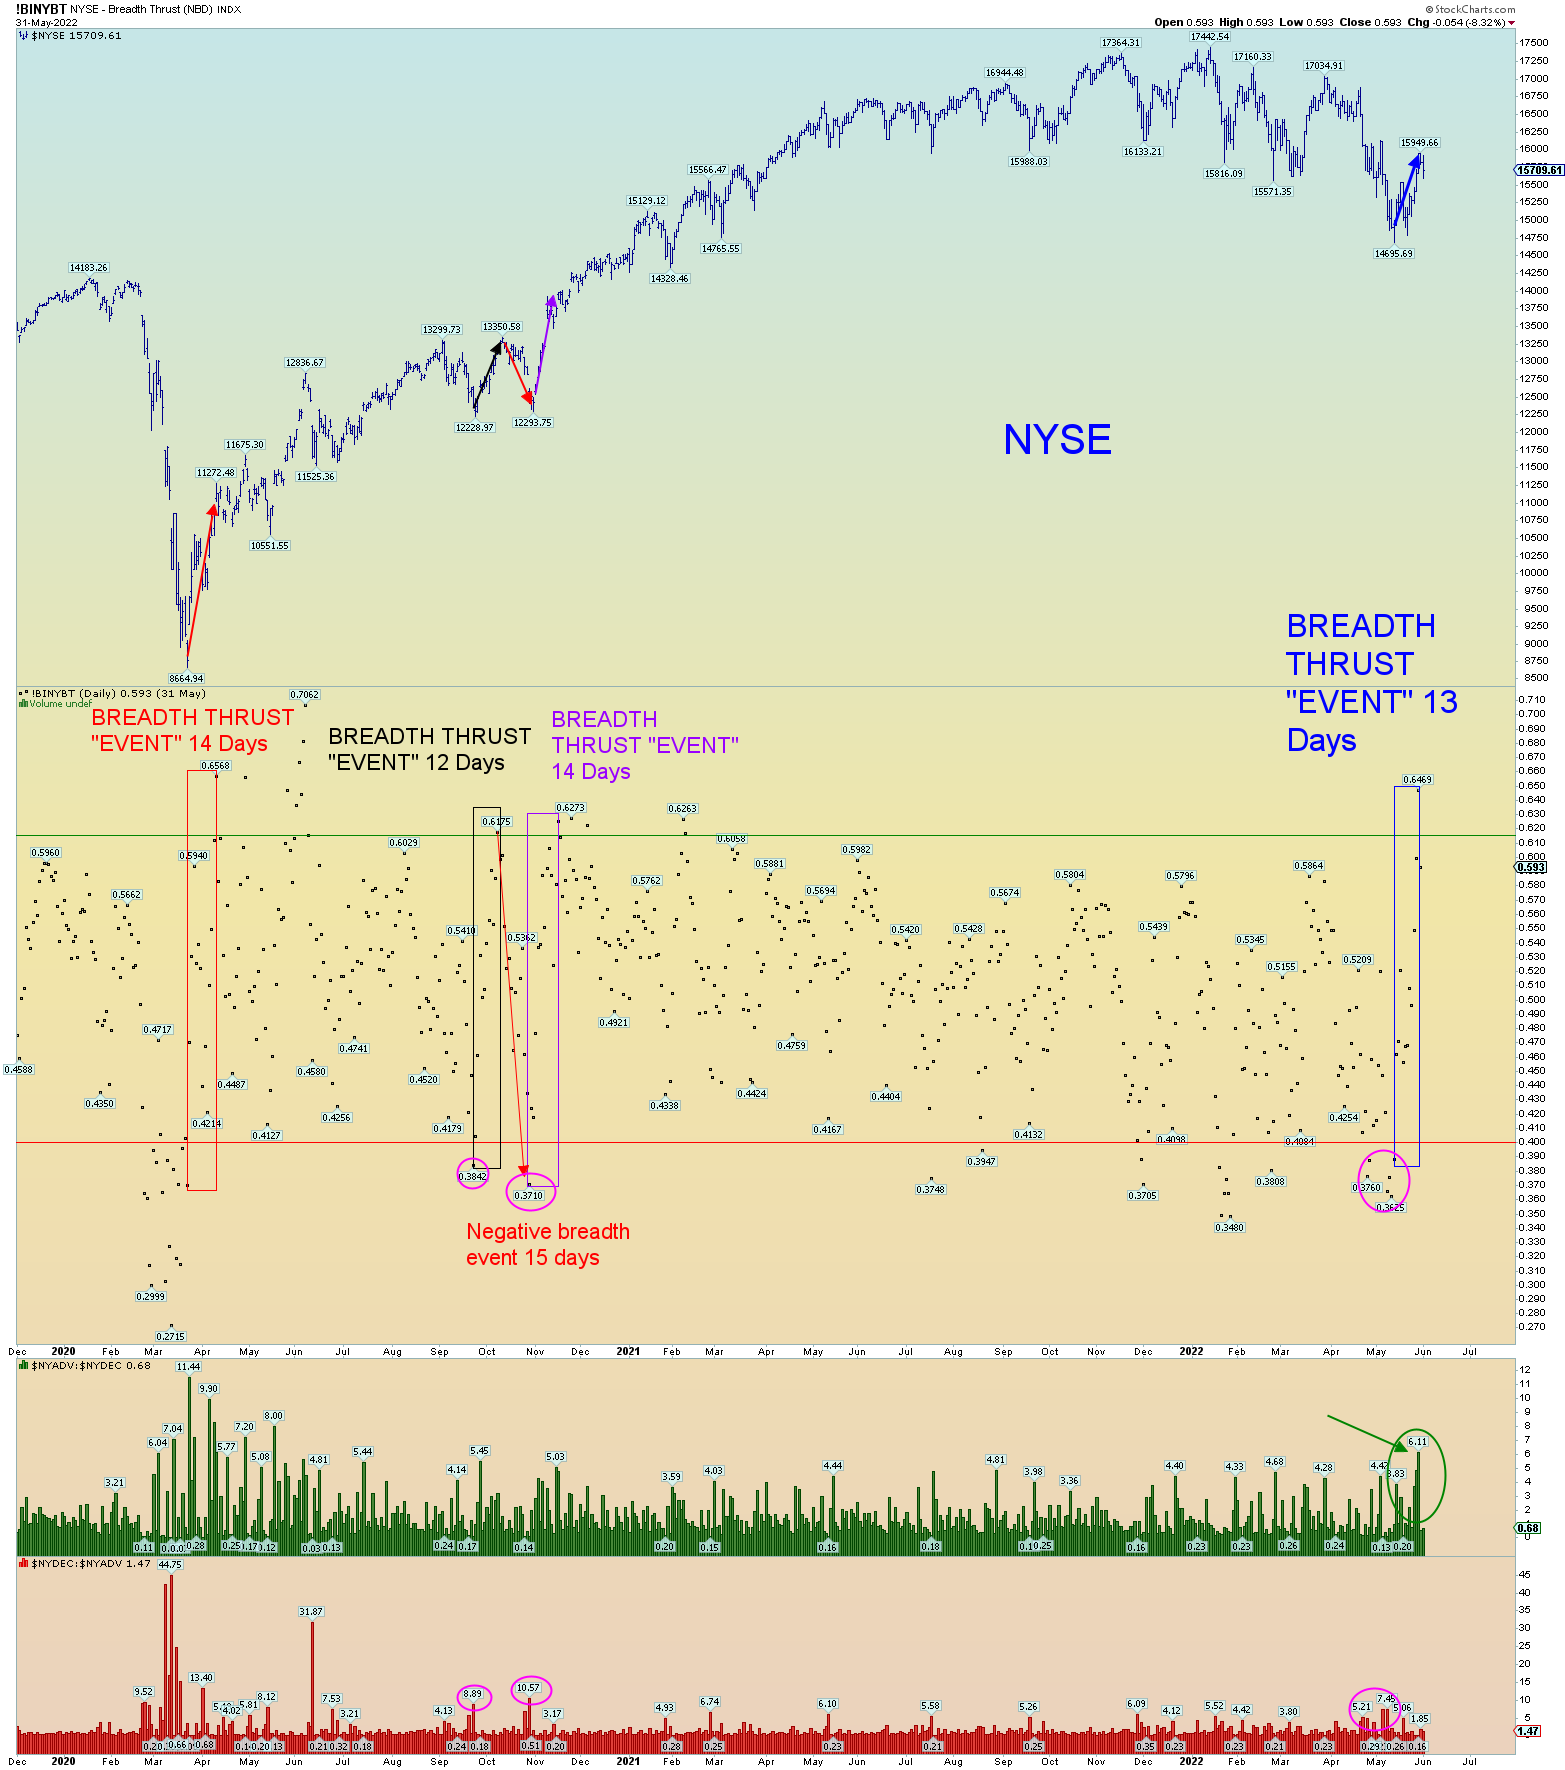
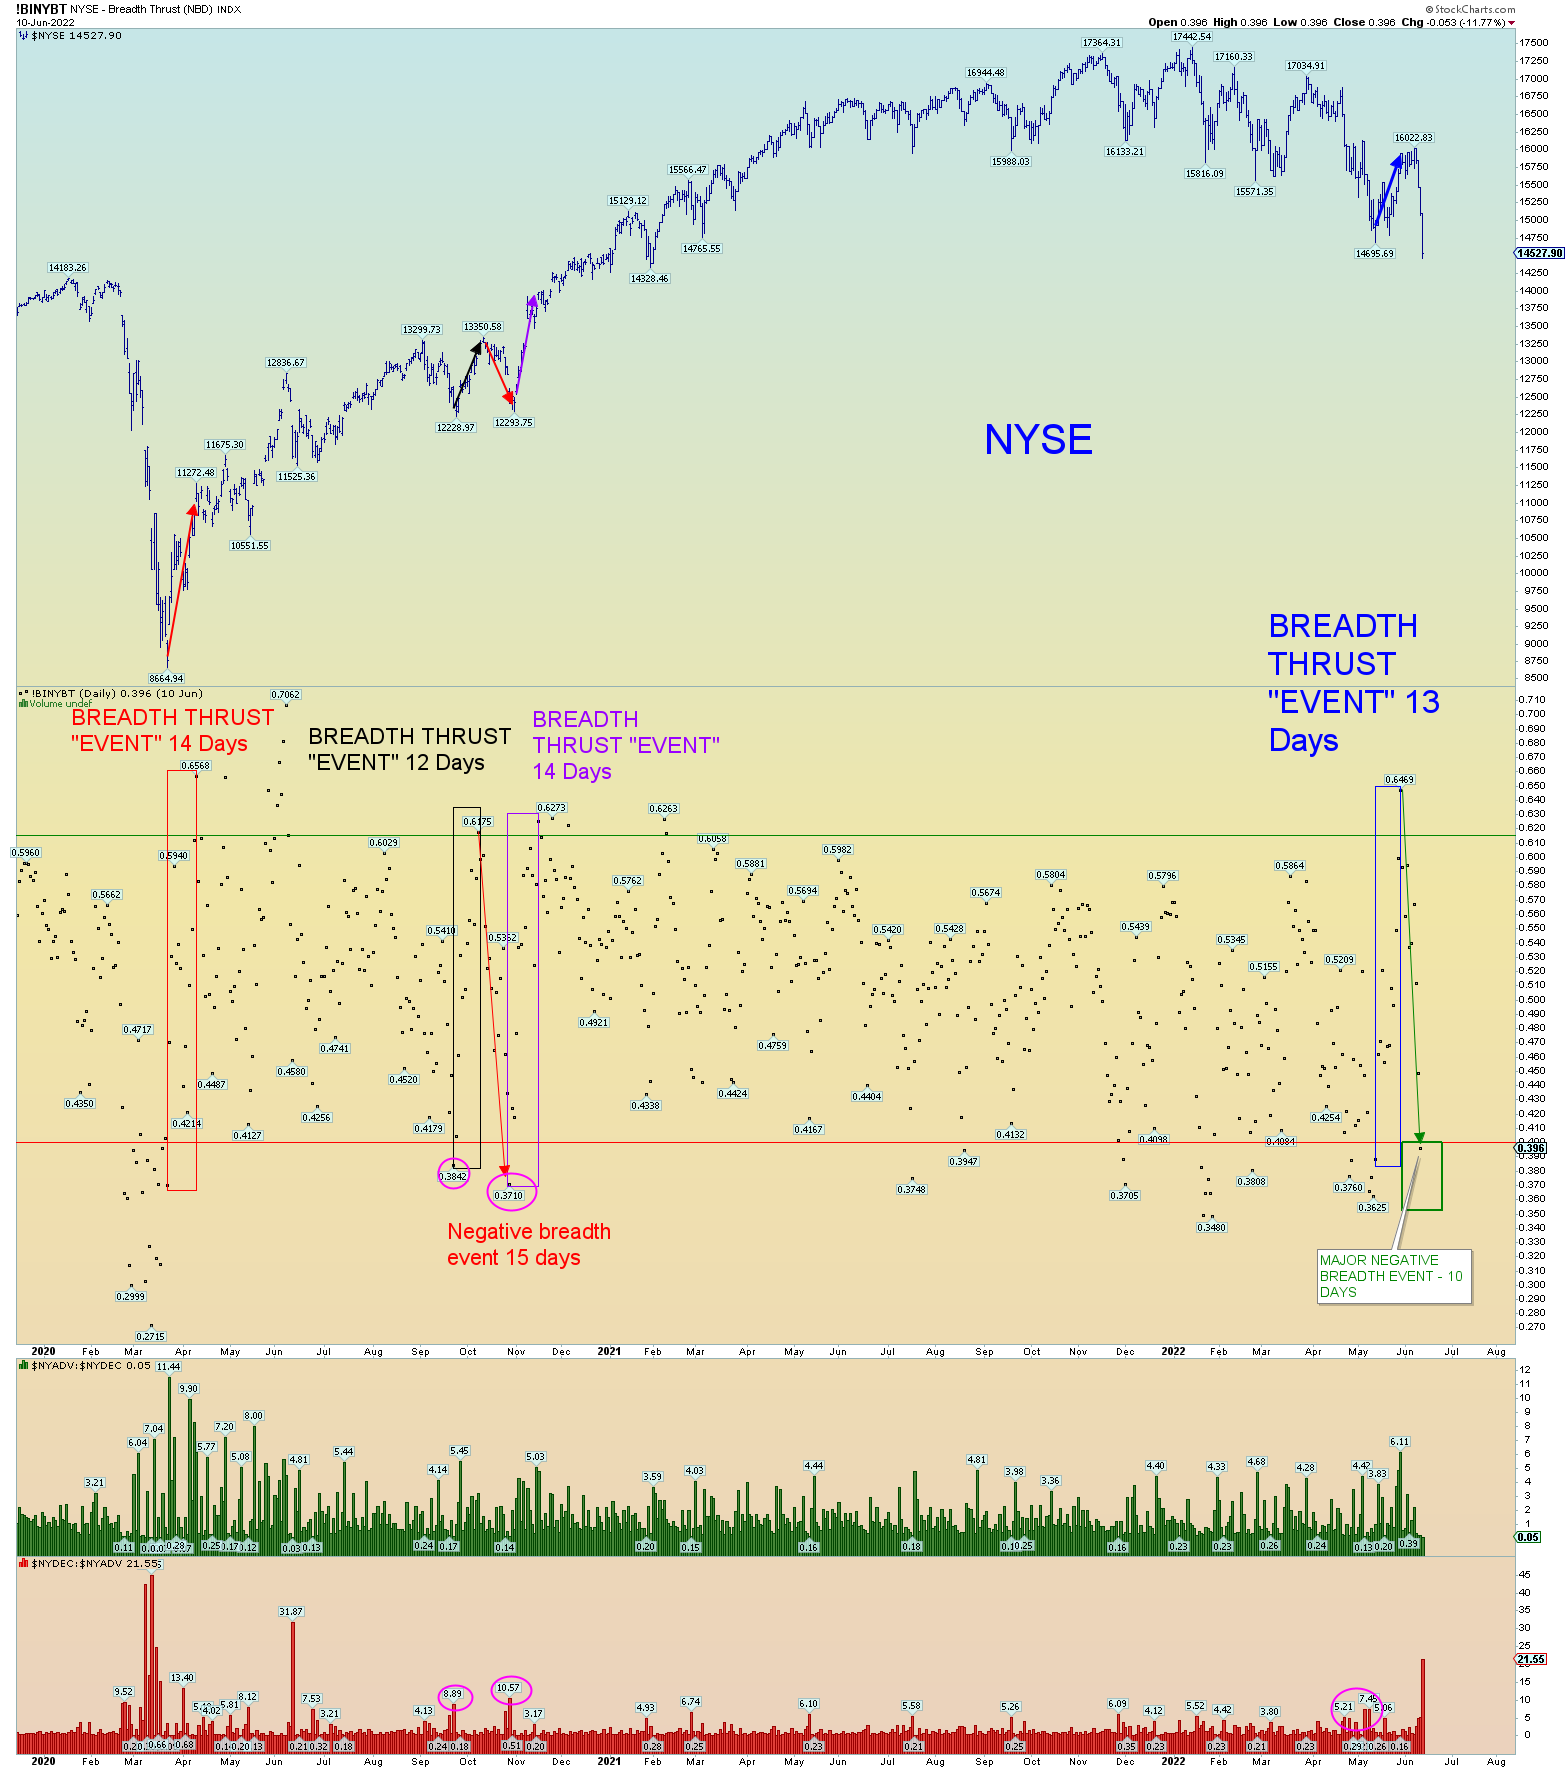
Followup on yesterday’s post on the “reverse” Zweig Breadth Thrust. It has been confirmed. A reader was kind enough to send a link showing I was not the only one who noticed. A Rare “Inverse Zweig Breadth Collapse” Triggers | Quantifiable Edges

(Note: I do not have the today’s BT data point until tomorrow. But do note the very bearish NYSE histogram red bars at the bottom of the chart. Worst day in 2 years.

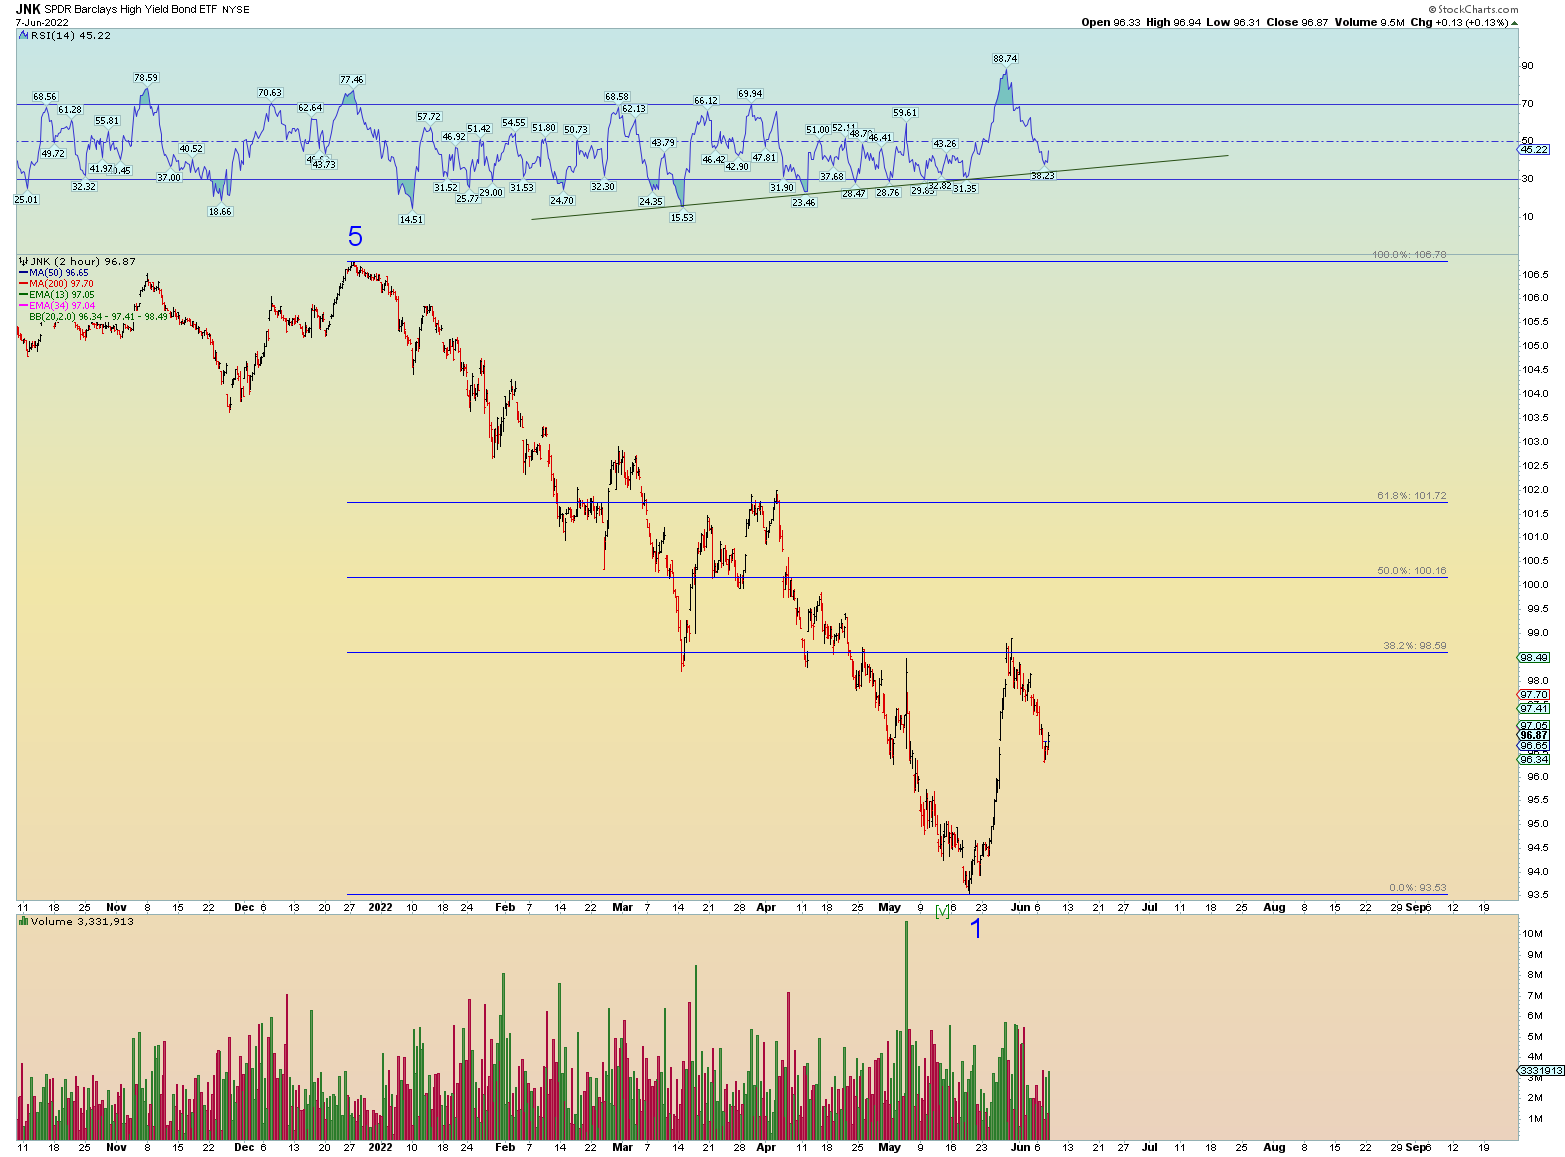
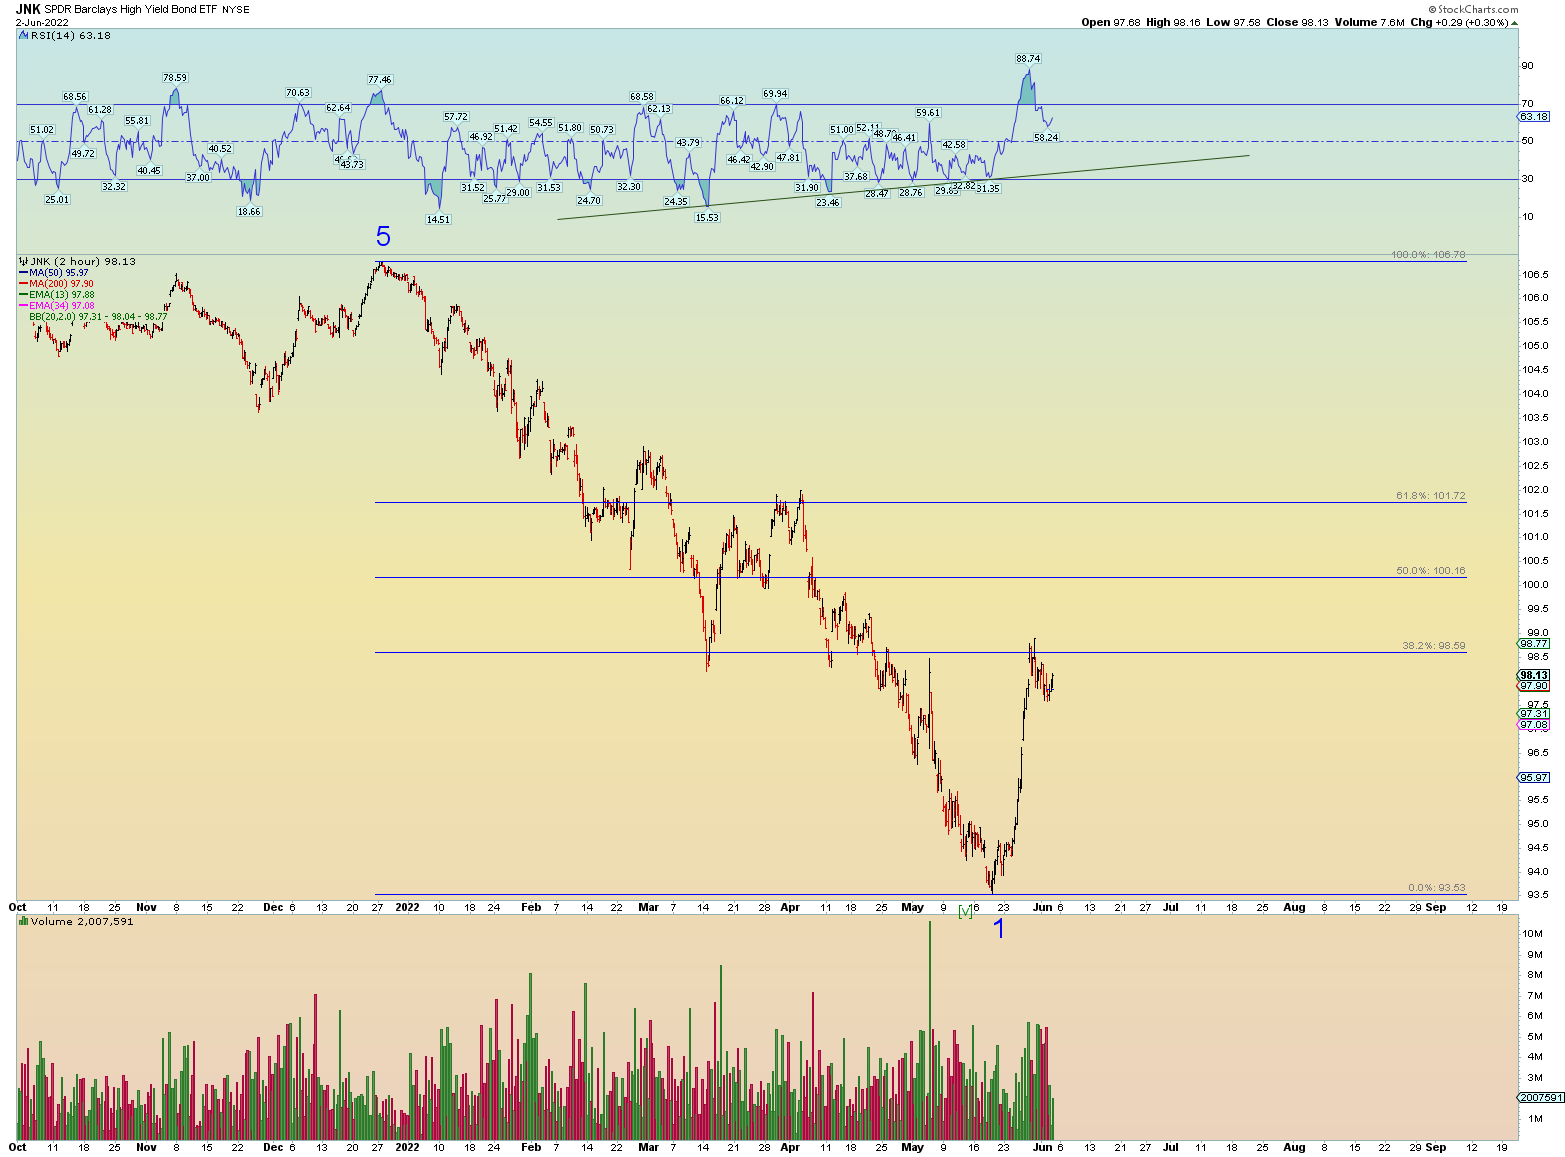
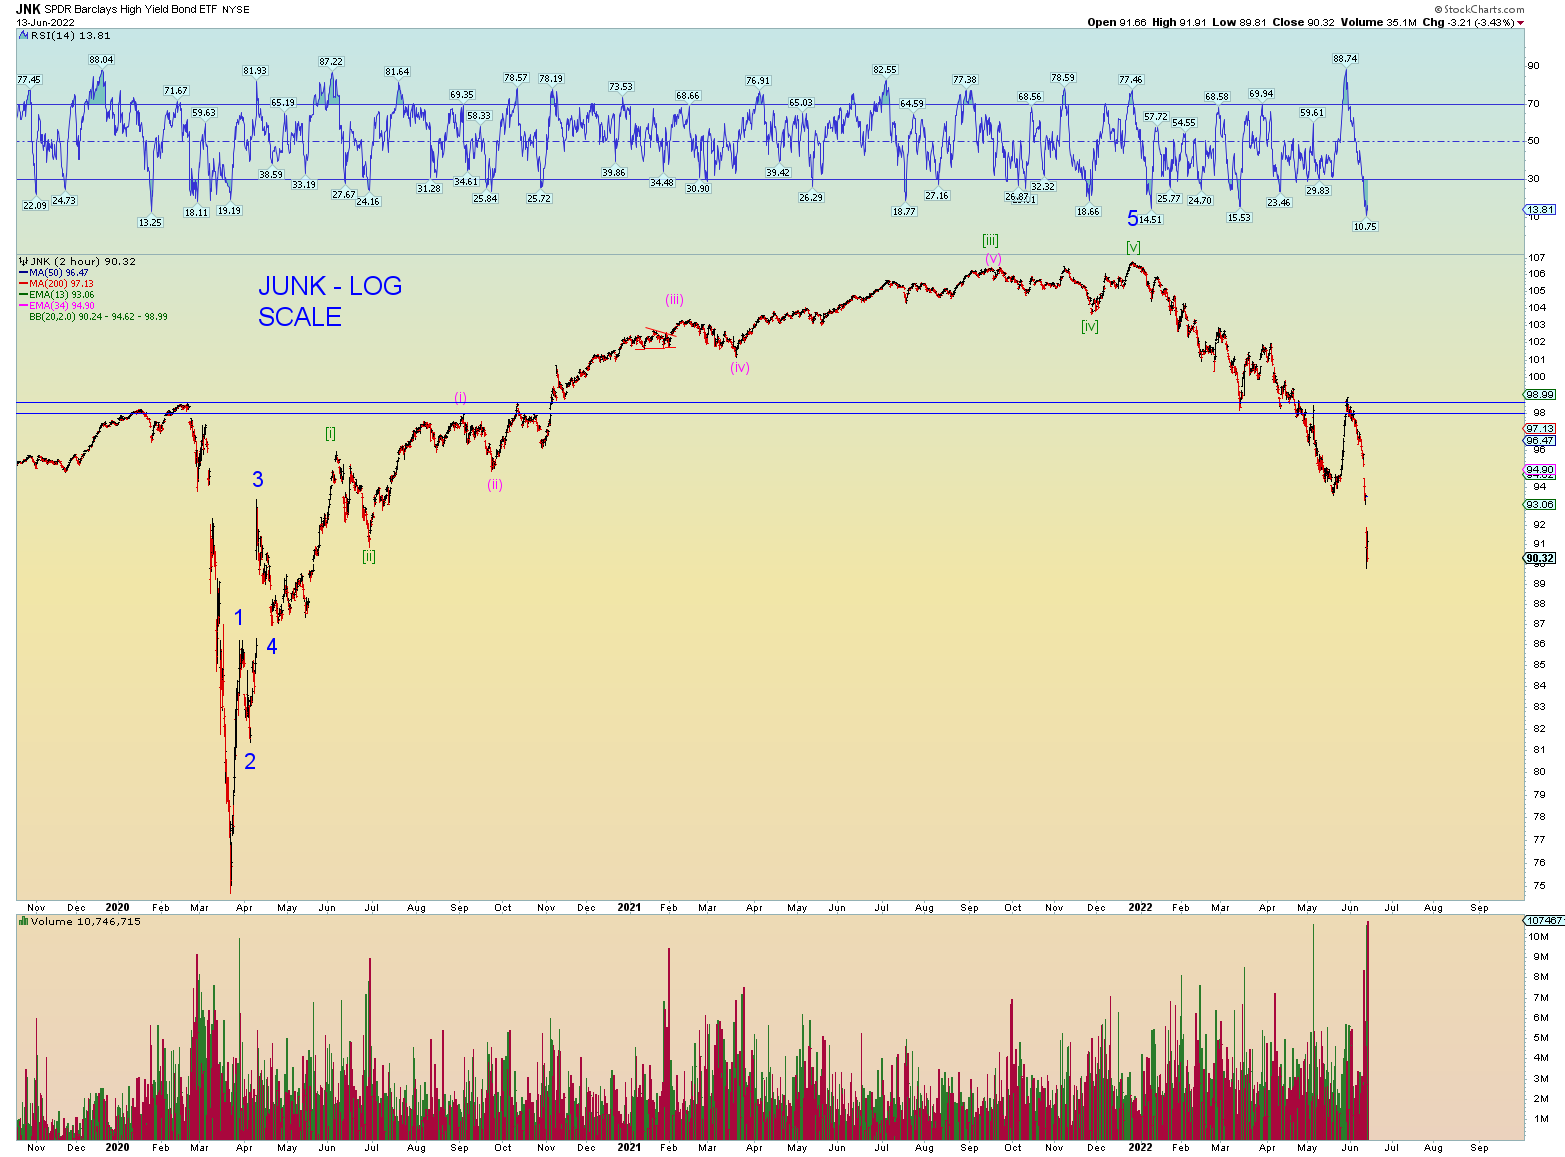
The junk credit situation is not good. A Ponzi scheme can unravel very quickly.

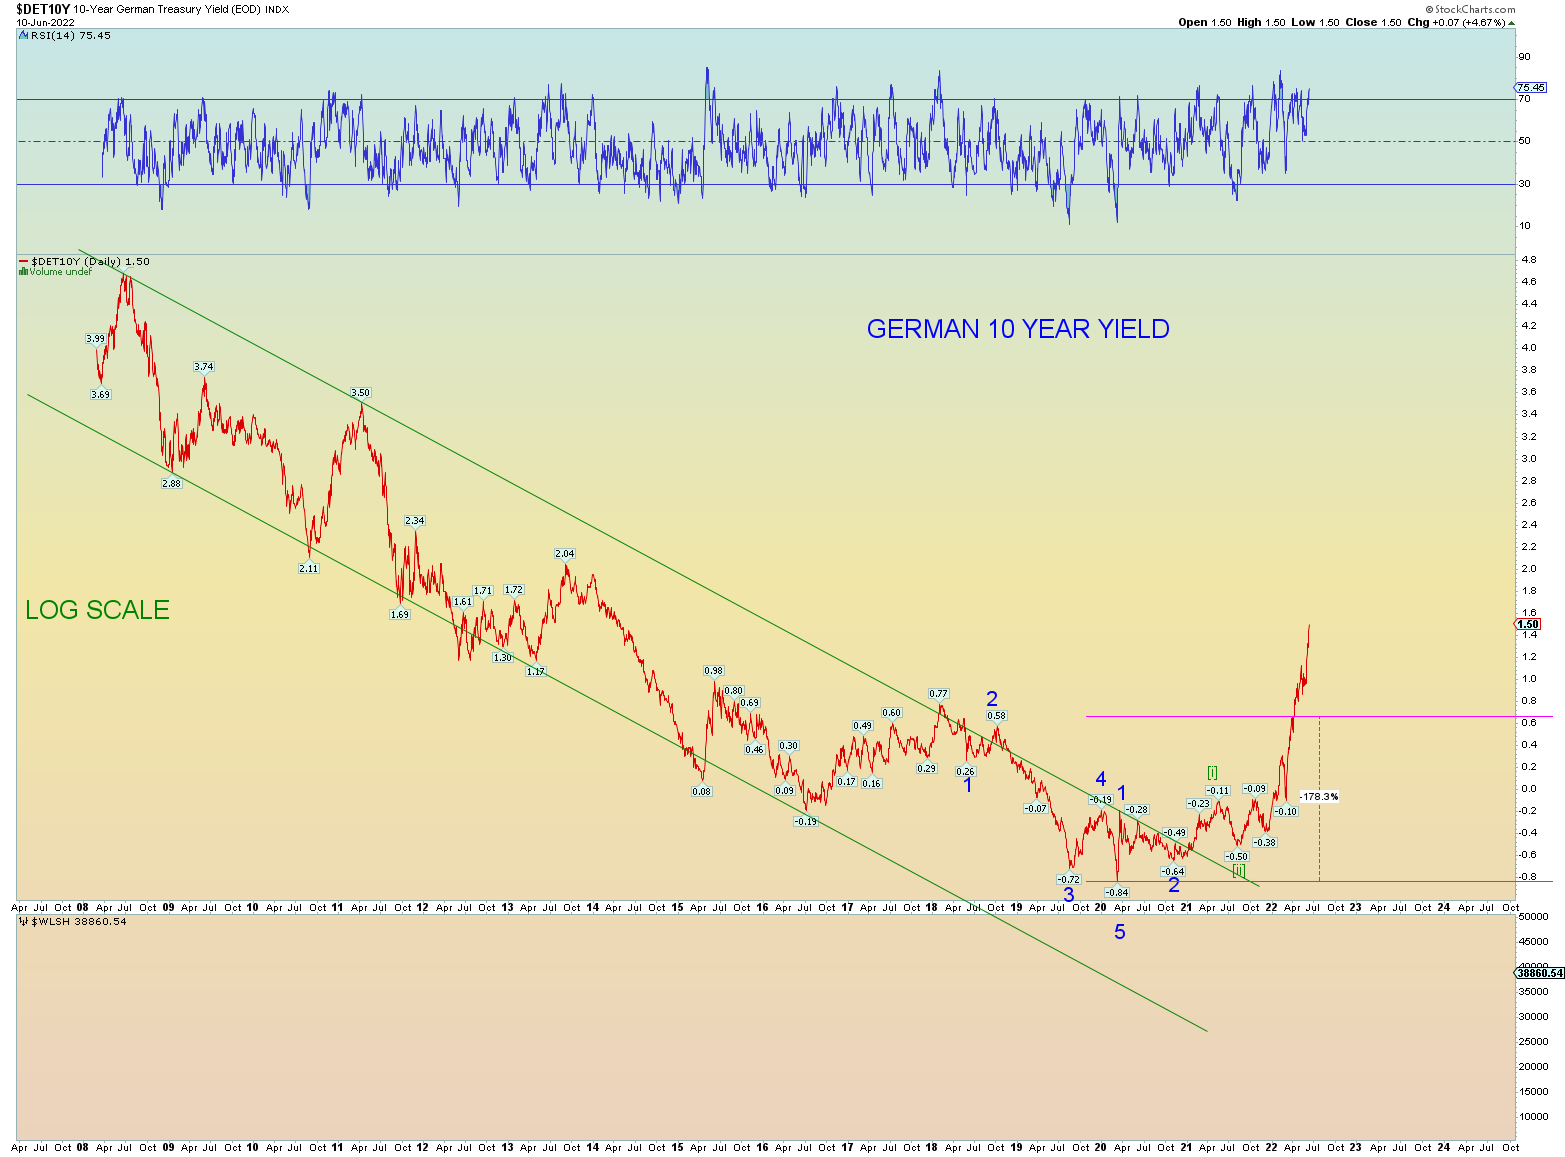
What is the big difference between the market collapse occurring now versus 2020 and prior? Interest rates are exploding is the obvious difference. In 2020 interest rates plunged, in 2022 they are surging upwards! Markets under duress.

Weekend Stuff and Commentary

WAR IN UKRAINE. IS PUTIN DOING SATAN’S BIDDING?

What a strange war. I have suggested that Zelenskyy might in fact be the final Antichrist of Revelation in the bible. At the very least he is a “foreshadow” of the “little horn” of the Book of Daniel (the Old Testament Prophet) that arises to take out 3 global (think nuclear armed) powers. I have gone on to suggest those 3 global powers are 1) Russia 2) China and 3) Israel (to fulfill bible prophecies).

So far after 100+ days of grinding warfare, Ukraine has held although Russia is surely grinding them down. The real goal of Russia is probably to capture Odessa and likely Kharkiv so in that regard, the war seems far from over. But why is Zelenskyy still alive? Has the KGB of old lost its mojo on how to assassinate? Why isn’t Kiev leveled? Russia has no problem leveling cities in the east. For comparison, when the U.S. attacked Iraq in the Gulf War, we bombed the hell out of Bagdhad. And then we swiftly marched our armies and took the city within weeks. Is Russia that bad of an army? Is Ukraine that much of a good defender? Something else may be going on.

Both Putin and Zelenskyy were/are members of the World Economic Forum. The open goal of the WEF is to implement the Satanic New World Order as prophesized throughout the bible. Why is Zelenskyy still alive? Does it make sense? Why does oil still flow? The obvious answers are that Z-man is the West’s puppet. Yes, he is. But a deeper answer is that he is Satan’s ultimate puppet: The Antichrist. And he is protected from harm by the devil.

And what of Putin? He is also controlled by Satan. But for what purposes? To start a war with Ukraine and ultimately the western “democracies”. To bring about defeat of Russia so that the Russian people will align and get onboard within the New World Order. To neutralize Russian nuclear weapons which are firmly pointed still at the western democracies. It might be just in fact that Putin is in on it. Maybe he knows and understands fully, probably he does not.

I therefore propose this theory: Putin’s role is to advance the cause of the New World Order and bring about his own nation’s defeat. To bring about Russia’s neutralization and to bring its people into the fold of the New World Order whether they like it or not. Is this such a crazy idea? How many think that Biden and Uniparty is trying to bring about America’s demise? (Answer: LOTS) I laugh at all the pro-Putin and Russia comments on Zero Hedge forums, and think to myself, are they really that dumb to trust anyone in power in this world?

Putin cannot bring about Russia desolation through the methods of the Western liberal democracies such as moral degradation through LGBQT. And although western influence has certainly affected Russia and its satellite nations greatly, a more old-fashioned way through military grind in an unpopular war and eventual crippling economic sanctions might do the trick. Is he risking his own power? What was he promised by Satan? Or is this all just fancy thinking?

One thing seems clear: Satan controls all the world leaders at this stage. And all the world’s military leaders for that matter. The Satanic bozos Milley and Austin are the final puzzle pieces. It is now just a matter of Satan working the global chessboard into complete maneuvering for his will of a one world governmental system, a one world currency to control it, and a one world religion that worships the devil and the devil only. It is through global warfare and systemic collapse of the old system that will bring about demand from the people to implement the new system to come.

This is why I think the global financial system is in controlled demolition mode. This is why I think sooner, or later China will attack Taiwan probably before this year is out. Because Satan understands the wicked hearts of mankind and has put the wickedness to his use for his will. And if Zelenskyy is the Antichrist, he will prevail against Russia and Putin will lose, at least from a political perspective. And then Zelenskyy will be promoted to a new global alliance that forms against Russia/China. And worldwide warfare ensues. And great famines. More pestilences (at the hand of mankind) And then very great excess death. And with Hell – the center of the earth – filling up with souls at a rapid rate, great earthquakes will occur in many places. With a collapsed global supply system and financial system, people will be clamoring for solutions. And the devil and his minions, the Antichrist and False Prophet will seemingly have the answers.

But Dan, what about nuclear weapons? Surely, we risk total worldwide nuclear holocaust, yes? No, the bible does not indicate this will happen at least not until the final destruction of Babylon (United States) just prior to Armageddon. Christians will not be on earth for that event so no need to worry if you are saved.

The bible does not describe the tribulation period (the first 3 1/2 years of Daniel’s 70th week) as being a nuclear holocaust. God will not allow it to happen while his Saints are still on the planet before the rapture. Simply put, Satan does not have the authority to launch. This is what has kept the world safe all these decades. It was not a prudent mankind with a careful doctrine of M.A.D. that kept the world safe from nuclear annihilation, it was GOD who kept the world from destroying itself. Vengeance is the Lord’s! The world will end as God has ordained, not as man or Satan wants.

Sure, Satan maybe does want to launch all the weapons of the world, but does he, or could he? What does Satan really want? He wants to be worshipped as god and eradicate Christianity (Jesus) from the planet. But he will do this by fooling the world into thinking his puppet the Antichrist is their Messiah. The Muslims will think he is the final 5th Mahdi (prophet). The Jews will accept the Antichrist as their Messiah. Unsaved Christianity will claim it is the second coming of Jesus. Buddhists will think he is the final Buddha. Etc. etc. And thus the world will end just as prophesized in the bible. Every bit of it. Therefore I have no worries. Jesus said this must all come to pass and to keep the faith.

Could there be a brief nuclear explosion or 2 around the world? Maybe so. Maybe a couple. Certainly, having a major city – a locale being judged by God – wiped out will shock the global system into complete chaos and collapse. For instance, if Pakistan launched a major warhead and it blew up New Delhi. Or vice versa Islamabad was wiped out. You get the picture. But it is not something to worry about unless you are not saved to Jesus you need to be worried because you’ll go to Hell.

Is all this a shadow of things to come and I am perhaps many years or even decades too early? Sure. Could be. I am not dogmatic about timelines. The only thing we need to look for really is global warfare. And we are not there as of just yet so until it happens just keep living your life as best you can.

THE COUNTS

I placed the steep red downtrend line 3 trading days ago and so far, it has adhered, so I’ll leave it up there for good luck.

Friday finished again in a bear market. The general target for Minor 3 is many thousands of points below.

Interest rates. Big Fed meeting. A 1/2-point raise is not going to keep up with the rate of change the market it signaling to the FED. A .75 rate hike might be in order. A surprise for the market. But what choice do they have? They are playing catch up and the acceleration has not yet stopped.

The green arrow is about halfway between the 3- and 6-month rate which there exists a wide chasm at the moment between them. Much different than the last time rates went up as you can see in 2016 – 2019 time period.

The 6 month has poked through its long term down trendline.

The 3 month is playing catchup.

Interest rates are a global problem of course because it is a global Ponzi in nature.

China 50% retrace.

Global DOW rejected at resistance.

And finally, the NYSE breadth thrust data. I showed how there existed a “breadth thrust event” upwards but that according to the wave count of Minor 3 down, this should be negated by a comparable negative breadth thrust event downward. And although I won’t have the data point until Monday, I’m fairly confident that Friday ended beneath the .40 line making a negative event of only 10 days total from above .615 to beneath .40.

One can say this was a “Zweig Breadth Thrust” event in reverse since it met the 10-day criteria!

Elliott Wave Update ~ 9 June 2022

The overall primary count of the past week(s) has been that Minor 2 of Intermediate (3) has to play out and then after the peak of Minor 2 is “in”, the market will collapse in the power of a Minor 3 of (3) down. Perhaps today’s bearish close was the opening “salvo” of the next wave down. Note the final 30-minute bar of the NYSE histogram down volume ratio at the end of day. It finished well above a 90% ratio, the biggest negative 30-minute volume bar of the past 2 months.

The Wilshire 5000 again has a suspect data point in its opening surge and quick plunge back but it’s a minor nuisance so no need to make a big deal of it.

And although I had this count yesterday where prices plunged and recovered in a minuette (iv), that scenario was mostly based on a beginning day opening gap down and cover + (which didn’t happen) and instead we got a bearish late day plunge. But regardless, here is the chart if today turns out to be a small headfake on the path to the true Minor 2 peak. But again, the end of day price action was quite bearish.

The weekly shows the potential longer-term count. If Minor 2 has found its peak, then total market carnage is about to unleash. The plunge of Minor 3 would take prices, at a minimum, back to beneath the February 2020 high of (D).

The sary thing is that the Chinese markets may be “aligned” social-mood wise with the global markets. In other words, once Intermediate (2) finds its peak, the Chinese market will collapse also in spectacular fashion in alignment with the rest oif the world markets. the results could spur and bring about global war.

China attacking Tawain this summer with the U.S.A. Babylon instigating.

Junk is confirming the bearish move and is Transports.

Elliott Wave Update ~ 8 June 2022

The primary count has a triangle long winded in the making. It is on everyone’s radar so that probably makes it suspect. But still, that’s the best count so we’ll go with it.

Be on the lookout if there is a big open gap down. Since the market has shown its triangle hand and flashed it for many days, often that does not pan out as a result. Another interesting squiggle option is that the market gaps down and then explode higher to a new recovery high. The main point is that there exists another support layer lower in price.

The most important thing to take account is that there exist enough waves in place already to consider the count “over”. Minor 2 over. It might look like this. Again, we have the key support layers.

In this case, the market can be considered to be “consolidating”, not for a move higher, but a mega move lower. Sooner or later we will know.

Elliott Wave Update ~ 7 June 2022

Ultimately giving the market the benefit of the doubt because our ideal target ranges have not been met yet. Prices are approaching the down sloping 50 DMAs in most indexes.

Market still charging upwards. At least a .50 hike and even that will be behind the curve.

Elliott Wave Update ~ 3 June 2022

This one chart of the Wilshire 5000 tells the squiggle story at the moment. The previous numerous posts on other longer-term charts and projections show the potential of both the near term bullish and bearish cases so there is no need to repeat everything tonight.

The main point tonight is the main horizontal support line of the peak of Minute [a] of Minor 2 is what the “algos’ are looking at. And as always, the overnight futures having thin liquidity, pushing prices sharply one way or another.

Yes, they can manipulate the market, however, in the long run, they cannot. Social mood will take long term prices to where they go one way or another. You can have a Ponzi scheme for many years, but one way or another it will be found out. You can cheat God one way or another but some day you will reap what you have sown and pay the price of stealing from your future generations to come. That much is certain.

The SPX with the same count and target ranges. A stupidly big gap down which of course presents an “easy” target for the algos yet sometimes the market will do exactly the opposite.

At some point, if this is truly Minor 3 of Intermediate (3) down, you’ll wake up one morning at “limit down”. Many younger traders have never truly experienced a bear market before or the excitement of a limit down, but we are due sooner or later.

At some point a true bear market will cause all to lose hope and of course we are almost infinitely a long way from that point in time. The market has a lot of work to do to turn this Grand Supercycle of 240+ years into the worst social mood downturn since the Dark Ages.

Elliott Wave Update ~ 2 June 2022

There is a lot of variation between indexes. Negative divergences existed between the top(s) in Nov 2021 and early January 2022. The main reason I track primarily the Wilshire 5000 is because it lies the least. It is the total U.S. market which, in the scheme of things, is the only thing that matters.

Once in a while I’ll throw in an SPX chart here and there, but the algorithms of today’s highly watched, and computer traded indices become somewhat self-fulfilling in a sense. The DJIA, the SPX (SPY), e-minis futures, the COMP, the NDX, even the Russell 2000, these are all highly watched and traded markets via algorithms and have, as a result, become the least predictive Elliott Wave structure overall. For example, how many algorithms have given hefty weight and programmed with “gap trading” in mind?

But no one really trades the “total market”.

My point is thus: If the Wilshire 5000 had been the “key” market index to trade, the “pros” would have done it decades ago, made a highly traded index to exploit it, and based technical analysis around it. There is something tempered about trying to manipulate the entire (for the sake or arguing) tradable index of the United States. If it had been “manipulative” they would have done it by now. But of course, they break the market into “segments”; and abuse these gyrations and programmed the computer algorithms to react or not react based on a myriad of micro information passing over the “news ticker” at every waning moment. Chop up the market, and it can be manipulated all the easier.

But the thieves of Wall Street generally shun the “total market” because it cannot be manipulated as the sub-segments are. Therefore, they shun and bury the Wilshire 5000.

But I postulate that they have actually done the opposite in secret. That they actually use the Wilshire 5000 (or some other such total market measure) in the algorithm programming and adhere perfectly to predicted wave patterns, channel and trendlines of all various sorts. I of course cannot prove this, but the result of market moves manifest in the output of the Wilshire 5000 chart. The Wilshire 5000 adheres the best to Elliott Wave structures.

For instance, the SPX made a new all-time high in January and the Wilshire 5000 (its closet cousin) did not. This was a major negative divergence over a span of 2 months, and it mattered. The aftermath resulting total market breakdown followed.

So, what is my point? One point is this: pay attention to the total market moves as expressed in the Wilshire 5000 and its overall pattern, its channel lines, its trendlines. At this extremely volatile junction, it tells the least lies. It makes the best channels, trendlines, and other finely tuned price targets and pivots.

Remember, Elliott Wave theory is based on somewhat absolutes. For instance, wave two cannot go beneath in price the start points of a wave one. It is the hardest of rules and forbidden. And when one views these small variations between two “cousin” indexes, you can glean some useful information perhaps.

But I digress and you get the point.

The best count has the total market approaching its ideal Minor 2 target range. I added a third target range based on the short-term structure of wave [c] of 2.

Here is a small example of how the SPX differs slightly with the Wilshire 5000 and perhaps is telling a diverging story. Today’s SPX low surpassed yesterday’s low yet the Wilshire did not. These are subtle clues. (Of exactly what is why we count squiggles)

Still would like that backtest of the Wilshire weekly. Coming closer.

I don’t count the DJIA because it can go through great nuisance stretches just like the NYSE count or any other subindex.

No new high on Junk today.

And finally, allow me to show you a chart that differs not very much from the Wilshire daily chart (shown above) that accounts for a Fibonacci 2.618 wave [c] times [a] for a Minor 2 price target.

And what if that 2.618 Fib target was reached, what would the overall pattern look like on the total market?

It would look like this:

CONCLUSION:

The bottom line is this: Even if a much deeper overall market retrace occurs, even if done in a swift and “take no prisoners” manner, it would produce the most overbought, overhyped, overthought, overtraded market in history and result in a historic collapse no matter how one tries to “rescue” it.

That much I am confident in. So, if the market needs to rip some more face to the upside, I say bring it on!

Elliott Wave Update ~ 1 June 2022

Yes, you can get saved by watching and hearing the Word of God on the internets.

https://www.youtube.com/watch?v=Tb5nGDbYmYo

Looking at the NYSE “breadth thrust” indicator, we have had an “event” triggering last Friday. This is not an official “Zweig” event of 10 days or less however I consider a significant event nonetheless.

The primary wave count has the market topping in Minor 2 of (3). After this, more intense selling of what has occurred previously since the November Wilshire 5000 high should occur. And I’m counting on a “negative” thrust event which negates the recent positive and buries the daily print back beneath .40 on the scale. This would take a “close” beneath the closing price of Minor 1 of (3) low.

IF the market cannot pick up selling pressure to negate this positive event, then we might be faced with the “rare” extension of 2.618 for wave [c] of Minor 2 expanded flat. That would be the black hash mark on the downslope line.

But that is getting ahead of things as the market has yet to even reach our preferred Minor 2 target range (on the SPX its 4185 – 4233). I only point this out because this is my thinking about this positive breadth event which cannot be ignored until it is closed under and reversed. The primary wave count suggests that will happen, but the market doesn’t always go the path we wish it to take.

At the very least, we can now determine probably where wave (iii) of 2 peak is and likely the price low of (iv) of 2.

The SPX rose over 9% in a tad of 5 trading days so it was a significant move. For now.