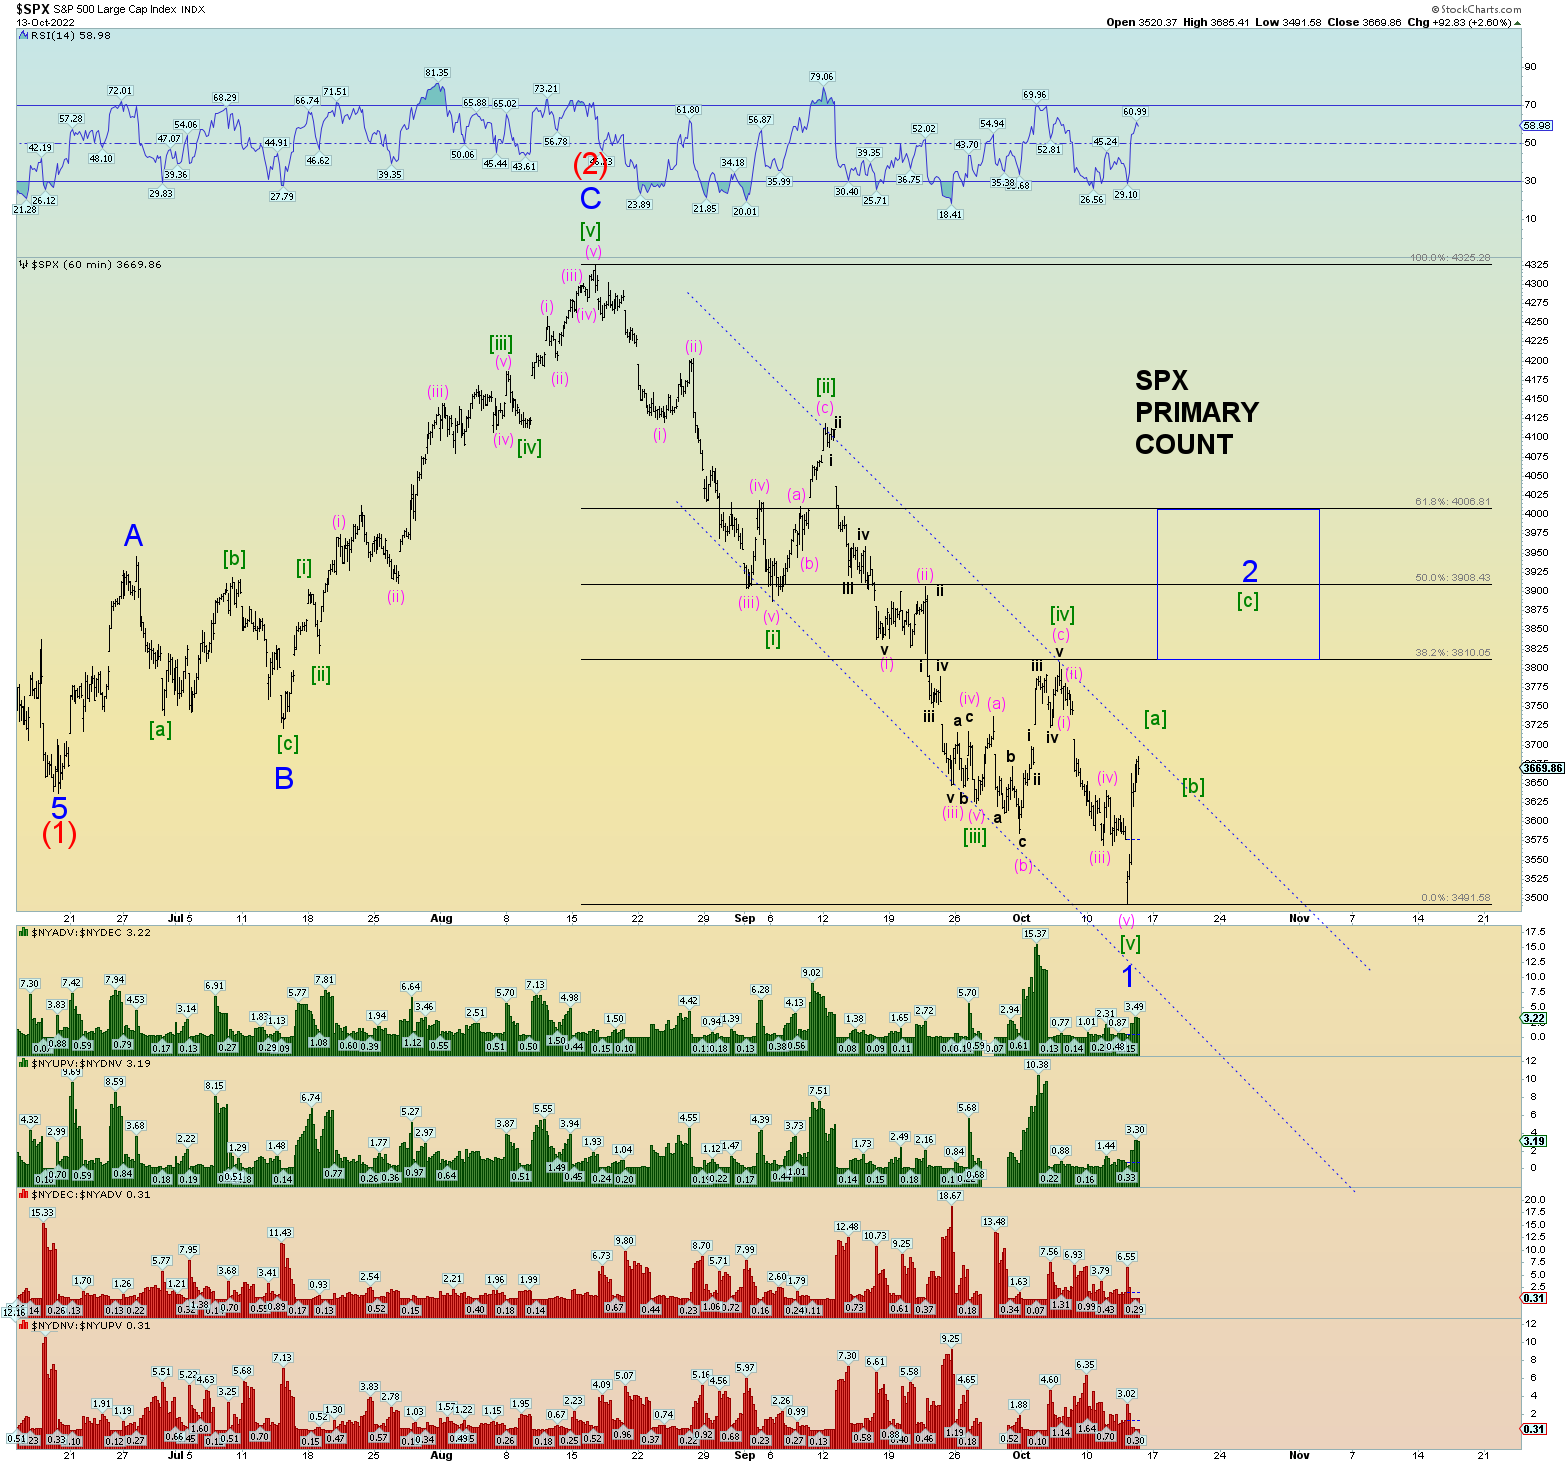
The market finally finished lower in about the manner I was hoping for to form a very decent Minor 1 of Intermediate (3) wave low.
Additionally, The DJIA, the NYSE also made lower lows finally and both confirmed 5 wave moves from the Intermediate wave (2) peak we have been referencing for many weeks.
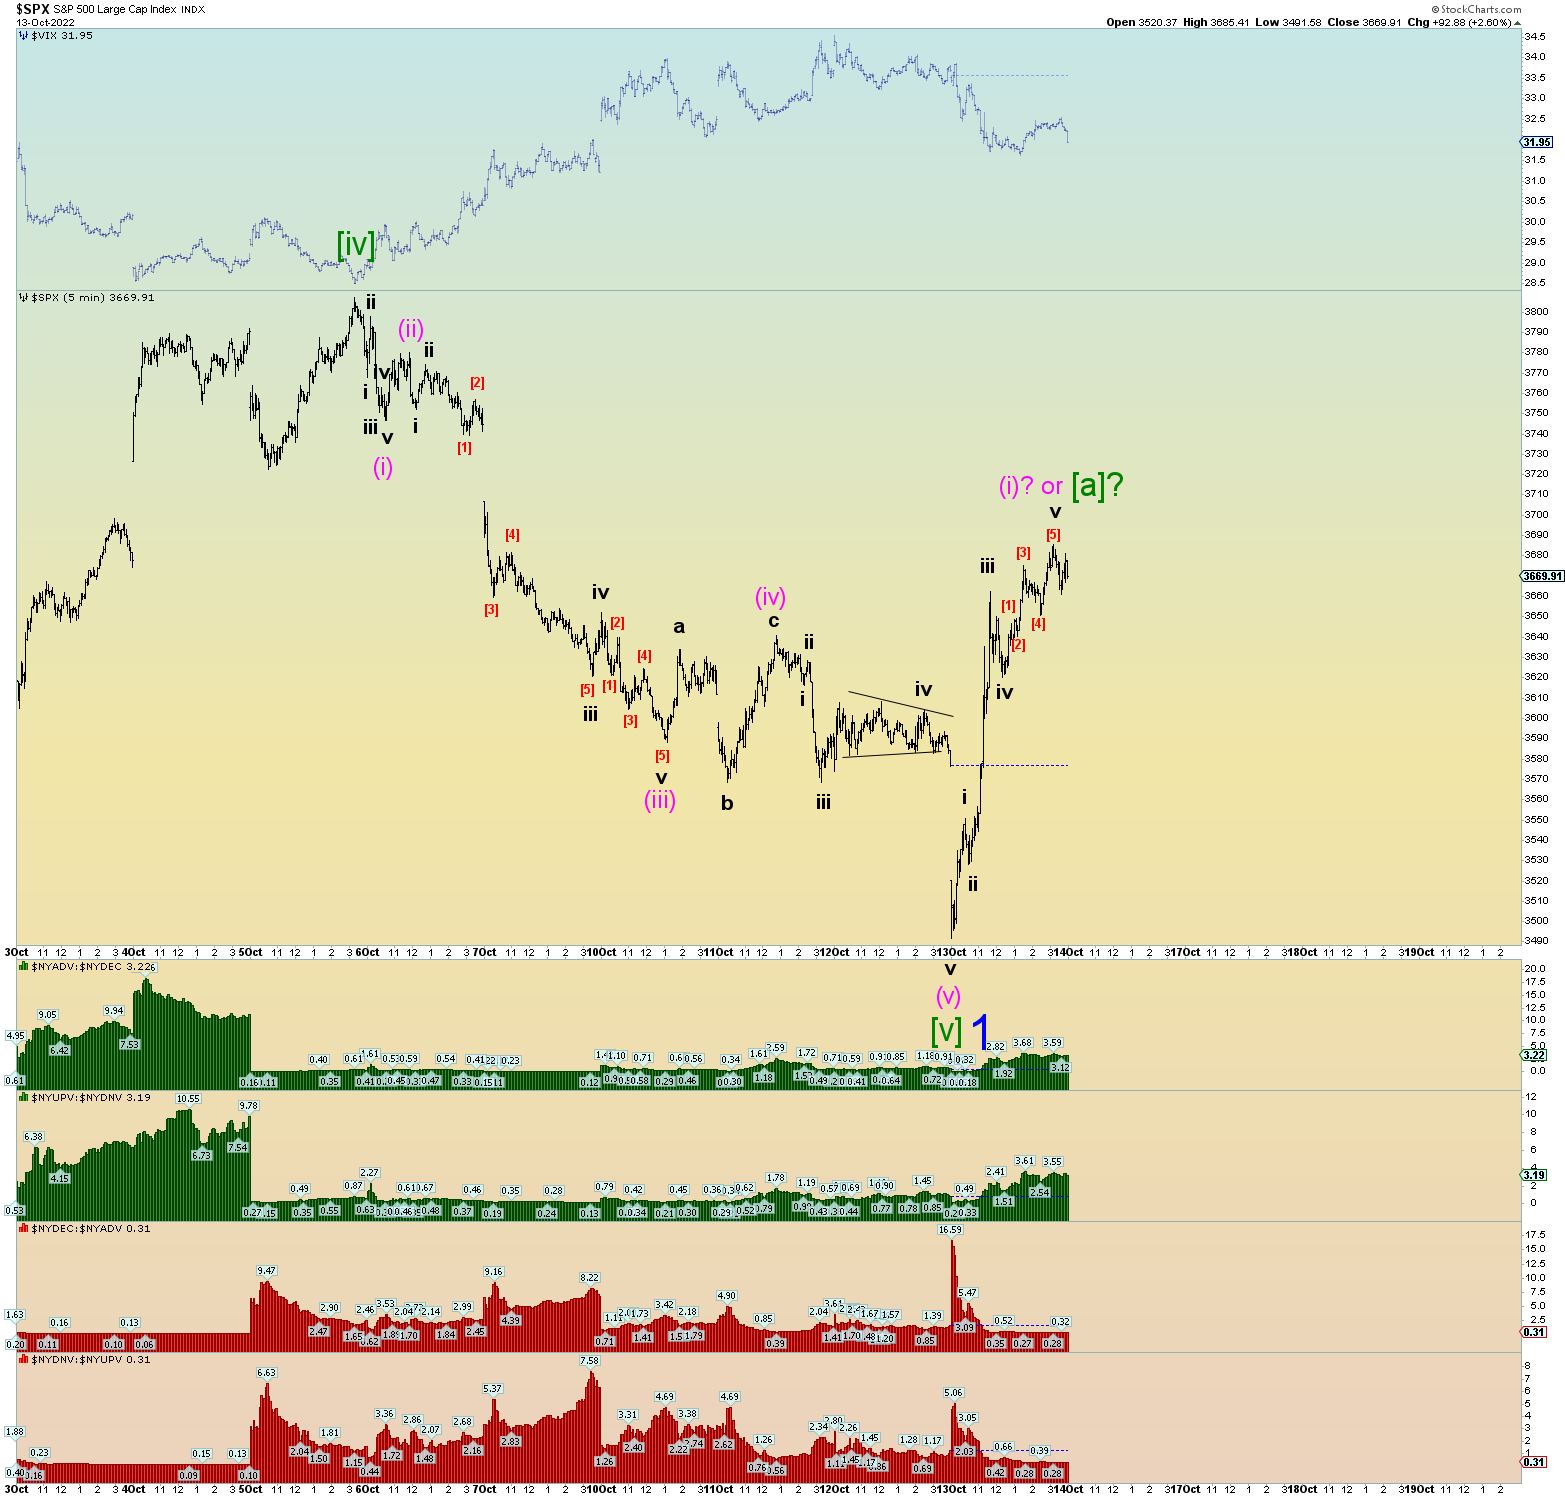
And zooming in on Minute [v] of 1 we get the squiggle count which works quite well.
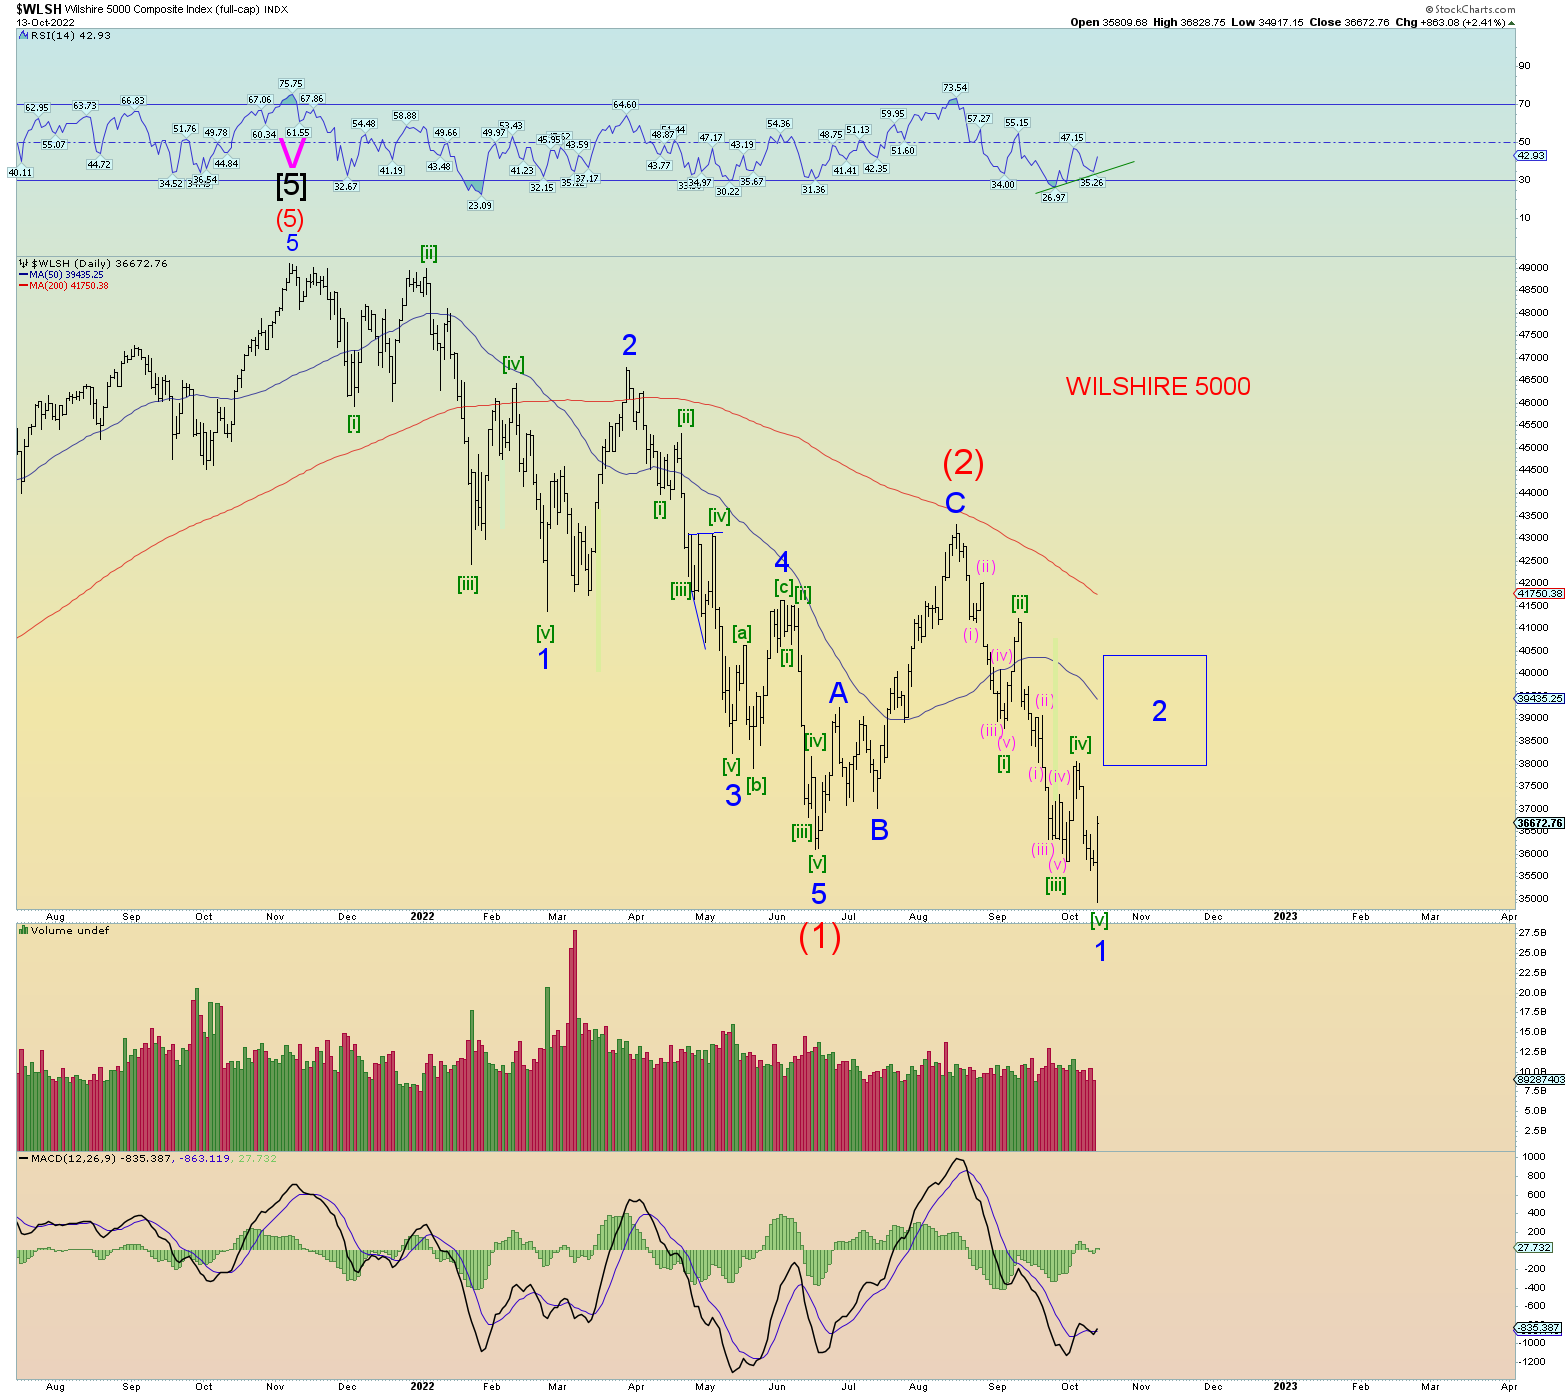
The Wilshire daily, which is a twin sister of the SPX practically, shows the daily Minor wave 2 target range. The double positive divergence remained of course so we might expect prices to move above Minute [iv] price peak as a follow-through of that technical divergence.
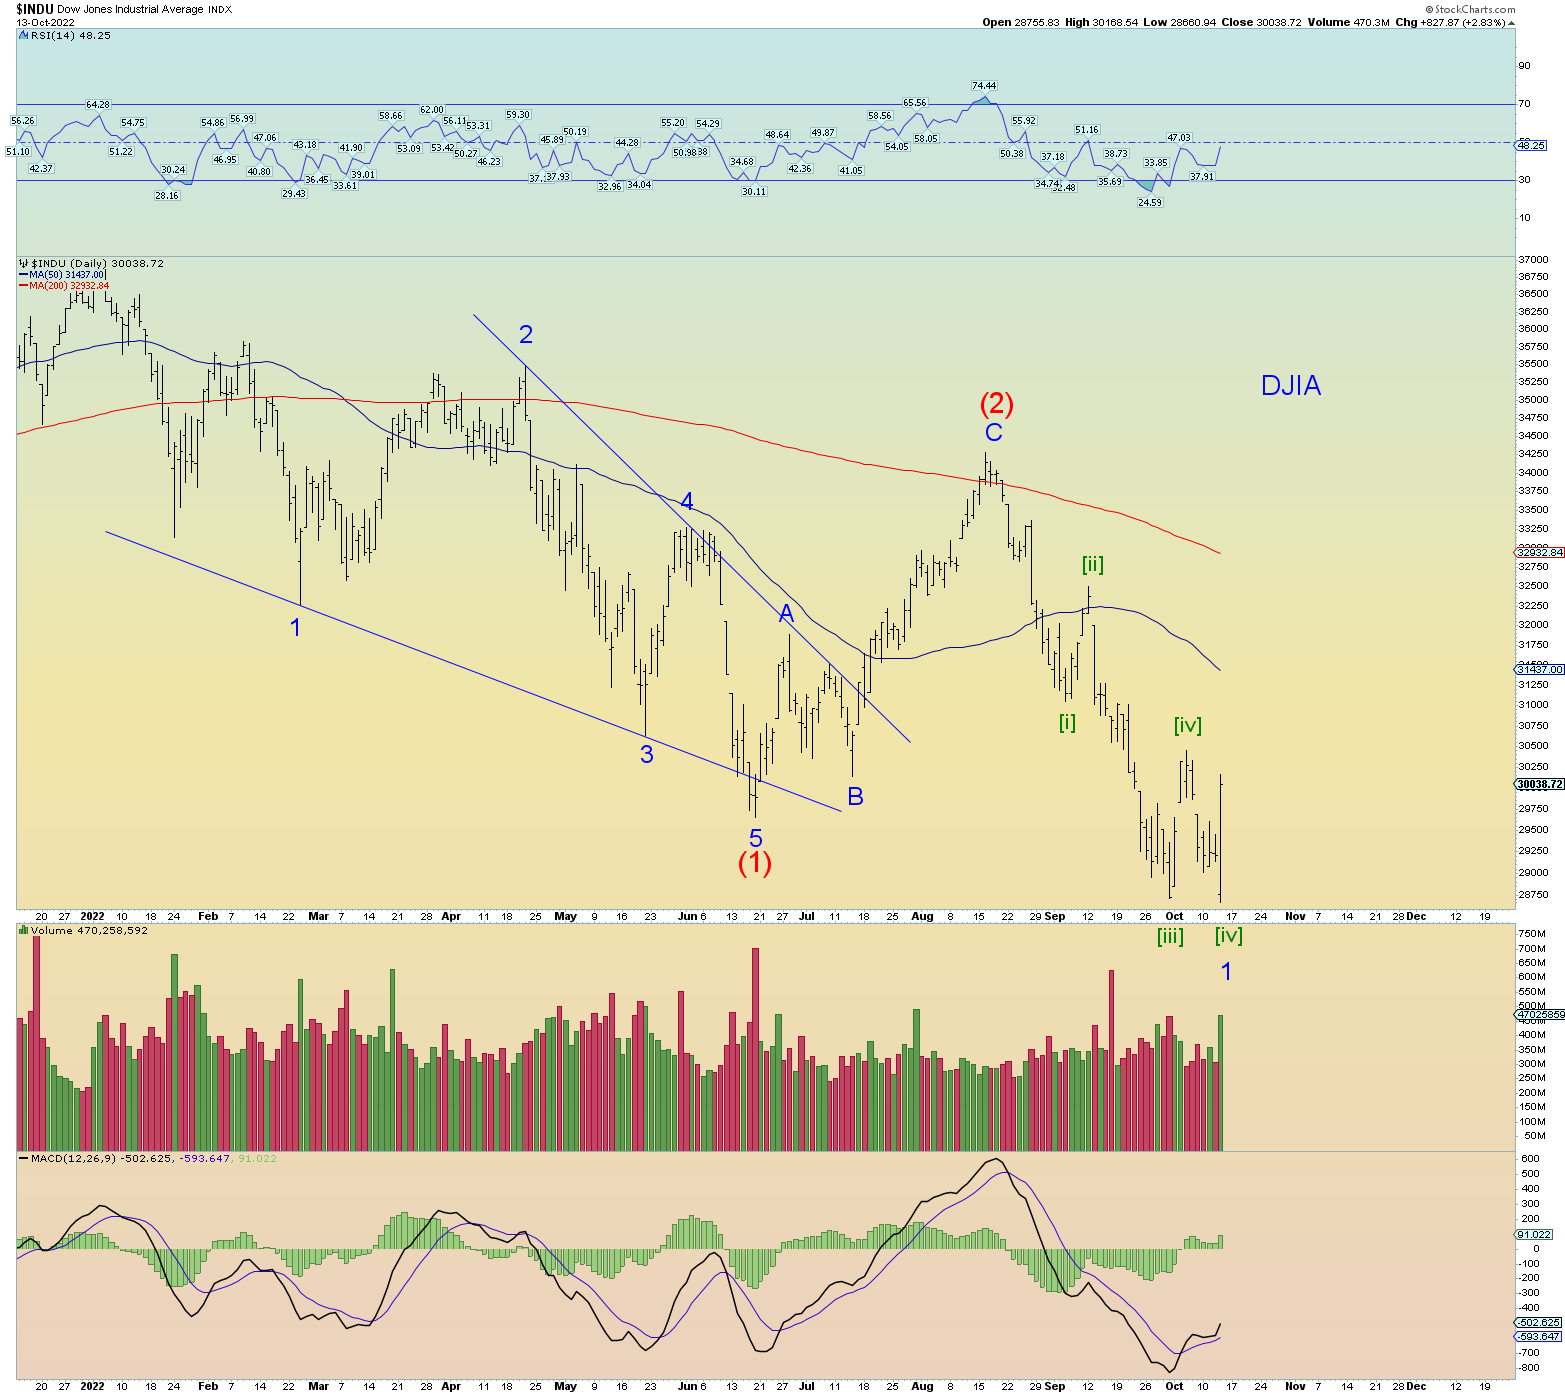
Please note how today’s candle – which is labeled Minor 1 of (3) low – looks identical to the candle of the Minor 1 of (1) low back on February 24th, the day of the Ukrainian/Russian war start.
DJIA made a lower low which confirms 5 waves from (2)
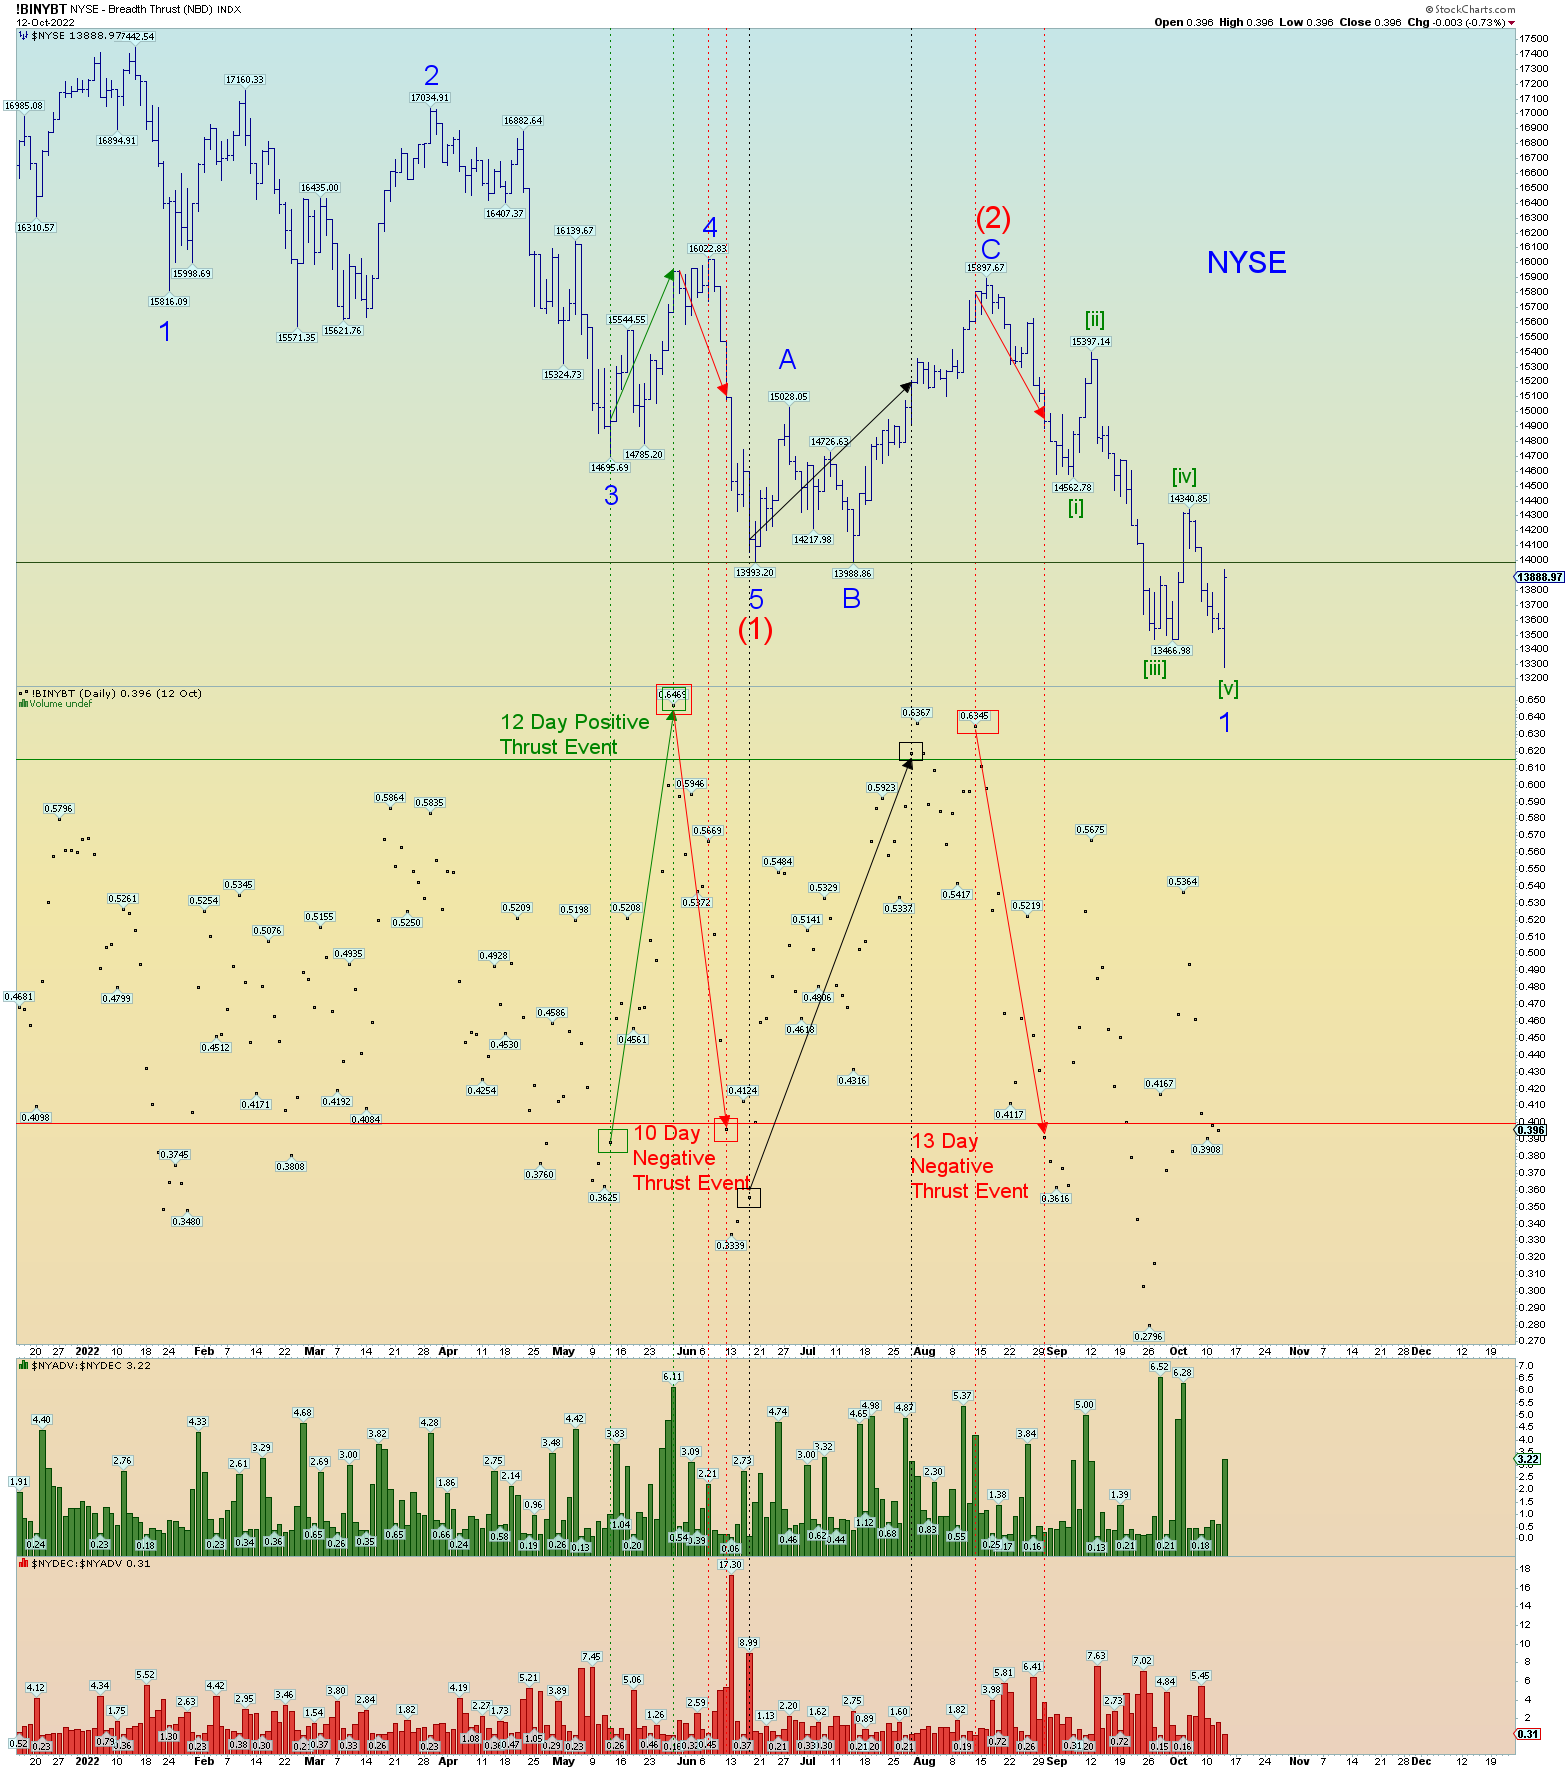
NYSE the same. Very satisfying wave structures and all indices seem to be in agreement…which is bearish for the overall longer-term count even if we get a sharp Minor 2 of (3) bounce.
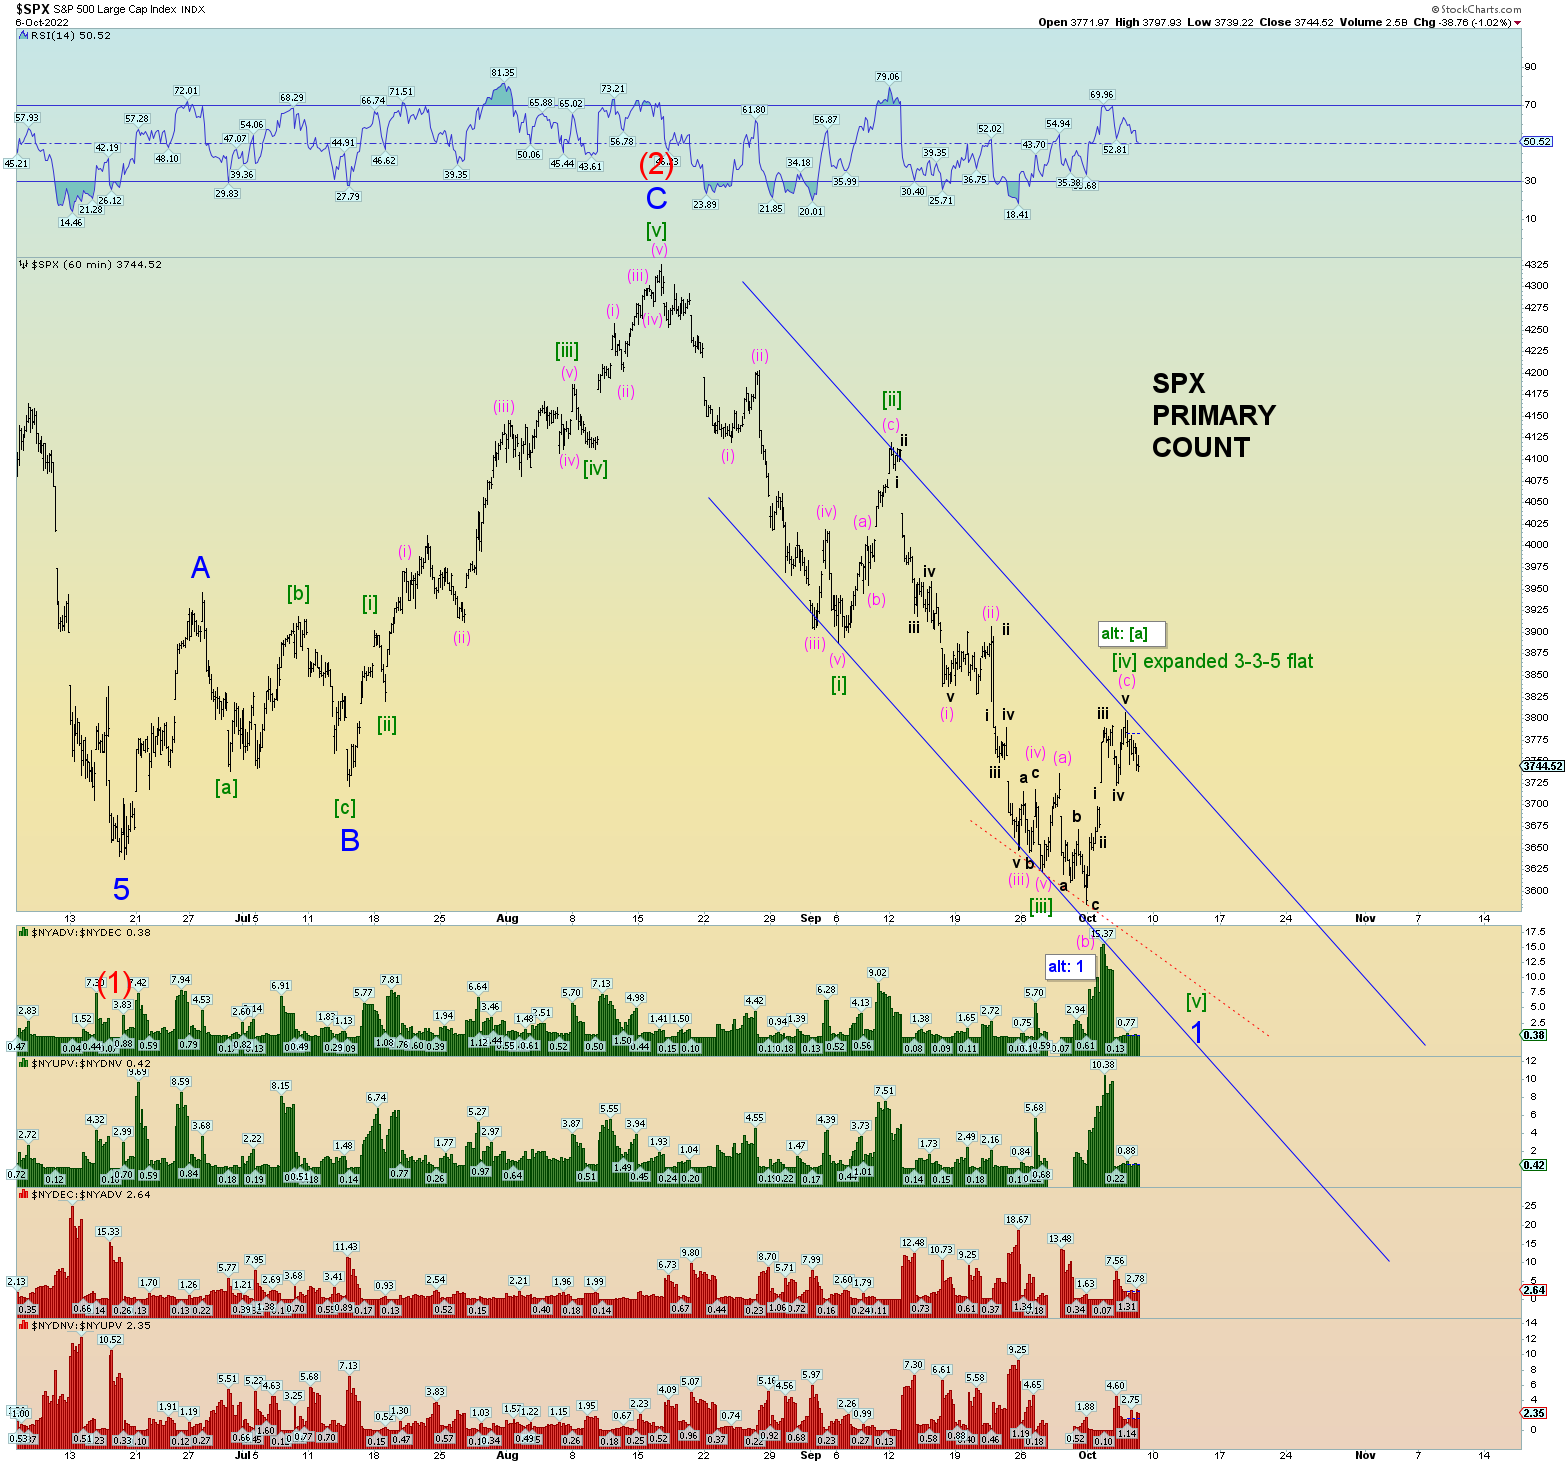
[UPDATE: This is the chart that was shown a week ago complete with dashed-red trendline pointing to the likely Minor 1 low. I’m not sure why I did away with that over the last several days.]