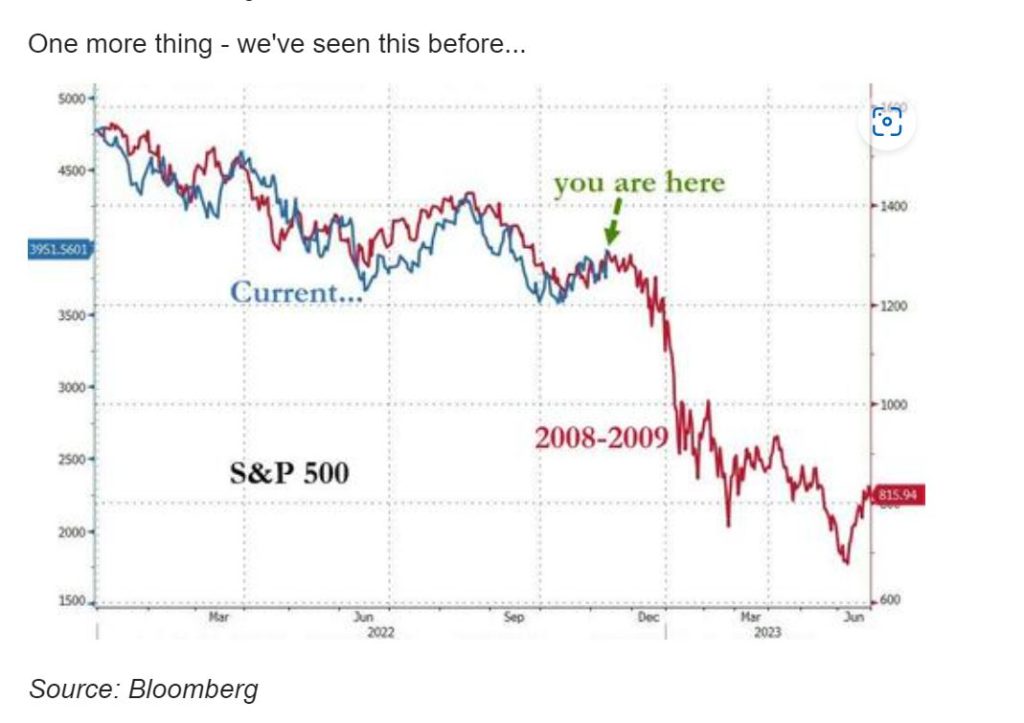
And I agree 100%. This is about where we are…
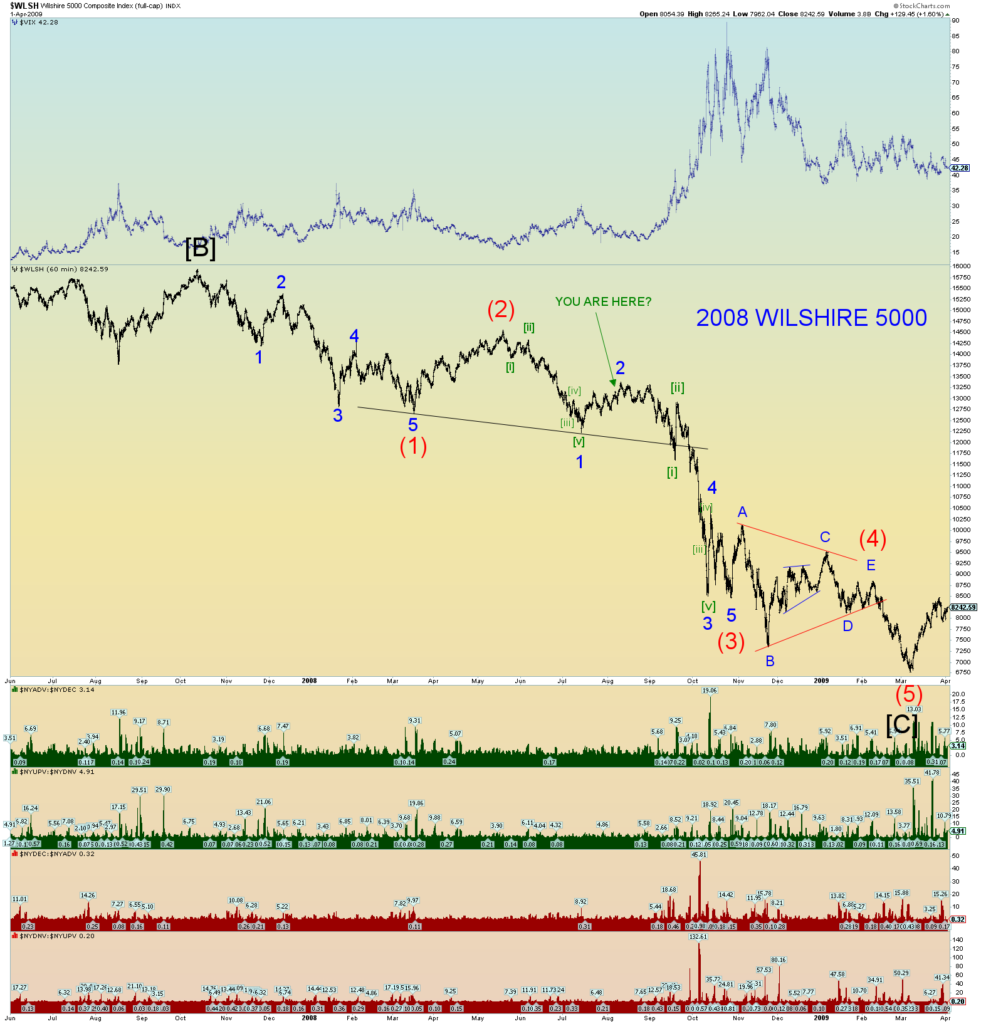
The DJIA is on a differing wave count perhaps than the rest of the market. The entire structure since the early January peak has taken the form of an expanding diagonal triangle. The expected retrace of just such a formation should be very quick and powerful and deep. And that has appeared to be the case as the DJIA has retraced a Fibonacci 61.8% of the drop from January to mid-October in less than a month.
Yet today, despite a 3.7% rise of the DOW, a 5.54% rise of the SPX and a 7.35% rise of the NASDAQ, the NYSE up volume ratio was a somewhat unimpressive 5.4 to 1. Yes, a solid 80%+ up volume day but for a 1200-point DJIA rise, it seems a LOT of selling is going on underneath.
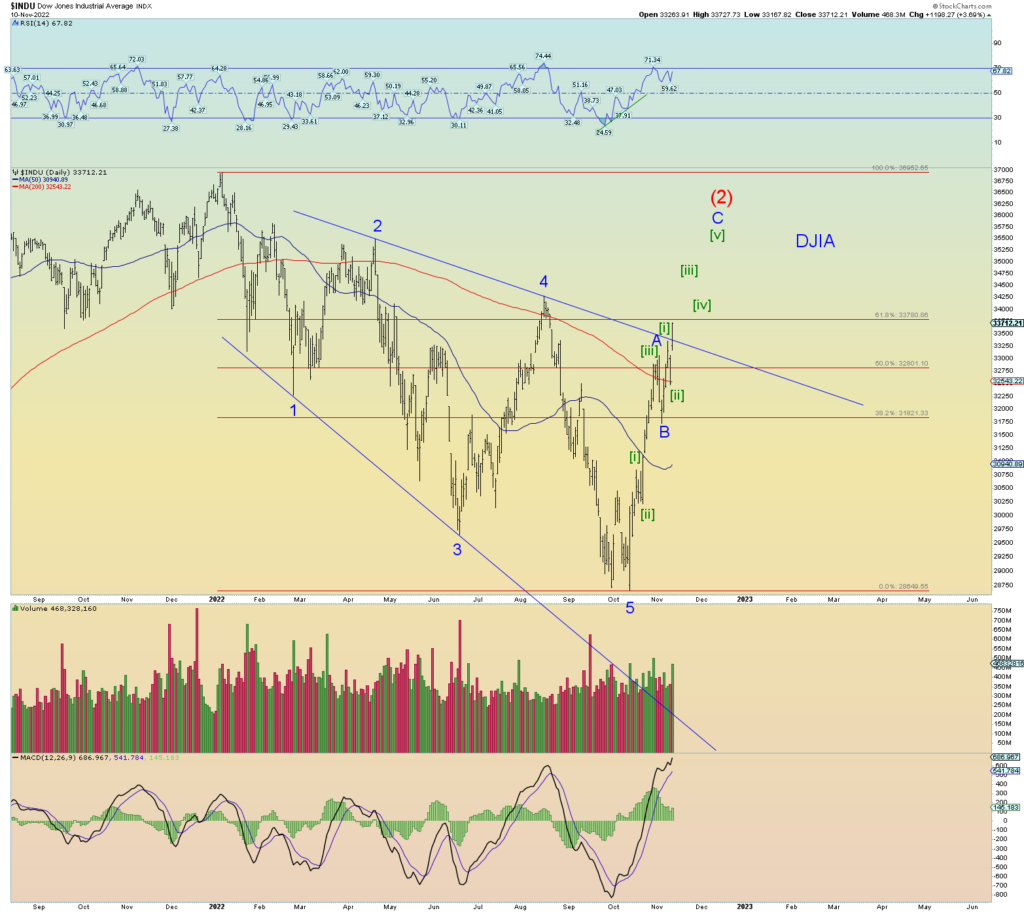
The disparity (so far) between the DJIA and the S&P500 (and Wilshire 5000) and particularly the Nasdaq Composite is stunning.
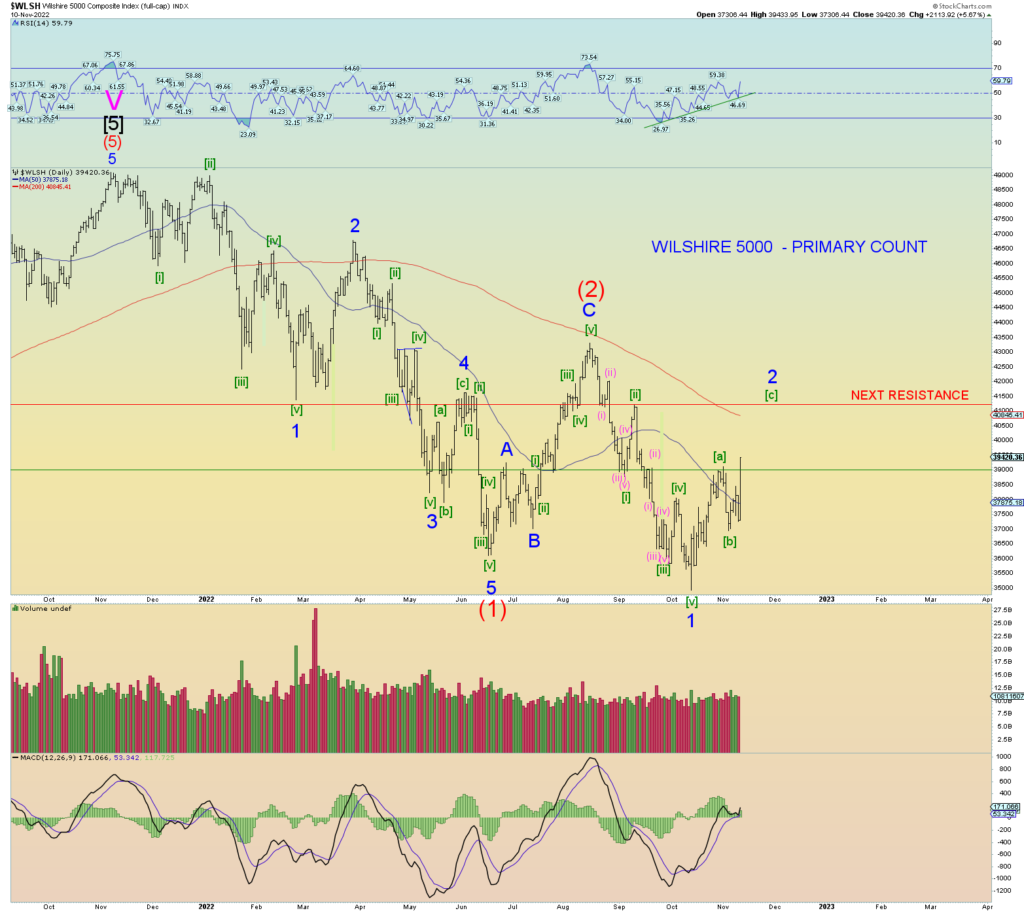
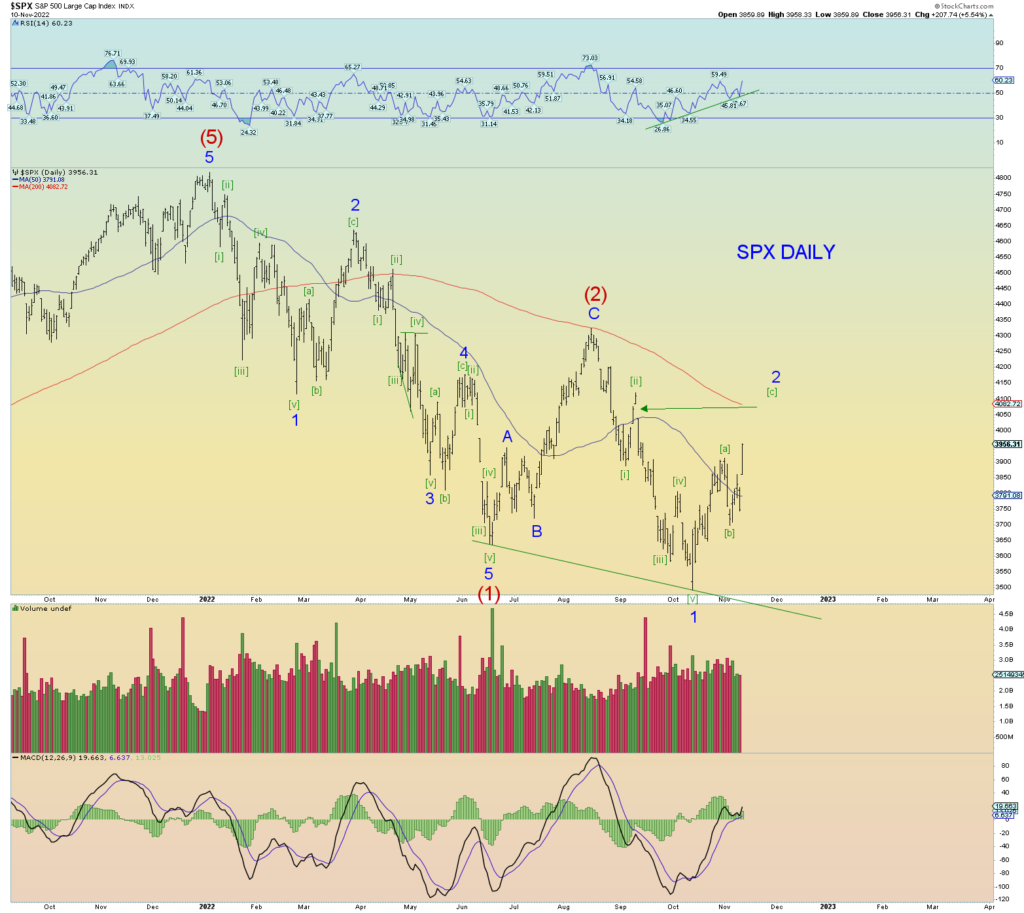
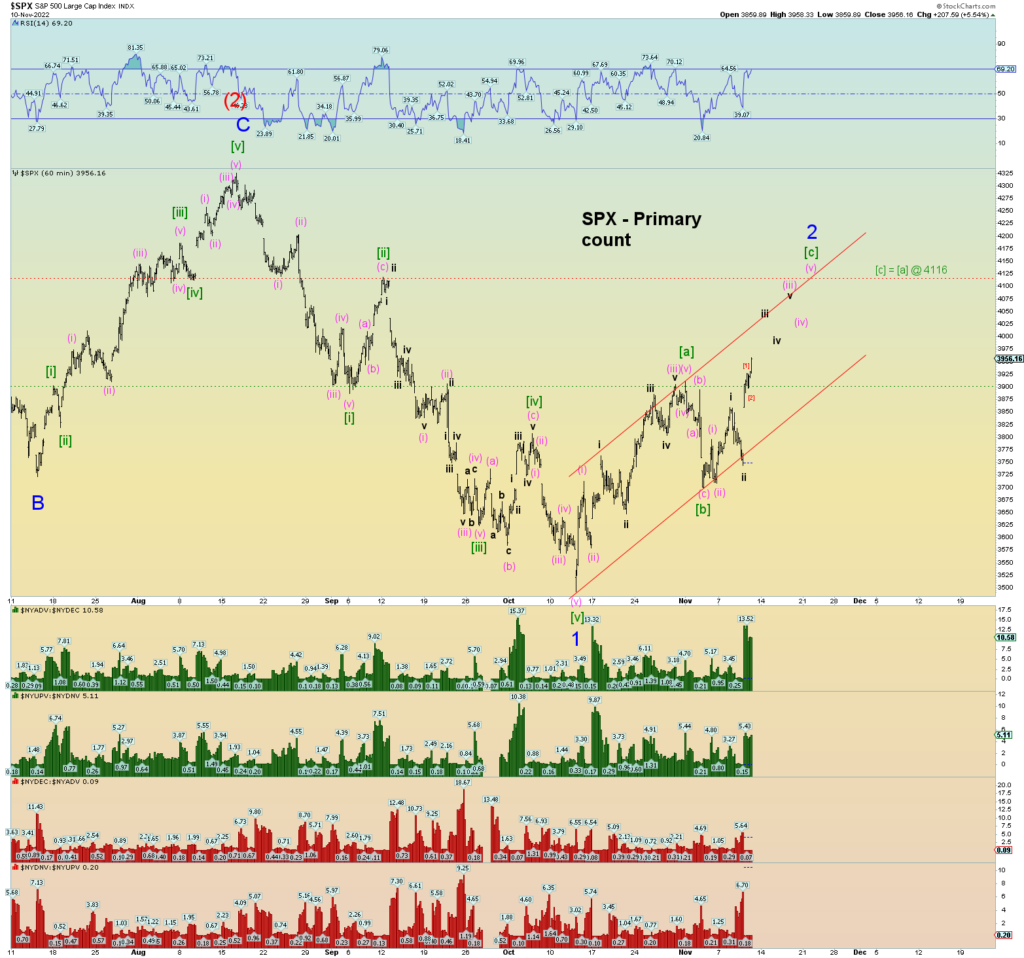
The count has been adjusted and simplified. Minor 2 of (3) down is counted as a 5-3-5 zigzag. Wave [c] of 2 would equal wave [a] of 2 at about 4116 SPX. That is next resistance. The open SPX gap down and the 200 DMA seems to be a target.
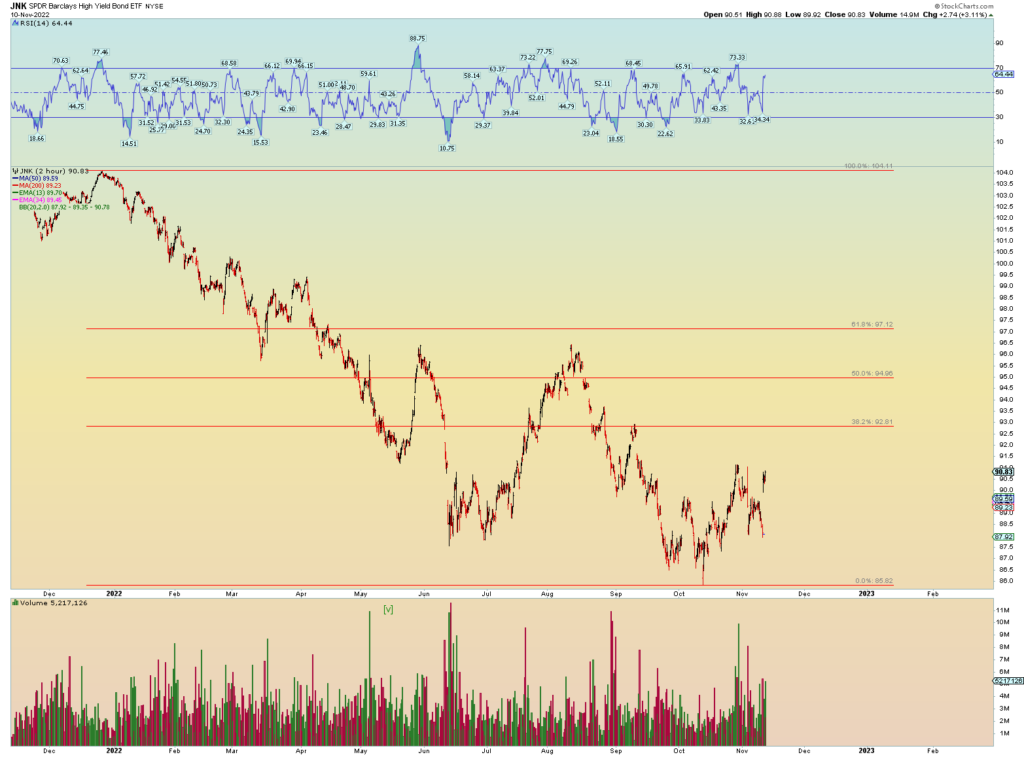
Real risk taking is lagging. This is JUNK bonds.
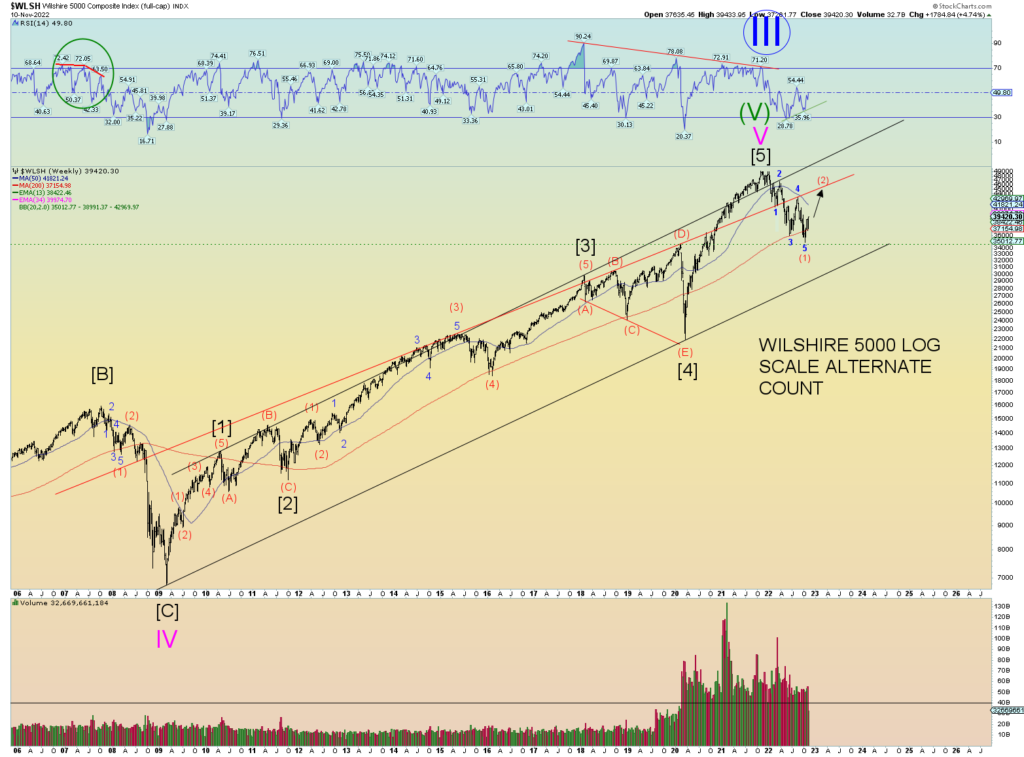
The top medium term alternate count is shown on the weekly. This is another test of the trendline as shown and a “fulfillment” of positive divergence of the weekly RSI. An amount of retrace of this much on the Wilshire and SPX almost suggests the DJIA may come close to achieving new all-time highs.
Still too early but I am throwing this out here (yet again) as something to consider.
